Abstract
Coinage metal nanoparticles (NPs) are well-known for the phenomenon of localized surface plasmon resonance (LSPR), which is widely utilized for enhanced sensing and detection. LSPR stability over time is an important issue for the practical application of nanoparticle matrices. Some metals, and copper among those, are chemically reactive in ambient atmospheric conditions that leads to degradation of plasmonic functionality. This work reports on the formation of Cu NP matrices utilizing magnetron-sputtering gas-phase aggregation, size-selection and soft-landing on a substrate. This method provides monocrystalline NPs with high purity, thus, improving chemical inertness towards ambient gases, for example, oxygen. Additionally, a simple approach of UV-ozone treatment is shown to form an oxide shell protecting the metallic core against reactions with environmental species and stabilizing the plasmonic properties for a period of over 150 days. The suggested methodology is promising to improve the competitiveness of Cu nano-matrices with those of Au and Ag in plasmonic sensing and detection.
1. Introduction
The phenomenon of localized surface plasmon resonance (LSPR) known for metal nanoparticles (NPs) is widely applied in optoelectronics, photovoltaics and especially in sensing [1,2,3]. Gold and silver nanostructures are the most frequently used providing a strong resonance response in the visible spectral interval [4,5]. While gold structures are very chemically stable and have a good ability for surface functionalization, silver ones have some limitations. For instance, they cannot be used for sensing of certain bio-objects due to the bactericidal effect. Also, time-stability of plasmonic properties is shorter compared to gold due to possible reactions with ambient atmosphere species, for instance, sulfur even in trace amounts [6,7]. One more disadvantage of both metals is their relatively high cost.
Compared to gold and silver, copper could be a good candidate for nanoscale platforms because its nanostructures can provide intense plasmonic bands in the visible spectrum and it is a less expensive material [8,9]. However, Cu NPs are prone to oxidation in the ambient atmosphere yielding predominantly Cu2O (Cu(I) oxide) at room temperature; CuO (Cu(II) oxide) is typically formed under special conditions, for example, at elevated temperatures and high pressure [10,11]. Recent studies have shown that a double shell layer consisting of both oxides can form [12]. Crystalline characteristics were found to be an important factor affecting the oxidation process; polycrystalline particles/films or ones with a high level of structural defects and/or impurities are less stable against chemical reactions [13,14]. Therefore, the methods allowing to make particles with high purity and perfect crystallinity would be better candidates for nanostructures with stable functional properties. Forming of such pure and perfect NPs would also facilitate the studies of oxidation dynamics.
The nanoparticle/nanocluster gas-phase aggregation in a vacuum is among such approaches providing a number of advantages [15,16,17]. In particular, cluster sources enable very good control of composition because ultra-pure targets are used and the particles are formed in a vacuum. The aggregation conditions promote the formation of monocrystalline NPs. Another benefit is the possibility to tune the mean NP size by adjusting the aggregation parameters. Adding mass-filtering systems brings a capability of even more precise mass/size selection. By tuning the cluster beam flux and deposition time, NP surface coverage/density can be easily controlled, facilitating the formation of the nanoscale matrices with the required parameters.
Long-term stability of functional (plasmonic) properties has been shown for silver NPs produced by the gas aggregation magnetron sputtering [18,19]. In those experiments, the LSPR stability was found to be at least 70–80 days in ambient conditions for NPs with mean diameters of 13 and 28 nm. With a decrease of the particle size to ca. 7 nm, the LSPR damping was observed on a shorter time scale indicating that chemical reactions with atmospheric species lead to gradual degradation of the metallic core responsible for the plasmonic behavior. Similar tendencies were found for the gas-aggregated copper NPs; for sizes of 18–20 nm, the LSPR band was preserved for at least 3 months, while for sizes of 10–13 nm, the band was quenched after ca. 70 days in the ambient atmosphere due to oxidation of the metallic core [20]. A common procedure to protect metallic surfaces is coating [21]. One of the easy and efficient methods is UV-ozone treatment, which was found to provide the formation of thin Cu(I) oxide layers over Cu films [22,23]. Recently, the ozonation has been tested by us on Cu NPs showing the rapid formation of an oxide shell protecting the metallic core against further gradual oxidation of the NPs kept in ambient conditions [20].
In the current work, we continue to study the plasmonic time-stability of size-selected Cu NPs produced by gas-phase aggregation magnetron sputtering. We focus on the investigations of relatively large NPs (19 and 24 nm in diameter) and provide the data on the evolution of the chemical composition and plasmonic resonance for a period of up to 5 months.
2. Materials and Methods
Gas-phase synthesis of copper NPs was performed using Magnetron Sputtering Cluster Apparatus, MaSCA. In a commercial nanocluster source (NC200U from Oxford Applied Research), copper atoms were sputtered from pure (99.99%) target by argon plasma, aggregated into clusters with the help of helium gas and then collimated into a beam. The beam entered an electrostatic quadrupole mass selector (EQMS) allowing size-selection of NPs by deflection according to the mass/charge (m/q) ratio in an electrostatic field. Varying the electrostatic potential difference between the EQMS electrodes allowed to tune the mass/size of the NPs, which were then deposited in a soft-landing regime on a substrate (quartz or silicon, in this work, depending on the following characterization method). More details about MaSCA and EQMS can be found elsewhere [24,25].
In the current experiments, the particles were filtered with two different voltages (700 and 1300 V). After the deposition, the NP sizes were studied using atomic force microscopy (AFM). These measurements were carried out in a tapping mode utilizing Nanolaboratory Ntegra-Aura (from NT-MDT). Commercial Si cantilevers with a tip curvature radius of ≤10 nm were used.
Two sets of samples for every filtering voltage (particular NP size) were made. For the particular NP size, one set was always kept in an ambient atmosphere at room temperature. Samples of the second set were treated in a UV-ozone laboratory cleaner (from Bioforce Nanosciences, Ames, IA, USA) directly after taking them from the deposition chamber. The treatment was carried out utilizing a standard procedure (placement of the sample inside the cleaner) for 20 min. Absorption of UV-light at wavelengths of 184.9 nm by oxygen molecules is known to promote ozone formation, while the light at 253.7 nm leads to decomposition of ozone yielding atomic oxygen. Both ozone and atomic oxygen are strong oxidation agents. Our earlier studies allowed concluding that such treatment leaded to a thin oxide shell (predominantly of Cu(II) oxide) formation around the metallic core [20]. After the treatment, the samples were kept in the same conditions as those of the first set.
The composition of the Cu NPs deposited on silicon substrate was analyzed by X-ray photoelectron spectroscopy (XPS) together with Auger Electron Spectroscopy (AES) using a system from SPECS equipped with Phoibos 150 hemispherical analyzer, one-dimensional delay-line detector and monochromatic X-ray source. The spectra were recorded with Al X-rays (1486.6 eV) at a fixed pass energy of 50 eV in the analyzer ensuring a high transmission and providing sensitivity for the identification of small spectral shifts of the peaks of interest; Cu2p3/2, Cu2p1/2 and satellites as well as Cu and Cu oxide Auger peaks.
The double-beam optical spectrophotometer Lambda 1050 UV/VIS/NIR (from Perkin Elmer) was employed to measure the transmission spectra of Cu NPs deposited on quartz substrates in the wavelength interval of 350–800 nm. These spectra were then converted into relative extinction (RE) ones:
where Ts is the transmittance (in %) of the substrate with deposited NPs and Tq is the transmittance of the bare quartz substrate. For all samples, the measurements were carried out directly after the NP deposition and taking the samples out of MaSCA (reference spectra for the first set, untreated NPs). The spectra obtained after the UV-ozone treatment were considered as reference ones for the second set. Thereafter, the spectra for both sets were measured each 3–4 days for approximately 5 months. On each day and each sample, the measurements were repeated 3–4 times. The standard deviation of the resonance wavelength was found to be below 1 nm.
RE = (100% − Ts) − (100% − Tq),
3. Results and Discussion
3.1. AFM Characterization of Deposited NPs
As found earlier, the NPs formed by MaSCA can carry various (one-, two-, three- or higher) electron charges [24]. Singly-charged NPs dominate in the beam, but small fractions of multiply-charged clusters are also present. Therefore, after filtering at a certain potential applied to EQMS electrodes, NPs of the same m/q ratio but different masses (m/1q, 2m/2q, 3m/3q, etc.), i.e., different sizes, are found on a substrate. A typical AFM topography image of filtered NPs is shown in Figure 1.
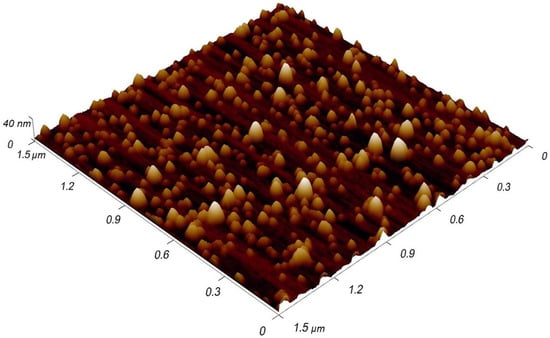
Figure 1.
AFM image of size-filtered Cu NPs deposited on Si substrate.
In Figure 2, one can see the size distributions for two different filtering voltages used in these experiments. The most abundant sizes correspond to singly-charged NPs, while Gaussian distributions of doubly and triply-charged NPs are also present. They correspond to , where h is the height of the most abundant singly-charged NPs. From the histograms, we can conclude that for the first filtering voltage (panel (a)) the most abundant height is 19.0 ± 2.0 nm, while for the second one (panel (b)) it is 24.3 ± 1.8 nm. The total number of analyzed particles was 1050 and 290, respectively. Further in the text, these NPs are called 19 and 24 nm, respectively.
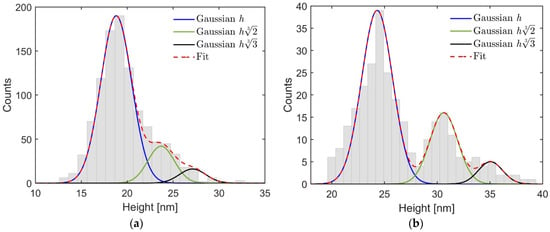
Figure 2.
Cluster heights obtained by AFM for filtering at (a) low and (b) high potentials applied to EQMS. Gaussian distributions for the most abundant height h, corresponding to singly-charged particles, and those , corresponding to doubly- and triply-charged particles, respectively, are present together with the overall one denoted as fit.
3.2. Evolution of X-ray Photoelectron and Auger Spectra with Time
Time evolution of the chemical composition of both the untreated and UV-ozone exposed copper NPs are studied using XPS and Auger spectroscopy. The tendencies for the 19 and 24 nm NPs are found to be very similar. Therefore, we discuss only the spectra obtained for smaller, 19 nm particles. In Figure 3, the spectra of the sample with untreated NPs kept in ambient air are presented for different periods after the deposition.
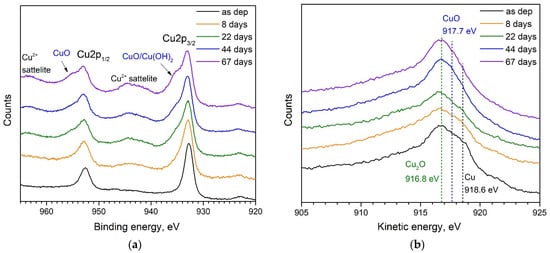
Figure 3.
Time evolution of (a) XPS and (b) AES spectra of Cu NPs kept in ambient conditions. Characteristic peaks related to Cu2p3/2 and Cu2p1/2 states, Cu2+ satellites as well as bands related to Cu(OH)2 and Cu(II) oxide are indicated in panel (a). Vertical dashed lines in panel (b) show the energies for Cu(I) and Cu(II) oxides as well as for metallic Cu.
For the as-deposited NPs (Figure 3a), two characteristic peaks at 932.6 eV and 952.4 eV are assigned to Cu2p3/2 and Cu2p1/2 states, respectively. Cu2p3/2 peak could be used for the identification of metallic Cu. However, Cu2O has nearly the same binding energy of 932.4 eV [26,27], thus, it is impossible to resolve the contributions of metallic Cu and Cu(I) oxide in the XPS spectra. However, from the AES presented in Figure 3b, one can see a peak at 916.8 eV indicating the presence of Cu(I) oxide and a shoulder near 918.6 eV, which is the kinetic energy corresponding to metallic Cu [26]. Thus, we can conclude about some oxidation of Cu NPs during short-term (ca. 20–30 min) exposure to the ambient air which is required to transfer the sample from the deposition chamber to the XPS/AES one. Keeping the sample in an ambient atmosphere for a longer time leads to the evolution of the spectra, which can be seen in Figure 3. It is known from the literature [27,28], that the appearance of shoulders at 934.7 and 954.5 eV in the XPS spectra can be assigned to copper dihydroxide, Cu(OH)2, and Cu(II) oxide, respectively. The weak satellite bands of Cu2+ at around 941 and 963 eV, increasing in intensity with time, are also typical for Cu(II) oxide formation [27]. Thus, observing the changes presented in Figure 3a one can conclude about gradual oxidation of the NPs in ambient conditions on the time scale indicated in the panel. This conclusion is also supported by the Auger spectra (Figure 3b) showing a gradual increase of Cu(II) oxide signal and elimination of Cu peak. The oxidation goes at the expense of metallic copper and the increasing oxide shell thickness gradually shields the core finally disabling the registration of Cu because the analysis depth for XPS/AES is only around 2 nm.
XPS and AES spectra of ozonated Cu NPs presented in Figure 4 look very different from those shown in Figure 3 for the untreated ones. During the UV-ozone treatment, the mixture of atomic oxygen and ozone leads to intensive oxidation of the Cu NPs. Our previous study revealed the formation of about a 2–3 nm thick shell with a predominant contribution of CuO [20]. This number agrees well with the experiments on UV-ozone treatment of thin Cu films, where the oxide thickness was found to be ca. 2.5 nm for 20 min of ozonation [23]. Predominant growth of CuO is also the case for the current experiment as follows from the spectra presented in Figure 4a, which show strong peaks assigned to CuO and Cu2+ satellites. However, AES spectra in Figure 4b also indicate some contribution of Cu2O. Unfortunately, it is hardly possible to give a quantitative ratio of Cu(II)/Cu(I) oxides in the entire shell due to the depth limit of the XPS method. We are not able to see the shell composition below ca. 2 nm beneath the surface. Analyzing the spectra obtained at different times and presented in both panels of Figure 4, we can conclude that there are no considerable changes, i.e., the chemical composition of the outer part of the shell is stable. Thus, the oxide shell formed by ozonation serves as a protective coating for the core, which remains metallic as follows from the optical measurements presented in the next section.
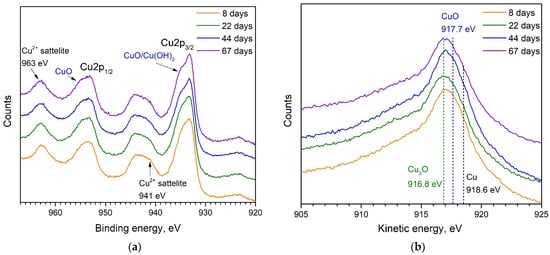
Figure 4.
Time evolution of (a) XPS and (b) AES spectra of UV-ozone treated Cu NPs, which are then kept in ambient conditions. Indications of different characteristic peaks are the same as in Figure 3.
3.3. Extinction Spectra of NPs
Time evolution of the plasmonic properties of Cu NPs exposed to ambient air is studied considering the plasmonic resonance wavelength extrapolated from the extinction spectra. For this purpose, spectra measured from each set of samples on a few selected days after the deposition are presented in Figure 5. Change of plasmonic bands of untreated Cu NPs (panels (a) and (b)) and ozonated Cu NPs (panels (c) and (d)) can be seen.
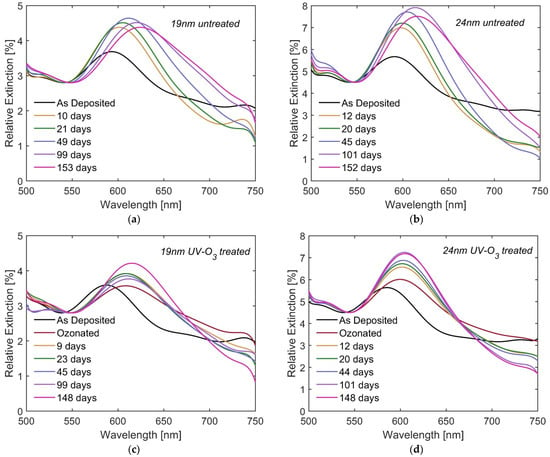
Figure 5.
Relative extinction spectra of untreated (a) 19 nm and (b) 24 nm NPs as well as UV-ozone treated (c) 19 nm and (d) 24 nm NPs measured at selected days after the deposition. Both untreated and treated samples were kept in ambient atmosphere at room temperature between the measurements.
For the untreated NPs, the intensity of the plasmonic bands gradually increases reaching a maximum after approximately 50 days for 19 nm NPs and 100 days for 24 nm ones (see Figure 5a,b). Then a slight decrease is observed. The resonance wavelength experiences a redshift with time, reaching values of 616 and 623 nm after 5 months for 19 and 24 nm NPs, respectively. On the other hand, the ozonation leads to an abrupt and significant redshift to the values of 608 and 600 nm for 19 and 24 nm NPs, respectively (see Figure 5c,d). Thereafter, the band intensity gradually increases but the resonance wavelength changes insignificantly (increases slightly). To better understand the time evolution of the plasmonic bands and the reasons for that, the relative shift of the LSPR wavelength (with respect to the reference spectra), ∆λ, is plotted versus time, t, in Figure 6.
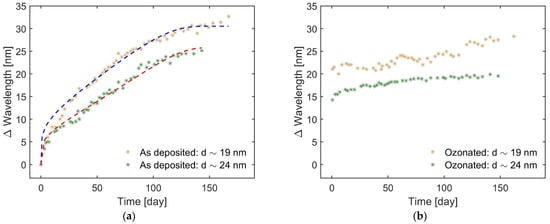
Figure 6.
Time evolution of the resonance wavelength for (a) untreated and (b) UV-ozone treated Cu NPs. Dashed lines in (a) show the fits according to the model presented in the text. The linear regression coefficient R2 is calculated to be 0.97 and 0.98 for 19 nm and 24 nm NPs, respectively.
A gradual redshift of the resonance wavelength presented in Figure 6a correlates well with the gradual oxidation of the NPs in ambient air observed from the XPS/AES spectra. The formation of Cu(I) and then Cu(II) oxides increases the dielectric constant of the medium surrounding the NPs, εm. Before the oxidation, we should weigh the contributions of air with ε ≈ 1 and quartz substrate with ε = 3.8 to form the so-called effective medium constant εm [29]. However, after oxidation, the air contribution becomes minor, while the contribution of the oxides, which have high ε (7.6 for Cu2O and 18 for CuO [30]), dominates. εm significantly increases, thus, leading to the change of resonance conditions according to the analytical expression for the extinction cross section [31]:
where r is the particle radius and εCu is the dielectric function of Cu. An increase of εm in the denominator affects the Fröhlich’s condition, Re[εCu] = −2εm, leading to a shift of the resonance to a longer wavelength [31].
To analyze the time-dependence presented in Figure 6a, we used the model developed for a metal NP with a dielectric shell suggested in [32]. The LSPR wavelength shift can be calculated as a function of the shell thickness d using the following equation
where Δλmax is the maximal observed shift and l is the characteristic decay length of the electromagnetic field generated in the plasmon resonance (10 nm in our calculations). To estimate the shell thickness, the classical theory of metal oxidation developed by Cabrera and Mott [33] is used. According to this theory, which is supported by numerous experimental cases, the metal oxide follows a logarithmic growth law vs time
where dc is the critical thickness at which the oxide growth stops or nearly stops at room temperature (good approximation is 10 nm [33]) and A is the constant proportional to the energy of Cu cation formation and activation energy of its diffusion through the already formed oxide layer towards the surface to form Cu2O. Combining Equations (3) and (4) provides a good agreement of the fits with the experimental data as shown in Figure 6a.
For the UV-ozone treated NPs, we cannot apply the same model approach. Relying on the XPS and AES data, it is suggested that the rapidly formed oxide shell, predominantly consisting of CuO, largely blocks the possibility of following oxidation in ambient conditions, which typically happens through the formation of another oxide, Cu2O. Hence, a small increase of Δλ, seen in Figure 6b, can be explained by the significantly slowed-down oxidation process, i.e., by only a very small increase in the shell thickness.
Thus, the obtained results reveal an evolution of plasmonic properties of untreated Cu NPs for a period of approximately 5 months, indicating both a gradual change of the band intensity and a continuous redshift of the resonance wavelength. On the other hand, the initial formation of the oxide phase induced by the UV-ozone treatment efficiently improves the stability of resonance wavelength over a period of at least 5 months.
4. Conclusions
The evolution of chemical composition and plasmonic properties of copper NPs produced by the gas-phase cluster aggregation method and deposited on substrates are systematically studied over a period of approximately 5 months. It is found that the NPs kept in ambient atmospheric conditions at room temperature undergo gradual oxidation with the predominant formation of Cu(I) oxide. With time, the indications for the presence of Cu(II) oxide and copper dihydroxide are also observed in XPS and AES spectra allowing to suggest a conversion of Cu(I) oxide into Cu(II) one. These oxidation dynamics agrees well with the literature. The oxidation affects the plasmonic properties in a way that the resonance frequency experiences gradual redshift, while the intensity increases, reaches saturation and then starts slightly decreasing. The evolution of the redshift is found to follow well the model accounting growth of the oxide phase according to the metal oxidation theory proposed by Cabrera and Mott [33]. The plasmonic bands are found to be still strong 150–160 days after the deposition for both mean particle sizes of 19 and 24 nm used in the experiments indicating that the metallic cores are preserved despite the oxidation.
A UV-ozone treatment of the NPs directly after the deposition causes the formation of oxide shells with a predominant contribution of Cu(II) oxide. These shells protect the NPs against the following oxidation when they are kept in an ambient atmosphere. The plasmonic properties are much more stable over time compared to the untreated NPs. The band intensity increases reaching saturation after ca. 40–60 days. Thereafter, small fluctuations are observed with no considerable decrease. The resonance wavelength shows a very small (a few nm) redshift. Thus, a UV-ozone treatment can be used as a simple method to stabilize and preserve plasmonic properties of Cu NPs over several months period facilitating commercial applications for plasmonic-enhanced detection and sensing. However, additional studies are required to test the UV-ozone treated Cu NPs in particular plasmonic-based methods, such as surface enhanced Raman spectroscopy or photovoltaics.
Author Contributions
Conceptualization, V.N.P.; methodology, F.Z. and V.N.P.; investigation, F.Z. and A.M.; writing—original draft preparation, F.Z. and V.N.P.; writing—review and editing, F.Z., A.M. and V.N.P.; visualization, F.Z. and V.N.P.; supervision, V.N.P. All authors have read and agreed to the published version of the manuscript.
Funding
This research received no external funding.
Conflicts of Interest
The authors declare no conflict of interest.
References
- Murray, W.A.; Barnes, W.L. Plasmonic Materials. Adv. Mater. 2007, 19, 3771–3782. [Google Scholar] [CrossRef]
- Stratakis, E.; Kymakis, E. Nanoparticle-Based Plasmonic Organic Photovoltaic Devices. Mater. Today 2013, 16, 133–146. [Google Scholar] [CrossRef]
- Langer, J.; Novikov, S.M.; Liz-Marzán, L.M. Sensing Using Plasmonic Nanostructures and Nanoparticles. Nanotechnology 2015, 26, 322001. [Google Scholar] [CrossRef]
- Amendola, V.; Pilot, R.; Frasconi, M.; Maragò, O.M.; Iatì, M.A. Surface Plasmon Resonance in Gold Nanoparticles: A Review. J. Phys. Condens. Matter 2017, 29, 203002. [Google Scholar] [CrossRef]
- Rycenga, M.; Cobley, C.M.; Zeng, J.; Li, W.; Moran, C.H.; Zhang, Q.; Qin, D.; Xia, Y. Controlling the Synthesis and Assembly of Silver Nanostructures for Plasmonic Applications. Chem. Rev. 2011, 111, 3669–3712. [Google Scholar] [CrossRef]
- Cao, W.; Elsayed-Ali, H.E. Stability of Ag Nanoparticles Fabricated by Electron Beam Lithography. Mater. Lett. 2009, 63, 2263–2266. [Google Scholar] [CrossRef]
- Scuderi, M.; Esposito, M.; Todisco, F.; Simeone, D.; Tarantini, I.; De Marco, L.; De Giorgi, M.; Nicotra, G.; Carbone, L.; Sanvitto, D.; et al. Nanoscale Study of the Tarnishing Process in Electron Beam Lithography-Fabricated Silver Nanoparticles for Plasmonic Applications. J. Phys. Chem. C 2016, 120, 24314–24323. [Google Scholar] [CrossRef]
- Chan, G.H.; Zhao, J.; Hicks, E.M.; Schatz, G.C.; Van Duyne, R.P. Plasmonic Properties of Copper Nanoparticles Fabricated by Nanosphere Lithography. Nano Lett. 2007, 7, 1947–1952. [Google Scholar] [CrossRef]
- Stebunov, Y.V.; Yakubovsky, D.I.; Fedyanin, D.Y.; Arsenin, A.V.; Volkov, V.S. Superior Sensitivity of Copper-Based Plasmonic Biosensors. Langmuir 2018, 34, 4681–4687. [Google Scholar] [CrossRef]
- Gattinoni, C.; Michaelides, A. Atomistic Details of Oxide Surfaces and Surface Oxidation: The Example of Copper and Its Oxides. Surf. Sci. Rep. 2015, 70, 424–447. [Google Scholar] [CrossRef]
- Kim, J.H.; Ehrman, S.H.; Germer, T.A. Influence of Particle Oxide Coating on Light Scattering by Submicron Metal Particles on Silicon Wafers. Appl. Phys. Lett. 2004, 84, 1278–1280. [Google Scholar] [CrossRef]
- Boyd, R.D.; Pilch, I.; Garbrecht, M.; Halvarsson, M.; Helmersson, U. Double Oxide Shell Layer Formed on a Metal Nanoparticle as Revealed by Aberration Corrected (Scanning) Transmission Electron Microscopy. Mater. Res. Express 2014, 1, 025016. [Google Scholar] [CrossRef][Green Version]
- Platzman, I.; Brener, R.; Haick, H.; Tannenbaum, R. Oxidation of Polycrystalline Copper Thin Films at Ambient Conditions. J. Phys. Chem. C 2008, 112, 1101–1108. [Google Scholar] [CrossRef]
- Leon, J.J.D.; Fryauf, D.M.; Cormia, R.D.; Zhang, M.X.M.; Samuels, K.; Williams, R.S.; Kobayashi, N.P. Reflectometry-Ellipsometry Reveals Thickness, Growth Rate, and Phase Composition in Oxidation of Copper. ACS Appl. Mater. Interfaces 2016, 8, 22337–22344. [Google Scholar] [CrossRef]
- De Heer, W.A. The Physics of Simple Metal Clusters: Experimental Aspects and Simple Models. Rev. Mod. Phys. 1993, 65, 611–676. [Google Scholar] [CrossRef]
- Binns, C. Nanoclusters Deposited on Surfaces. Surf. Sci. Rep. 2001, 44, 1–49. [Google Scholar] [CrossRef]
- Popok, V.N.; Kylián, O. Gas-Phase Synthesis of Functional Nanomaterials. Appl. Nano 2020, 1, 25–58. [Google Scholar] [CrossRef]
- Novikov, S.M.; Popok, V.N.; Evlyukhin, A.B.; Hanif, M.; Morgen, P.; Fiutowski, J.; Beermann, J.; Rubahn, H.-G.; Bozhevolnyi, S.I. Highly Stable Monocrystalline Silver Clusters for Plasmonic Applications. Langmuir 2017, 33, 6062–6070. [Google Scholar] [CrossRef]
- Larsen, M. Stability of Localised Surface Plasmon Resonance of Metal Nanoparticles. Master’s Thesis, Aalborg University, Aalborg, Denmark, 2019. [Google Scholar]
- Popok, V.N.; Novikov, S.M.; Lebedinskij, Y.Y.; Markeev, A.M.; Andreev, A.A.; Trunkin, I.N.; Arsenin, A.V.; Volkov, V.S. Gas-Aggregated Copper Nanoparticles with Long-Term Plasmon Resonance Stability. Plasmonics 2021, 16, 333–340. [Google Scholar] [CrossRef]
- Kim, I.; Kim, Y.; Woo, K.; Ryu, E.H.; Yon, K.Y.; Cao, G.; Moon, J. Synthesis of Oxidation-Resistant Core-Shell Copper Nanoparticles. RSC Adv. 2013, 3, 15169–15177. [Google Scholar] [CrossRef]
- Bok, S.; Lim, G.H.; Lim, B. UV/Ozone Treatment for Adhesion Improvement of Copper/Epoxy Interface. J. Ind. Eng. Chem. 2017, 46, 199–202. [Google Scholar] [CrossRef]
- Solovey, V.R.; Yakubovsky, D.I.; Ermolayev, G.A.; Lebedinskij, Y.Y.; Markeev, A.M.; Voronov, A.A.; Zamboni, F.; Popok, V.N.; Arsenin, A.V.; Volkov, V.S.; et al. UV/Ozone Treatment and Open-Air Copper Plasmonics. J. Phys. Conf. Ser. 2021, 2015, 012148. [Google Scholar] [CrossRef]
- Popok, V.N.; Gurevich, L. Charge States of Size-Selected Silver Nanoparticles Produced by Magnetron Sputtering. J. Nanopart. Res. 2019, 21, 171. [Google Scholar] [CrossRef]
- Hartmann, H.; Popok, V.N.; Barke, I.; Von Oeynhausen, V.; Meiwes-Broer, K.-H. Design and Capabilities of an Experimental Setup Based on Magnetron Sputtering for Formation and Deposition of Size-Selected Metal Clusters on Ultra-Clean Surfaces. Rev. Sci. Instrum. 2012, 83, 073304. [Google Scholar] [CrossRef]
- Poulston, S.; Parlett, P.M.; Stone, P.; Bowker, M. Surface Oxidation and Reduction of CuO and Cu2O Studied Using XPS and XAES. Surf. Interface Anal. 1996, 24, 811–820. [Google Scholar] [CrossRef]
- Biesinger, M.C.; Lau, L.W.M.; Gerson, A.R.; Smart, R.S.C. Resolving Surface Chemical States in XPS Analysis of First Row Transition Metals, Oxides and Hydroxides: Sc, Ti, V, Cu and Zn. Appl. Surf. Sci. 2010, 257, 887–898. [Google Scholar] [CrossRef]
- Susman, M.D.; Feldman, Y.; Bendikov, T.A.; Vaskevich, A.; Rubinstein, I. Real-Time Plasmon Spectroscopy Study of the Solid-State Oxidation and Kirkendall Void Formation in Copper Nanoparticles. Nanoscale 2017, 9, 12573–12589. [Google Scholar] [CrossRef]
- Curry, A.; Nusz, G.; Chilkoti, A.; Wax, A. Substrate Effect on Refractive Index Dependence of Plasmon Resonance for Individual Silver Nanoparticles Observed Using Darkfield Microspectroscopy. Opt. Express 2005, 13, 2668. [Google Scholar] [CrossRef]
- Haynes, W.M.; Lide, D.R.; Bruno, T.J. (Eds.) CRC Handbook of Chemistry and Physics; CRC Press: Boca Raton, FL, USA, 2013. [Google Scholar]
- Maier, S.A. Localised Surface Plasmons. In Plasmonics: Fundamentals and Applications; Springer: New York, NY, USA, 2007; pp. 53–64. [Google Scholar] [CrossRef]
- Malinsky, M.D.; Kelly, K.L.; Schatz, G.C.; Van Duyne, R.P. Chain Length Dependence and Sensing Capabilities of the Localized Surface Plasmon Resonance of Silver Nanoparticles Chemically Modified with Alkanethiol Self-Assembled Monolayers. J. Am. Chem. Soc. 2001, 123, 1471–1482. [Google Scholar] [CrossRef]
- Cabrera, N.; Mott, N.F. Theory of the Oxidation of Metals. Rep. Prog. Phys. 1949, 12, 163–184. [Google Scholar] [CrossRef]
Publisher’s Note: MDPI stays neutral with regard to jurisdictional claims in published maps and institutional affiliations. |
© 2022 by the authors. Licensee MDPI, Basel, Switzerland. This article is an open access article distributed under the terms and conditions of the Creative Commons Attribution (CC BY) license (https://creativecommons.org/licenses/by/4.0/).