1. Introductory
Advances in marine technology have given rise to two major research fields: underwater detection and underwater imaging. In underwater detection, the limited penetration of natural light at depth often necessitates artificial illumination. Current underwater imaging systems typically employ light sources such as LEDs (Light Emitting Diodes), tungsten halogen lamps, and blue-green lasers [
1]. In a study by Qian et al., the white light performance of RGB-LEDs and PC-LEDs was compared under various water conditions [
2]. The RGB-LED white light, driven at 0.43 A, achieved an illuminance of 100 lux at 3 m, demonstrating superior transmission characteristics in water. Nevertheless, both LEDs and tungsten halogen lamps require higher energy densities to support long-range and high-intensity lighting in complex underwater environments.
As light propagates through water, it undergoes scattering due to the aqueous medium and suspended particles. This scattered light superimposes on the reflected signal, generating background noise that degrades image contrast and clarity. Zhang et al. systematically characterized the optical scattering properties of pure water and seawater using a multi-angle light scattering apparatus [
3]. By applying five distinct analytical methods to eliminate scattering contributions from residual nanoparticles, they observed that the depolarization ratio of seawater increases linearly with salinity at a rate between 1 × 10
−4 and 2 × 10
−4. Meanwhile, Michael et al. established a relationship between asymptotic light fields and inherent optical properties based on asymptotic theory [
4]. They derived an analytical expression for
as a polynomial function of
, which is applicable across a range of
values and encompasses various phase functions found in natural particulate fields. In related work, Ilya et al. investigated the propagation and focusing of laser beams in moderately scattering media [
5]. Using a spatial light modulator (SLM), they achieved an 8% increase in the integral intensity of the far-field focal spot and a 16% reduction in its diameter, demonstrating that controlled manipulation of scattered light can significantly improve focusing efficiency. Furthermore, He et al. derived a Fredholm integral equation to model underwater radiance distribution [
6]. Under the assumption of a constant volume scattering function, they developed a numerical iterative method incorporating boundary conditions to obtain high-precision underwater light field distributions. Their experimental results across various environments validated this computational approach, which is applicable to arbitrary light source configurations.
The detrimental effects of water and suspended particles on laser light intensify with transmission distance, making conventional lasers unsuitable for long-range and wide-field underwater observation. Dong et al. [
7] developed an LED-based underwater wireless optical communication system that leverages the advantages of blue-green light, including strong penetration in seawater, high information capacity, high transmission rates, low probability of intercept, anti-jamming capability, and compact receiver design. Their system achieved a bit error rate (BER) of 7.9 × 10
−6 and a communication rate of 5 Mbit/s over a distance of 20 m. Lv et al. designed a blue-green laser imaging system with distance-selective capability, achieving an imaging range approximately six times the attenuation length [
8]. However, the limited color representation of blue-green laser imaging hinders accurate perception of the underwater environment, thus compromising observational effectiveness.
White laser technology has recently emerged as a promising approach for underwater illumination, offering high energy and power tunability that overcome limitations of traditional monochromatic lasers. Liu et al. generated a 0.16 A white laser using RGB laser diodes (RGB-LD) for simultaneous terrestrial–underwater wireless optical communication (UWOC) and efficient solid-state lighting (SSL) [
9]. By incorporating a circular diffuser, the RGB-LD hybrid white light UWOC system achieved a data rate of 6.6 Gbps over an underwater distance of 2.3 m. Jiang et al. compared underwater imaging using RGB white laser, monochromatic laser, and white LED under different conditions [
10]. The 0.22 W white laser produced clearer images at a transmission distance of 15 cm. Despite these advances, the limited effective range of illumination and imaging remains a major constraint on further improving detection performance.
The power-compensated white laser has the advantage of superior luminosity and color temperature when used as an illumination light source for underwater targets. This thesis proposes a theory of power-compensated white laser imaging based on transmission distance. It carries out underwater imaging experiments with a power-compensated white laser light source and a D65 white laser at different light source distances and imaging distances. Furthermore, the underwater image was enhanced through Retinex image enhancement and Lap_fusion recovery processing, with the experimental image signal-to-noise ratio (PSNR) parameters used to analyze the relationship between the two types of white laser light source and the transmission distance. The 0.518 W power-compensated white laser can independently adjust the power of each color at different distances from the light source, allowing for precise control over the transmission distance and light intensity. This versatility, combined with a transmission distance of up to 5 m, makes it a suitable option for underwater imaging. The power-compensated white laser technology shows broad application prospects in areas such as intelligent inspection of underwater infrastructure, marine ecological monitoring and biological behavior research, as well as underwater archaeology and shipwreck cultural studies.
2. Theory of White Laser Imaging Based on Transmission Distance
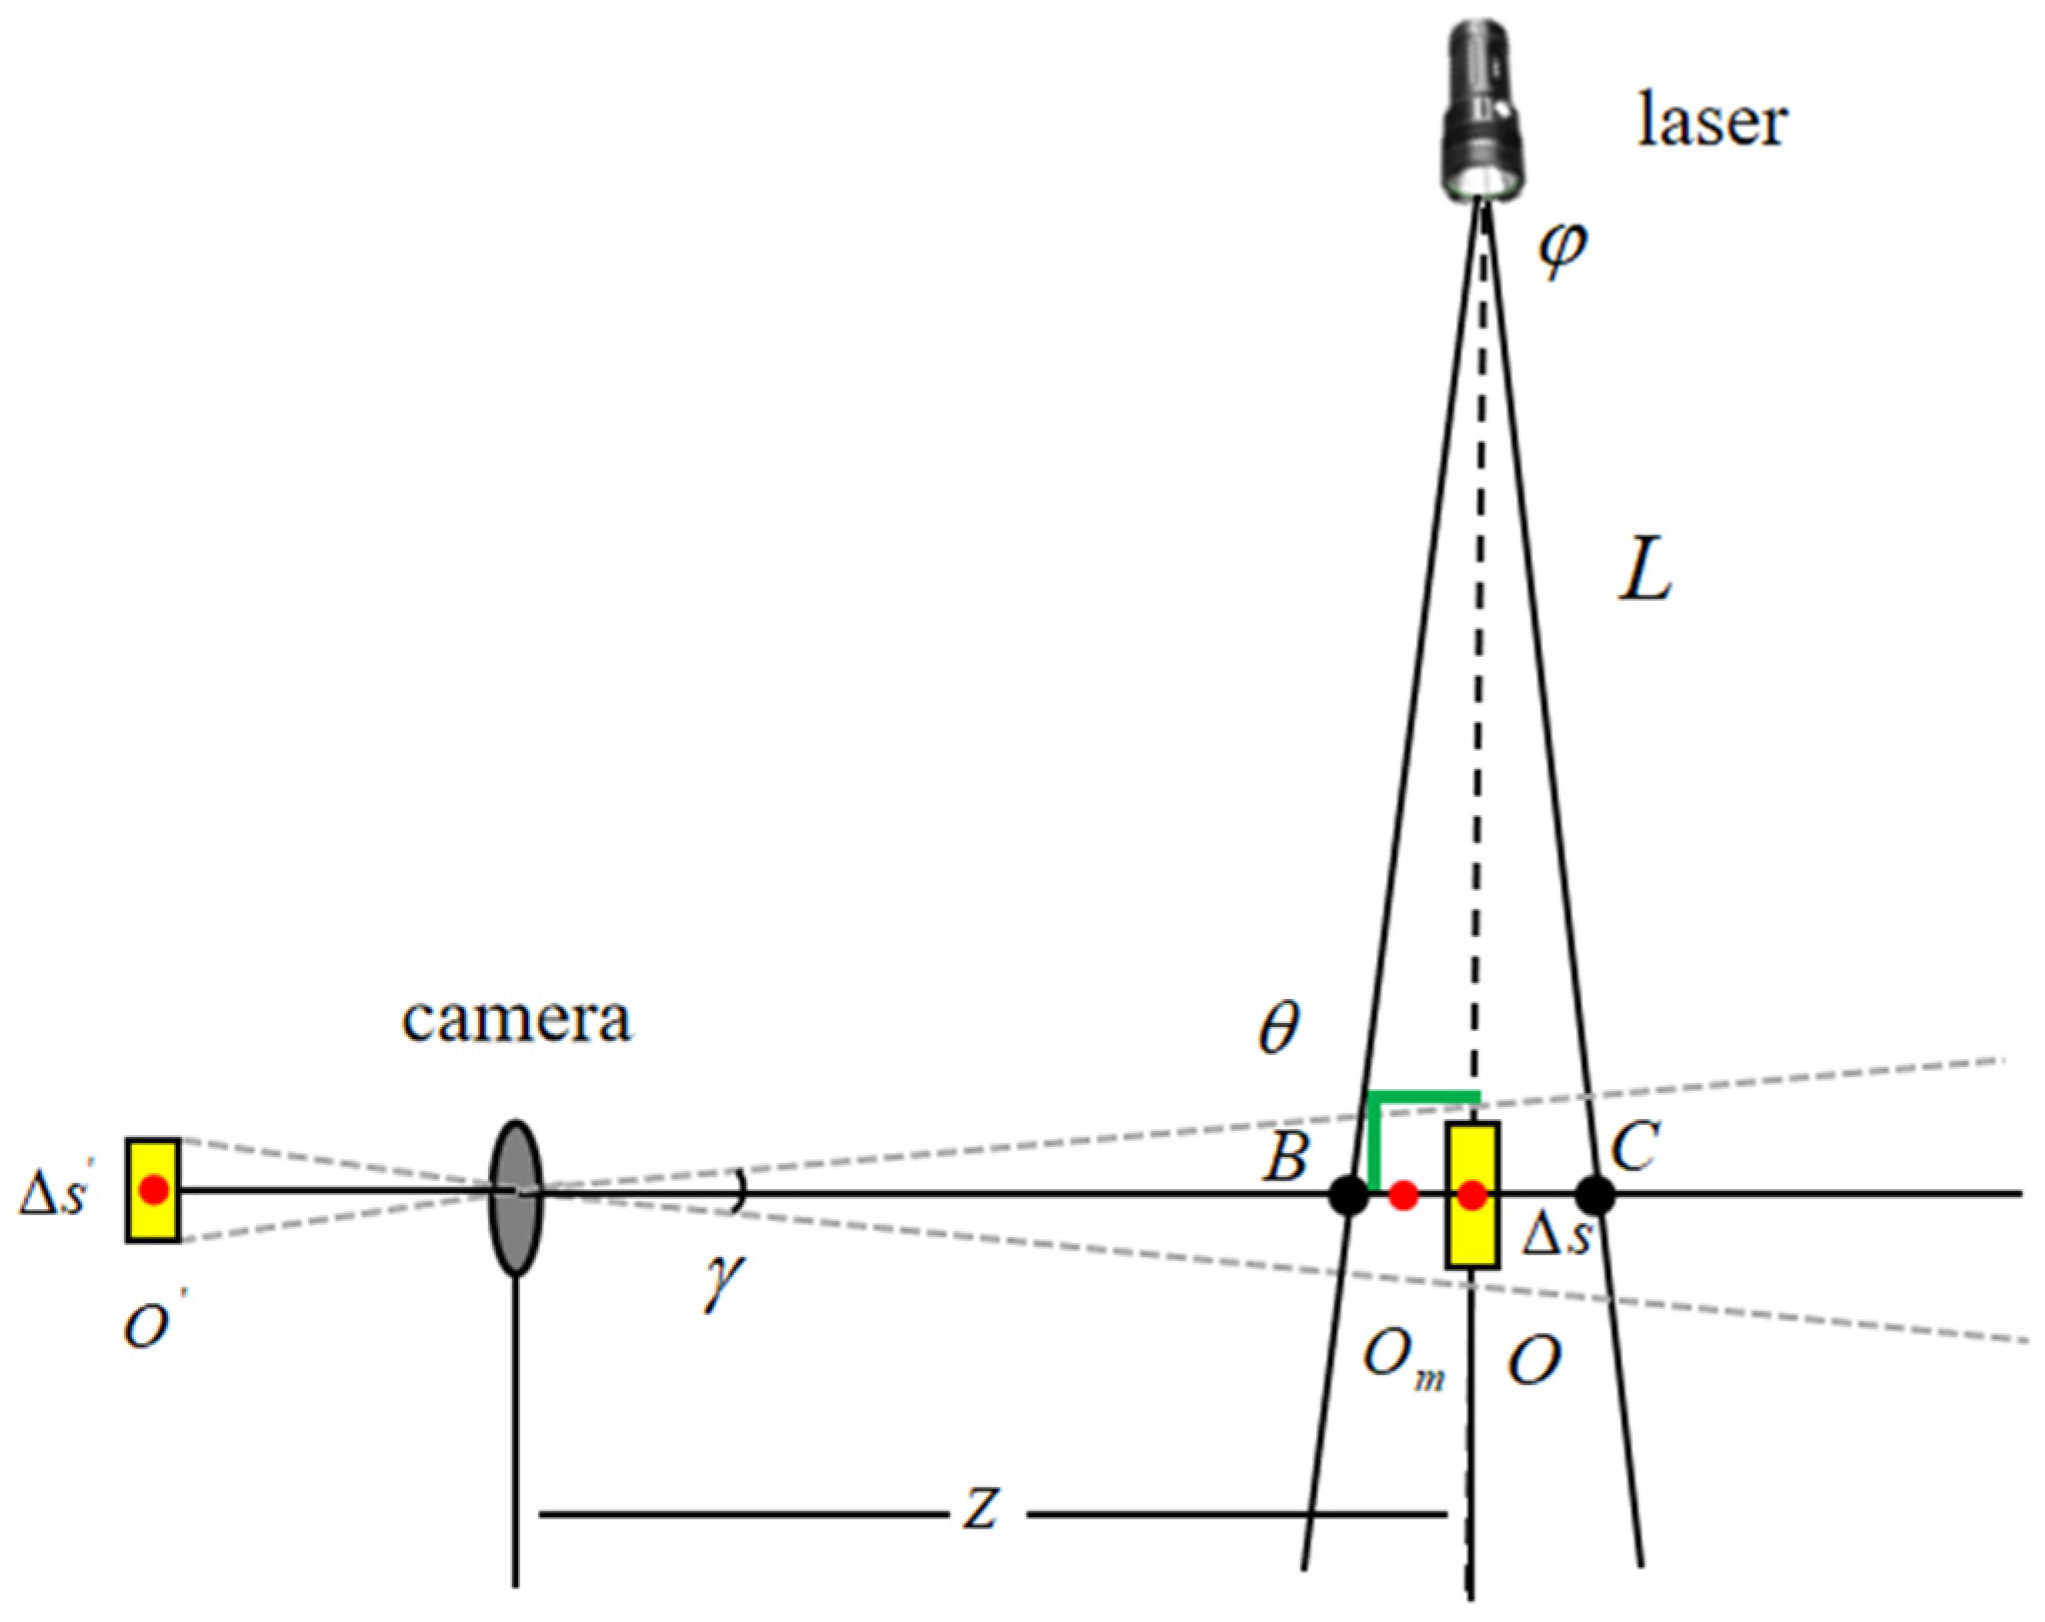
Transmission distance is a crucial factor influencing the imaging quality, constraining the depth and range of underwater detection. In response to the variation in the distance of the light source, a power-compensated white laser method based on the distance of the light source is proposed. This method employs a combined-beam white laser as the light source of the underwater imaging system, with the power of the three-color combined-beam white laser at the outgoing end being compensated. The principle of a three-color combined-beam white laser is shown in
Figure 1.
The physical meanings of all variables, constants, and parameters employed in the attenuation model and compensation formula used in this study are as follows:
L denotes the light source distance; Z represents the imaging distance. (Camera transmittance) = 0.3. (Focal length) = 20 mm. (Aperture) = 1.6 mm. (Light source scattering angle) = 12°. Volume scattering function (clear water) = 0.00628. Volume scattering function (seawater) = 0.00452. F = . is the outgoing optical power, is the maximum optical visual efficacy, is the attenuation coefficient of the direct light, is the stereoscopic divergence angle (sr) of the laser transmitter, . is the target reflectivity. (Reflectance) = 0.5. The wavelengths λ of the red, green, and blue lasers are set to 638 nm, 520 nm, and 450 nm, respectively. Under clear water medium conditions, the beam attenuation coefficients for direct transmission and scattering of red, green, and blue light are as follows:
, , , , , .
Under nearshore marine medium conditions, the beam attenuation coefficients for direct transmission and scattering of red, green, and blue light are as follows:
, , , , , .
The tri-color laser power ratios
are given as follows:
The white light source D65 (color temperature 6500 K, RECO, Guangdong, China) under the CIE1931XYZ standard [
11] was chosen to obtain the triple stimulus values
and color coordinates
[
11,
12]. The tristimulus values for the red wavelength are (0.48474, 0.19116, 0.00002), with chromaticity coordinates of (0.71716, 0.28281). The tristimulus values for the blue wavelength are (0.06327, 0.710000, 0.07825), with chromaticity coordinates of (0.07430, 0.83380). The tristimulus values for the green wavelength are (0.33620, 0.03800, 1.77211), with chromaticity coordinates of (0.15664, 0.01770). The tristimulus values for D65 white light are (95.04, 100, 108.88), with chromaticity coordinates of (0.3136, 0.3235). Based on the tristimulus values, chromaticity coordinates, and power ratio specifications defined by the 1931 CIE XYZ standard [
11] for white light, the power ratio of the three primary colors required to achieve combined white light with a correlated color temperature of 6500 K can be determined as
.
Compared to the original D65 white laser, the power-compensated white laser light source not only enhances the illumination of the object surface but also ensures the standard color temperature of 6500 K, thereby improving the working transmission distance and the quality of the white laser light source.
Figure 1 illustrates the imaging theory principle diagram.
As illustrated in the accompanying figure, the three fundamental elements of underwater imaging are configured as a white laser transmitter, an underwater target, and an imaging system. The impact of transmission distance on underwater imaging is analyzed by controlling the distance between the light source and the imaging system. Among the elements above, the distance of the light source
L is altered, resulting in a power compensation of the white laser at the outgoing end. Both the compensated light source and the uncompensated D65 white laser are employed as the underwater illumination light source. It is assumed that the surface of the micro-element volume at the underwater object is uniformly illuminated to form the light-illuminated surface
. Points B and C represent the anterior and posterior intersections of the laser scattering edge and the receiver’s main field of view angle, respectively. These form a scattering area element
in the superposition region of the light source and receiver. This is employed to compare the image micro-elements at
on the imaging surface when the imaging system receives the directly reflected and scattered light. Red colors in
Figure 1 is the center of target. Yellow colors in
Figure 1 is the target.
where the fixed color temperature is 6500 K and
,
and
, are the uncompensated white laser tri-color power values [
2].
The white laser power after compensation is designated as
. To ensure that the color temperature of the light passing through the water quality on the surface of the target object is 6500 K, the attenuation coefficients of different water qualities are substituted into Equation (3) to obtain the compensated power for each color, and the compensated power is added to the power at the output end to obtain the post-compensation power data. Then, the post-compensated power value
of the combined-beam white laser is obtained by fiber integration. In the experiment, the three-color current values of the laser were manually adjusted to obtain the above power compensation values. The attenuation coefficients of the three primary colors, red, green, and blue, are represented by,
and
, respectively. These coefficients can be calculated using the following Equation (4) [
13,
14].
The transmission of laser light to the imaging surface through the underwater target significantly challenges the imaging results due to the water column and suspended particles, which cause both forward and backward scattering. Among these factors, backward scattering, which occurs in the opposite direction of the light source and at an obtuse angle to the incident angle, is the primary source of light that blocks the directly reflected light and forms background noise. This is the primary factor that leads to the degradation of the signal-to-noise ratio and contrast of the image. In this context, it is necessary to focus on the phenomenon of backward scattered light. In order to achieve this, the angle of the light source must be fixed at 90 degrees, while the distance between the light source and the imaging surface must be altered. This allows the formation of an imaging image, in which the two light sources are positioned on the imaging surface.
The reflected light from the target in region
on the object plane passes through the receiving lens and reaches region
on the image surface.
is the illuminance of the directly reflected light from the target.
where
is the outgoing optical power,
is the maximum optical visual efficacy,
is the attenuation coefficient of the direct light,
is the stereoscopic divergence angle (sr) of the laser transmitter,
.
is the target reflectivity.
The scattered region is picked up by imaging, and the illuminance of the surface element scattered light at the imaging plane point
in a region of thickness BC at the imaging distance Z is
where
is the attenuation transfer function of the entire beam in the aqueous medium,
is the scattered light component at the imaging surface point
at a light source angle of
, and
is the Mie scattering function [
15].
That is, the total light illuminance
received at the imaging surface is [
16]
Based on the aforementioned evidence, we conducted an experiment to measure the red, green, and blue light illuminances at varying distances from the light source. These measurements were then substituted into Equations (4)–(7). In accordance with the findings of Zhang et al. [
10], the attenuation coefficients of direct and scattered light were calculated within a specified range. The attenuation coefficients for direct and scattered light were obtained through the experimental inversion method.
3. Underwater Imaging Experiment
3.1. Short-Range White Laser Underwater Imaging Experiments
In order to verify the theoretical foundation of underwater experiments based on transmission distance compensated white laser, an experimental system was constructed, and short-range and long-range underwater experiments were conducted. The power of the white laser was controlled by changing the light source distance and imaging distance, and underwater imaging was carried out under different power white laser light sources. The short-range experiments were conducted at a light intensity of less than 1 lx. The experimental scenario is shown in
Figure 2.
Lasers:
The RGB white laser used in the lab is the LWRGB-F-FTP laser (LaserWave, Beijing, China). It has stable power, high beam quality, and easy operation. The white laser structure includes a power supply, laser head, optical fiber, and mirror barrel. As shown in
Figure 3.
Laser operation steps:
The laser transmitter is connected to the power supply, the laser beam with fiber optic connection to the fiber optic coupler, the fiber core diameter of 400 um, the fiber after the flat-top homogenization process to obtain a flat-top spot, uniformity is greater than 70%, the angle of 29 degrees, and then connected to the beam processing mirror tube to send out the laser. The laser transmitter using a three-color current controller can be issued separately monochromatic laser, which can also be mixed to launch a white laser. The illumination light source for underwater imaging is a red (638 nm), green (520 nm), and blue (445 nm) three-color combined-beam white laser.
Figure 2 depicts the short-range underwater white laser imaging experiment. The white laser parameters are presented in
Table 1.
Imaging camera:
The V2046A camera module (Samsung, Shenzhen, China) features a 48-megapixel micro-gimbal primary camera (with closed-loop motor, f/1.6 aperture, 20 mm focal length, and 0.3 transmittance), combined with a 13-megapixel portrait camera offering a 50 mm equivalent focal length.
Target:
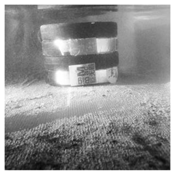
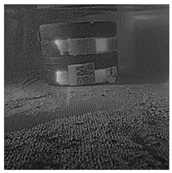
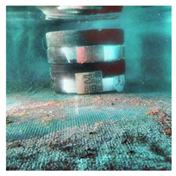
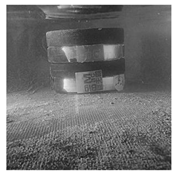
The target is a barbell with color pattern stickers highlighting differences in detail imaged at various distances.
Transmission distance:
Transmission distance data was collected at light source distances of 0 m, 1 m, 2 m, and 3 m, with 1 m and 2 m imaging distances.
Experimental procedure:
The experimental operation process was as follows:
The laser synthesis 6500 K color temperature of the white laser is controlled to ensure laser stability.
The laser is irradiated to the center of the underwater target object at the center of the position, in the lengthening of the light source distance on the basis of changing the imaging distance, imaging the first region.
The D65 color temperature is obtained. The temperature of the white laser imaging image must be considered.
According to the distance from the source of the white laser, power compensation must be applied to ensure that the laser emits a 6500 K standard color temperature when in contact with the underwater object surface.
The aforementioned compensation must be repeated for 1 operation, and the power compensation must be applied after imaging.
All the imaging images must be set, the image processing must be completed, and the image quality parameters must be analyzed.
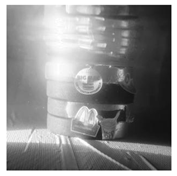
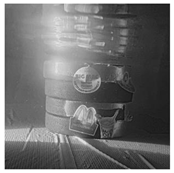
According to the above parameters, the experimental images of underwater imaging before and after short-range white laser power compensation were obtained under clear water and seawater conditions, as shown in
Table 2 and
Table 3.
The comparison between
Table 2 and
Table 3 in the two water media follows the law of light attenuation with increased transmission distance before and after compensating for the white laser light source. This is due to the attenuation effect of the water on the light, where the more significant the light range, the smaller the light intensity that reaches the detection cross-section. As a result, the brightness and clarity of the imaging image decrease. However, due to the more complex impurity particles and water quality of the internal environment of seawater, the absorption and scattering effect on the light is also more intense, the brightness and contrast of the image have a significant decrease, and more critical for underwater imaging of the underwater target details are blurred, resulting in the inability to observe the precise information feedback.
Compared to the pre-compensation image, the compensated white laser light source provides better overall brightness, color, and detailed information response in underwater images. This indicates that the compensated white laser light source not only achieves the ideal white light source at the underwater target but also produces clear and high-contrast images at the imaging location, providing a more accurate representation of the underwater environment.
3.2. Long-Range Imaging Experiments Using a White Laser Underwater
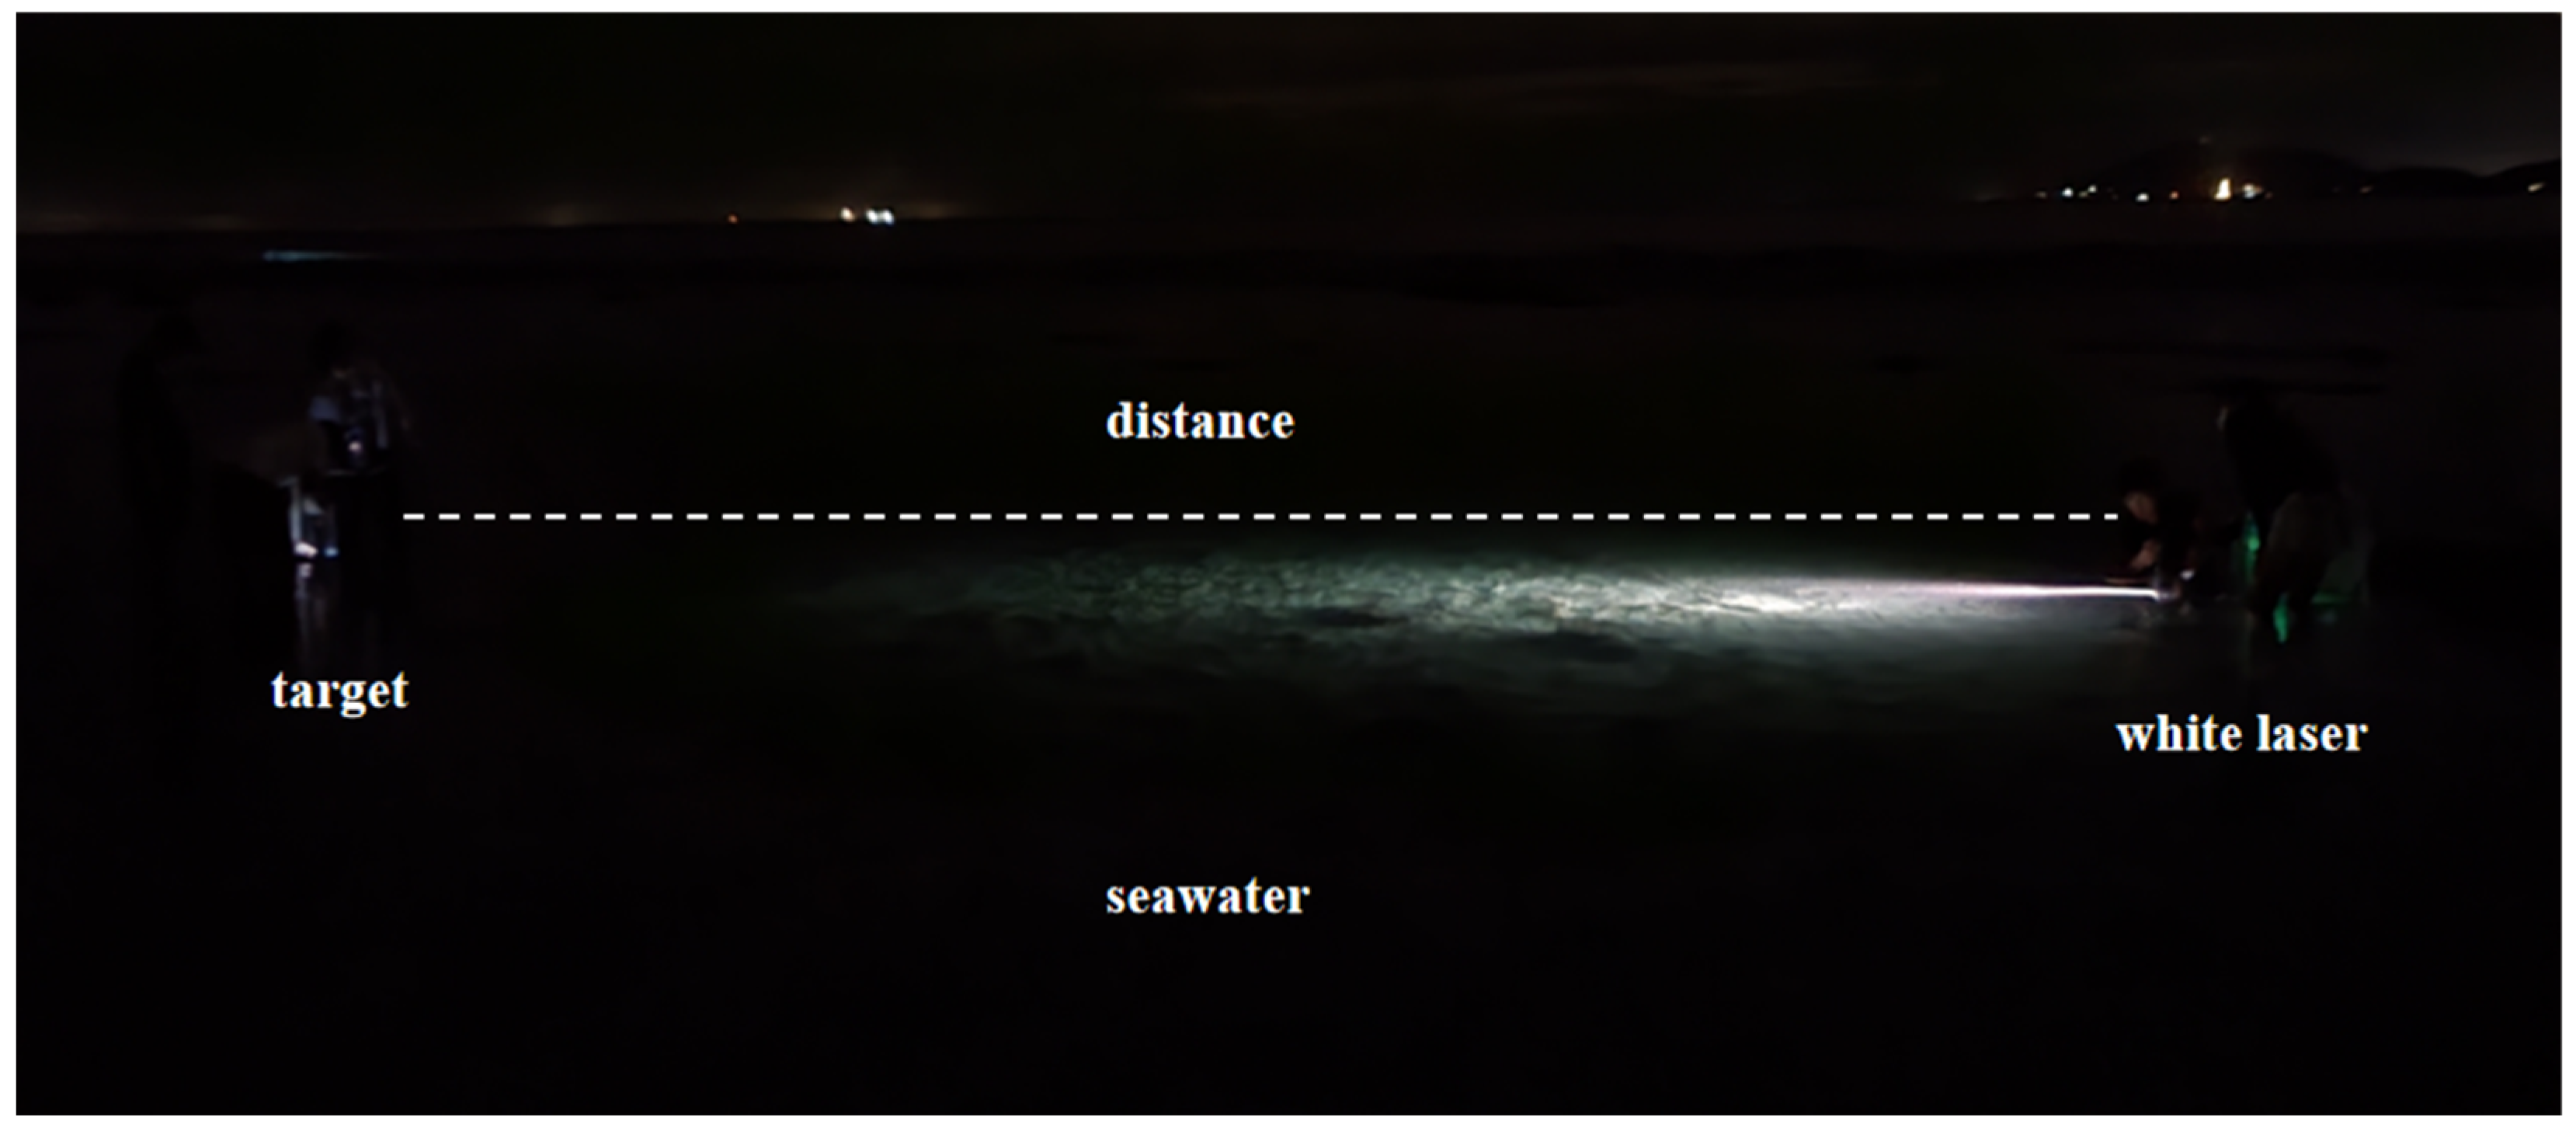
Figure 4 shows the long-range underwater white laser imaging experiment. In this experiment, the long-range tests were conducted under an illuminance level below 1 lx. The illumination was provided by a white laser synthesized by combining three primary colors: red (638 nm), green (520 nm), and blue (445 nm). The parameters of the white laser are summarized in
Table 4. The experiments were performed using seawater as the medium. The distance from the light source to the target ranged from 1 to 5 m, while the imaging distance was set between 0.5 and 3 m.
Location and time of experiment:
The location of the long-distance experiment is located at the outdoor site of Xidao, Sanya, Hainan Province, China. The experiment was conducted on 15 September 2023, from 20:00 to 16 September 05:00, I < 1 lx.
Laser:
As shown in
Figure 4. The combined-beam white laser light source was a three-color combined beam of red (638 nm), green (520 nm), and blue (445 nm) light.
Table 4 shows the data for white laser light source parameters before and after compensation based on the light source distance.
Imaging camera:
Galaxy Z Flip3 5G (SM-F7110) (SAMSUNG, Guangdong, China). The phone has dual rear cameras, both of which are 12 megapixels, the primary rear camera has an aperture F of 2.2 and the secondary camera is an ultra-wide-angle camera with an aperture F of 1.8. It has autofocus, HDR, and Optical Stabilization, and supports 10× digital zoom.
Underwater targets:
The underwater target object is a purple body with a rich color and a detailed center. It can respond to imaging details, as shown in
Figure 5.
Transmission distance:
The experiment utilized light source distances ranging from 0.5 m to 5 m and imaging distances ranging from 0.5 m to 3 m.
Experimental procedure:
The experimental operation process was as follows:
Place the laser, target, and camera in the same plane so that the angle between the three is 90°.
Use the white laser light source to compensate for the D65 light source. Set the light source and target distance to 0.5 m and change the distance between the target and the camera to 0.5 m, 1 m, 1.5 m, 2 m, and 3 m.
Adjust the distance of the light source to 0.5 m, 1 m, 1.5 m, 2 m, 2.5 m, 3 m, 4 m, and 5 m, and repeat steps (1) through (2).
Adjust the power of the white laser for each stage of the light source distance so that the target surface achieves the standard color temperature of 6500 K. Repeat steps (1) to (3).
The imaging results before and after power compensation will be compared.
Experimental variables include the white laser light source, light source distance, and imaging distance. Take photographs at each distance.
According to the above experimental steps, the experimental images of underwater imaging before and after compensation of the underwater long-distance compensated white laser light source under the open seawater field are obtained, as shown in
Table 5 and
Table 6.
The table shows that under open-field seawater conditions, the image’s overall brightness is significantly weakened with an increase in light source distance (horizontal observation). However, the center of the underwater target object displays enough information, details, and color sharpness within the observation range. This indicates that the light source distance hurts the brightness of the image. (Compare
Table 5, imaging distance 0.5 m, light source distance 0.5 m to 1 m). The clarity and brightness of underwater images are significantly weakened with increased imaging distance (longitudinal observation). The difference in brightness between the center of the target and the background of the underwater environment becomes more pronounced, which implies that the imaging distance is the most crucial factor that causes the clarity and brightness of underwater images to be weakened. (Compare
Table 5, light source distance 0.5 m, imaging distance 0.5 m to 3 m). Observation of the plots in
Table 5, for Light Source Distance 0.5 × Imaging Distance 0.5 and Light Source Distance 5 × Imaging Distance 3, demonstrates that the optical feedback information of the imaged image is consistent with the attenuation properties of light in water, which follow an exponential decay law as the transmission distance increases. Upon comparing
Table 5 and
Table 6, it is evident that the white laser light source with light source compensation yields superior brightness in underwater imaging under the same water medium and target conditions. This results in clearer visibility of target information and facilitates more straightforward observation. For instance, in
Table 5 and
Table 6, when the level of information feedback from the target is similar to that observed by the naked eye, the compensated image has a broader range of image brightness and ambient light source compared to the pre-compensation. This is more suitable for actual dynamic observation underwater, where the light source distance is 1 × imaging distance 1.
Table 5 and
Table 6 show that when the light source distance is 5 × imaging distance 2, the image before compensation appears dark, and the light source cannot provide long-distance illumination, resulting in the loss of the primary target. However, by compensating for the light source, the image can offer a relatively rough response to the size and shape of the underwater target.
The West Island Open Sea Experiment completes short-distance experiments. It sequentially increases the transmission distance to complete longer-distance experiments within the limited power range and practical imaging of the light source equipment. Comparing
Table 3,
Table 5 and
Table 6, it is clear that the long-range imaging pattern is consistent with the short-range imaging pattern, both showing attenuation, further emphasizing the effect of transmission distance on the attenuated nature of underwater imaging images.
4. Image Processing for Underwater Laser Imaging
The basic imaging principle of the distance-compensated white laser underwater imaging experiment follows the classical Jaffe-McGlamery imaging theory [
16]. The image is first pre-processed with histogram equalization to enhance the basic features of the image, reduce the background noise, and improve the processability of the image. Then, the image is optimized using the Retinex algorithm based on color recovery to enhance the color of the underwater image, achieve the edge point sharpening effect of the target, and incorporate the multi-scale processing and color recovery mechanism based on ensuring the image is not distorted and color constancy. The Retinex algorithm assumes that the illumination is homogeneous, resulting in a significant difference in brightness of the image region in the presence of exposure. In order to compensate for the loss of detail caused by exposure, the subsequent image is restored using the Lap_fusion algorithm, which restores the information about the underwater target to a greater extent and optimizes the underwater image. The image processing flow is shown in
Figure 6 [
17,
18].
Table 2,
Table 3,
Table 5 and
Table 6 demonstrate that the short-range and long-range compensated white laser underwater imaging experimental maps are optimized using the aforementioned image optimization method to yield underwater images with distinct colors and complete details. As illustrated in
Table 7,
Table 8 and
Table 9, representative transmission distance underwater images were selected due to the vast quantity of images.
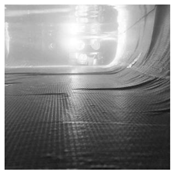
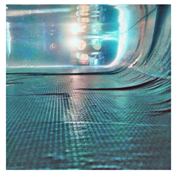
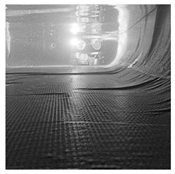
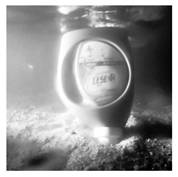
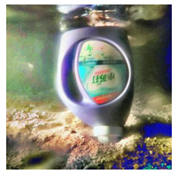
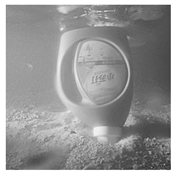
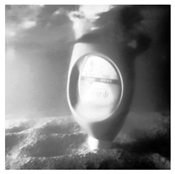
As illustrated in the preceding figure, the histogram equalization process applied to the underwater image results in the accentuation of the target’s pattern and text information at close range, the enhancement of edge feature points at a distance, the attenuation of background noise, and the highlighting of the object. However, this process also results in the loss of the target’s objective color and the inability to discern its true state. The image after the Retinex algorithm restores the original color and enhances the color of each region of the target, making the color sharp. The contrast between light and dark places is strong and easy to observe. However, there is an exposure phenomenon in the high brightness area of the original image, which causes the color here to be bright white and the target to be lost. Based on this, the Lap_fusion fusion algorithm restores the target in the high brightness region with high clarity and clear details compared to the preprocessed image. The image after Retinex has high contrast, bright and sharp colors, clear segmentation from background noise, and the Lap_fusion image has clear patterns and information at the underwater target for easy observation.
5. Image Quality Parameter Analysis
5.1. Analysis of Image Quality Parameters of Short-Range Compensated White Laser Imaging Images
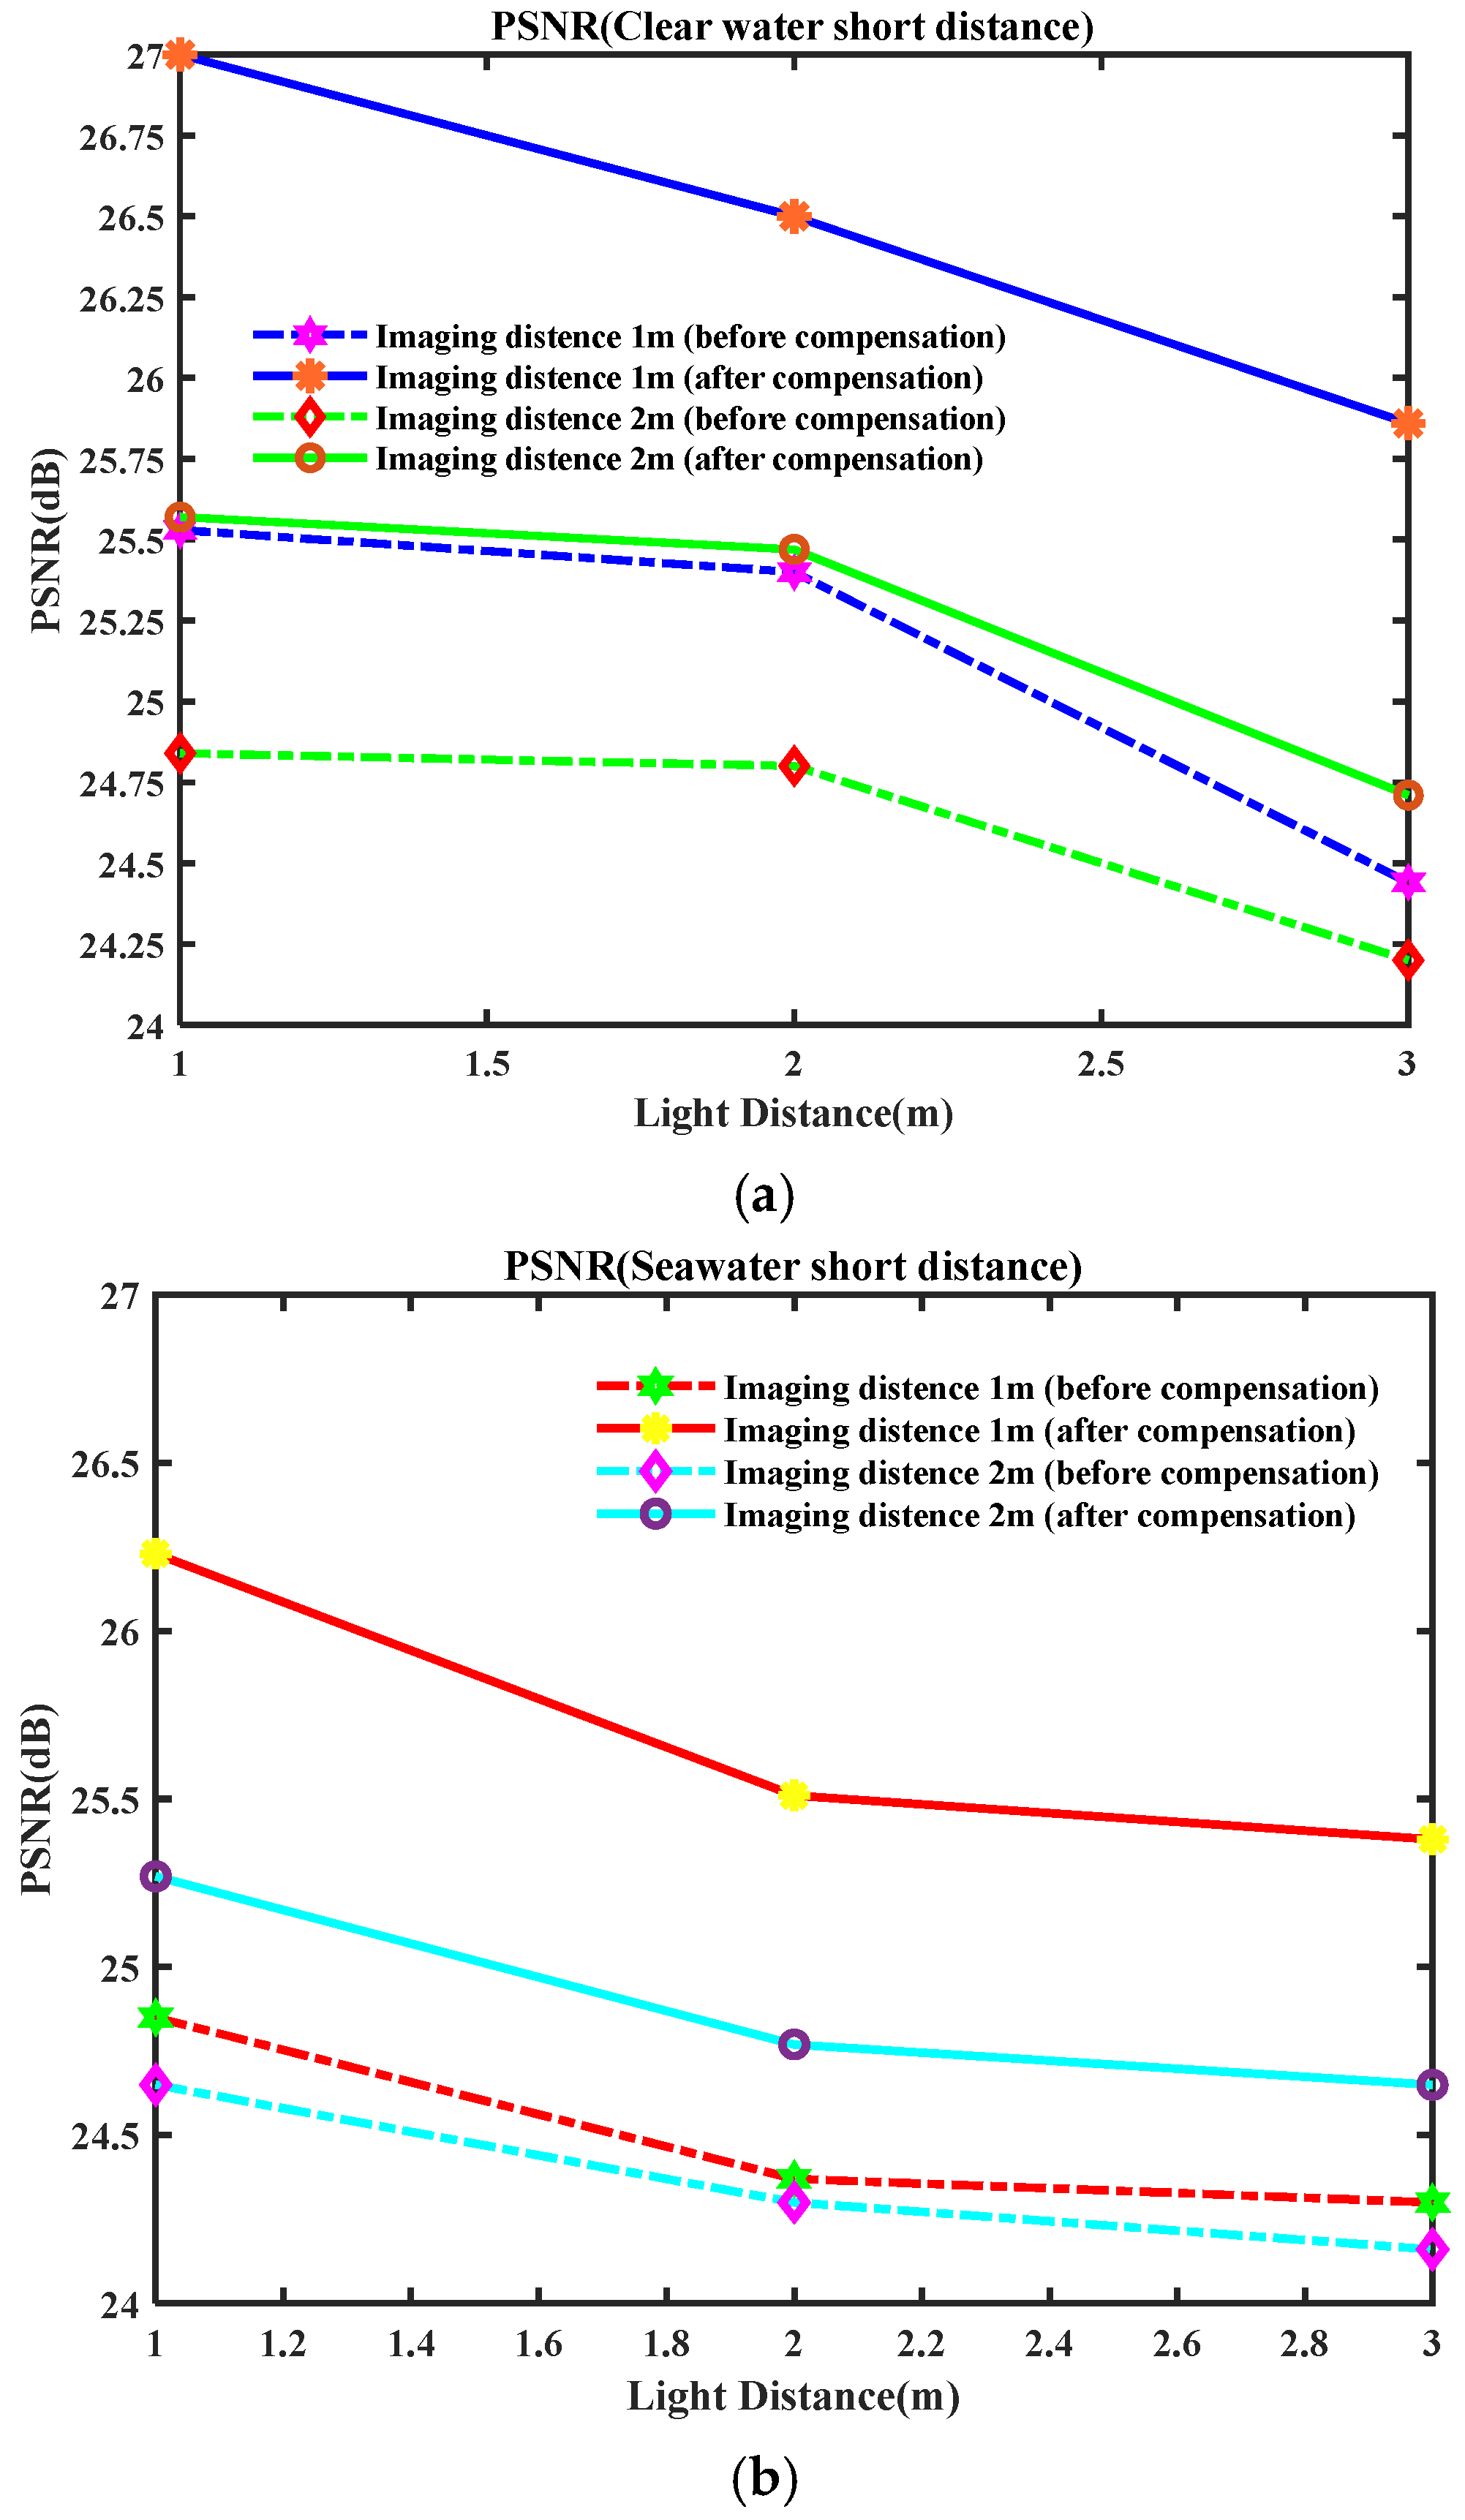
The PSNR values of the imaging results of an underwater target at distances of 1 m and 2 m were compared between the original D65 white laser light source and the compensated white laser light source used as underwater illumination. The comparison was based on the distance from the light source to the outlet end. The results are presented in
Figure 7 and
Table 10 and
Table 11. Specifically,
Figure 7a shows the PSNR variation curves for the D65 white laser and the power-compensated white laser under clear water conditions, with a light source distance of 1–3 m and an imaging distance of 1–2 m, while
Figure 7b presents the corresponding curves under seawater conditions for the same range of light source and imaging distances.
Table 10 and
Table 11 show that increasing the light source distance from 1 m to 3 m in the clear water medium results in an average decrease of 4.23 and 0.75 in PSNR for imaging distances of 1 m and 2 m, respectively. Similarly, increasing the imaging distance from 1 m to 2 m results in an average decrease of 1.06, 0.815, and 0.695 in PSNR for light source distances of 1 m, 2 m, and 3 m, respectively. The attenuation of seawater is similar to that of clear water, as shown in
Table 11. The PSNR of underwater images decreases as the transmission distance increases, and the rate of decrease essentially follows the decay law. This suggests a correlation between the images’ signal-to-noise ratio and water’s attenuation characteristics on light. Due to the complexity of seawater as a medium, the presence of mud and sand particles can negatively impact imaging, resulting in lower PSNR values compared to clear water images.
Table 12 shows the calculated compensation growth rate of a white laser light source with power compensation based on the light source distances of 1 m, 2 m, and 3 m in clear water and seawater media, compared with the PSNR of images with the original D65 color temperature white light source.
It can be observed that in imaging distances of 1 m and 2 m in clear water conditions, the average compensation growth values of PSNR are 1.330 and 0.637, with an average compensation growth rate of 5.3% and 2.58%, respectively. In the imaging distance of 1 m and 2 m in seawater conditions, the average compensation growth values of PSNR are 1.2 and 1.58, with an average compensation growth rate of 4.89% and 2.16%, respectively. In the context of water quality and imaging distance, the PSNR of the image based on white laser compensation is greater than that of the uncompensated image, thereby enhancing the image’s clarity. From the law of average compensation growth rate, it can be demonstrated that the growth rate of 1 m of clear water imaging is greater than that of 2 m of clear water imaging, which is greater than that of 1 m of seawater imaging and 2 m of seawater imaging. This indicates that the signal-to-noise ratio of the underwater imaging image based on the power-compensated white laser with a short transmission distance and water quality follows the theoretical research model. Furthermore, the power-compensated white laser light source is more suitable for use as an underwater illumination source, which is more conducive to underwater observation.
5.2. Analysis of Image Quality Parameters of Long-Distance Compensated White Laser Imaging Images
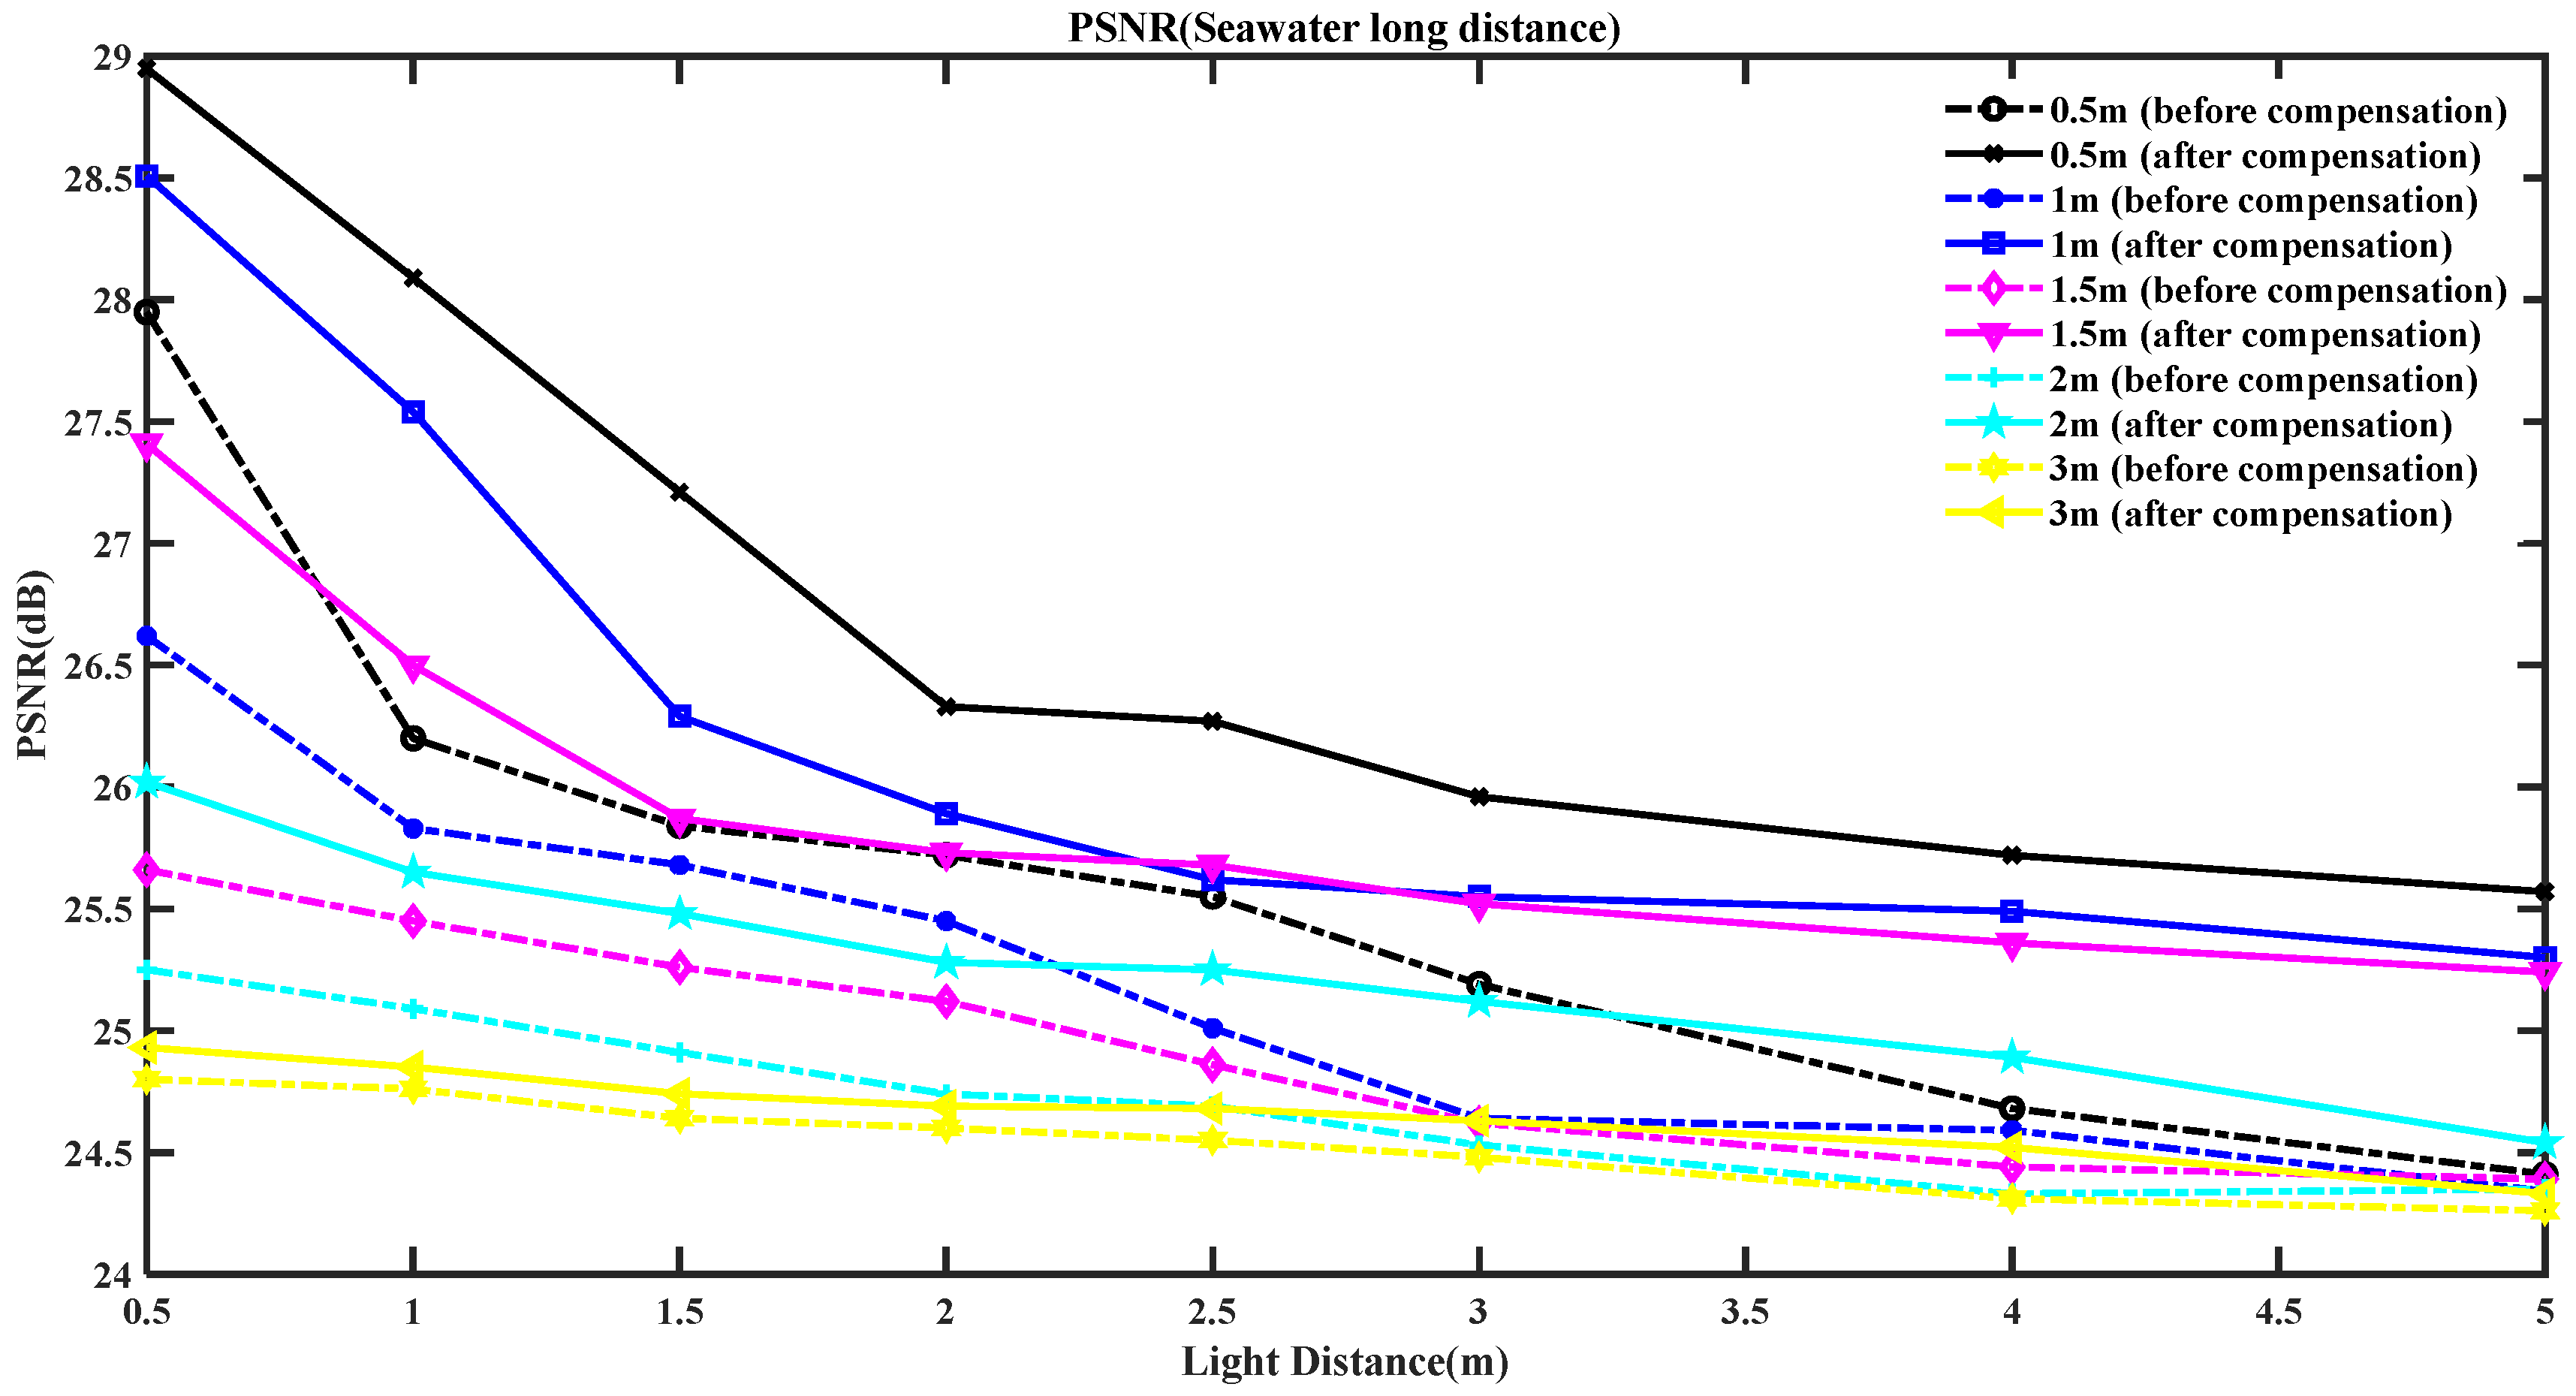
The PSNR values of the underwater imaging image were compared to the original D65 color temperature of the white laser light source and the compensated white laser light source used as an underwater illumination light source. The comparison was made at a light source distance of 0.5~5 m and an imaging distance of 0.5~3 m, based on the distance to the outlet end of the white laser light source compensation.
Figure 8 and
Table 12 show the results.
From
Figure 8 and
Table 13, it is evident that the PSNR of the image quality parameters changes consistently at both short and long distances in the open seawater domain. As the distance of the light source transmission increases, the PSNR parameter of underwater images decreases. This change curve conforms to the characteristics of exponential decay. The parameter for short distances before 2 m tends to decrease significantly, while the attenuation is more noticeable. Conversely, the parameter for longer distances after 2 m changes less, and the PSNR parameter of the underwater image varies within half of its range. This indicates that the PSNR parameter of the underwater image, which changes with the distance of the light source, is consistent with the exponential attenuation nature of the water’s transmission.
Table 5 and
Table 6 show that the distance of the light source affects the brightness and detail of the underwater image. Based on image observation analysis, increasing the imaging distance results in the gradual loss of the object target and decreased clarity of the observation of the underwater target. The PSNR parameter of the underwater image also shows a decreasing trend of characteristics in the light. Furthermore, objective data analysis is more advantageous than the original D65 white laser light source in underwater imaging. Moreover, upon observing
Table 5 and
Table 6, it is evident that the compensated white light source is more effective in highlighting the contours and details of the underwater target in the underwater illumination. This results in an overall improvement in the image’s brightness and provides better processability for subsequent image processing.
Table 14 shows the decrease in image PSNR as transmission distance increases, while
Table 15 displays the growth rate of the compensated image compared to the pre-compensated image.
Table 14 shows that as the light source distance increases from 0.5 m to 5 m, the PSNR of the images in this imaging distance stage decreases compared to the previous stage. Similarly, as the imaging distance increases from 0.5 m to 3 m, the PSNR of the images in each light source distance stage also decreases compared to the previous value. Finally, when the transmission distance is increased to the maximum, the PSNR of the images before and after the compensation of the light source reduces by 3 and 2.78, respectively. The results indicate that the PSNR of the images decreases with increasing transmission distance, and the decreased value decreases layer by layer, which is more in line with the exponential attenuation nature. Additionally, after the water body attenuation, the artificial light source illumination weakens at longer distances, resulting in little contrast between before and after compensation and similar PSNR values. As a result, there is little variability in the reduction values of the images.
Table 15 compares the imaging image data before and after light source compensation at different transmission distances. The compensation growth rate significantly increased for distances within 1.5 m, indicating that the white laser, based on light source compensation, can improve underwater imaging efficiency and image signal-to-noise ratio at close distances. This light source can effectively enhance imaging quality. The average growth rate of the image for each imaging distance phase was 4.16%, 4.0%, 3.77%, 2.20%, and 0.49% for distances ranging from 0.5 to 5 m. The imaging distance is an essential factor affecting image clarity, with compensation effects becoming less significant as the imaging distance increases.
The change rule for long distances is consistent with that for short distances when combined with imaging images and PSNR parameters for short distances. This further emphasizes the attenuation characteristics of underwater transmission and verifies the relationship between transmission distance and underwater imaging. When using a white laser light source with light source compensation as an illumination source for underwater imaging, the signal-to-noise ratio of the image increases at both long and short distances. However, the effect is more pronounced at short distances, and there is a specific value for utilization. Based on the experimental data analysis, it is evident that when the light source distance is 1 m and the imaging distance is 0.5 m, the underwater target’s detail contour is visible, the image does not have any exposure issues, and the signal-to-noise ratio data parameters of the compensated image are better. This suggests that observing the underwater target under this light source and transmission distance is more favorable and can improve the imaging quality. Also, after 0.518 W compensation, the white laser light source distance can reach up to 5 m, and an imaging distance of 3 m before the imaging image can reflect the details and contours of the underwater target. This demonstrates that power-compensated white lasers are better suited for long-distance transmission of illumination light sources, providing experimental and data support for using white laser light source types in underwater imaging.
5.3. Analysis of Errors
As the distance experiments are conducted outdoors, particularly the long-distance experiments located in the open ocean domain of the West Island of Sanya City, they were significantly influenced by ocean water wave flow and weather. Consequently, there are some errors in the image feedback and data results of the underwater imaging experiments, which can be categorized into two main factors: anthropogenic and natural.
The experiment involves several human factors that can affect the results: The laser fiber is unstable, so there is a slight difference in the output of the light source, which requires manual stabilization; The laser and camera require a waterproof device, and the device’s material can affect the results; The experimental pool for short distances is blue, which can create a blue background under the light source and affect the experiment; The experimental distance is marked manually, which can lead to errors in the camera’s manual shooting.
The experiment involves several natural factors that can affect the results: Long-distance experiments are particularly susceptible to rain, which can cause uncertainty in the fluctuation of impurities in shallow water areas, leading to experimental errors; Nature’s ebb and flow can result in water turbulence and fluctuations, directly impacting the experiments; The experimental device’s placement on the floating slope may also be affected by the environmental impact of the underwater ground and sand and gravel, which can impact the results of the experiments.
Based on the results of imaging experiments and data analysis, it was found that the above-mentioned objective factors had an impact on the underwater experiments, either directly or potentially. However, they are not the main factors affecting the results. Therefore, it is crucial to pay attention to these factors during the experimental process to prevent any potential deviations and carry out a series of imaging shots to ensure the accuracy of the results.
