Article

Subsurface Spectroscopy in Heterogeneous Materials Using Self-Healing Laser Beams

Applied Sciences Laboratory, Institute for Shock Physics, Washington State University, Spokane, WA 99202-1495, USA
*
Author to whom correspondence should be addressed.
Optics 2024, 5(2), 310-318; https://doi.org/10.3390/opt5020022
Submission received: 30 April 2024 / Revised: 1 June 2024 / Accepted: 13 June 2024 / Published: 20 June 2024
(This article belongs to the Section Laser Sciences and Technology)

Abstract

:
Self-healing optical beams are a class of propagation modes that can recover their beam shapes after distortion or partial blockage. This self-healing property makes them attractive for use in applications involving turbid media as they can—in theory—penetrate further into these materials than standard Gaussian beams. In this paper, we characterize the propagation of two different self-healing beams (Bessel and Airy) through a solid scattering material with different scatterer concentrations and find that both beams do recover after scattering for samples below a threshold scatterer concentration. Additionally, we test the applicability of both beam shapes for improved sub-surface spectroscopy in heterogeneous materials using fluorescent particles and find that there is an average fluorescence intensity enhancement of 1.3× using self-healing beams versus a standard Gaussian beam.

1. Introduction

Plastic composites, such as plastic bonded explosives, are heterogeneous materials consisting of various components inside of a polymer host. For instance, PBXs contain high-explosive crystals, grit, plasticizers, antioxidants, and other additives. Given their composition, it is reasonable to assume that the chemistry inside of these materials will be different than at the surface (which is exposed to air). To better understand how the chemistry inside of these materials differs from the surface chemistry, it is therefore necessary to have a diagnostic technique that can see inside of these materials. However, this proves challenging for traditional optical diagnostics (e.g., Raman and fluorescence spectroscopy) as these materials are opaque due to their heterogeneity.
To address this challenge, we recently developed a sub-surface spectroscopy technique [1,2,3,4] that utilizes feedback-assisted wavefront shaping (FAWs) [5] to focus probe light inside of a heterogeneous material and onto a guidestar particle; while we have successfully used this technique to probe slow subsurface reactions such as photodegradation [1] and thermal degradation [3,4], this technique is far too slow to probe faster reactions, such as those that occur during detonation [6]. Additionally, this technique requires a guidestar particle to be embedded inside of the heterogeneous material, which can alter the chemistry we are trying to measure.
As an alternative approach (which is faster and does not require a guidestar), we propose to use self-healing laser beams to probe inside of heterogeneous materials. Self-healing laser beams are a class of laser beams (e.g., Bessel, Airy, Pearcey, and Mathieu) that can recover their beam shape after partial obstruction or phase distortion [7]. The self-healing nature of these beams has been used to great advantage to improve propagation through turbulence [8,9,10,11], propagation through water [12,13], imaging of biological tissues [14,15], and micromanipulation of small particles/droplets [16,17,18], and enable new quantum technologies [19,20,21]. For this study, we rely on the beams’ resilience to phase distortion as our samples are opaque and nonabsorbing. We note that Zhang et al. previously demonstrated a macroscopic analogue of this approach by successfully propogating a Bessel beam through 1 km of turbulent air, while a Gaussian beam produced a speckle-like pattern due to the turbulent air [8].
In this study, we characterize the performance of both Airy and Bessel beams for subsurface spectroscopy using a series of samples containing different concentrations of scatterers. We perform imaging of the self-healing beams transmitted through the scattering samples to determine how resilient they are to scattering and perform fluorescence spectroscopy measurements using Airy, Bessel, and Gaussian beams. Additionally, we consider how the Airy and Bessel beams’ shape parameters affect their performance relative to a standard Gaussian beam.
Finally, as an aside, we note that while this is the first demonstration of using any type of structured light beams for subsurface spectroscopy (with other common beam types being Laguerre–Gaussian and Hermite–Gaussian beams) [22,23,24,25], there are two other “passive” approaches to subsurface spectroscopy: spatially offset Raman spectroscopy (SORS) and inverse-SORS [26,27,28,29,30,31,32,33]. In both techniques, light is directed onto the surface of a heterogeneous material, while a detector is focused onto a point spatially offset from the beam spot to collect Raman-scattered light. The distance between the source and detection spots are varied, with this distance being correlated with depth based on the scattering properties of the material. Thus, SORS/ISORS can obtain Raman spectra from different depths of the sample. Note that in SORS, the detection spot moves while the light is fixed, whereas for ISORS, the detection spot is fixed and the illumination region is varied. While these techniques can get Raman spectra from different depths of the sample, the resulting signals average over a large area and do not provide localized information, which is the objective of our approach using self-healing beams.

2. Method

2.1. Samples

To demonstrate propagation of self-healing beams through different scattering strengths, we prepared layered polymer samples on 3-inch × 1-inch glass slides consisting of a bottom layer with 2.5 wt% EYAD in Epotek 305 and a top layer of powdered sugar (0 wt%, 5 wt%, 10 wt%, 25 wt%, and 50 wt%) in Epotek 305 (300 μ m thick). See Figure 1 for the sample structure. We purchased Epotek 305 epoxy from Epoxy Technology (Billerica, MA, USA), Methanol (≥99.8% ACS BDH) from VWR (Radnor, PA, USA), and powdered cane sugar (C&H) from Amazon (Seattle, WA, USA). We prepared the Eu-based complex Eu:Y(acac)3(DPEPO) (EYAD) as described previously [2]. To prepare the epoxy, we used the manufacturer instructions for a 5:1.4 mix ratio by weight of resin (Part A) to hardener (Part B). After mixing the epoxy, we prepared the bottom layer of the sample (containing epoxy and EYAD fluorescent particles) by mixing EYAD with epoxy and methanol (1:1) with the resulting material spin coated onto a glass slide. To spin coat the bottom layer, we deposited approximately 0.5 g of the thinned mixture onto a glass slide and spin coated at 2500 rmp for 20 s. For preparation of the top layer, we mixed the powdered sugar into the epoxy, with methanol being used to thin the mixture as the concentration of powdered sugar was increased. The weight of the methanol was accounted for when applying each layer. Note that we used vortex mixing throughout to prepare the mixtures for both the bottom and top layers. Once the bottom layer was coated, we first cured it before evenly depositing the top layer. Each layer was cured at 60 °C for 1 h. The weight and thickness of each cured spin coated layer was approximately 30 mg and 40 μ m thick, respectively. The cured top layers were approximately 350 mg and 300 μ m thick. We measured the thickness of each layer using calipers and subtracting the thickness of the glass slide.

2.2. Experimental Setup

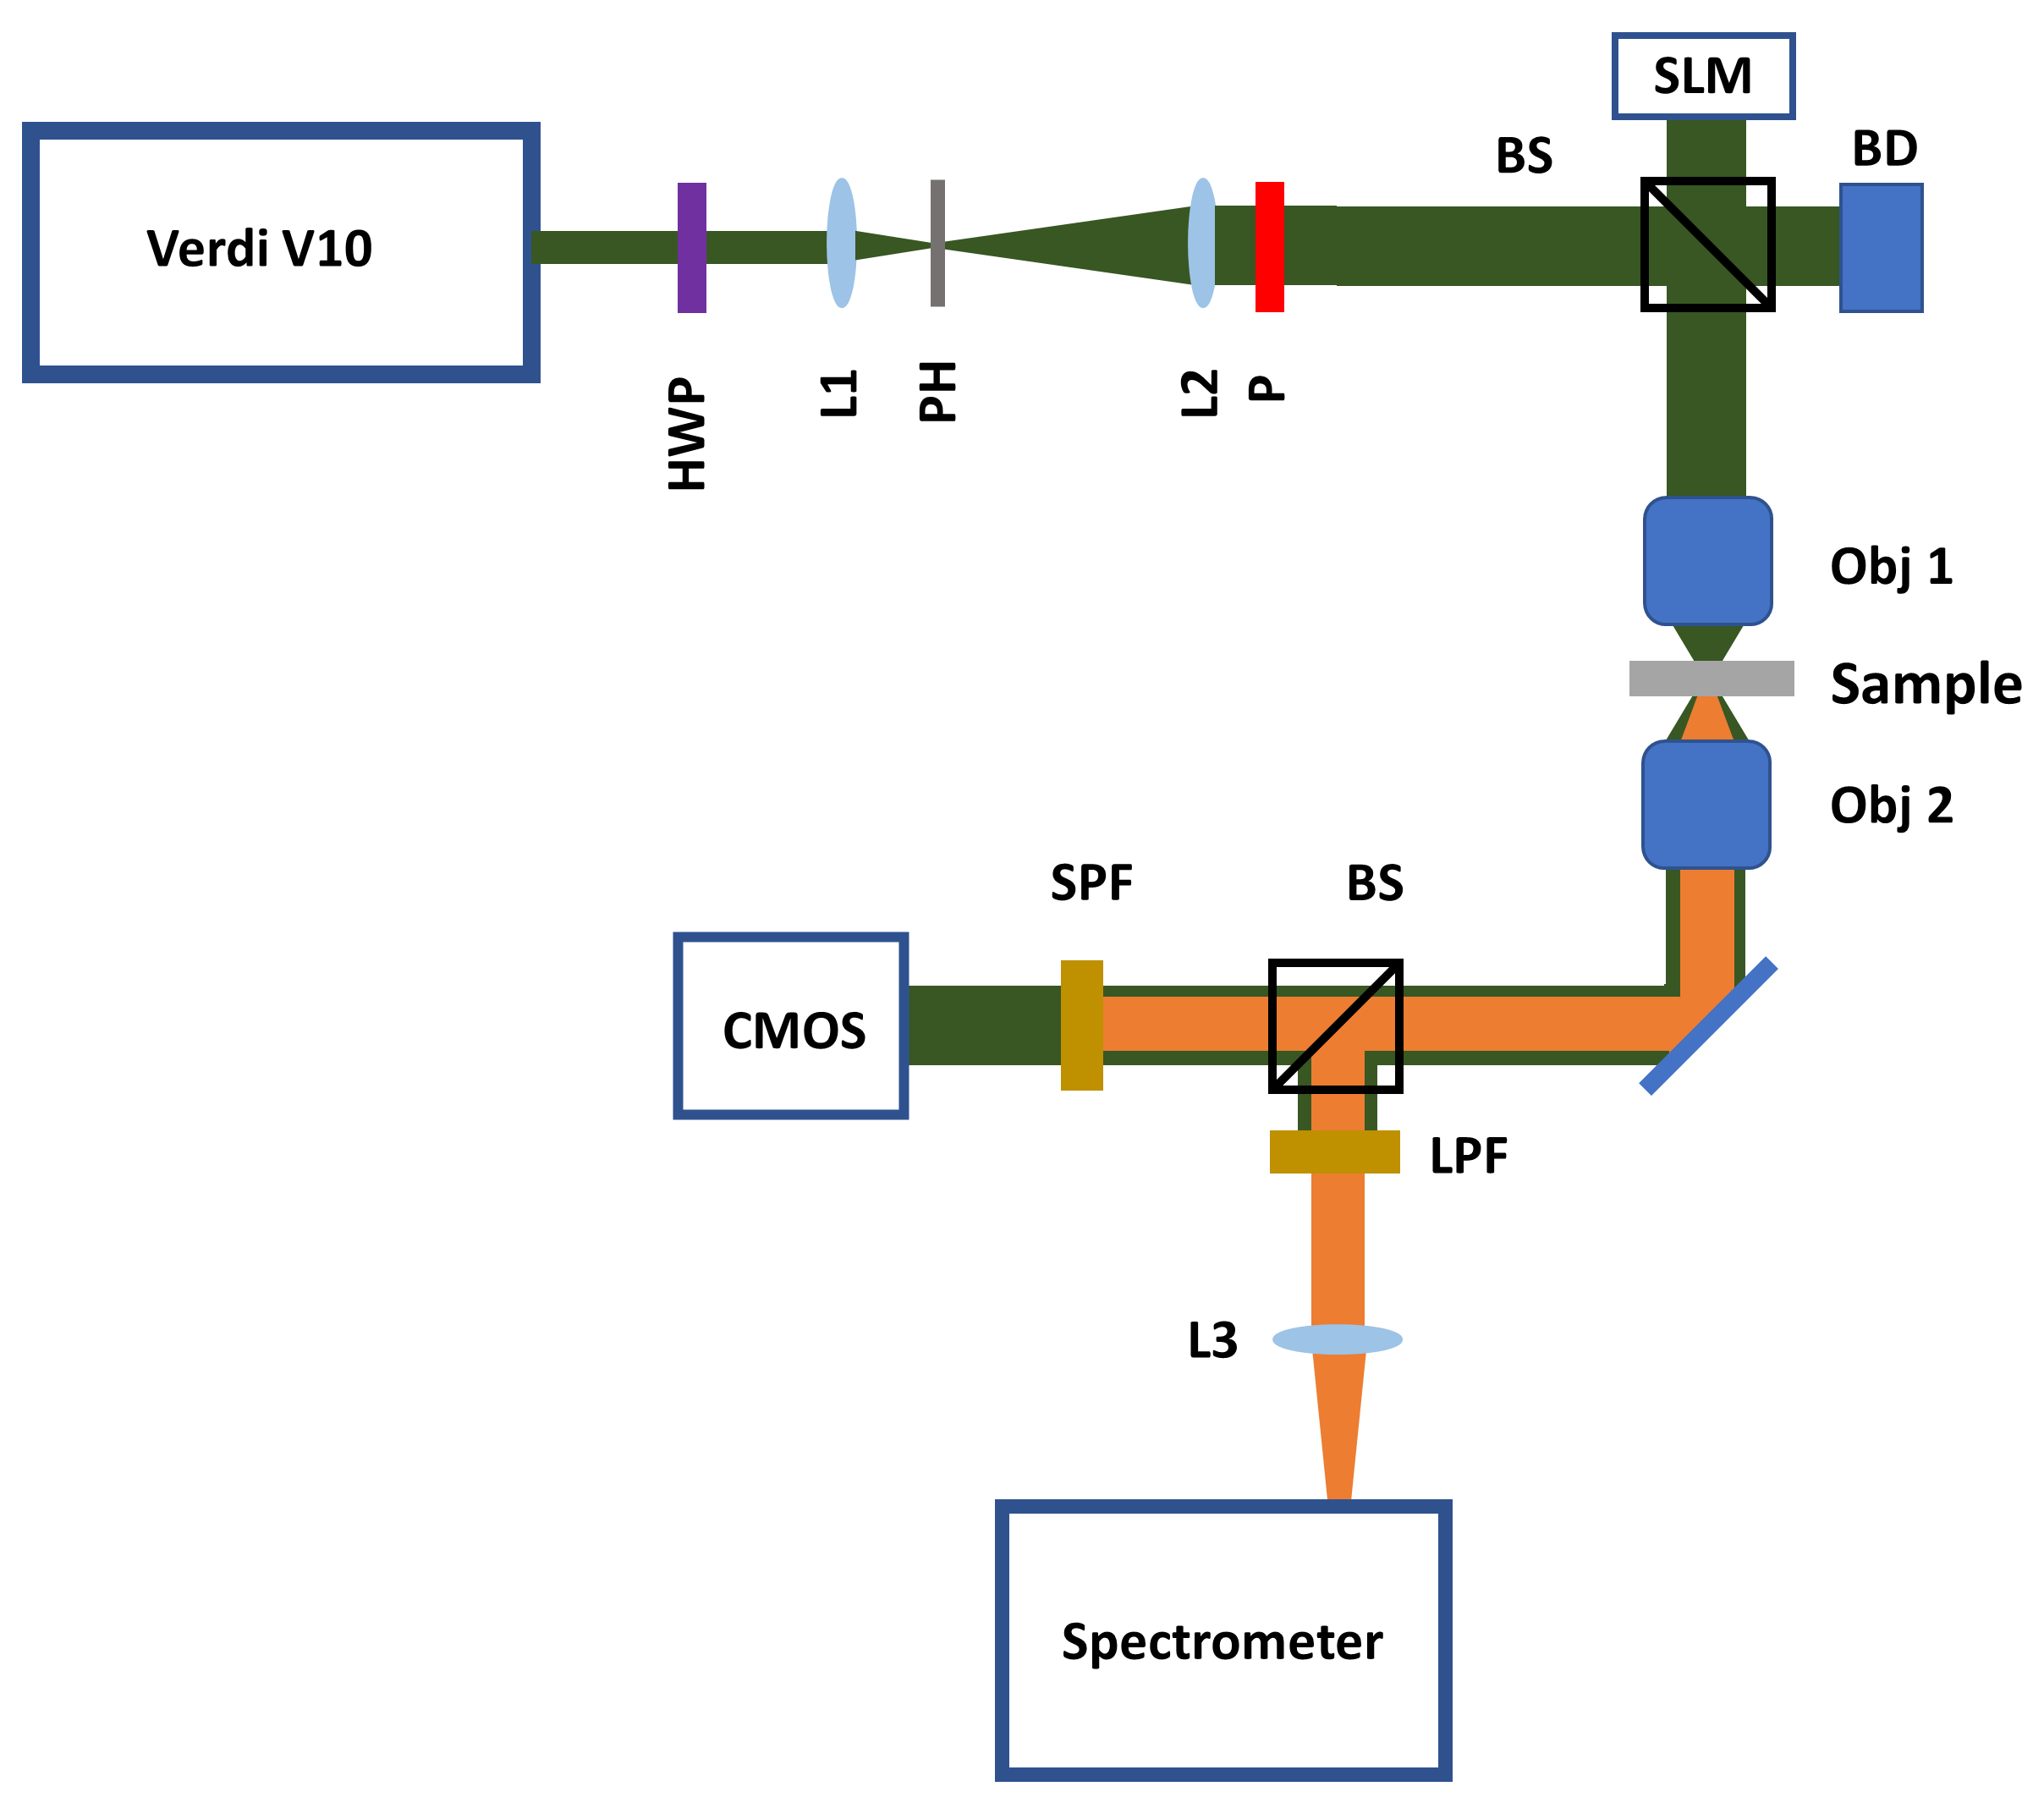
Our experimental setup consists of a Verdi V10 Nd:YVO4 laser (Coherent Corp., Saxonburg, PA, USA) (532 nm, 10 W, <5 MHz linewidth), a Meadowlark SLM (Frederick, CO, USA) (8-bit PCIe controller, 15 μ m pixels, 512 × 512), two long working distance objectives (Mitutoyo M Plan Apo HR 50×, Aurora, IL, USA, 0.75 NA, 5.2 mm working distance, clear aperture 6 mm), a Point Grey CMOS camera (Richmond, BC, Canada) (GS3-U3-23S6M-C), an Isoplane 320 monochromator (Teledyne Princeton Instruments, Trenton, NJ, USA) ( f = 320 mm, 600 g/mm, 500 nm blaze) with an attached Blaze CCD (400-B, 1340 × 400, 20 μ m), and various optics (e.g., lenses, mirrors, polarizers, half-waveplates). See Figure 2 for a schematic drawing of the experimental setup.
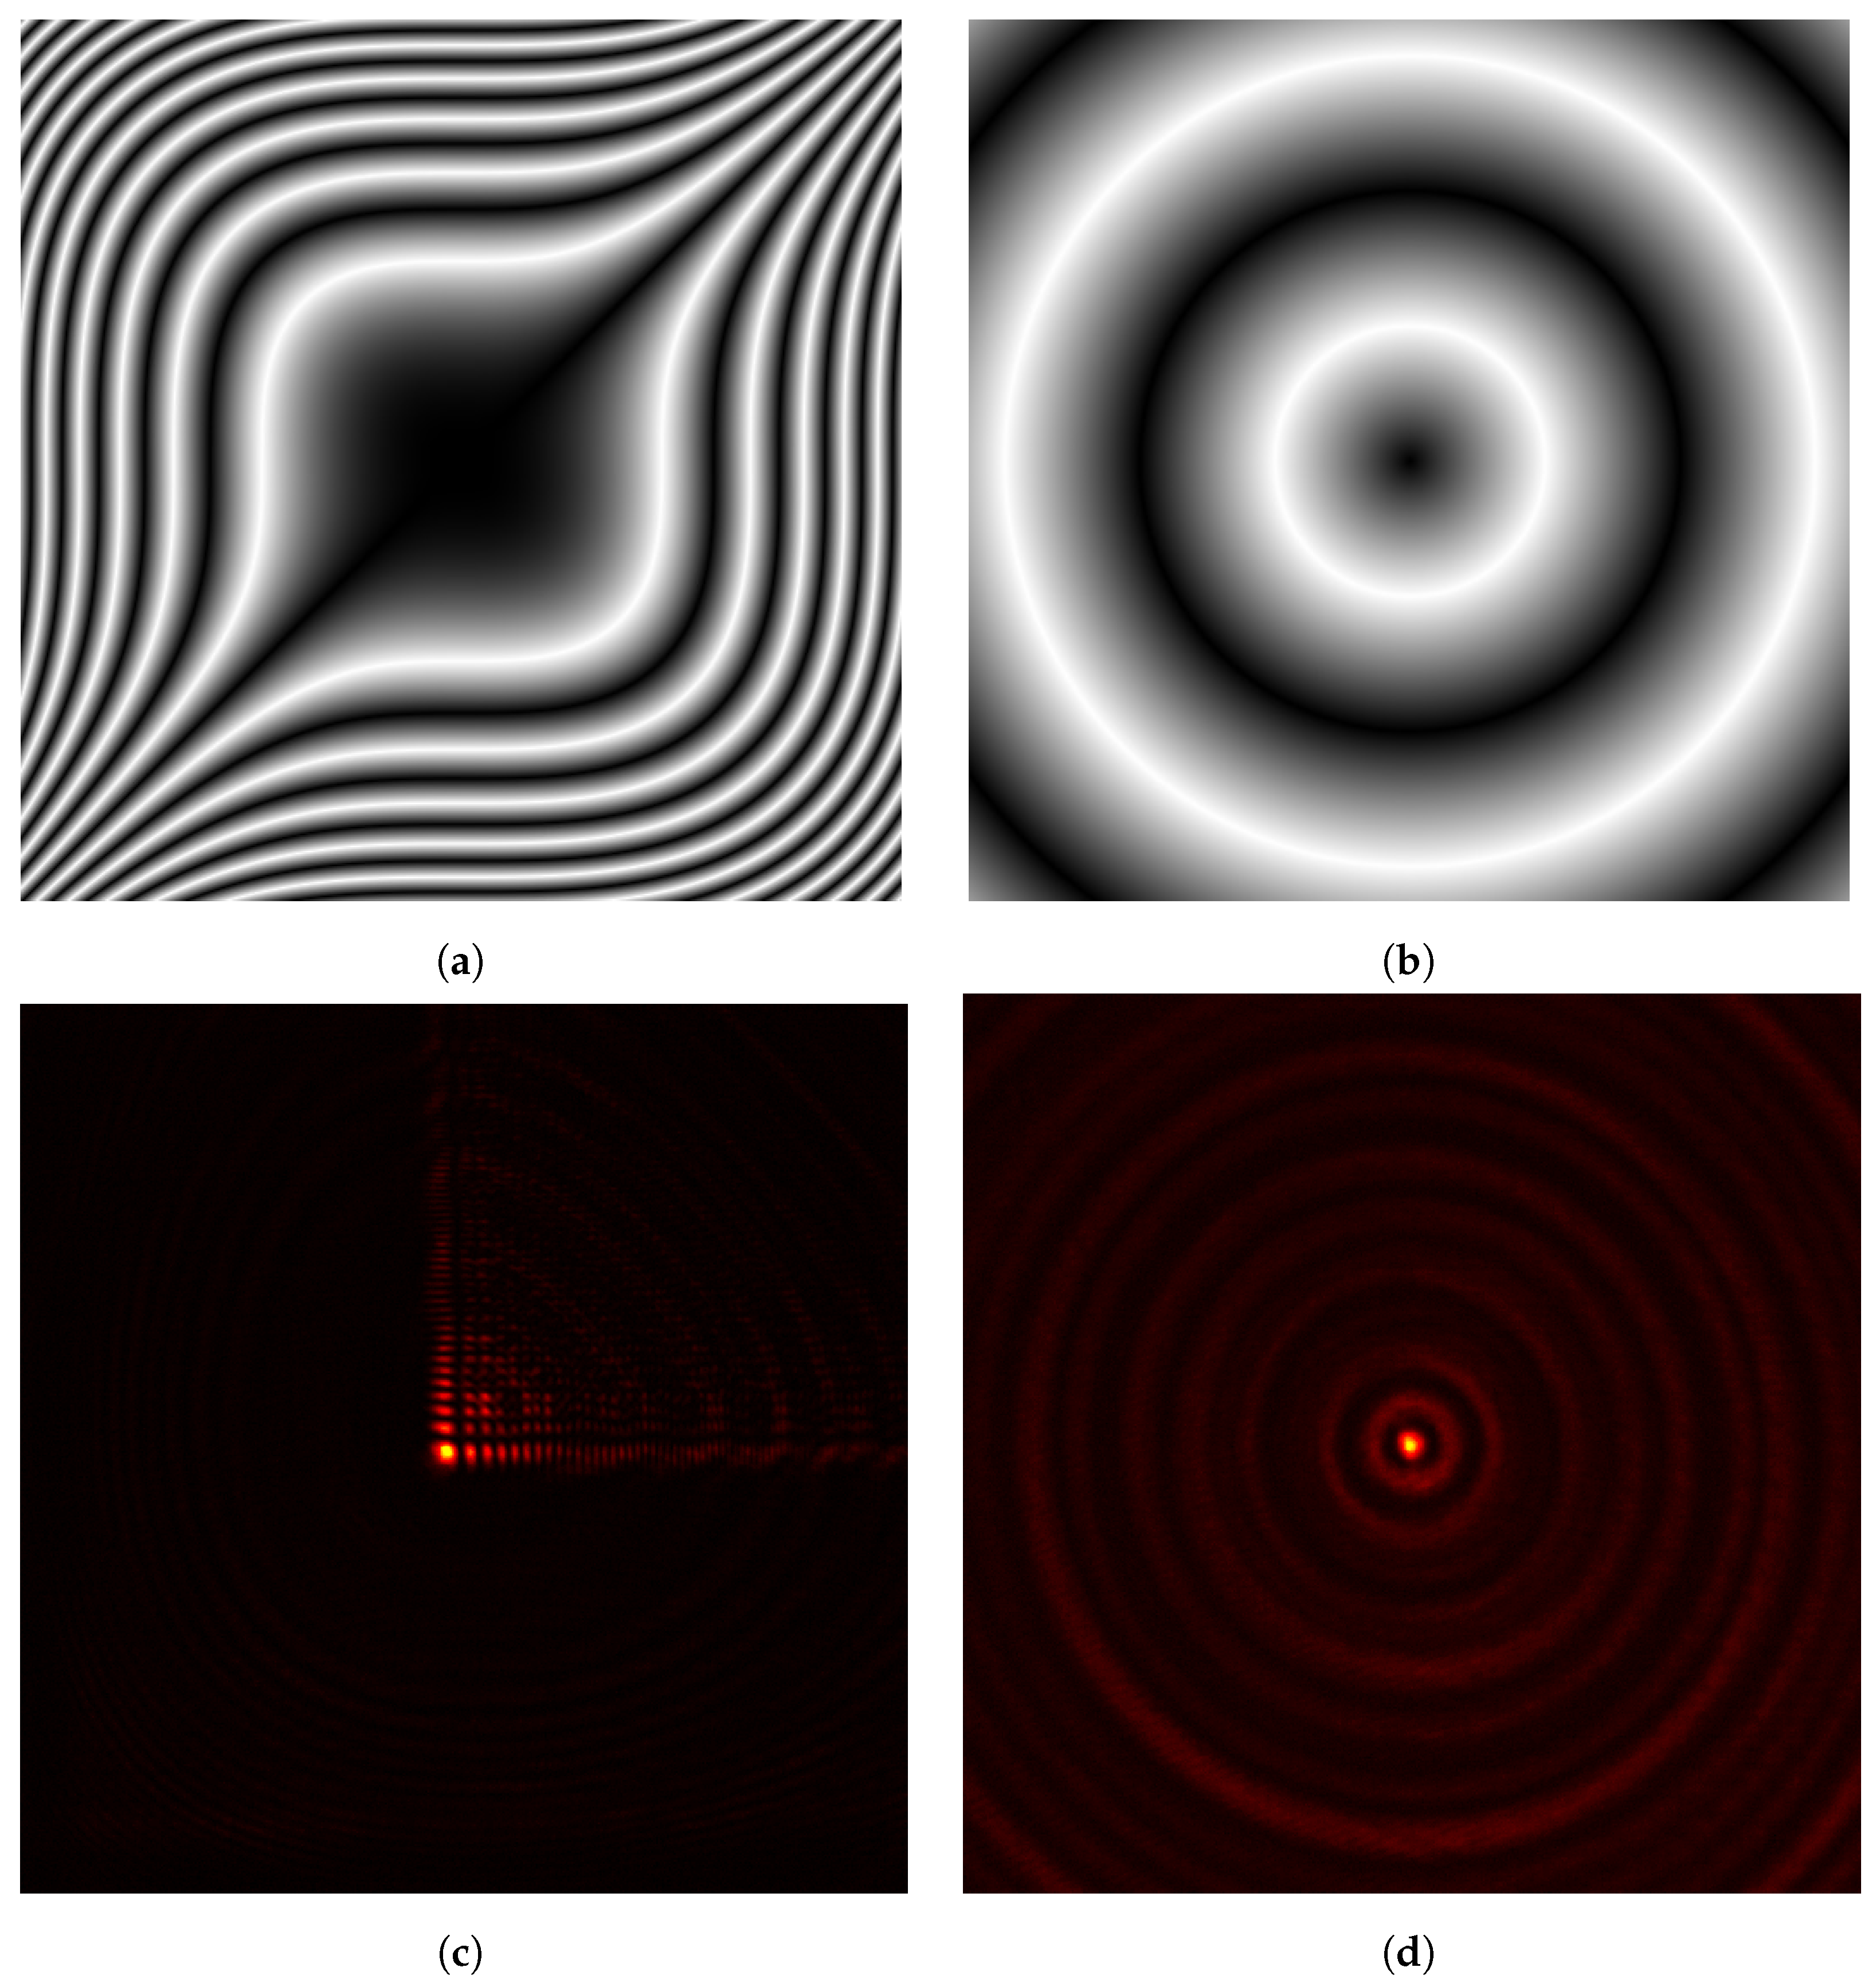
To produce the Airy and Bessel beams, we illuminated the SLM with a TEM00 Gaussian beam and set the SLM phase mask to [34]
Ψ = 1 a 3 k x 3 + k y 3 ,
for an Airy beam—where a is a scale parameter, k x and k y are the spatial coordinates of the SLM pixels (with the origin at the center of the SLM)—and [35]
Ψ n ( k ρ , ϕ ) = n ϕ + 2 π b k ρ ,
for a Bessel beam of order n, where b is a scale parameter, and ( k ρ , ϕ ) are cylindrical coordinates on the SLM with the origin at the center of the SLM. Note that in this study, we will only be considering zero-order Bessel beams which have a central bright spot and rings of decreasing intensity. These differ from higher-order Bessel modes which have a central dark spot. Figure 3 shows an example phase mask that was used and their resulting experimental beam profiles.

3. Results and Discussion

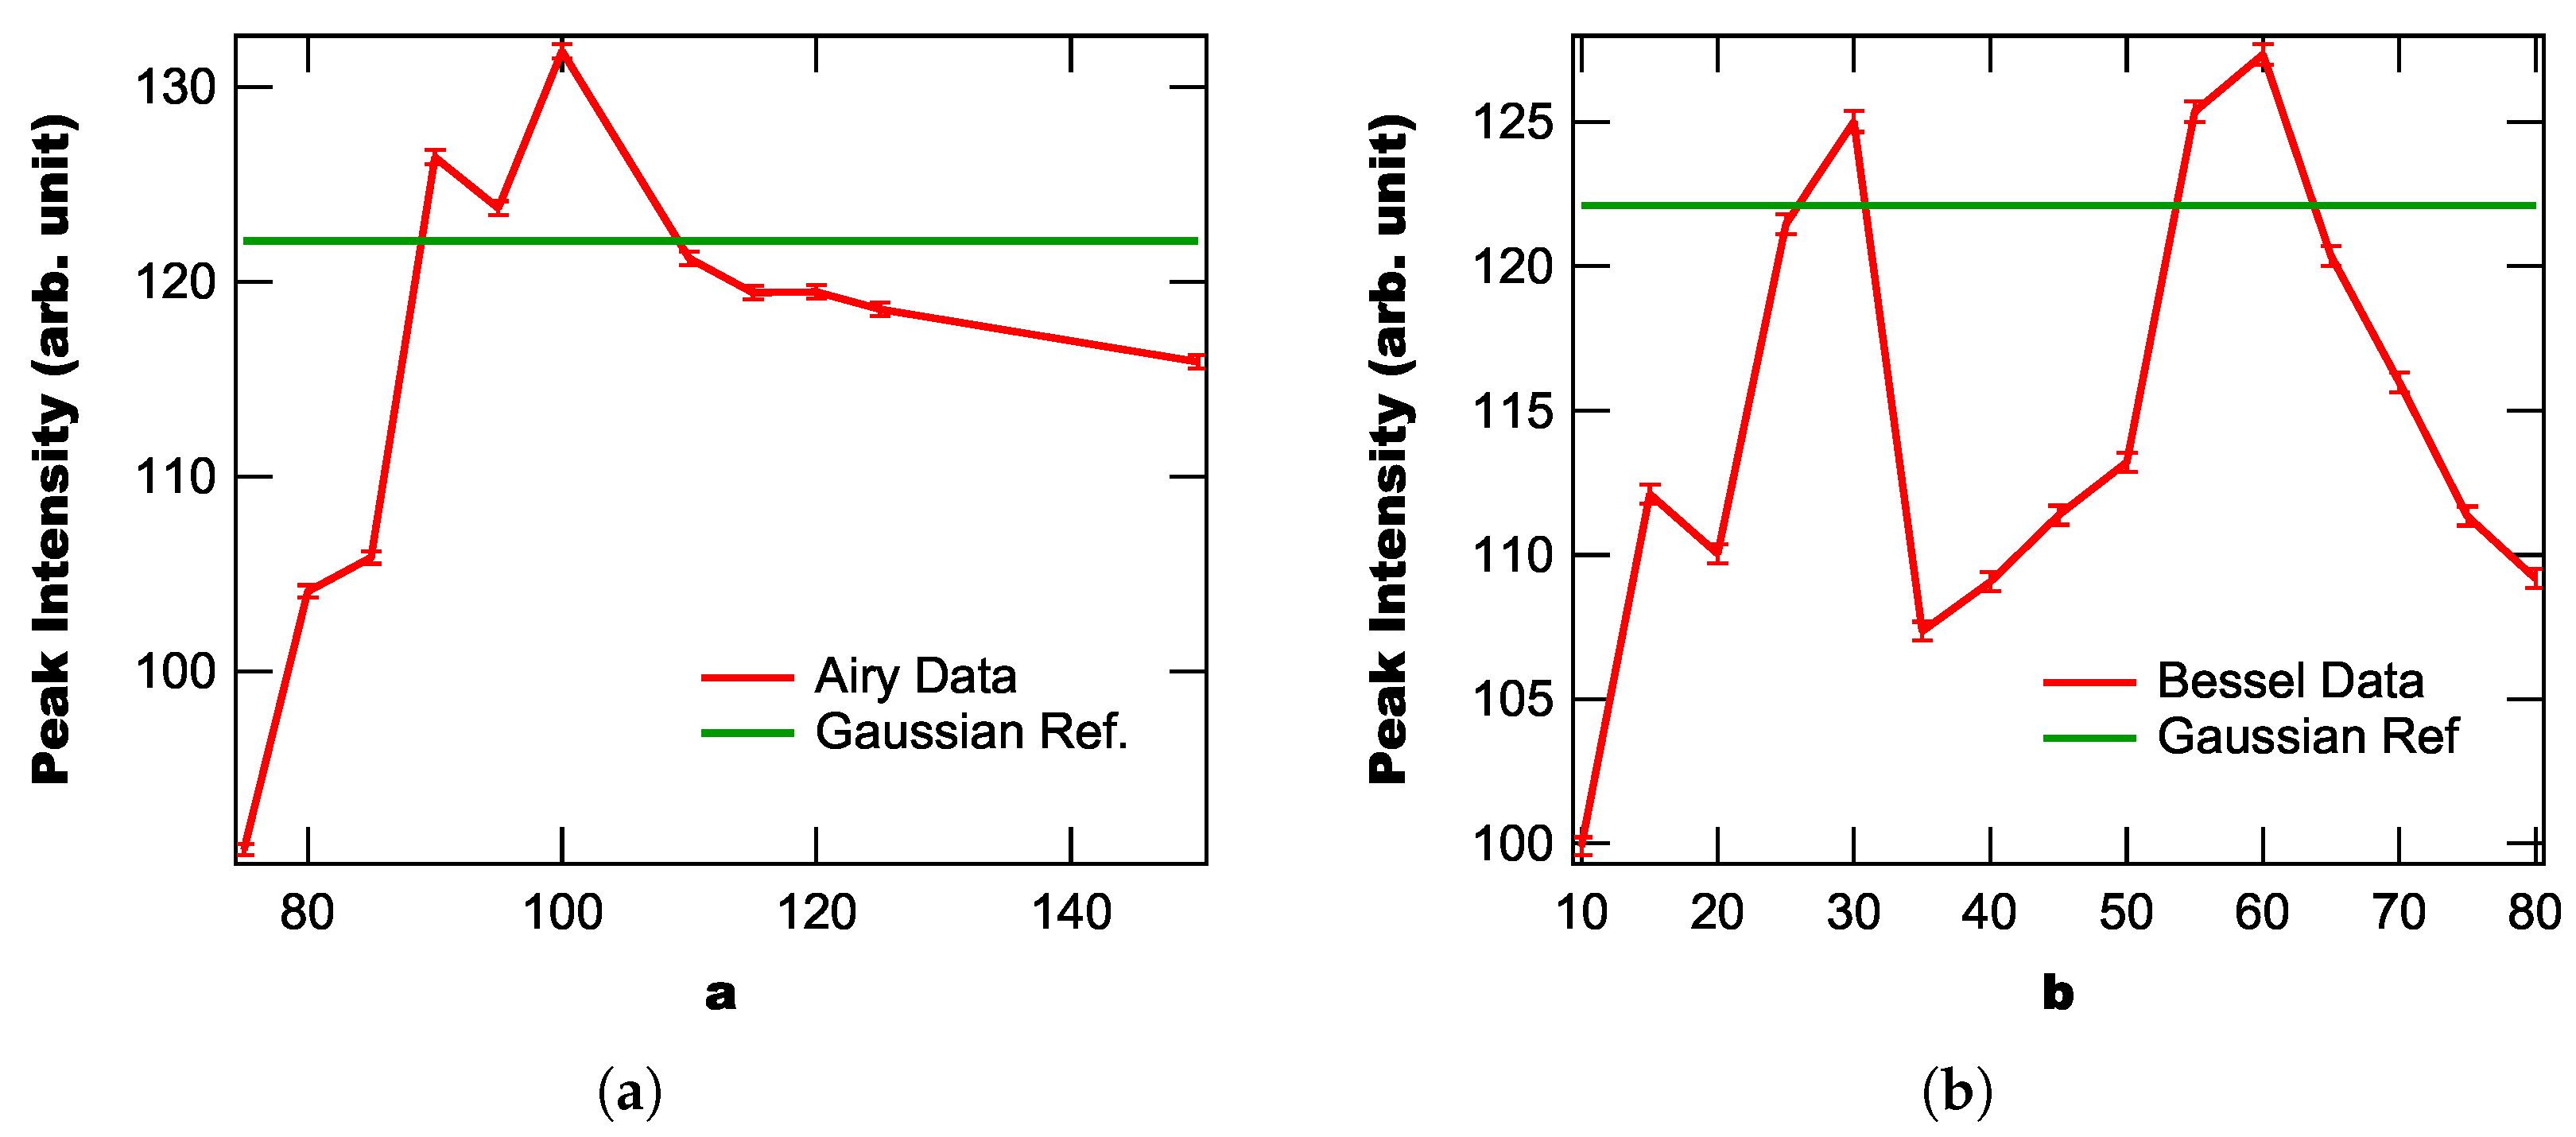
From Equations (1) and (2), we see that the both the Airy and Bessel phase profiles have a single adjustable parameter that affects the resulting beam shape. Additionally, we note that the beam shape at the focus of the microscope objective is also affected by the objectives focal length. However, this is a fixed quantity for our experiments and cannot be varied. To determine the optimal beam parameters for the Airy and Bessel beams, we measured the peak fluorescence intensity from an EYAD particle inside a 50 wt% sample using a series of phase masks generated from Equations (1) and (2) using a range of beam parameters. Additionally, we measured the peak fluorescence intensity for a Gaussian beam for reference. Figure 4 shows the resulting peak intensities for the Airy and Bessel beams for a range of beam parameters. From Figure 4, we find that the measured fluorescence intensity depends strongly on the beam parameter, with only certain beam parameters resulting in intensities higher than the normal Gaussian beam. Namely, the Airy beam peaks at a = 100 , while the Bessel beam peaks at b = 60 . Note that these peak locations are consistent across the different sugar concentrations but depend on the choice of objective focal length as the Airy/Bessel beam quality depends on both the beam parameter and focal length.
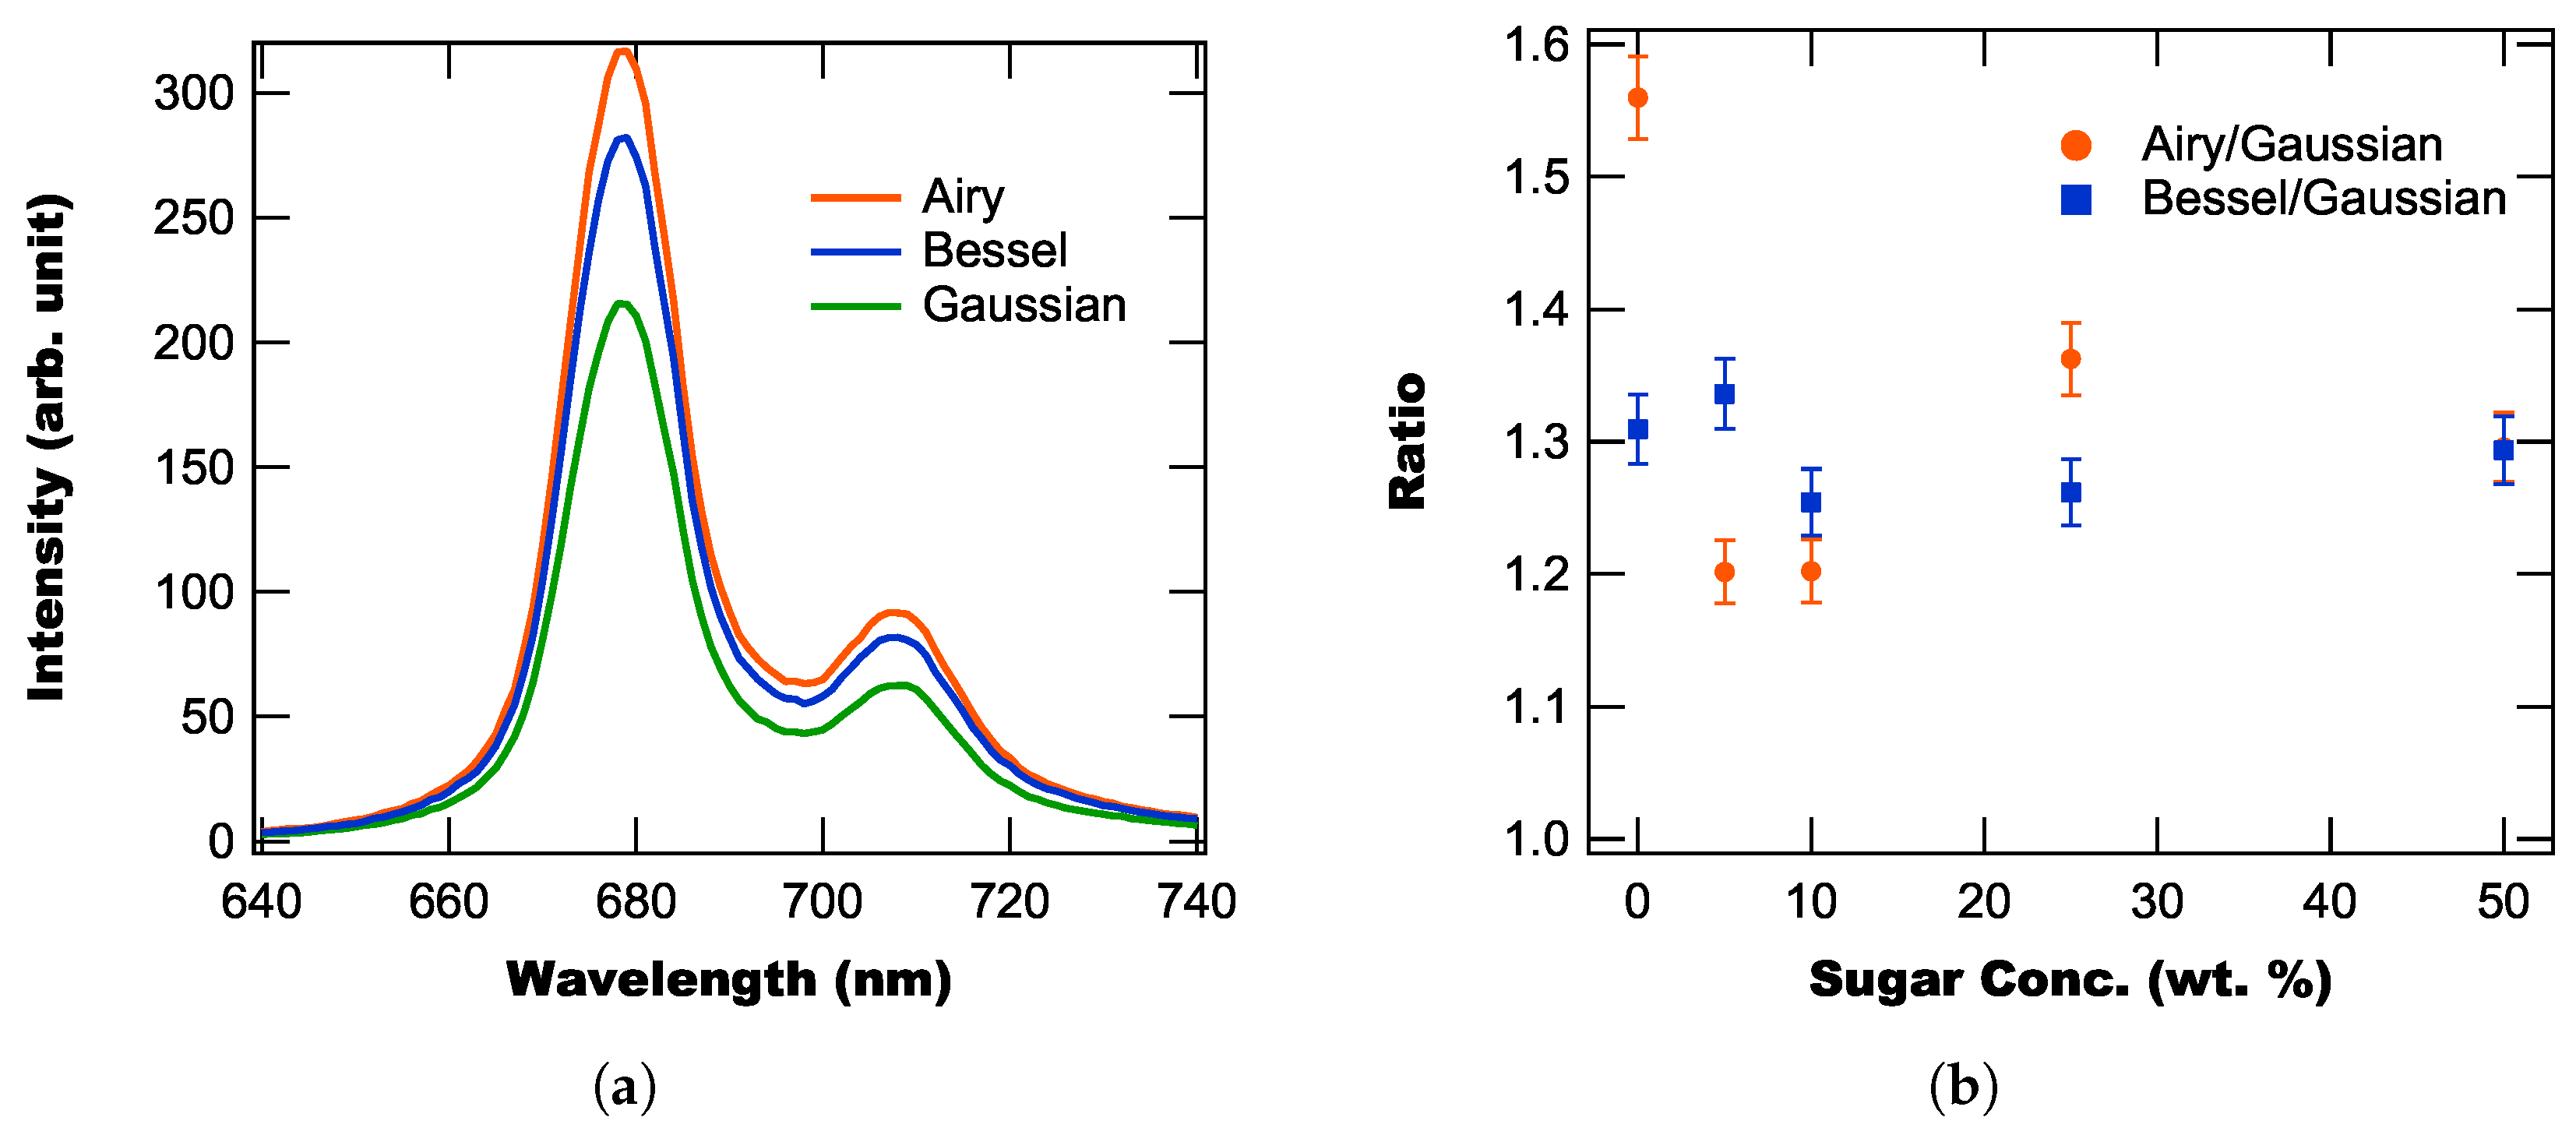
Having determined the optimal beam parameters for our Airy and Bessel beams, we next performed a series of fluorescence measurements using all five samples and all three beam types. For these measurements, we located five separate EYAD particles in each sample and illuminated the samples with each of the three beams while measuring the resulting fluorescence spectra. Figure 5a shows example spectra measured from one spot on the 25 wt% sample using each beam type, with both the Airy and Bessel beams producing greater fluorescence intensities. Note that these intensities are scaled to the beam power incident on the sample to account for variations in pump power due to beam shaping.
After measuring the power-scaled peak intensities at five points on each sample, we next computed the average intensity ratios between the Airy/Bessel beams and the Gaussian beam for each sample, with Figure 5b showing the computed ratios and their standard deviations for each concentration. From Figure 5b, we find that for all sugar concentrations (including no sugar) the self-healing beams produce greater fluorescence intensities than a standard Gaussian beam, with the largest improvement being ≈1.55× for the Airy beam and the 0 wt% sample and the average improvement being 1.3 × . Note that in our previous work using FAWS, we achieved enhancements of up to 40×.
The fluorescence intensity enhancement when using the Airy/Bessel beams can be attributed to the Airy/Bessel beams’ resilience to phase distortions due to the self-healing effect. When each beam is incident on the sample, there is both phase distortion at the polymer surface (which is why we observe enhancement in the 0 wt% case) and scattering from the embedded sugar particles. The self-healing beams resilience to this distortion/scattering results in the beams maintaining their compact form, while the Gaussian beam diverges due to the distortion/scattering. To further demonstrate this difference, we plot example fluorescence images in Figure 6 for each beam and the 50 wt% sample with several fluorescent particles nearby to each other. For the Guassian beam, the excitation is broad and excites all four particles. However, in the case of the Airy beam only, the primary particle and the nearest particle are excited, while for the Bessel beam, there is some excitation of the farther particles but less than observed for the Gaussian beam. These images show that the excitation beam profile at the target particle is more compact for the Airy/Bessel beams than for the Gaussian beam, which we attribute to the Airy/Bessel beams resilience to phase distortion.
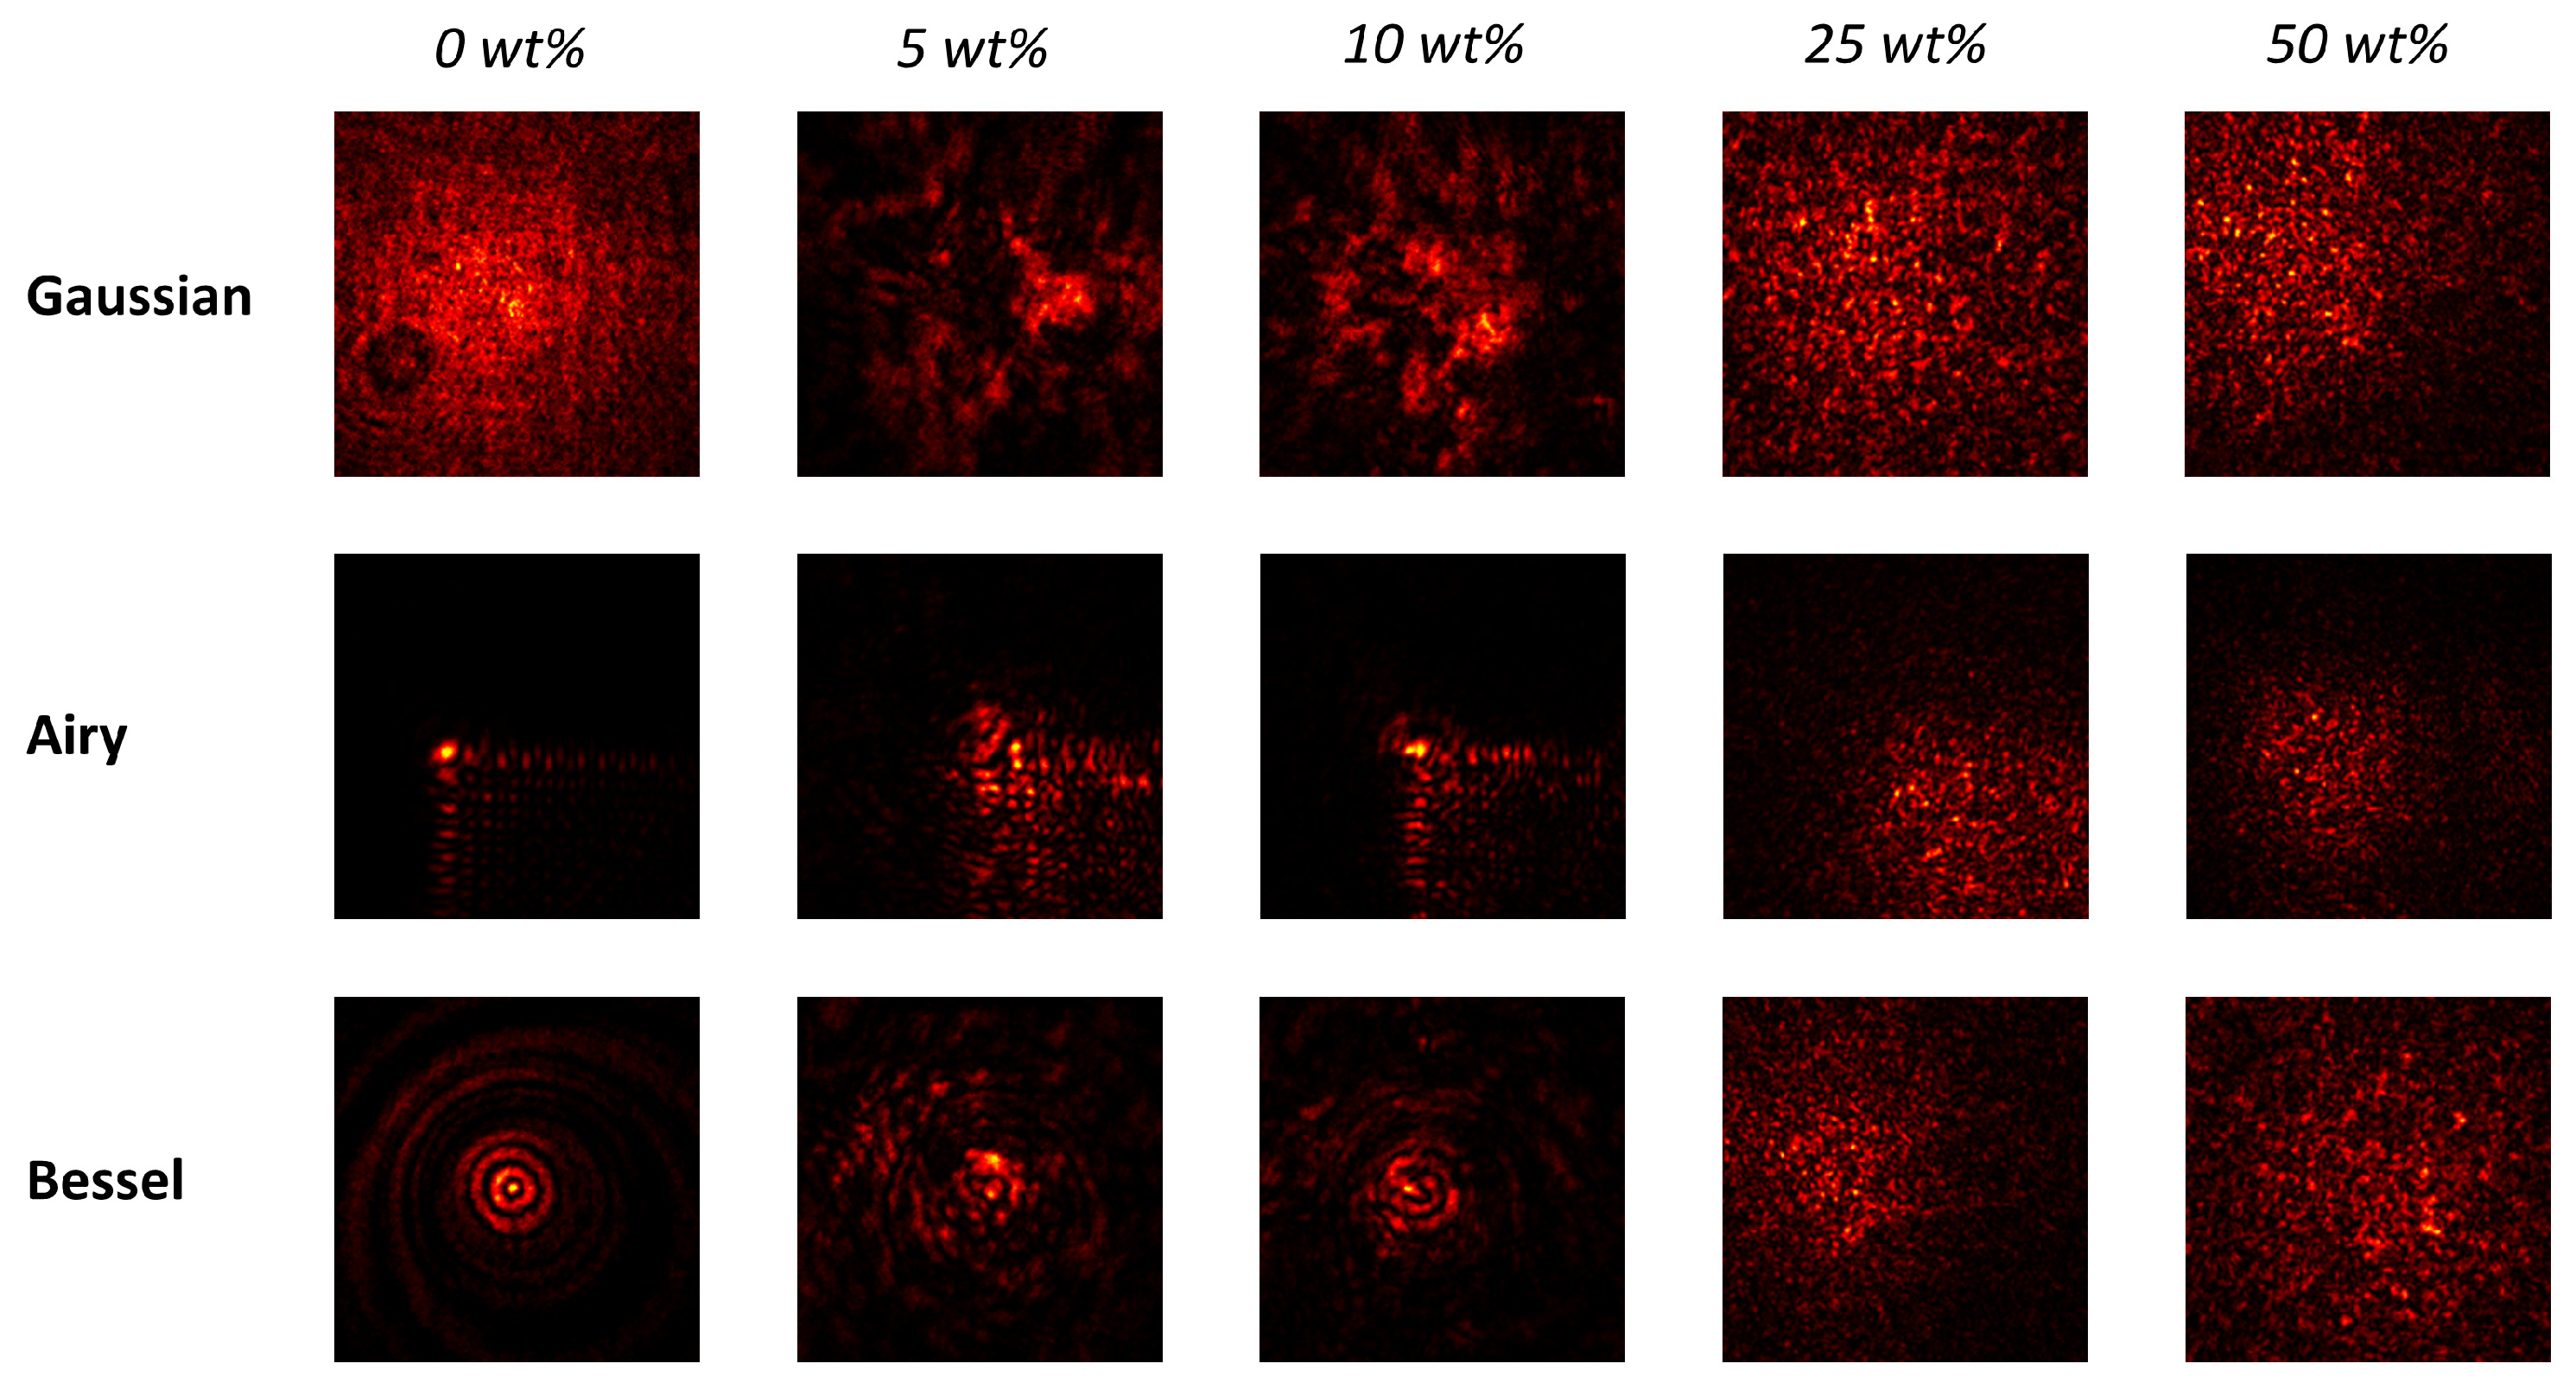
To better understand how each beam type behaves when transmitted through the scattering layer, we imaged each beam type transmitted through the scattering layer for each sugar concentration, with the resulting images shown in Figure 7. From Figure 7, we find that for the Gaussian beam, a speckle pattern emerges as soon as we introduce scattering with the speckle grains decreasing in size as the concentration increases. However, when we consider the self-healing Airy and Bessel beams, we find that the beam shape is partially recovered after passing through both the 5 wt% and 10 wt% concentration samples, while a speckle pattern is observed once again for concentration of 25 wt% and 50 wt%.
Additionally, we take line profiles across the center of the beams to better visualize the shape of the intensity patterns, with Figure 8 showing the normalized line profiles for each beam and sugar concentration. From Figure 8, we make several observations. First, we find that for the 0 wt% sample the beam shape is roughly Gaussian with fluctuations, which we attribute to phase distortion caused by the polymer’s surface not being perfectly flat. However, both the Airy and Bessel beams display expected profiles, which we attribute to their resistance to distortion. Next, we find that as the sugar concentration increases to 5 wt% and 10 wt% the Gaussian beam’s transmitted line profile drastically diverges from the 0 wt% beam shape, while both the Airy and Bessel beams are only slightly modified. Finally, for the 25 wt% and 50 wt% line profiles, we observe that while there is speckle in all three beams, the Airy beam still maintains some similarity to the original beam with the speckle being more localized.
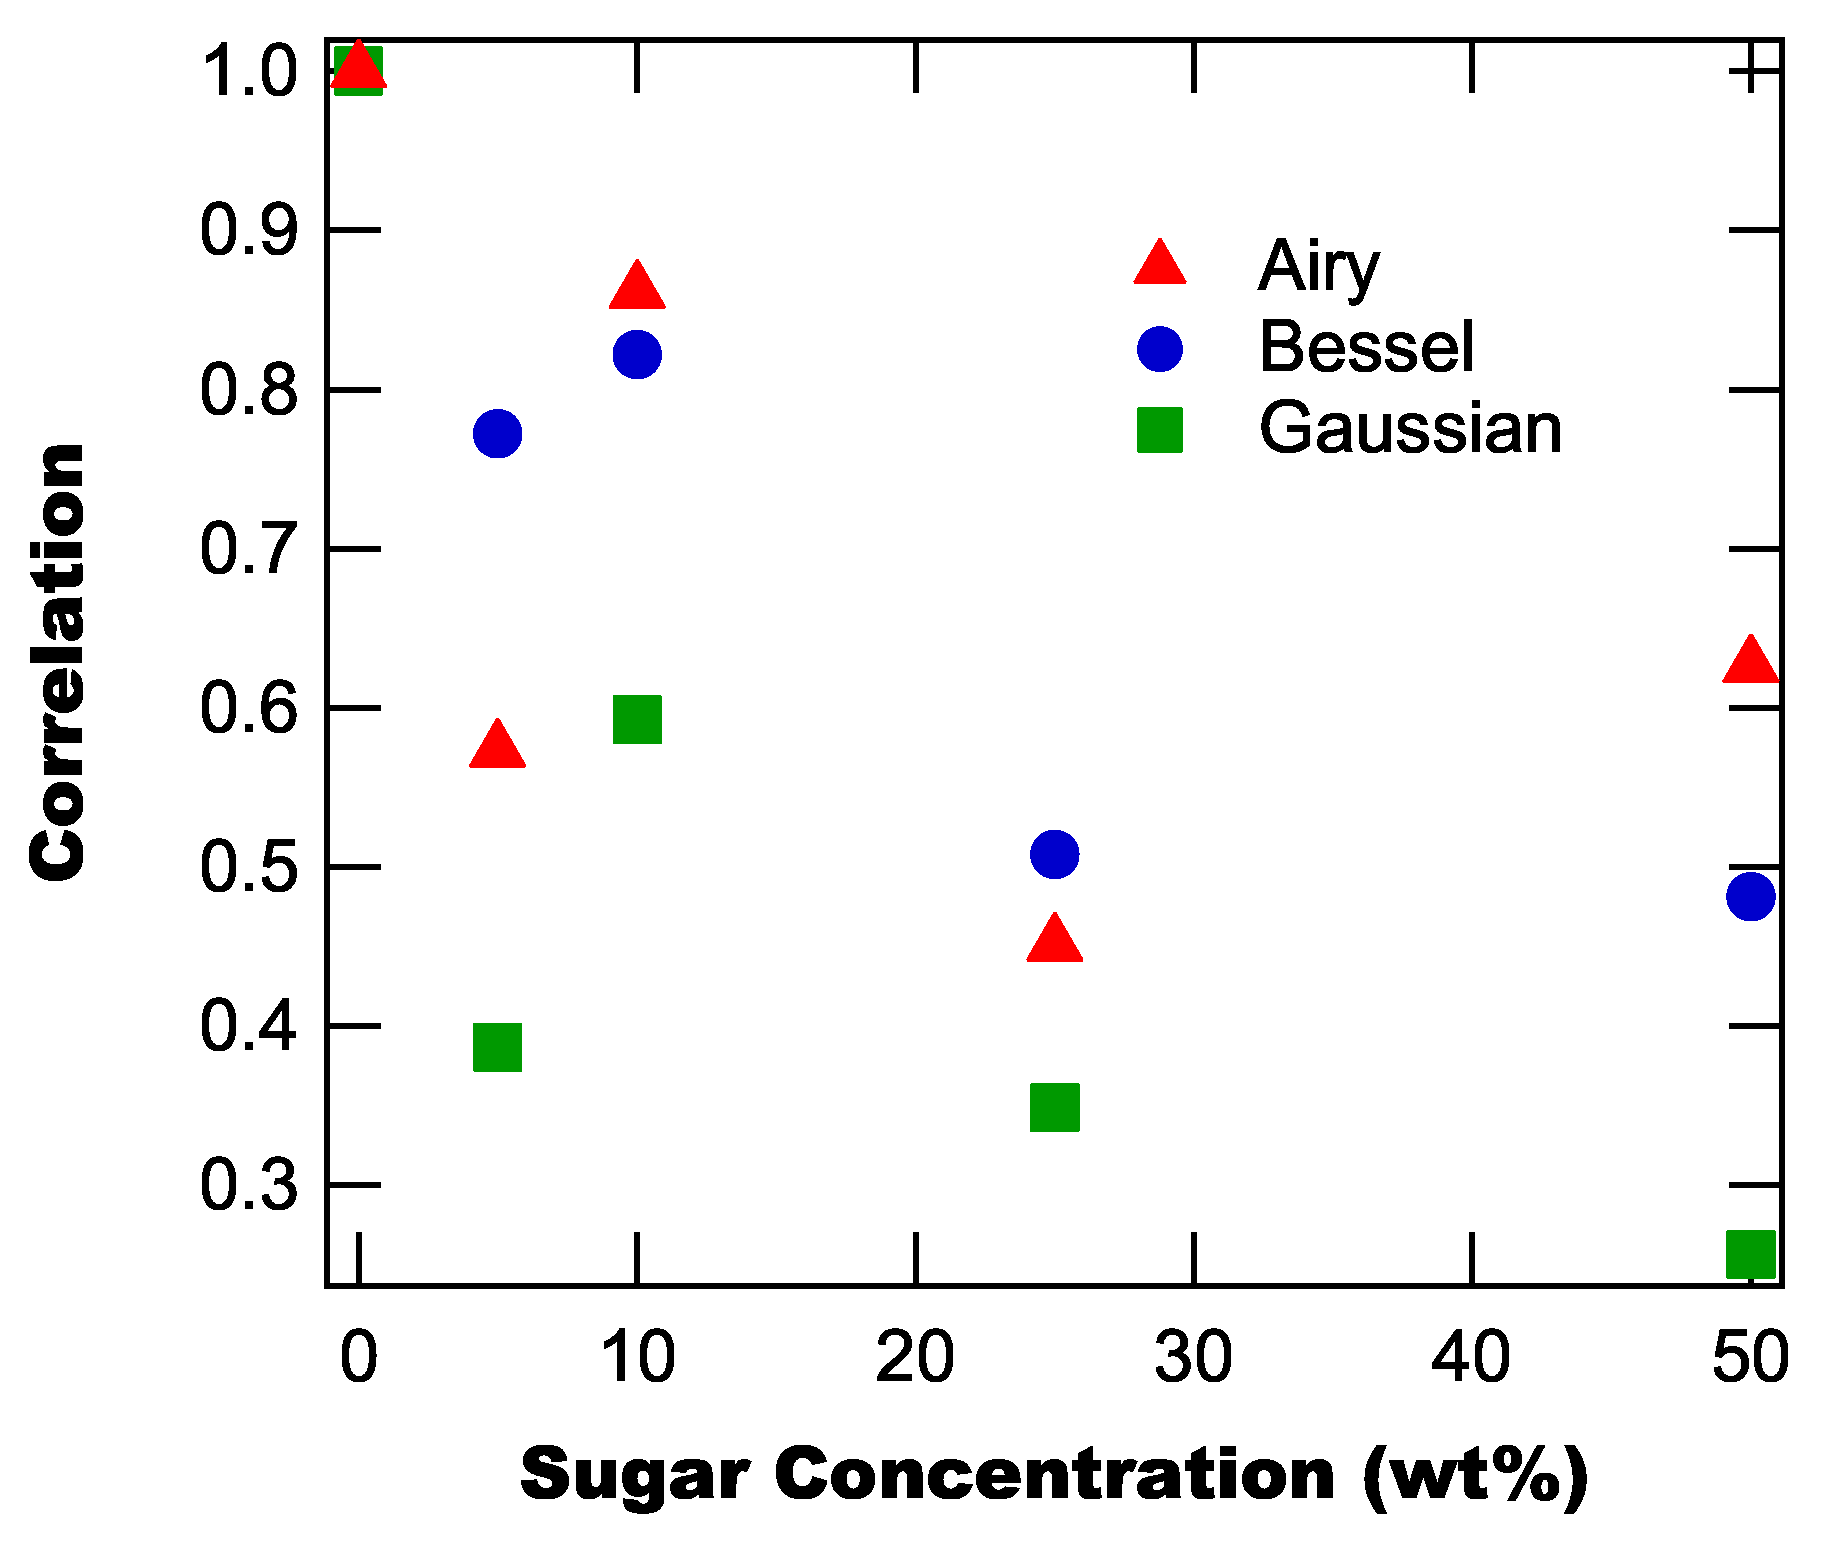
Thus far, we have been considering a qualitative comparison of the different beam shapes after passing through the sample. However, we can also perform a quantitative comparison by calculating the Pearson’s correlation coefficient between the different sugar concentrations and the 0 wt% image. Figure 9 shows the resulting correlation coefficients as a function of sugar concentration. From Figure 9, we find that as the sugar concentration increases, the correlation coefficient decreases for each beam type, but for all concentrations, the Airy and Bessel beam outperform the Gaussian beam. This is expected as both the Airy and Bessel beams are more resilient to phase distortion.

4. Conclusions

Self-healing laser beams are a useful class of beam shapes that can aid in propagation through turbid media due to their ability to reform their shape after an obstruction or distortion. In this study, we have tested two different self-healing laser beam shapes (Airy and Bessel) for propagation through heterogeneous polymer samples at different scatterer concentrations. We find that for the samples used, the self-healing beams are capable of recovering their beam shapes after samples containing 5 wt% and 10 wt%, but higher concentrations result in disordered speckle patterns.
We also test the feasibility of using these beams for subsurface spectroscopy inside heterogeneous materials by preparing samples containing fluorescent EYAD particles on a glass slide coated by a heterogeneous polymer matrix containing sugar crystals. We find that for all scatterer concentrations, the Airy and Bessel beams provide improved spectral intensity as compared to a standard Gaussian beam with the mechanism of this improvement being a better resilience to phase distortion. However, while we observe improved intensity with the Airy and Bessel beams, we find that the observed enhancement is <1.55× with an average value of 1.3× which is negligible compared to other techniques that can obtain enhancements of 40× or greater. These results imply that while this approach has promise at propagating these beams through scattering materials (with sufficiently low scatterer concentrations, it is not a viable technique for improving subsurface spectroscopy in heterogeneous materials.

Author Contributions

H.E. and B.R.A. conceived of the experiments. N.G. prepared the samples. B.R.A. performed the experiments, data analysis, and wrote the manuscript with input from all authors. All authors have read and agreed to the published version of the manuscript.

Funding

This work was supported by the National Nuclear Security Administration, Award # DE-NA0004083 to Washington State University.

Data Availability Statement

Data underlying the results presented in this paper are available from the authors upon reasonable request.

Conflicts of Interest

The authors declare no conflicts of interest.

References

  1. Anderson, B.R.; Gese, N.; Eilers, H. Monitoring Sub-surface Chemical Reactions in Heterogeneous Materials Using Wavefront-shaping-assisted Bidirectional Focusing. Opt. Lett. 2022, 47, 2036–2039. [Google Scholar] [CrossRef] [PubMed]
  2. Anderson, B.R.; Gese, N.; Eilers, H. Spectroscopic properties of Eu:Y(acac)3(DPEPO) and characterization of its photo- and thermal- degradation. J. Lumin. 2022, 251, 119183. [Google Scholar] [CrossRef]
  3. Anderson, B.R.; Gese, N.J.; Eilers, H. Subsurface spectroscopy of heterogeneous materials using optical wavefront shaping. AIP Conf. Proc. 2023, 2844, 260001. [Google Scholar] [CrossRef]
  4. Anderson, B.R.; Gese, N.; Eilers, H. Subsurface Spectroscopy of Thermal Degradation Inside an Inert PBX Simulant Using Feedback-assisted Wavefront Shaping. Appl. Spectrosc. 2024, in press. [Google Scholar]
  5. Vellekoop, I. Feedback-based Wavefront Shaping. Opt. Express 2015, 23, 12190–12206. [Google Scholar] [CrossRef]
  6. Moore, D.S. Probing Dynamic Processes in Explosives and Propellants—Science Issues. AIP Conf. Proc. 2018, 1979, 100028. [Google Scholar] [CrossRef]
  7. Shen, Y.; Pidishety, S.; Nape, I.; Dudley, A. Self-healing of structured light: A review. J. Opt. 2022, 24, 103001. [Google Scholar] [CrossRef]
  8. Zhang, Z.; Liang, X.; Goutsoulas, M.; Li, D.; Yang, X.; Yin, S.; Xu, J.; Christodoulides, D.N.; Efremidis, N.K.; Chen, Z. Robust propagation of pin-like optical beam through atmospheric turbulence. APL Photonics 2019, 4, 076103. [Google Scholar] [CrossRef]
  9. Vetter, C.; Steinkopf, R.; Bergner, K.; Ornigotti, M.; Nolte, S.; Gross, H.; Szameit, A. Realization of Free-Space Long-Distance Self-Healing Bessel Beams. Laser Photonics Rev. 2019, 13, 1900103. [Google Scholar] [CrossRef]
  10. Li, S.; Wang, J. Adaptive free-space optical communications through turbulence using self-healing Bessel beams. Sci. Rep. 2017, 7, 43233. [Google Scholar] [CrossRef]
  11. Birch, P.; Ituen, I.; Young, R.; Chatwin, C. Long-distance Bessel beam propagation through Kolmogorov turbulence. J. Opt. Soc. Am. A 2015, 32, 2066. [Google Scholar] [CrossRef] [PubMed]
  12. Zhao, S.; Zhang, W.; Wang, L.; Li, W.; Gong, L.; Cheng, W.; Chen, H.; Gruska, J. Propagation and self-healing properties of Bessel–Gaussian beam carrying orbital angular momentum in an underwater environment. Sci. Rep. 2019, 9, 2019. [Google Scholar] [CrossRef] [PubMed]
  13. Morgan, K.S.; Miller, J.K.; Li, W.; Li, Y.; Johnson, E.G. Higher order bessel beams integrated in time (HOBBIT) for free space underwater sensing and communication. In OCEANS 2017—Anchorage; IEEE: New York, NY, USA, 2017; pp. 1–4. [Google Scholar]
  14. Vettenburg, T.; Dalgarno, H.I.C.; Nylk, J.; Coll-Lladó, C.; Ferrier, D.E.K.; Čižmár, T.; Gunn-Moore, F.J.; Dholakia, K. Light-sheet microscopy using an Airy beam. Nat. Methods 2014, 11, 541–544. [Google Scholar] [CrossRef] [PubMed]
  15. Bando, K.; Yabuuchi, S.; Li, M.; Kubo, T.; Oketani, R.; Smith, N.I.; Fujita, K. Bessel-beam illumination Raman microscopy. Biomed. Opt. Express 2022, 13, 3161. [Google Scholar] [CrossRef] [PubMed]
  16. Garces-Chavez, V.; McGloin, D.; Melville, H.; Sibbett, W.; Dholakia, K. Simultaneous micromanipulation in multiple planes using a self-reconstructing light beam. Nature 2002, 419, 145–147. [Google Scholar] [CrossRef] [PubMed]
  17. Yang, Y.; Ren, Y.X.; Chen, M.; Arita, Y.; Rosales-Guzmán, C. Optical trapping with structured light: A review. Adv. Photonics 2021, 3, 034001. [Google Scholar] [CrossRef]
  18. Otte, E.; Denz, C. Optical trapping gets structure: Structured light for advanced optical manipulation. Appl. Phys. Rev. 2020, 7. [Google Scholar] [CrossRef]
  19. Lib, O.; Bromberg, Y. Spatially entangled Airy photons. Opt. Lett. 2020, 45, 1399. [Google Scholar] [CrossRef]
  20. Baghdasaryan, B.; Steinlechner, F.; Fritzsche, S. Characterization of opening angle correlations of a biphoton state decomposed in Bessel modes. Phys. Rev. A 2020, 101, 043844. [Google Scholar] [CrossRef]
  21. Forbes, A.; Nape, I. Quantum mechanics with patterns of light: Progress in high dimensional and multidimensional entanglement with structured light. AVS Quantum Sci. 2019, 1, 011701. [Google Scholar] [CrossRef]
  22. Matsumoto, N.; Ando, T.; Inoue, T.; Ohtake, Y.; Fukuchi, N.; Hara, T. Generation of high-quality higher-order Laguerre–Gaussian beams using liquid-crystal-on-silicon spatial light modulators. J. Opt. Soc. Am. A 2008, 25, 1642. [Google Scholar] [CrossRef] [PubMed]
  23. Yan, M.; Ma, L. Generation of Higher-Order Hermite–Gaussian Modes via Cascaded Phase-Only Spatial Light Modulators. Mathematics 2022, 10, 1631. [Google Scholar] [CrossRef]
  24. Conry Young, J.P.; Dix, S. Generation of Generalized–Gauss Laser Beams via a Spatial Light Modulator. J. Ark. Acad. Sci. 2018, 72, 14–18. [Google Scholar] [CrossRef]
  25. Sundin, E.M.; Navarro, G.; Li, C. Modulated high-order Hermite–Gaussian beams with uniform intensity distribution. Opt. Commun. 2024, 554, 130217. [Google Scholar] [CrossRef]
  26. Conti, C.; Botteon, A.; Colombo, C.; Pinna, D.; Realini, M.; Matousek, P. Advances in Raman spectroscopy for the non-destructive subsurface analysis of artworks: Micro-SORS. J. Cult. Herit. 2020, 43, 319–328. [Google Scholar] [CrossRef]
  27. Mosca, S.; Conti, C.; Stone, N.; Matousek, P. Spatially offset Raman spectroscopy. Nat. Rev. Methods Prim. 2021, 1, 21. [Google Scholar] [CrossRef]
  28. Matousek, P.; Stone, N. Development of deep subsurface Raman spectroscopy for medical diagnosis and disease monitoring. Chem. Soc. Rev. 2016, 45, 1794–1802. [Google Scholar] [CrossRef] [PubMed]
  29. Mosca, S.; Dey, P.; Salimi, M.; Gardner, B.; Palombo, F.; Stone, N.; Matousek, P. Spatially Offset Raman Spectroscopy—How Deep? Anal. Chem. 2021, 93, 6755–6762. [Google Scholar] [CrossRef]
  30. Matousek, P. Inverse Spatially Offset Raman Spectroscopy for Deep Noninvasive Probing of Turbid Media. Appl. Spectrosc. 2006, 60, 1341–1347. [Google Scholar] [CrossRef]
  31. Mustafa, H.A.; Akkus, O. Comparison of diffuse versus inverse spatially-offset Raman spectroscopy modalities for analyte detection through barriers. Vib. Spectrosc. 2021, 113, 103228. [Google Scholar] [CrossRef]
  32. Khan, K.M.; Dutta, S.B.; Krishna, H.; Majumder, S.K. Inverse SORS for detecting a low Raman-active turbid sample placed inside a highly Raman-active diffusely scattering matrix—A feasibility study. J. Biophotonics 2016, 9, 879–887. [Google Scholar] [CrossRef] [PubMed]
  33. Khan, K.M.; Dutta, S.B.; Kumar, N.; Dalal, A.; Srivastava, A.; Krishna, H.; Majumder, S.K. Inverse spatially-offset Raman spectroscopy using optical fibers: An axicon lens-free approach. J. Biophotonics 2019, 12, e201900140. [Google Scholar] [CrossRef] [PubMed]
  34. Siviloglou, G.A.; Christodoulides, D.N. Accelerating finite energy Airy beams. Opt. Lett. 2007, 32, 979. [Google Scholar] [CrossRef] [PubMed]
  35. Chattrapiban, N.; Rogers, E.A.; Cofield, D.; Hill, W.T.; Roy, R. Generation of nondiffracting Bessel beams by use of a spatial light modulator. Opt. Lett. 2003, 28, 2183–2185. [Google Scholar] [CrossRef] [PubMed]
Figure 1. Layered sample structure used in this study.
Optics 05 00022 g001
Figure 2. Schematic of experimental setup used to test self-healing beam propagation and spectroscopy. HWP: halfwave plate; L1/L2/L3: lenses; PH: pinhole; P: polarizer; BS: beam splitter; BD: beam dump; Obj 1/2: objectives; SPF: short-pass filter; LPF: long-pass filter.
Optics 05 00022 g002
Figure 3. Example Airy and Bessel phase masks (a,b) and their corresponding beam profiles (c,d). Note that for the phase masks the Airy shape parameter is a = 100 and the Bessel shape parameter is b = 60 .
Optics 05 00022 g003
Figure 4. Peak fluorescence intensity as a function of beam parameter for an Airy (a) and Bessel (b) beam using a 50 wt% sugar concentration sample.
Optics 05 00022 g004
Figure 5. Example fluorescence spectra measured from the 25 wt% concentration sample for the three beam types (Airy, Bessel, and Gaussian) (a) and the sample-averaged intensity ratios as a function of sugar concentration (b).
Optics 05 00022 g005
Figure 6. Fluorescence images of EYAD particles for the three different beam types for the 50 wt% sample.
Optics 05 00022 g006
Figure 7. Example images of beams transmitted through heterogeneous samples containing different sugar concentrations for Gaussian, Airy, and Bessel beams.
Optics 05 00022 g007
Figure 8. Line profiles across transmitted beam images for each beam type and concentration.
Optics 05 00022 g008
Figure 9. Correlation coefficient between 0 wt% beam and different sugar concentrations for each beam type.
Optics 05 00022 g009
Disclaimer/Publisher’s Note: The statements, opinions and data contained in all publications are solely those of the individual author(s) and contributor(s) and not of MDPI and/or the editor(s). MDPI and/or the editor(s) disclaim responsibility for any injury to people or property resulting from any ideas, methods, instructions or products referred to in the content.