
Gold Nanoparticles as Contrast Agents in Ophthalmic Imaging


 ,
,  and
and 
Abstract
1. Introduction
2. Results
2.1. Imaging in Ophthalmology
2.1.1. Optical Coherence Tomography
2.1.2. Photoacoustic Imaging
2.1.3. Molecular Ophthalmic Imaging
2.2. Gold Nanoparticles
2.2.1. Preparation Methods of Gold Nanoparticles
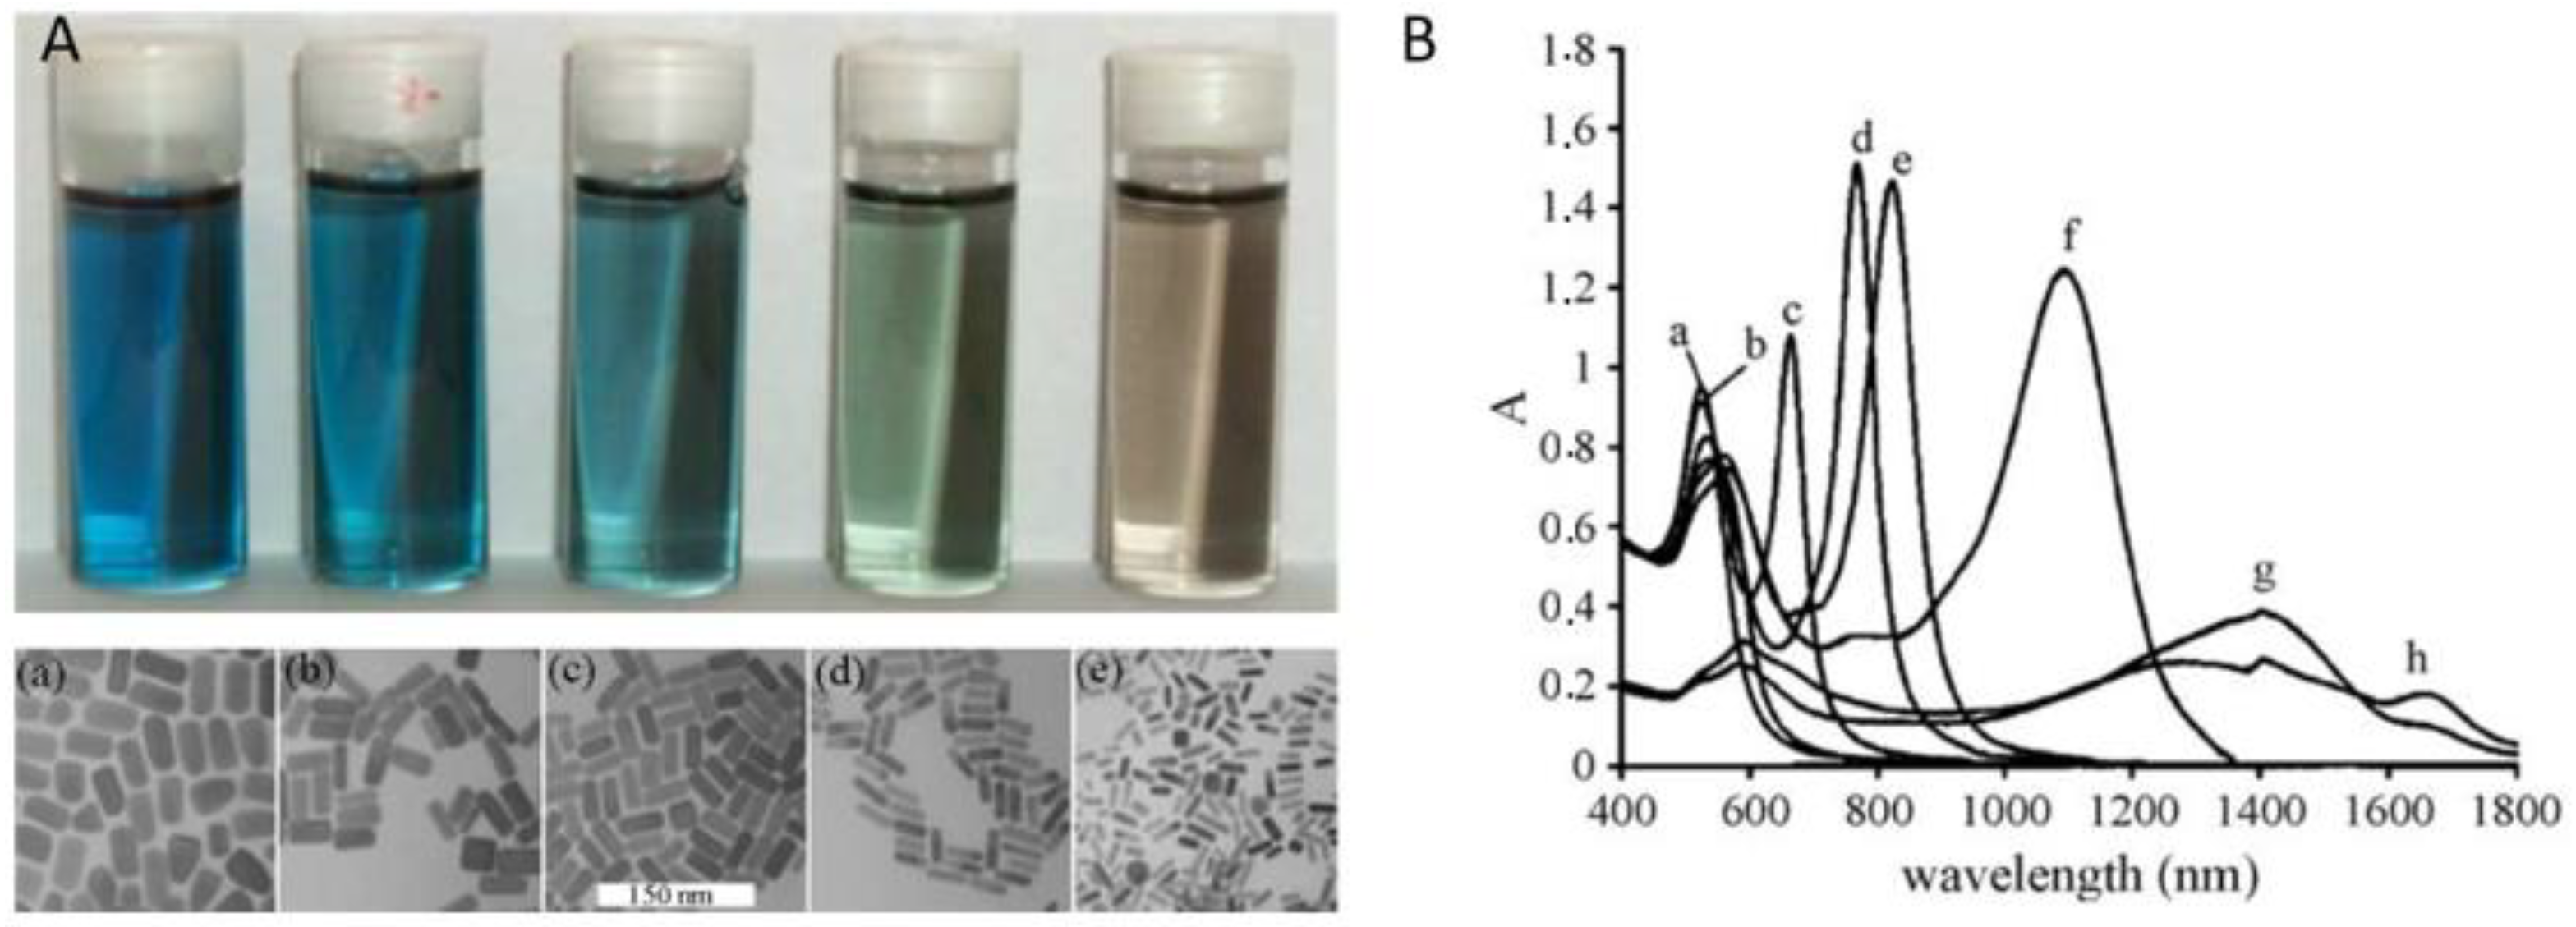
2.2.2. Optical Properties of Gold Nanoparticles
2.3. Studies Investigating the Use of Gold Nanoparticles as Contrast Agents (CAs) for OCT and PAI
2.3.1. Gold Nanoparticles as Contrast Agents for Optical Coherence Tomography
In Vitro Studies
Ex Vivo Studies
In Vivo Studies
2.3.2. Gold Nanoparticles as Contrast Agents for Photoacoustic Imaging
In Vitro Studies
Ex Vivo Studies
In Vivo Studies
2.3.3. Gold Nanoparticles as Contrast Agents for a Multimodal OCT & PAI System
In Vitro Studies
In Vivo Studies
2.4. Ocular Distribution and Safety of Gold Nanoparticles
2.4.1. Factors Affecting Distribution and Safety of Gold Nanoparticles
2.4.2. Studies Investigating Ocular Distribution and Safety of Gold Nanoparticles
In Vitro Studies
Ex Vivo Studies
In Vivo Studies
3. Conclusions
Author Contributions
Funding
Institutional Review Board Statement
Informed Consent Statement
Data Availability Statement
Acknowledgments
Conflicts of Interest
References
- Feynman, R.P. There’s plenty of room at the bottom. Eng. Sci. 1960, 23, 22–36. [Google Scholar]
- Kannan, R.M.; Xu, Q.; Kambhampati, S.P. Nanotechnology approaches for ocular drug delivery. Middle East Afr. J. Ophthalmol. 2013, 20, 26–37. [Google Scholar] [CrossRef] [PubMed]
- Kamaleddin, M.A. Nano-ophthalmology: Applications and considerations. Nanomed. Nanotechnol. Biol. Med. 2017, 13, 1459–1472. [Google Scholar] [CrossRef] [PubMed]
- Meleppat, R.K.; Zhang, P.; Ju, M.J.; Manna, S.K.K.; Jian, Y.; Pugh, E.N.; Zawadzki, R.J. Directional optical coherence tomography reveals melanin concentration-dependent scattering properties of retinal pigment epithelium. J. Biomed. Opt. 2019, 24, 066011. [Google Scholar] [CrossRef] [PubMed]
- Das, D.; Sharma, A.; Rajendran, P.; Pramanik, M. Another decade of photoacoustic imaging. Phys. Med. Biol. 2020, 66, 05TR01. [Google Scholar] [CrossRef]
- Montezuma, S.R.; Vavvas, D.; Miller, J. Review of the Ocular Angiogenesis Animal Models. Semin. Ophthalmol. 2009, 24, 52–61. [Google Scholar] [CrossRef]
- Willoughby, C.; Ponzin, D.; Ferrari, S.; Lobo, A.; Landau, K.; Omidi, Y. Anatomy and physiology of the human eye: Effects of mucopolysaccharidoses disease on structure and function—A review. Clin. Exp. Ophthalmol. 2010, 38, 2–11. [Google Scholar] [CrossRef]
- Schmidl, D.; Schlatter, A.; Chua, J.; Tan, B.; Garhöfer, G.; Schmetterer, L. Novel Approaches for Imaging-Based Diagnosis of Ocular Surface Disease. Diagnostics 2020, 10, 589. [Google Scholar] [CrossRef]
- Huang, D.; Swanson, E.A.; Lin, C.P.; Schuman, J.S.; Stinson, W.G.; Chang, W.; Hee, M.R.; Flotte, T.; Gregory, K.; Puliafito, C.A.; et al. Optical Coherence Tomography. Science 1991, 254, 1178–1181. [Google Scholar] [CrossRef]
- Shu, X.; Beckmann, L.; Zhang, H.F. Visible-light optical coherence tomography: A review. J. Biomed. Opt. 2017, 22, 1–14. [Google Scholar] [CrossRef]
- Weissleder, R. A clearer vision for in vivo imaging: Progress continues in the development of smaller, more penetrable probes for biological imaging. Nat. Biotechnol. 2001, 19, 316–317. [Google Scholar] [CrossRef]
- Swanson, E.A.; Izatt, J.A.; Lin, C.P.; Fujimoto, J.G.; Schuman, J.; Hee, M.R.; Huang, D.; Puliafito, C.A. In vivo retinal imaging by optical coherence tomography. Opt. Lett. 1993, 18, 1864–1866. [Google Scholar] [CrossRef]
- Hee, M.R.; Izatt, J.A.; Swanson, E.A.; Huang, D.; Schuman, J.S.; Lin, C.P.; Puliafito, C.A.; Fujimoto, J.G. Optical Coherence Tomography of the Human Retina. Arch. Ophthalmol. 1995, 113, 325–332. [Google Scholar] [CrossRef]
- Drexler, W.; Fujimoto, J.G. State-of-the-art retinal optical coherence tomography. Prog. Retin. Eye Res. 2008, 27, 45–88. [Google Scholar] [CrossRef]
- Wang, L.V.; Yao, J. A practical guide to photoacoustic tomography in the life sciences. Nat. Methods 2016, 13, 627–638. [Google Scholar] [CrossRef]
- Zackrisson, S.; van de Ven, S.; Gambhir, S. Light In and Sound Out: Emerging Translational Strategies for Photoacoustic Imaging. Cancer Res. 2014, 74, 979–1004. [Google Scholar] [CrossRef]
- Bell, A.G. On the production and reproduction of sound by light. Am. J. Sci. 1880, 29, 305–324. [Google Scholar] [CrossRef]
- Beard, P. Biomedical photoacoustic imaging. Interface Focus 2011, 1, 602–631. [Google Scholar] [CrossRef]
- Xu, M.; Wang, L.V. Photoacoustic imaging in biomedicine. Rev. Sci. Instrum. 2006, 77, 41101. [Google Scholar] [CrossRef]
- Silverman, R.H.; Kong, F.; Chen, Y.; Lloyd, H.O.; Kim, H.H.; Cannata, J.M.; Shung, K.K.; Coleman, D.J. High-Resolution Photoacoustic Imaging of Ocular Tissues. Ultrasound Med. Biol. 2010, 36, 733–742. [Google Scholar] [CrossRef]
- Hu, Z.; Wang, X.; Liu, Q.; Paulus, Y.M. Photoacoustic Imaging in Ophthalmology. Int. J. Ophthalmol. Eye Sci. 2015, 3, 126–132. [Google Scholar] [CrossRef]
- Zhang, H.F.; Maslov, K.; Stoica, G.; Wang, L. Functional photoacoustic microscopy for high-resolution and noninvasive in vivo imaging. Nat. Biotechnol. 2006, 24, 848–851. [Google Scholar] [CrossRef]
- Chen, F.; Si, P.; de la Zerda, A.; Jokerst, J.V.; Myung, D. Gold nanoparticles to enhance ophthalmic imaging. Biomater. Sci. 2020, 9, 367–390. [Google Scholar] [CrossRef]
- Midena, E.; Pilotto, E. Emerging Insights into Pathogenesis. Manag. Diabet. Retin. 2017, 60, 16–27. [Google Scholar] [CrossRef]
- van Velthoven, M.E.; Faber, D.J.; Verbraak, F.D.; van Leeuwen, T.G.; de Smet, M.D. Recent developments in optical coherence tomography for imaging the retina. Prog. Retin. Eye Res. 2007, 26, 57–77. [Google Scholar] [CrossRef] [PubMed]
- Robles, F.E.; Wilson, C.; Grant, G.; Wax, A. Molecular imaging true-colour spectroscopic optical coherence tomography. Nat. Photon 2011, 5, 744–747. [Google Scholar] [CrossRef] [PubMed]
- Barton, J.K.; Hoying, J.B.; Sullivan, C.J. Use of Microbubbles as an Optical Coherence Tomography Contrast Agent. Acad. Radiol. 2002, 9, S52–S55. [Google Scholar] [CrossRef] [PubMed]
- Lee, T.M.; Oldenburg, A.L.; Sitafalwalla, S.; Marks, D.L.; Luo, W.; Toublan, F.J.-J.; Suslick, K.S.; Boppart, S.A. Engineered microsphere contrast agents for optical coherence tomography. Opt. Lett. 2003, 28, 1546–1548. [Google Scholar] [CrossRef] [PubMed]
- Yaqoob, Z.; McDowell, E.J.; Wu, J.; Heng, X.; Fingler, J.P.; Yang, C. Molecular contrast optical coherence tomography: A pump-probe scheme using indocyanine green as a contrast agent. J. Biomed. Opt. 2006, 11, 054017. [Google Scholar] [CrossRef]
- Xu, C.; Ye, J.; Marks, D.L.; Boppart, S.A. Near-infrared dyes as contrast-enhancing agents for spectroscopic optical coherence tomography. Opt. Lett. 2004, 29, 1647–1649. [Google Scholar] [CrossRef]
- Yao, J.; Maslov, K.I.; Hu, S.; Wang, L.V. Evans blue dye-enhanced capillary-resolution photoacoustic microscopy in vivo. J. Biomed. Opt. 2009, 14, 054049. [Google Scholar] [CrossRef]
- Oldenburg, A.L.; Gunther, J.R.; Toublan, F.J.; Marks, D.L.; Suslick, K.S.; Boppart, S.A. Magnetic contrast agents for optical coherence tomography. In Coherence Domain Optical Methods and Optical Coherence Tomography in Biomedicine VIII; SPIE: Bellingham, WA, USA, 2004; Volume 5316, pp. 91–98. [Google Scholar] [CrossRef]
- Pu, K.; Shuhendler, A.J.; Jokerst, J.; Mei, J.; Gambhir, S.S.; Bao, Z.; Rao, J. Semiconducting polymer nanoparticles as photoacoustic molecular imaging probes in living mice. Nat. Nanotechnol. 2014, 9, 233–239. [Google Scholar] [CrossRef]
- Ku, G.; Zhou, M.; Song, S.; Huang, Q.; Hazle, J.; Li, C. Copper Sulfide Nanoparticles As a New Class of Photoacoustic Contrast Agent for Deep Tissue Imaging at 1064 nm. ACS Nano 2012, 6, 7489–7496. [Google Scholar] [CrossRef]
- Masse, F.; Ouellette, M.; Lamoureux, G.; Boisselier, E. Gold nanoparticles in ophthalmology. Med. Res. Rev. 2018, 39, 302–327. [Google Scholar] [CrossRef]
- Faraday, M. The Bakerian Lecture: Experimental Relations of Gold (and Other Metals). Philos. Trans. R. Soc. Lond. 1857, 147, 145–181. [Google Scholar]
- Mie, G. Beiträge zur Optik trüber Medien, speziell kolloidaler Metallösungen. Ann. Phys. 1908, 330, 377–445. [Google Scholar] [CrossRef]
- Ovais, M.; Raza, A.; Naz, S.; Islam, N.U.; Khalil, A.T.; Ali, S.; Khan, M.A.; Shinwari, Z.K. Current state and prospects of the phytosynthesized colloidal gold nanoparticles and their applications in cancer theranostics. Appl. Microbiol. Biotechnol. 2017, 101, 3551–3565. [Google Scholar] [CrossRef]
- Yang, X.; Yang, M.; Pang, B.; Vara, M.; Xia, Y. Gold Nanomaterials at Work in Biomedicine. Chem. Rev. 2015, 115, 10410–10488. [Google Scholar] [CrossRef]
- Turkevich, J.; Stevenson, P.C.; Hillier, J. A study of the nucleation and growth processes in the synthesis of colloidal gold. Discuss. Faraday Soc. 1951, 11, 55–75. [Google Scholar] [CrossRef]
- Daniel, M.-C.; Astruc, D. Gold Nanoparticles: Assembly, Supramolecular Chemistry, Quantum-Size-Related Properties, and Applications toward Biology, Catalysis, and Nanotechnology. Chem. Rev. 2003, 104, 293–346. [Google Scholar] [CrossRef]
- Giersig, M.; Mulvaney, P. Preparation of ordered colloid monolayers by electrophoretic deposition. Langmuir 1993, 9, 3408–3413. [Google Scholar] [CrossRef]
- Brust, M.; Walker, M.; Bethell, D.; Schiffrin, D.J.; Whyman, R. Synthesis of thiol-derivatised gold nanoparticles in a two-phase Liquid–Liquid system. J. Chem. Soc. Chem. Commun. 1994, 801–802. [Google Scholar] [CrossRef]
- Arvizo, R.; Bhattacharya, R.; Mukherjee, P. Gold nanoparticles: Opportunities and challenges in nanomedicine. Expert Opin. Drug Deliv. 2010, 7, 753–763. [Google Scholar] [CrossRef]
- Li, N.; Zhao, P.; Astruc, D. Anisotropic Gold Nanoparticles: Synthesis, Properties, Applications, and Toxicity. Angew. Chem. Int. Ed. 2014, 53, 1756–1789. [Google Scholar] [CrossRef]
- Kohout, C.; Santi, C.; Polito, L. Anisotropic Gold Nanoparticles in Biomedical Applications. Int. J. Mol. Sci. 2018, 19, 3385. [Google Scholar] [CrossRef]
- Hussain, M.H.; Abu Bakar, N.F.; Mustapa, A.N.; Low, K.-F.; Othman, N.H.; Adam, F. Synthesis of Various Size Gold Nanoparticles by Chemical Reduction Method with Different Solvent Polarity. Nanoscale Res. Lett. 2020, 15, 1–10. [Google Scholar] [CrossRef]
- Kreibig, U.; Vollmer, M. Optical Properties of Metal Clusters, 1st ed.; Springer: Berlin/Heidelberg, Germany, 1995; pp. 30–68. ISBN 978-3-642-08191-0. [Google Scholar]
- Cobley, C.M.; Chen, J.; Cho, E.C.; Wang, L.V.; Xia, Y. Gold nanostructures: A class of multifunctional materials for biomedical applications. Chem. Soc. Rev. 2010, 40, 44–56. [Google Scholar] [CrossRef]
- Lee, K.-S.; El-Sayed, M.A. Dependence of the Enhanced Optical Scattering Efficiency Relative to That of Absorption for Gold Metal Nanorods on Aspect Ratio, Size, End-Cap Shape, and Medium Refractive Index. J. Phys. Chem. B 2005, 109, 20331–20338. [Google Scholar] [CrossRef]
- Dey, P.; Blakey, I.; Stone, N. Diagnostic prospects and preclinical development of optical technologies using gold nanostructure contrast agents to boost endogenous tissue contrast. Chem. Sci. 2020, 11, 8671–8685. [Google Scholar] [CrossRef]
- Pérez-Juste, J.; Pastoriza-Santos, I.; Liz-Marzán, L.M.; Mulvaney, P. Gold nanorods: Synthesis, characterization and applications. Coord. Chem. Rev. 2005, 249, 1870–1901. [Google Scholar] [CrossRef]
- Gans, R. Über die Form ultramikroskopischer Goldteilchen. Ann. Phys. 1912, 342, 881–900. [Google Scholar] [CrossRef]
- Murphy, C.J.; Gole, A.M.; Hunyadi, S.E.; Stone, J.W.; Sisco, P.N.; Alkilany, A.; Kinard, B.E.; Hankins, P. Chemical sensing and imaging with metallic nanorods. Chem. Commun. 2007, 5, 544–557. [Google Scholar] [CrossRef] [PubMed]
- Wang, Y.-C.; Rhéaume, É.; Lesage, F.; Kakkar, A. Synthetic Methodologies to Gold Nanoshells: An Overview. Molecules 2018, 23, 2851. [Google Scholar] [CrossRef] [PubMed]
- Skrabalak, S.E.; Chen, J.; Sun, Y.; Lu, X.; Au, L.; Cobley, C.M.; Xia, Y. Gold Nanocages: Synthesis, Properties, and Applications. Acc. Chem. Res. 2008, 41, 1587–1595. [Google Scholar] [CrossRef]
- Mousavi, S.M.; Zarei, M.; Hashemi, S.A.; Ramakrishna, S.; Chiang, W.-H.; Lai, C.W.; Gholami, A. Gold nanostars-diagnosis, bioimaging and biomedical applications. Drug Metab. Rev. 2020, 52, 299–318. [Google Scholar] [CrossRef]
- Mendoza-Galván, A.; Järrendahl, K.; Dmitriev, A.; Pakizeh, T.; Käll, M.; Arwin, H. Optical response of supported gold nanodisks. Opt. Express 2011, 19, 12093–12107. [Google Scholar] [CrossRef]
- Bansal, S.A.; Kumar, V.; Karimi, J.; Singh, A.P.; Kumar, S. Role of gold nanoparticles in advanced biomedical applications. Nanoscale Adv. 2020, 2, 3764–3787. [Google Scholar] [CrossRef]
- Jana, N.R.; Gearheart, L.; Murphy, C.J. Seed-mediated growth approach for shape-controlled synthesis of spheroidal and rod-like gold nanoparticles using a surfactant template. Adv. Mater. 2001, 13, 1389–1393. [Google Scholar] [CrossRef]
- Cole, L.E.; Ross, R.D.; Tilley, J.M.; Vargo-Gogola, T.; Roeder, R.K. Gold nanoparticles as contrast agents in x-ray imaging and computed tomography. Nanomedicine 2015, 10, 321–341. [Google Scholar] [CrossRef]
- Dunning, C.; Bazalova-Carter, M. Sheet beam x-ray fluorescence computed tomography (XFCT) imaging of gold nanoparticles. Med. Phys. 2018, 45, 2572–2582. [Google Scholar] [CrossRef]
- Kircher, M.F.; De La Zerda, A.; Jokerst, J.V.; Zavaleta, C.; Kempen, P.; Mittra, E.; Pitter, K.; Huang, R.; Campos, C.; Habte, F.; et al. A brain tumor molecular imaging strategy using a new triple-modality MRI-photoacoustic-Raman nanoparticle. Nat. Med. 2012, 18, 829–834. [Google Scholar] [CrossRef]
- Li, W.; Chen, X. Gold nanoparticles for photoacoustic imaging. Nanomedicine 2015, 10, 299–320. [Google Scholar] [CrossRef]
- Sebastian, V.; Lee, S.-K.; Zhou, C.; Kraus, M.F.; Fujimoto, J.G.; Jensen, K.F. One-step continuous synthesis of biocompatible gold nanorods for optical coherence tomography. Chem. Commun. 2012, 48, 6654–6656. [Google Scholar] [CrossRef]
- Chen, J.; Saeki, F.; Wiley, B.; Cang, H.; Cobb, M.J.; Li, Z.-Y.; Au, L.; Zhang, H.; Kimmey, M.B.; Li, X.; et al. Gold Nanocages: Bioconjugation and Their Potential Use as Optical Imaging Contrast Agents. Nano Lett. 2005, 5, 473–477. [Google Scholar] [CrossRef]
- Huang, X.; Neretina, S.; El-Sayed, M.A. Gold Nanorods: From Synthesis and Properties to Biological and Biomedical Applications. Adv. Mater. 2009, 21, 4880–4910. [Google Scholar] [CrossRef]
- Troutman, T.S.; Barton, J.K.; Romanowski, M. Optical coherence tomography with plasmon resonant nanorods of gold. Opt. Lett. 2007, 32, 1438–1440. [Google Scholar] [CrossRef]
- Jia, Y.; Liu, G.; Gordon, A.Y.; Gao, S.S.; Pechauer, A.D.; Stoddard, J.; McGill, T.J.; Jayagopal, A.; Huang, D. Spectral fractionation detection of gold nanorod contrast agents using optical coherence tomography. Opt. Express 2015, 23, 4212–4225. [Google Scholar] [CrossRef]
- Ratheesh, K.M.; Prabhathan, P.; Seah, L.K.; Murukeshan, V.M. Gold nanorods with higher aspect ratio as potential contrast agent in optical coherence tomography and for photothermal applications around 1300 nm imaging window. Biomed. Phys. Eng. Express 2016, 2, 055005. [Google Scholar] [CrossRef]
- Al Rawashdeh, W.; Weyand, T.; Kray, S.; Lenz, M.; Buchkremer, A.; Spöler, F.; Simon, U.; Möller, M.; Kiessling, F.; Lederle, W. Differential contrast of gold nanorods in dual-band OCT using spectral multiplexing. J. Nanoparticle Res. 2015, 17, 1–11. [Google Scholar] [CrossRef]
- Liba, O.; SoRelle, E.D.; Sen, D.; De La Zerda, A. Contrast-enhanced optical coherence tomography with picomolar sensitivity for functional in vivo imaging. Sci. Rep. 2016, 6, 23337. [Google Scholar] [CrossRef]
- SoRelle, E.D.; Liba, O.; Hussain, Z.; Gambhir, M.; de la Zerda, A. Biofunctionalization of Large Gold Nanorods Realizes Ultrahigh-Sensitivity Optical Imaging Agents. Langmuir 2015, 31, 12339–12347. [Google Scholar] [CrossRef] [PubMed]
- Barton, J.K.; Halas, N.J.; West, J.L.; Drezek, R.A. Nanoshells as an optical coherence tomography contrast agent. In Coherence Domain Optical Methods and Optical Coherence Tomography in Biomedicine VIII; SPIE: Bellingham, WA, USA, 2004; Volume 5316, pp. 99–107. [Google Scholar] [CrossRef]
- Agrawal, A.; Huang, S.; Lin, A.W.H.; Lee, M.-H.; Barton, J.K.; Drezek, R.A.; Pfefer, T.J. Quantitative evaluation of optical coherence tomography signal enhancement with gold nanoshells. J. Biomed. Opt. 2006, 11, 041121. [Google Scholar] [CrossRef] [PubMed]
- Zagaynova, E.V.; Shirmanova, M.V.; Kirillin, M.Y.; Khlebtsov, B.N.; Orlova, A.G.; Balalaeva, I.V.; Sirotkina, M.A.; Bugrova, M.L.; Agrba, P.D.; Kamensky, V.A. Contrasting properties of gold nanoparticles for optical coherence tomography: Phantom, in vivo studies and Monte Carlo simulation. Phys. Med. Biol. 2008, 53, 4995–5009. [Google Scholar] [CrossRef] [PubMed]
- Adler, D.C.; Huang, S.-W.; Huber, R.; Fujimoto, J.G. Photothermal detection of gold nanoparticles using phase-sensitive optical coherence tomography. Opt. Express 2008, 16, 4376–4393. [Google Scholar] [CrossRef] [PubMed]
- Cang, H.; Sun, T.; Li, Z.-Y.; Chen, J.; Wiley, B.J.; Xia, Y.; Li, X. Gold nanocages as contrast agents for spectroscopic optical coherence tomography. Opt. Lett. 2005, 30, 3048–3050. [Google Scholar] [CrossRef]
- de Leon, Y.P.; Lopez-Rios, J.A.; Pichardo-Molina, J.L.; Ochoa, N.A. Optical coherence tomography image enhancement by using gold nanoparticles. In Proceedings of the 22nd Congress of the International Commission for Optics: Light for the Development of the World, Puebla, Mexico, 15–19 August 2011; Volume 8011, p. 80118W. [Google Scholar] [CrossRef]
- Bibikova, O.; Popov, A.; Bykov, A.; Fales, A.; Yuan, H.; Skovorodkin, I.; Kinnunen, M.; Vainio, S.; Vo-Dinh, T.; Tuchin, V.V.; et al. Plasmon-Resonant Gold Nanostars With Variable Size as Contrast Agents for Imaging Applications. IEEE J. Sel. Top. Quantum Electron. 2016, 22, 13–20. [Google Scholar] [CrossRef]
- Wang, B.; Kagemann, L.; Schuman, J.S.; Ishikawa, H.; Bilonick, R.A.; Ling, Y.; Sigal, I.A.; Nadler, Z.; Francis, A.; Sandrian, M.G.; et al. Gold Nanorods as a Contrast Agent for Doppler Optical Coherence Tomography. PLoS ONE 2014, 9, e90690. [Google Scholar] [CrossRef]
- Quigley, H.A. Number of people with glaucoma worldwide. Br. J. Ophthalmol. 1996, 80, 389–393. [Google Scholar] [CrossRef]
- Prabhulkar, S.; Matthews, J.; Rawal, S.; Awdeh, R.M. Molecular Histopathology Using Gold Nanorods and Optical Coherence Tomography. Investig. Opthalmology Vis. Sci. 2013, 54, 1192–1200. [Google Scholar] [CrossRef]
- Squamous, S.; Gurses, I.; Doganay, S.; Mizrak, B. Expression of Glucose Transporter Protein-1 (Glut-1). Ocul. Surf. 2007, 1, 826–830. [Google Scholar]
- Kumar, S.V.; Joshi, D. Ocular surface squamous neoplasia. Med. J. Armed 2017, 74, 273–275. [Google Scholar] [CrossRef]
- Faber, D.J.; van Velthoven, M.E.J.; de Bruin, M.; Aalders, M.C.G.; Verbraak, F.D.; Graf, C.; van Leeuwen, T.G. NAOMI: Nanoparticle assisted optical molecular imaging. In Coherence Domain Optical Methods and Optical Coherence Tomography in Biomedicine VIII; SPIE: Bellingham, WA, USA, 2006; Volume 6079, pp. 24–32. [Google Scholar] [CrossRef]
- Lee, H.; Kim, E.K.; Kim, H.Y.; Kim, T.-I. Effects of Exposure to Ozone on the Ocular Surface in an Experimental Model of Allergic Conjunctivitis. PLoS ONE 2017, 12, e0169209. [Google Scholar] [CrossRef]
- Jiang, X.; Tang, P.; Gao, P.; Zhang, Y.S.; Yi, C.; Zhou, J. Gold Nanoprobe-Enabled Three-Dimensional Ozone Imaging by Optical Coherence Tomography. Anal. Chem. 2017, 89, 2561–2568. [Google Scholar] [CrossRef]
- Jiang, X.; Liu, R.; Tang, P.; Li, W.; Zhong, H.; Zhou, Z.; Zhou, J. Controllably tuning the near-infrared plasmonic modes of gold nanoplates for enhanced optical coherence imaging and photothermal therapy. RSC Adv. 2015, 5, 80709–80718. [Google Scholar] [CrossRef]
- De la Zerda, A.; Prabhulkar, S.; Perez, V.L.; Ruggeri, M.; Paranjape, A.S.; Habte, F.; Gambhir, S.S.; Awdeh, R.M. Optical coherence contrast imaging using gold nanorods in living mice eyes. Clin. Exp. Ophthalmol. 2015, 43, 358–366. [Google Scholar] [CrossRef]
- Sen, D.; SoRelle, E.D.; Liba, O.; Dalal, R.; Paulus, Y.; Kim, T.-W.; Moshfeghi, D.M.; De La Zerda, A. High-resolution contrast-enhanced optical coherence tomography in mice retinae. J. Biomed. Opt. 2016, 21, 066002. [Google Scholar] [CrossRef]
- Sandrian, M.G.; Wollstein, G.; Schuman, J.; Bilonick, R.A.; Ling, Y.; Ishikawa, H.; Kagemann, L.; McKenna, K.C. Inflammatory response to intravitreal injection of gold nanorods. Br. J. Ophthalmol. 2012, 96, 1522–1529. [Google Scholar] [CrossRef]
- Gordon, A.Y. Contrast-Enhanced Optical Coherence Tomography Using Gold Nanorods. Ph.D. Thesis, Vanderbilt University, Nashville, TN, USA, 2019. [Google Scholar]
- Ryan, S.J. The development of an experimental model of subretinal neovascularization in disciform macular degenera-tion. Trans. Am. Ophthalmol. Soc. 1979, 77, 707–745. [Google Scholar]
- Lapierre-Landry, M.; Gordon, A.Y.; Penn, J.S.; Skala, M.C. In vivo photothermal optical coherence tomography of endogenous and exogenous contrast agents in the eye. Sci. Rep. 2017, 7, 1–9. [Google Scholar] [CrossRef]
- Song, H.B.; Wi, J.-S.; Jo, D.H.; Kim, J.H.; Lee, S.-W.; Lee, T.G.; Kim, J.H. Intraocular application of gold nanodisks optically tuned for optical coherence tomography: Inhibitory effect on retinal neovascularization without unbearable toxicity. Nanomed. Nanotechnol. Biol. Med. 2017, 13, 1901–1911. [Google Scholar] [CrossRef]
- Chang, W.-S.; Ha, J.W.; Slaughter, L.S.; Link, S. Plasmonic nanorod absorbers as orientation sensors. Proc. Natl. Acad. Sci. USA 2010, 107, 2781–2786. [Google Scholar] [CrossRef] [PubMed]
- Chemla, Y.; Betzer, O.; Markus, A.; Farah, N.; Motiei, M.; Popovtzer, R.; Mandel, Y. Gold nanoparticles for multimodal high-resolution imaging of transplanted cells for retinal replacement therapy. Nanomedicine 2019, 14, 1857–1871. [Google Scholar] [CrossRef] [PubMed]
- Jones, M.K.; Lu, B.; Girman, S.; Wang, S. Cell-based therapeutic strategies for replacement and preservation in retinal degenerative diseases. Prog. Retin. Eye Res. 2017, 58, 1–27. [Google Scholar] [CrossRef] [PubMed]
- Raghavan, V.; Subhash, H.; Breathnach, A.; Leahy, M.; Dockery, P.; Olivo, M. Dual plasmonic gold nanoparticles for multispectral photoacoustic imaging application. In Proceedings of the Photons Plus Ultrasound: Imaging and Sensing 2014, San Francisco, CA, USA, 1–6 February 2014; Volume 8943, p. 89434J. [Google Scholar] [CrossRef]
- Bayer, C.L.; Chen, Y.-S.; Kim, S.; Mallidi, S.; Sokolov, K.; Emelianov, S. Multiplex photoacoustic molecular imaging using targeted silica-coated gold nanorods. Biomed. Opt. Express 2011, 2, 1828–1835. [Google Scholar] [CrossRef] [PubMed]
- Chen, Y.-S.; Zhao, Y.; Yoon, S.J.; Gambhir, S.S.; Emelianov, S. Miniature gold nanorods for photoacoustic molecular imaging in the second near-infrared optical window. Nat. Nanotechnol. 2019, 14, 465–472. [Google Scholar] [CrossRef]
- Raveendran, S.; Lim, H.-T.; Maekawa, T.; Matham, M.V.; Kumar, D.S. Gold nanocages entering into the realm of high-contrast photoacoustic ocular imaging. Nanoscale 2018, 10, 13959–13968. [Google Scholar] [CrossRef]
- Kim, H.; Nguyen, V.P.; Manivasagan, P.; Jung, M.J.; Kim, S.W.; Oh, J.; Kang, H.W. Doxorubicin-fucoidan-gold nanoparticles composite for dual-chemo-photothermal treatment on eye tumors. Oncotarget 2017, 8, 113719–113733. [Google Scholar] [CrossRef]
- Wi, J.-S.; Park, J.; Kang, H.; Jung, D.; Lee, S.-W.; Lee, T.G. Stacked Gold Nanodisks for Bimodal Photoacoustic and Optical Coherence Imaging. ACS Nano 2017, 11, 6225–6232. [Google Scholar] [CrossRef]
- Langhammer, C.; Kasemo, B.; Zorić, I. Absorption and scattering of light by Pt, Pd, Ag, and Au nanodisks: Absolute cross sections and branching ratios. J. Chem. Phys. 2007, 126, 194702. [Google Scholar] [CrossRef]
- Loo, C.; Lin, A.; Hirsch, L.; Lee, M.-H.; Barton, J.; Halas, N.; West, J.; Drezek, R. Nanoshell-Enabled Photonics-Based Imaging and Therapy of Cancer. Technol. Cancer Res. Treat. 2004, 3, 33–40. [Google Scholar] [CrossRef]
- Nguyen, V.P.; Li, Y.; Qian, W.; Liu, B.; Tian, C.; Zhang, W.; Huang, Z.; Ponduri, A.; Tarnowski, M.; Wang, X.; et al. Contrast Agent Enhanced Multimodal Photoacoustic Microscopy and Optical Coherence Tomography for Imaging of Rabbit Choroidal and Retinal Vessels in vivo. Sci. Rep. 2019, 9, 5945. [Google Scholar] [CrossRef]
- Nguyen, V.-P.; Li, Y.; Henry, J.; Zhang, W.; Aaberg, M.; Jones, S.; Qian, T.; Wang, X.; Paulus, Y.M. Plasmonic Gold Nanostar-Enhanced Multimodal Photoacoustic Microscopy and Optical Coherence Tomography Molecular Imaging to Evaluate Choroidal Neovascularization. ACS Sens. 2020, 5, 3070–3081. [Google Scholar] [CrossRef]
- Nguyen, V.P.; Qian, W.; Li, Y.; Liu, B.; Aaberg, M.; Henry, J.; Zhang, W.; Wang, X.; Paulus, Y.M. Chain-like gold nanoparticle clusters for multimodal photoacoustic microscopy and optical coherence tomography enhanced molecular imaging. Nat. Commun. 2021, 12, 34. [Google Scholar] [CrossRef]
- Merchant, B. Gold, the Noble Metal and the Paradoxes of its Toxicology. Biologicals 1998, 26, 49–59. [Google Scholar] [CrossRef]
- Pernodet, N.; Fang, X.; Sun, Y.; Bakhtina, A.; Ramakrishnan, A.; Sokolov, J.; Ulman, A.; Rafailovich, M. Adverse Effects of Citrate/Gold Nanoparticles on Human Dermal Fibroblasts. Small 2006, 2, 766–773. [Google Scholar] [CrossRef]
- Terentyuk, G.S.; Maslyakova, G.N.; Suleymanova, L.V.; Khlebtsov, B.N.; Kogan, B.Y.; Akchurin, G.G.; Shantrocha, A.V.; Maksimova, I.L.; Khlebtsov, N.G.; Tuchin, V.V. Circulation and distribution of gold nanoparticles and induced alterations of tissue morphology at intravenous particle delivery. J. Biophotonics 2009, 2, 292–302. [Google Scholar] [CrossRef]
- Jo, D.H.; Lee, T.G.; Kim, J.H. Nanotechnology and nanotoxicology in retinopathy. Int. J. Mol. Sci. 2011, 12, 8288–8301. [Google Scholar] [CrossRef]
- Pan, Y.; Neuss, S.; Leifert, A. Size-dependent cytotoxicity of gold nanoparticles. Small 2007, 3, 1941–1949. [Google Scholar] [CrossRef]
- De Jong, W.H.; Hagens, W.I.; Krystek, P.; Burger, M.; Sips, A.J.A.M.; Geertsma, R.E. Particle size-dependent organ distribution of gold nanoparticles after intravenous administration. Biomaterials 2008, 29, 1912–1919. [Google Scholar] [CrossRef]
- Sonavane, G.; Tomoda, K.; Makino, K. Biodistribution of colloidal gold nanoparticles after intravenous administration: Effect of particle size. Colloids Surf. B Biointerfaces 2008, 66, 274–280. [Google Scholar] [CrossRef]
- Lasagna-Reeves, C.; Gonzalez-Romero, D.; Barria, M.A. Bioaccumulation and toxicity of gold nanoparticles after repeated administration in mice. Biochem. Biophys. Res. Commun. 2010, 393, 649–655. [Google Scholar] [CrossRef] [PubMed]
- Yu, Y.-Y.; Chang, S.-S.; Lee, C.-L. Gold Nanorods: Electrochemical Synthesis and Optical Properties. J. Phys. Chem. B. 1997, 101, 661–678. [Google Scholar] [CrossRef]
- Huang, X.; El-Sayed, I.H.; Qian, W.; El-Sayed, M.A. Cancer cell imaging and photothermal therapy in the near-infrared region by using gold nanorods. J. Am. Chem. Soc. 2006, 128, 2115–2120. [Google Scholar] [CrossRef] [PubMed]
- Niidome, T.; Yamagata, M.; Okamoto, Y. PEG-modified gold nanorods with a stealth character for in vivo applications. J. Control Release 2006, 114, 343–347. [Google Scholar] [CrossRef] [PubMed]
- Zhang, G.; Yang, Z.; Lu, W. Influence of anchoring ligands and particle size on the colloidal stability and in vivo biodistribution of polyethylene glycol-coated gold nanoparticles in tumor-xenografted mice. Biomaterials 2009, 30, 1928–1936. [Google Scholar] [CrossRef]
- Goodman, C.M.; McCusker, C.D.; Yilmaz, T.; Rotello, V.M. Toxicity of gold nanoparticles functionalized with cationic and anionic side chains. Bioconjug. Chem. 2004, 15, 897–900. [Google Scholar] [CrossRef]
- Karakoçak, B.B.; Raliya, R.; Davis, J.T. Biocompatibility of gold nanoparticles in retinal pigment epithelial cell line. Toxicol. Vitr. 2016, 37, 61–69. [Google Scholar] [CrossRef]
- Hayashi, A.; Naseri, A.; Pennesi, M.E.; De Juan, E. Subretinal delivery of immunoglobulin G with gold nanoparticles in the rabbit eye. Jpn J. Ophthalmol. 2009, 53, 249–256. [Google Scholar] [CrossRef]
- Kim, J.H.; Kim, J.H.; Kim, K.-W.; Kim, M.H.; Yu, Y.S. Intravenously administered gold nanoparticles pass through the blood–retinal barrier depending on the particle size, and induce no retinal toxicity. Nanotechnology 2009, 20, 505101. [Google Scholar] [CrossRef]
- Söderstjerna, E.; Bauer, P.; Cedervall, T.; Abdshill, H.; Johansson, F.; Johansson, U.E. Silver and Gold Nanoparticles Exposure to In Vitro Cultured Retina—Studies on Nanoparticle Internalization, Apoptosis, Oxidative Stress, Glial- and Microglial Activity. PLoS ONE 2014, 9, e105359. [Google Scholar] [CrossRef]
- Bakri, S.J.; Pulido, J.S.; Mukherjee, P.; Marler, R.J.; Mukhopadhyay, D. Absence of Histologic Retinal Toxicity of Intravitreal Nanogold in a Rabbit Model. Retina 2008, 28, 147–149. [Google Scholar] [CrossRef]
- Kim, K.-T.; Zaikova, T.; Hutchison, J.E.; Tanguay, R.L. Gold Nanoparticles Disrupt Zebrafish Eye Development and Pigmentation. Toxicol. Sci. 2013, 133, 275–288. [Google Scholar] [CrossRef]
- Olson, J.L.; Velez-Montoya, R.; Nghiem, N. Intraocular Biocompatibility of Gold-Nanoparticles. J. Nanomater. Mol. Nanotechnol. 2013, 2, 1–5. [Google Scholar] [CrossRef]


| Imaging Modality | AuNP Type | Dimensions | LSPR Peak | Tissue/Cells | Results | References |
| Time-domain OCT (890 nm) | Cylinder-like-shaped nanorods | Diameter: ~20 nm | 750 nm, 912 nm | Polyacrylamide-based phantoms | Strength of signal dependent on LSPR overlap between the AuNPs and the operating system, Both suspensions enhanced the signal contrast vs. water | Troutman et al. [68] |
| Fourier-domain OCT (~840 nm) | Nanorods coated with PEG and Tat peptide | Diameter: 10 nm | 870 nm | Intralipid tissue phantoms (mimicking retinal tissue), RPE cells | The presence of AuNPs caused a red shift in OCT images, RPE labeling with AuNRs allowed their tracking | Jia et al. [69] |
| OCT (1300 nm) | Nanorods | Length: 88 ± 5 nm, diameter: 10 ± 2 nm (aspect ratio: 8.8) | 1320 nm | Agar–TiO2 phantom | AuNRs can effectively act as absorption-based CAs | Ratheesh et al. [70] |
| Dual-band OCT system with two separated bandwidths (830 nm & 1220 nm) | Nanorods | Average Length: 75 nm (large nanorods), 48 nm (small nanorods) | 868 nm (large nanorods), 835 (small nanorods) | Agar phantom | The strongest signal intensities at both bandwidths were produced with nanorods large sample, whereas were not detected with nanorods small sample | Rawashdeh et al. [71] |
| OCT (830 nm) | Nanoshells | Core radius: 100 nm, Shell thickness: 20 nm | 830 nm | 1 mm pathlength cuvette with solutions of nanoshells in water, saline & microspheres | Grayscale intensity of saline solution: 247, Grayscale intensity of nanoshells solution: 160 | Loo et al. [107] |
| Time-domain OCT (1310 nm) | PEGylated mono-layered nanoshells | Core diameters: 126–291 nm shell thicknesses: 8–25 nm | N/A | Water & turbid tissue-simulating phantoms | The strongest backscattering was produced by NPs with core diameter of 291 nm and shell thickness of 25 nm | Agrawal et al. [75] |
| OCT (900 nm) | Silica–gold nanoshells | Silica core: 150 nm, Gold shell thickness: 25 nm | 850–950 nm | Agar biotissue phantoms | Nanoshells penetrating the phantoms caused the intensification of the signal | Zagaynova et al. [76] |
| Phase-sensitive OCT (1315 nm) | Nanoshells | Core: 120 nm, shell thickness: 16 nm | 780 nm | Phantoms | High contrast between the phantoms with and without nanoshells | Adler et al. [77] |
| Spectroscopic OCT (716 nm) | Nanocages | average edge length: ~35 nm | ~716 nm | Gelatin-made tissue phantoms | The absorption cross section with nanocages presented a ~5 orders larger magnitude than conventional dyes | Cang et al. [78] |
| OCT (1325 nm) | Spherical-, cubic- & star-like-shaped NPs coated with amino acid molecules | Various | 520–110 nm | Water & agarose phantoms | Star-shaped AuNPs with less than 150 nm size produced the best contrast in water as well as in agarose phantoms. | Ponce-de-Leon et al. [79] |
| Spectral- domain OCT & Doppler OCT (930 nm) | Nanostars | Tip-to-tip: 50, 82, 100 & 120 nm | 710–830 nm | Glass capillaries | 120 nm-sized nanostars produced the best contrast enhancement | Bibikova et al. [80] |
| Multispectral photoacoustic imaging (1064 nm, 700 nm) | Nanostars | Tip-to-tip: 120–150 nm, Branches length: 35–40 nm | Transverse: 700 nm, Longitudinal: 1050–1150 nm | Tissue phantoms (mix of 2% agarose in water with 1% intralipid) | Signal enhancement was observed as the concentration of Au nanostars increased | Raghavan et al. [100] |
| Multispectral photoacoustic imaging (700–910 nm) | Silica-coated nanorods (SiO2– AuNRs) | Thickness: 40 nm | 780 nm, 830 nm | Tissue phantoms (8% w/v gelatin, 1.2% w/v 5 µm diameter silica scatterers) | The use of AuNRs allowed the identification of separate cell inclusions of the tissue phantom | Bayer et al. [101] |
| Photoacoustic imaging | Miniature nanorods | Smallest: 8 ± 2 nm by 49 ± 8 nm | 1000–1200 nm | Tube phantoms | Miniature AuNRs produced a ~3.5-fold stronger PA signal vs. regular-sized AuNRs, better photothermal stability under nanosecond irradiation | Chen et al. [102] |
| Bimodal PA and OCT system | Stacked nanodiks | Top nanodisk: 80 nm, Bottom nanodisk: 180 nm | Top nanodisk: 630 nm, Bottom nanodisk: 850 nm | Agarose tissue phantoms | Only stacked Au nanodisks were detected by both OCT and PAM vs. nanospheres and AuNRs, PAM intensity of a single stacked Au nanodisk was two-fold larger than that of a AuNR | Wi et al. [105] |
| Imaging Modality | AuNP Type | Dimensions | LSPR Peak | Concentration/Dose | Administration | Subject Type | Results | References |
|---|---|---|---|---|---|---|---|---|
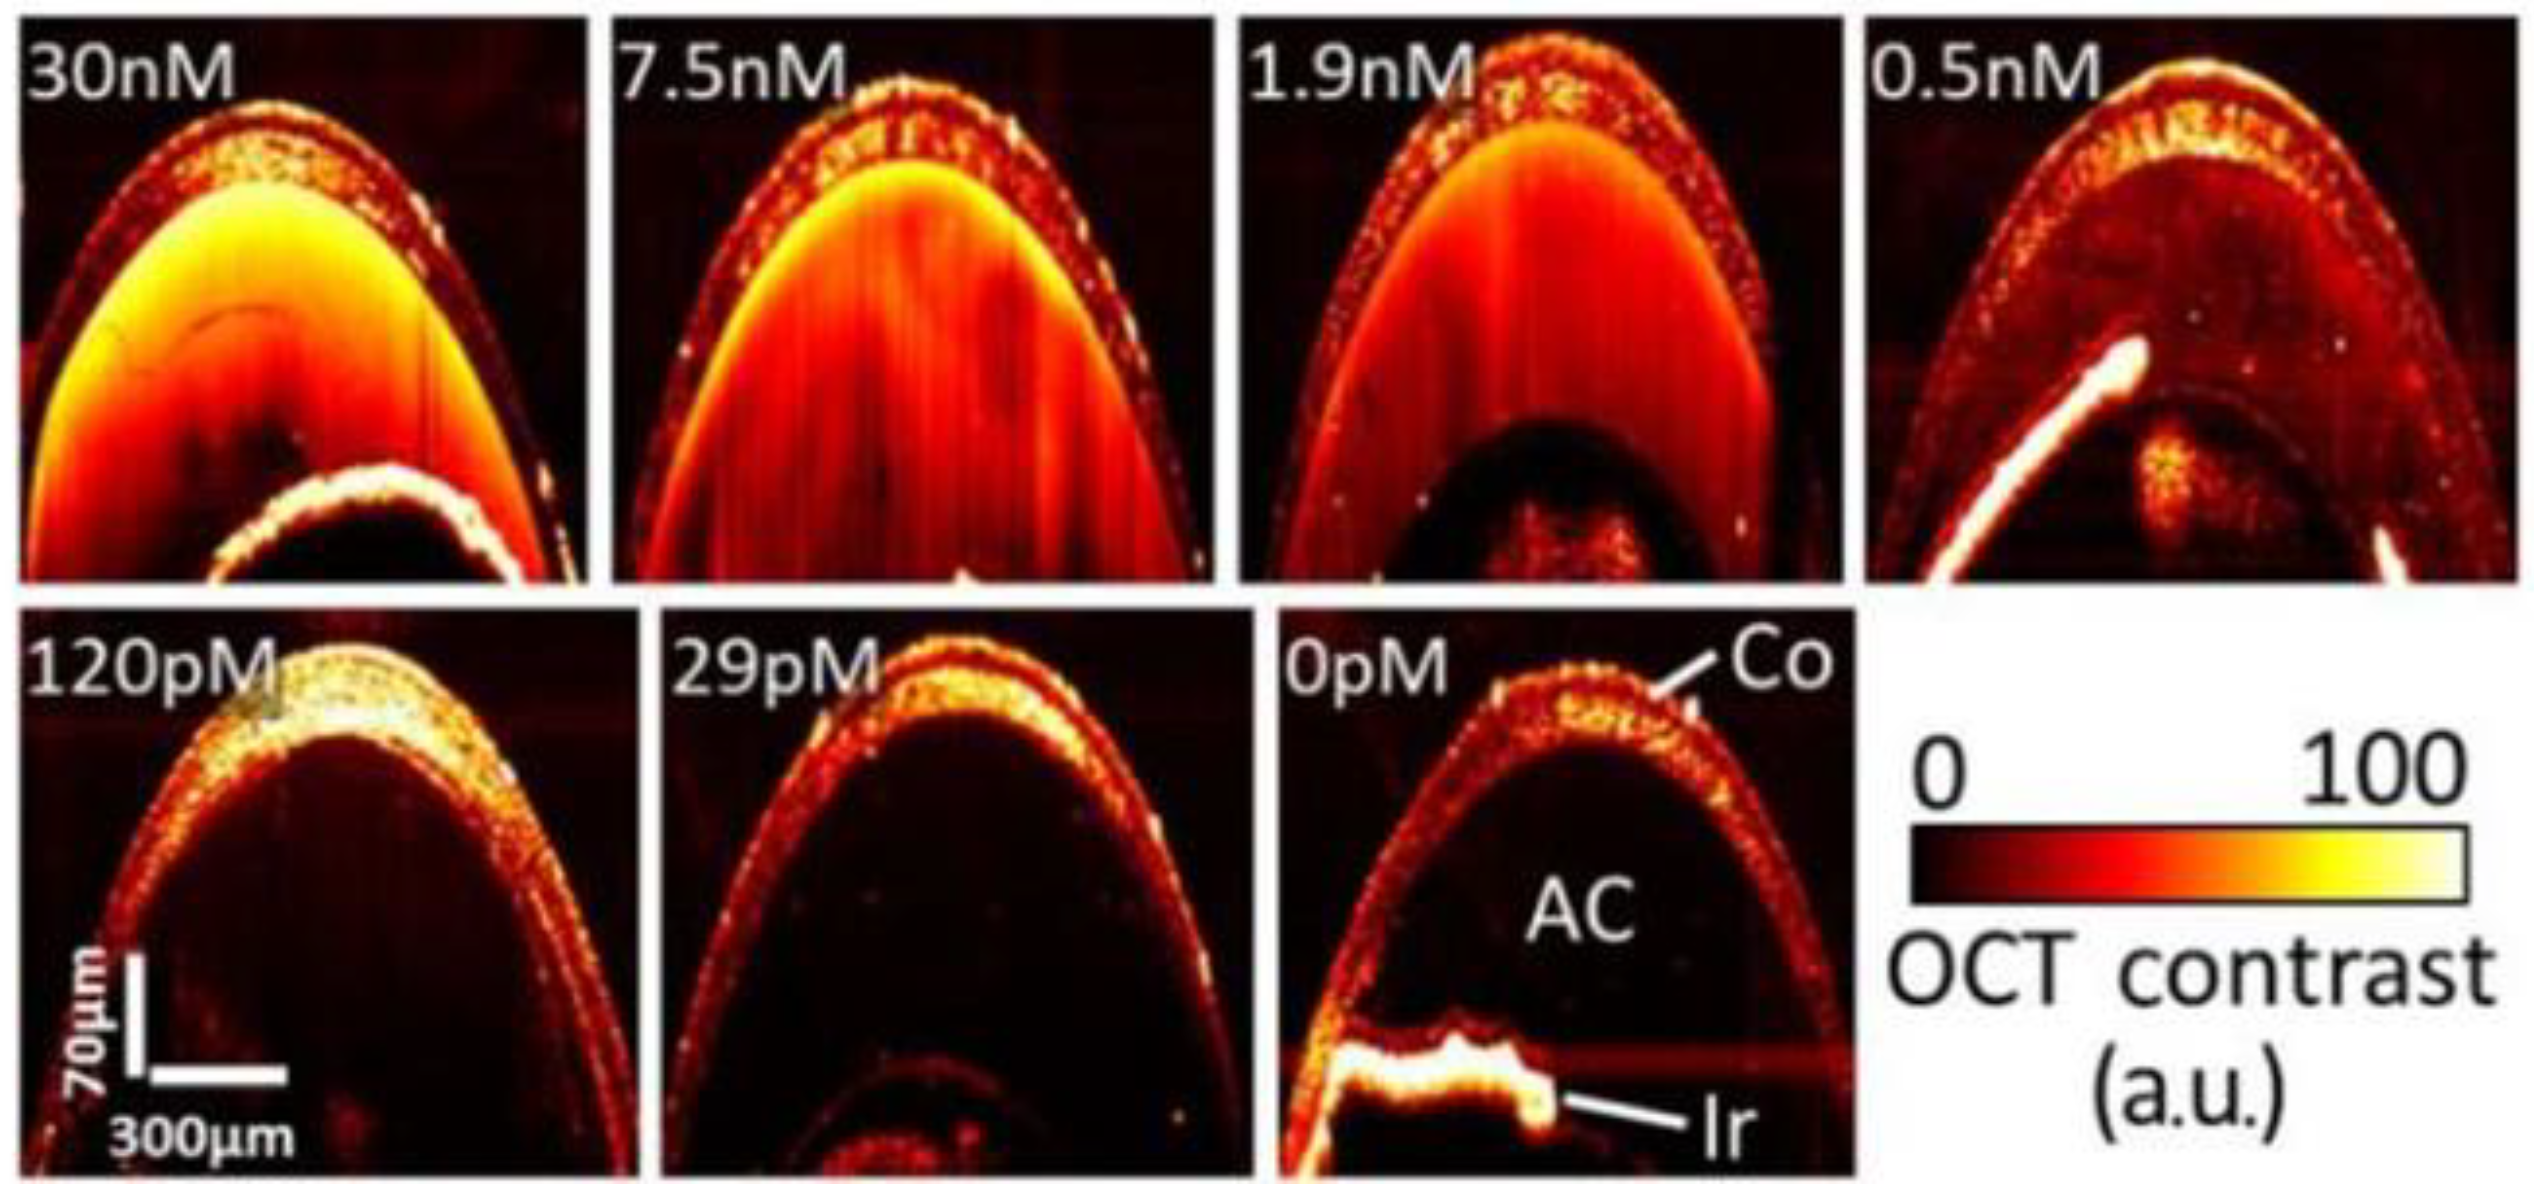
| SD-OCT | PEG-coated nanorods | GNR-780: length: 43 ± 4.22 nm; diam.: 12 ± 0.25 nm GNR-850: length: 49.31 ± 6.9 nm, diam.: 12.09 ± 1.63 nm | 780 nm & 850 nm | GNR-780: 50 nM/5–10 μL (corneal stroma) GNR-850: 29 pM-30 nM/3–5 μL (AC) | Anterior chamber (AC) (GNR-850) & corneal injections (GNR-780) | Wild-type C57BL/6 mice | GNR-780: injected corneas: ×3 stronger signal vs. BSS-injected and ×7.5 vs. naïve mice; concentrations > 5 nM lead to clear contrast GNR-850: Threshold concentration for significantly enhanced signal > 120 pM | De la Zerda et al. [90] |
| SD-OCT | mPEG-coated nanorods | ~110 × 32 nm | 824–830 nm (longitudinal) | 10 nM/200 μL (in steps of 25 μL) | Intravenous injections | Nu/nu mice | Images of the retinal blood vessels showed that AuNRs were perceived at a sensitivity of ~0.5 nM | Sen et al. [91] |
| SD-OCT | Nanorods coated with poly(strenesulfate)/(PSS–AuNRs) or anti-CD90.2 antibodies/Ab-AuNRs | Aspect ratio: ~3.4 | PSS–AuNRs: 850 nm Ab–AuNRs: 857 nm | 2 μL | Intravitreal injections | C57BL/6 mice | Enhanced backscattered signal in the vitreous of the mice vs. control group, even after 24 h | Sandrian et al. [92] |
| OCT | CTAB-coated nanorods, PEG-coated nanorods, Targeted nanorods (ICAM2) | Diameter: 10 nm | 808 nm | 100 μL of the AuNR solution for IV injections | Intravitreal & Intravenous Injections | Wild-type C57BL/6 mice, LCNV model | Images after Intravitreal CTAB–AuNRs inj. showed amorphous opacity, PEG–AuNPs intravitreal inj. had no shadowing effect, IV inj. of targeted NPs caused unclear results due to retinal background noise | Gordon et al. [93] |
| PT-OCT | PEG-coated nanorods | diameter: 10 nm, length: 35 nm | 750 nm | 1.66 nM/ 100 μL | Intravenous injections | Pigmented mice C57BL/6, LCNV model | Statistically significant (p < 0.05) increase in the PT-OCT signal in the LCNV lesions vs the control group | Lapierre-Landry et al. [95] |
| SD-OCT | Nanodisks | 160 nm | 830 nm | 0.1–10 pM | Intravitreal injections | C57BL/6 J mice | Threshold concentration for significant OCT enhancement vs. the control group was found 1 pM, Signal increases in a dose-dependent manner | Song et al. [96] |
| OCT | PEG-coated nanospheres | Average diameter: 20 nm | 532 nm | PRPs incubated with AuNPs at a concentration of 0.2 mg/mL | AuNP- & fluorescently labeled PRPs transplanted intravitreally & subretinally | Long-Evans pigmented rats | Prolonged monitoring of the transplanted AuNP-labeled cells was possible even after 1 month | Chemla et al. [98] |
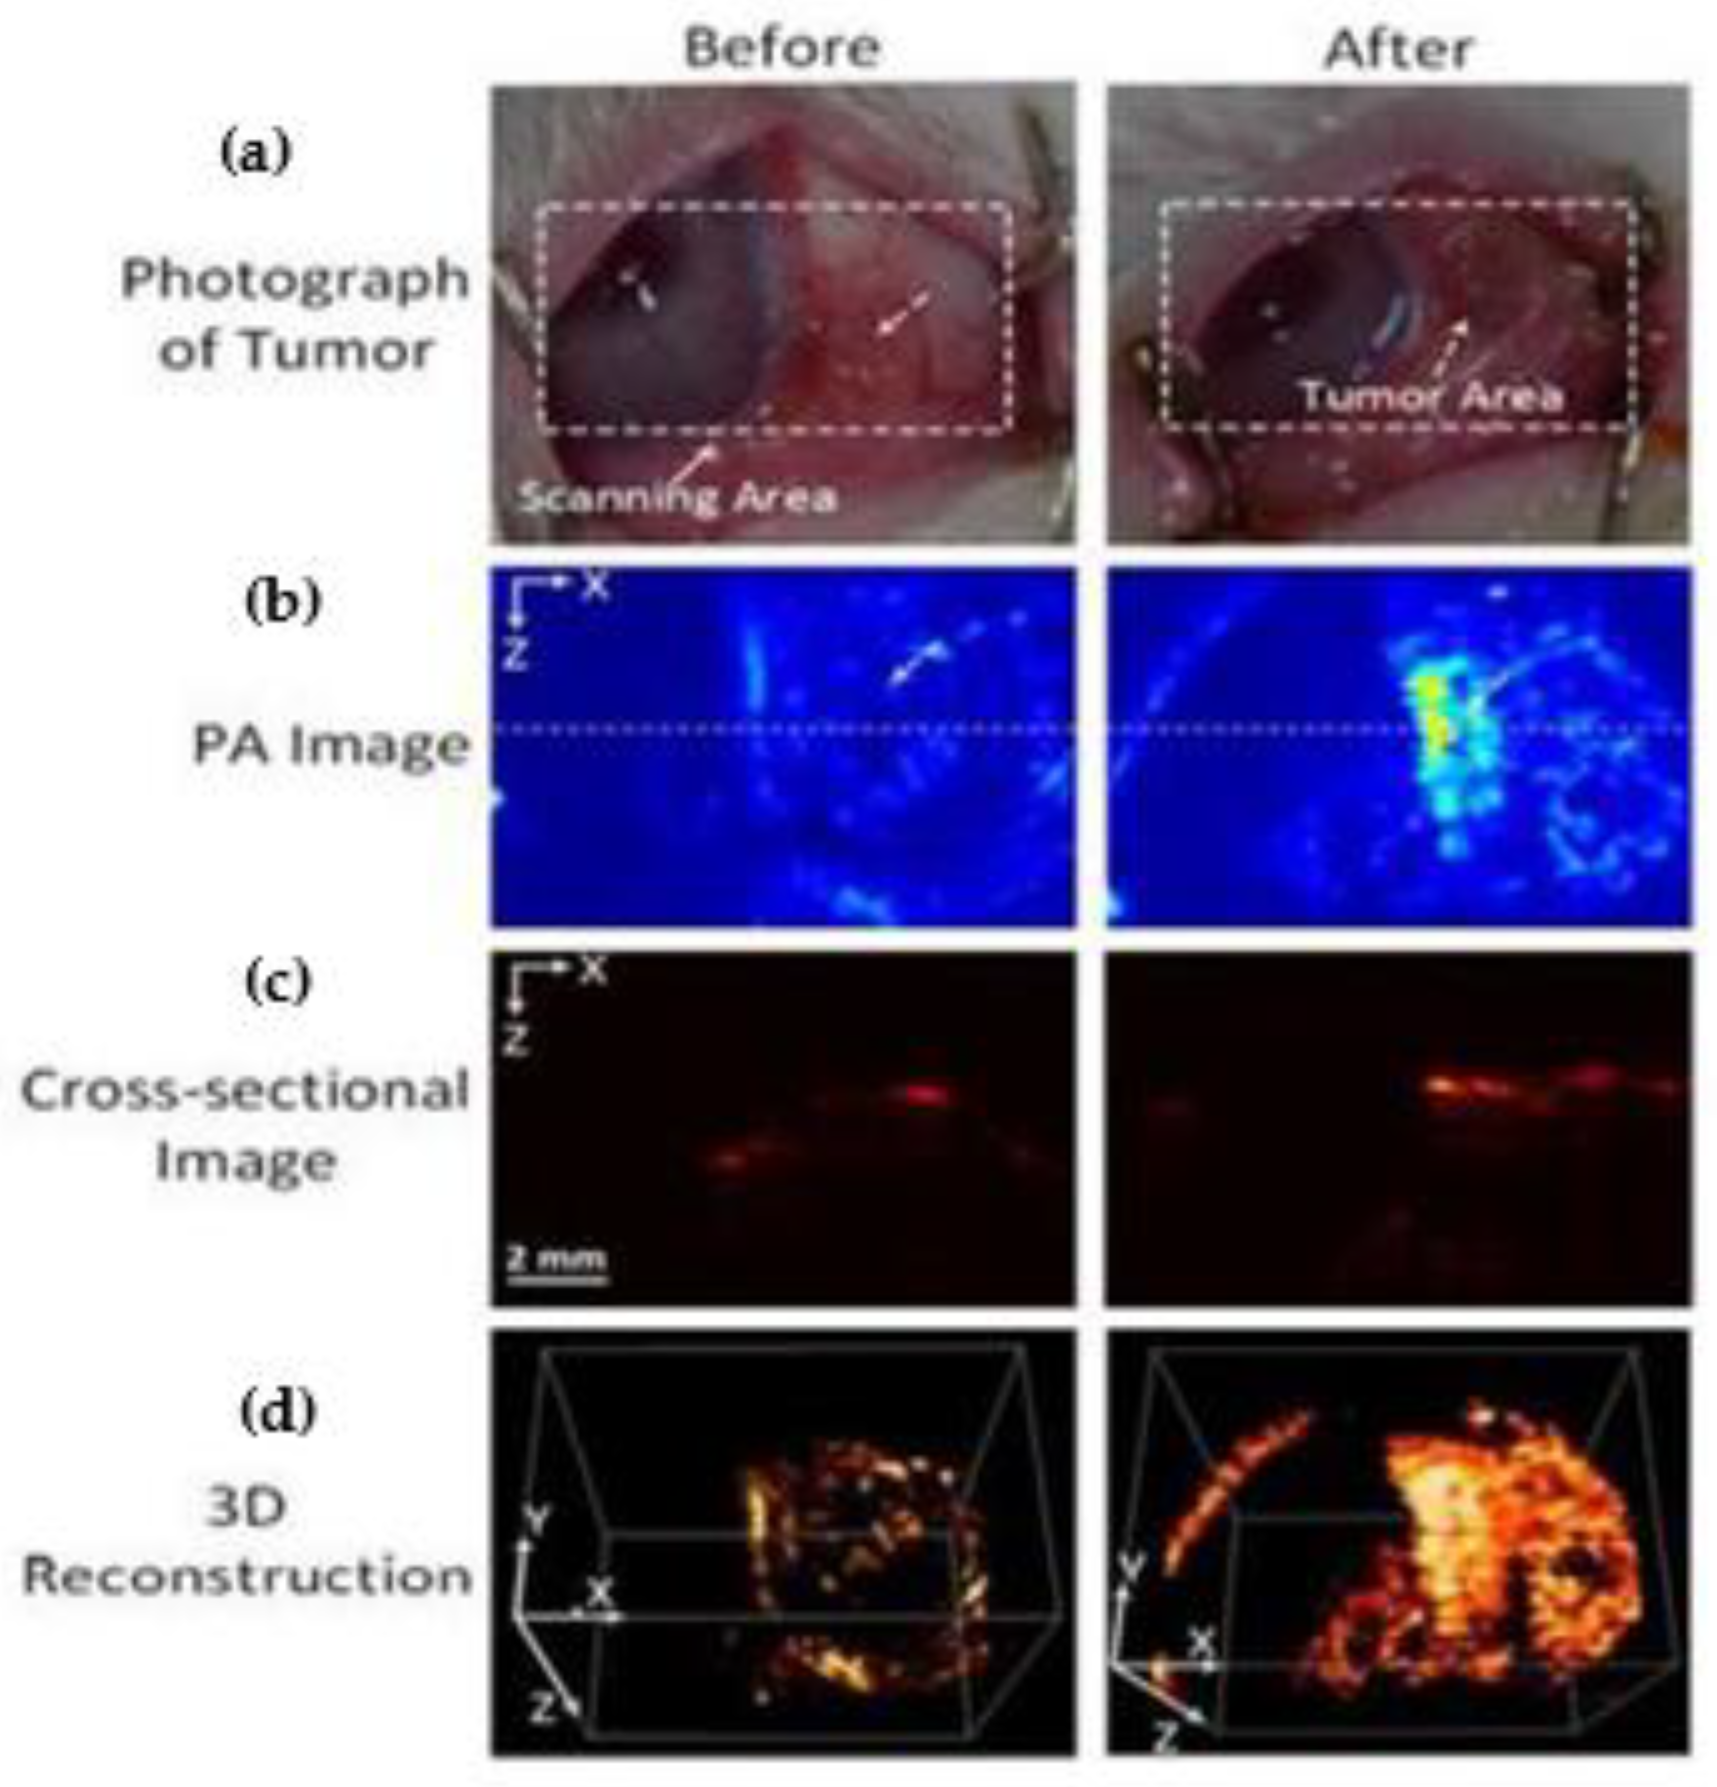
| PAI | Doxorubicin-coated nanospheresloaded with fucoidan (Dox-Fu@AuNPs) | 101.5 ± 23.2 nm | 532 nm | 200 µg/µL/ 100 µL | Intratumoral injection in the rabbit eye VX2 tumors | New Zealand white rabbits | Dox-Fu@AuNPs- injected tumors showed stronger PA signals vs. pre-injection, X 2 deeper image depth (p < 0.001) | Kim et al. [104] |
| Multimodal PAM & OCT | PEG-coated nanospheres | 20.0 ± 1.5 nm | 520 nm | 5 mg/mL/ 0.8 mL | Intravenous injections | New Zealand white rabbits | The OCT & PAM signal from retinal and choroidal visualization was increased by 45% and 82% respectively vs. control group | Nguyen et al. [108] |
| Multimodal PAM & OCT | Nanostars conjugated with RGD peptide | Average diameter: 30 nm | 650 nm | 5 mg/mL/ 400 μL | Intravenous injections | New Zealand white rabbits, CNV model | Photoacoustic performance raised × 17 and OCT intensities were elevated by 167% | Nguyen et al. [109] |
| Multimodal PAM & OCT | Chain-like gold nanoparticle (CGNP) clusters conjugated with RGD peptide | Average diameter: 20 nm | 650 nm | 5 mg/mL/ 400 μL | Intravenous injections | New Zealand white rabbits, CNV model | Photoacoustic performance raised × 17 and OCT intensities were elevated by 176% | Nguyen et al. [110] |
Disclaimer/Publisher’s Note: The statements, opinions and data contained in all publications are solely those of the individual author(s) and contributor(s) and not of MDPI and/or the editor(s). MDPI and/or the editor(s) disclaim responsibility for any injury to people or property resulting from any ideas, methods, instructions or products referred to in the content. |
© 2023 by the authors. Licensee MDPI, Basel, Switzerland. This article is an open access article distributed under the terms and conditions of the Creative Commons Attribution (CC BY) license (https://creativecommons.org/licenses/by/4.0/).
Share and Cite
Kavalaraki, A.; Spyratou, E.; Kouri, M.A.; Efstathopoulos, E.P. Gold Nanoparticles as Contrast Agents in Ophthalmic Imaging. Optics 2023, 4, 74-99. https://doi.org/10.3390/opt4010007
Kavalaraki A, Spyratou E, Kouri MA, Efstathopoulos EP. Gold Nanoparticles as Contrast Agents in Ophthalmic Imaging. Optics. 2023; 4(1):74-99. https://doi.org/10.3390/opt4010007
Chicago/Turabian StyleKavalaraki, Alexandra, Ellas Spyratou, Maria Anthi Kouri, and Efstathios P. Efstathopoulos. 2023. "Gold Nanoparticles as Contrast Agents in Ophthalmic Imaging" Optics 4, no. 1: 74-99. https://doi.org/10.3390/opt4010007
APA StyleKavalaraki, A., Spyratou, E., Kouri, M. A., & Efstathopoulos, E. P. (2023). Gold Nanoparticles as Contrast Agents in Ophthalmic Imaging. Optics, 4(1), 74-99. https://doi.org/10.3390/opt4010007