Abstract
Gas remote detection is useful for early warning of gas leakage and toxic chemicals. Optical gas imaging (OGI) built with an uncooled infrared camera is superior to cooled detectors in terms of cost. Current mainstream OGI technologies fall short in their detection of gases at ambient temperature and their ability to classify multiple gases. A multi-spectral uncooled imager is developed to try to solve these problems, which is constructed from a commercial uncooled thermal camera and wide band filters. To solve filter self-radiation and unevenness, a correction method is devised, with an ambient temperature blackbody placed in front and subtracted from the measured image. Based on waveband cutoffs, filters are classified into target-sensitive filters and background filters. Multi-spectra are simulated according to wide band filter transmittance, which can be used in gas classification. A sulfur hexafluoride (SF6) experiment is conducted outdoors at a distance of 10 m. An SVM model is trained to classify gas release in real time. Detection with a cold sky background is improved with the aid of data cube differences in a time sequence. The SF6 outdoor experiment concluded with preliminary effective results of ambient temperature gas remote detection.
1. Introduction
Early warning of hazardous and toxic gases is significantly meaningful in industry manufacturing and for people’s lives. Passive infrared remote sensing technology has great potential and some instruments have been deployed in real applications. Optical gas imaging (OGI) gas detection has comparative advantages against traditional technical methods [1]. For example, transformer switches in electricity grids filled with sulfur hexafluoride (SF6) need scheduled inspection. In this application, a hand-held and real-time detection instrument is necessary, making it suitable for OGI application, while traditional instruments are high-cost and complicated to operate.
Current mainstream passive gas detection measures are categorized into two ways: (1) single band imagers and (2) multi-spectral or hyperspectral imagers. Those in the first category use a focal array detector to show gas leakage, utilizing the temperature contrast between the gas and the background [2,3]. The gases capable of being detected are sensitive to the chosen filter band, and different cameras are required for different gases or families of gases, which brings inconvenience and higher cost. Imagers in the second category take advantage of multiple filters or dispersing optical elements to obtain spectral information, which makes it possible for different gases to be detected simultaneously. Hyperspectral imagers have overwhelming superiority in sensitivity, classification ability, etc. [4,5,6,7,8], but their huge size and high cost hinder them from being widely deployed. Multi-spectral imagers balance cost and the ability to classify multiple gases, while gas detection in ambient temperature is still a big challenge [2]. Second-sight made by Bertin utilizes adjacent pixels’ differences to remove background [9,10]. Telops uses multiple filters in the long-wave infrared band to monitor gas releasing in real time [11,12]. Rebellion uses a compact optical system in gas leak detection [13,14].
Uncooled detectors have relatively low sensitivity, but low cost also makes them useful in some gas release detection applications, such as massive gas leaks, short-distance gas release monitoring, etc. The big challenge is noise and low detection rate in ambient temperature and the fact that, for warm filters, calibration is necessary for deployment outdoors [15]. This paper tries to develop a simple, but useful, setup for ambient gas detection, and a SF6 release experiment is undertaken to preliminarily verify effectiveness.
2. Multi-Spectral Gas Detection Principle
Gas detection at a remote distance using infrared cameras raises concern for its convenience and easy operation. In most scenarios, gases are monitored within 1 km. This short-distance remote sensing is often used indoors or for factory surveillance. The gas at a short distance is represented by the two layers model. The background is artificial or natural objects, and the hazardous cloud is positioned between the background and the detector, such as in Figure 1.
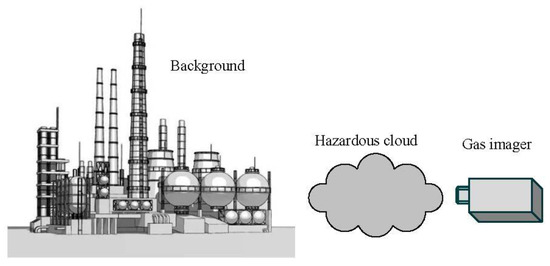
Figure 1.
Gas remote sensing model.
The radiation arrived at the detector is the summation of transmitted background radiation and cloud emission, which is written as:
In the equation, is wavelength, with a unit of μm. L is radiance, with a unit of W/(m2* sr*μm), with subscript letters b and c referring to background and cloud. is transmittance of hazardous cloud, which relates exponentially to gas path concentration length:
In the equation, is gas absorption intensity, with a unit of (ppm*m)−1. is gas path concentration length, with a unit of ppm*m.
Wide band filters block light that has a wavelength outside of the filter band cutoffs. The radation arrived at the chip sensor is written as integration within band limits.
In the equation, is voltage signal of integration within the filter band. The subscript letters L and H represent low and high wavelength limit, respectively. is corresponding coefficient of wide band filters, which is related to waveband cutoffs. is systematic responding coefficient combined by camera lens and IR sensor chip.
In most cases, filters’ band limits are narrower than sensors’ responding waveband limits, so the systematic responding coefficient is regarded as constant in filter band section, and could be removed from the integration. Equation (3) could be written as:
Commonly, system voltage signal is nonlinear to object temperature, and their relation is obtained by curve fitting. In this procedure, calibration is taken with different blackbody temperatures set. The output is temperature image for commercial thermal cameras.
For gas leak application, the temperature difference between background and gas is usually small. The radiation difference is assumed to be approximately linear to temperature difference in Equation (1):
In this equation, represents blackbody radiance calculated with the Plank formula. is temperature spectrum related to wavelength, with a unit of K. Most natural backgrounds are similar to gray body independent of wavelength, which is represented by equivalent blackbody temperature . is temperature difference between cloud and background.
Substituting (5) into (1), is omitted and Equation (1) is written as:
For thermal cameras, temperature is nonlinear to radiance integration:
The subscript letter c represents camera. Parameters and are coefficients through radiation calibration procedure.
To simplify, the corresponding coefficient of wide band filters is constant in band interval, so can be removed from the integral. Combining Equations (6) and (7), Equation (4) can be expressed in temperature form:
Taking the constant parameter a simplified form, Equation (8) is written as:
In this equation, is system gain coefficient representing filters’ attenuation effect. is gas absorption integration in filter waveband.
Given the condition without gas in the field of view, is omitted in Equation (9), and can be calibrated by measurement of different temperature blackbody. By removal of from the equation, temperature is obtained as output:
In this equation, represents filter temperature image.
By selecting multiple filters, every pixel in the image forms a multi-spectrum in temperature type, and through a classification method, gas leakage can be detected in real time.
3. A Multi-Spectral Uncooled Camera for Gas Imaging and Radiation Correction Method
A commercial uncooled camera for temperature measurement is used as a detector for gas imaging. Radiation from narrow band filters enormously increases the instability of the signal arriving in the detector. Wide band filters are suitable in band selection for an uncooled infrared detector. By carefully selecting filter band parameters combined with gas absorption lines, the gas visibility is enhanced in the selected filter image.
Two major restrictions hinder gas multi-spectral acquisition. The first is radiation of wide band filters, which brings radiation fluctuation coming from self-temperature variation and uneven radiation coming from reflection of chip temperature variation. To overcome this challenge, subtraction of ambient blackbody radiation is used for filter radiation correction. The second restriction is re-calibration. The gas detection outdoors is under normal atmospheric conditions at a distance of a few hundred meters, and gas released in air is quickly mixed with ambient atmosphere, so this satisfies the normal natural temperature range in most cases. Calibration is carried out with different blackbody temperatures, and a quadratic curve is fitted to obtain calibrated output temperature.
3.1. Multi-Spectral Uncooled Camera Prototype Instrument
The setup is shown in Figure 2. A filter wheel, driven by a motor to turn it, is placed in front of the camera lens. The image is captured when the filter is right at the front. All images through filters sequentially captured form a data cube. Every pixel has 5 channel values used for classification. An ambient blackbody is set aside and placed in front of filters manually for radiation correction.
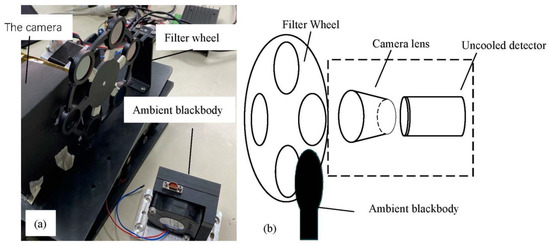
Figure 2.
(a) The multi-spectral camera setup. (b) System structure prototype when working.
The setup uses an on-shelf commercial thermal camera, the parameters of which are listed in Table 1.

Table 1.
Parameters of commercial thermal camera.
A commercial uncooled LWIR (long-wave infrared) camera for temperature measurement is chosen to acquire temperature images. A filter wheel is set in front of the camera lens for structure convenience, and a few wide band filters are installed in the filter wheel. An ambient blackbody is used to correct filter radiation. The prototype instrument layout is shown in Figure 2.
Ambient radiation is acquired by setting the ambient blackbody in the front. After that, their values are subtracted from outside values, as the function of filter radiation removal. This simple structure plays the role of a shutter in the camera for interior radiation correction [15].
Wide band filters are selected according to gas infrared absorption features. Filters are made of silicon which is 5 mm thick and has a diameter of 25 mm. This equipment is designed for SF6 leakage detection, so one filter covers SF6 absorption lines and a reference filter covers the wavebands without of SF6 absorption. In order to extend gas detection ability, other filters are selected. All filters combine into a multi-spectrum, which identifies and classifies the gases. The selected filters and SF6 absorption band are shown below.
In Figure 3, all transmittances of wideband filters are shifted in the plot for clear presentation. The transmittance curves are plotted according to filters’ theoretical cut-off band information. The dashed lines represent filters’ transmittance indexed 1–5 from left to right. All filters’ transmittances are located within the camera’s responding waveband. A prominent stretch vibrational band of SF6 is located between the start wavelength of filter 4 and filter 5. Filters 1–3 also span SF6 absorption peaks, but they have relatively low sensitivity because of the small occupation of SF6 in waveband intervals. A multiband spectrum is formed by every radiation integration within the filter intervals.
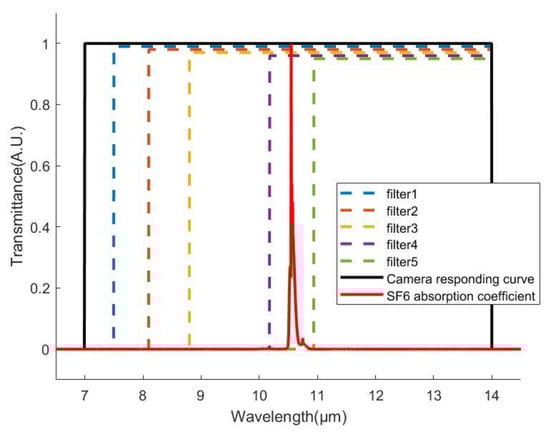
Figure 3.
Spectral transmittance curve of wideband filters, camera responding curve, and absorption coefficient of SF6. All transmittance curves are shifted to be easily distinguished. SF6 absorption coefficient is normalized for clear presentation.
3.2. Filter Radiation Correction and Calibration
The output of the commercial IR camera is the temperature image, which changes with filters placed in front of camera. The uncooled infrared detector has a low signal-to-noise ratio relative to an cooled detector. Wide band filters keep image visibility as well as spectral information, but uncooled filters’ self-emission decreases temperature image accuracy, and reflection of the chip as a heat source increases image unevenness and decreases image uniformity. An ambient blackbody is designed to correct filter radiation. The following pictures are comparisons of filters before and after radiation correction, from which this simple method has obtained quite good results, shown in Figure 4. The rectangle areas in filters 4 and 5 show severe unevenness in the upper row, and after correction clear images are acquired in these areas.
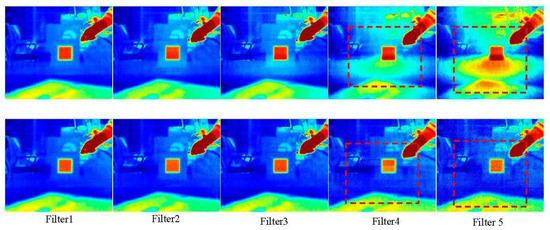
Figure 4.
The upper and lower row figures are thermal images before and after correction, respectively. The dashed-line rectangles in filters 4 and 5 show the uneven effect of the filter, and, in the lower row, clear images in the rectangle areas show the correction effect.
The radiation is nonlinear to temperature, and a quadratic curve is often used to fit the relationship of these two variables. The output of the commercial infrared camera is a thermal image, which is calibrated in advance. Wide band filters cut off the camera’s responding curve, and narrow throughput flux arrived at the sensor. A new set of calibration coefficients is produced by fitting measured data and real temperature. Our application scenario is outdoors or indoors short distance, so the normal natural temperature range satisfies requirements. We measured the blackbody at 10 °C intervals from 0 to 50 °C. The fitting curve is shown below.
The calibration fitting in Figure 5 aims to adjust the temperature value altered by filter installment, which is represented as coefficient in Equation (9). Each filter has different coefficients because of different waveband cutoffs. After this calibration procedure, the output image shows real temperature after filters’ uneven reflection and attenuation removed.
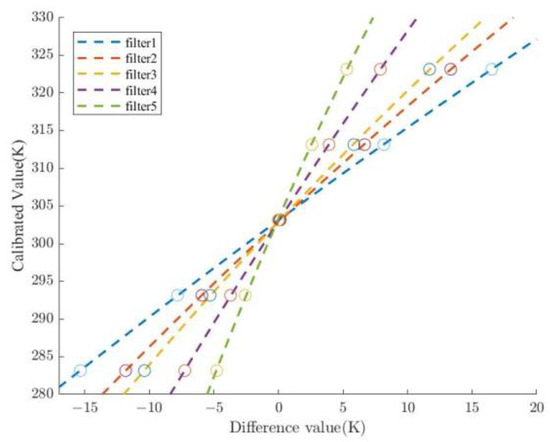
Figure 5.
Calibration fitting of blackbody in temperature from 0 to 50 °C. The dashed line is the fitting curve, and the circle is the difference value between output and ambient temperature blackbody.
4. Gas Classification and SF6 Experiment
After radiation correction and system calibration, a data cube of temperature is obtained. Every pixel includes 5 filters’ temperature value as a multi-spectrum. Most natural background objects are deemed to be gray body, whose emissivity is assumed constant in the long-wave infrared band [16]. Based on this assumption, filters overlapping gas absorption band have relatively lower temperatures than the background. Hazardous gas has specific absorption spectral features, which enables classification for some groups of gases. In this paper, SF6 is taken as an example to demonstrate our method.
4.1. Multi-Spectra of SF6 and Classification Method
SF6 has weak absorption in filters 1–3, slightly strong absorption in filter 4, and no absorption in filter 5. According to the theory in Section 2, SF6 multi-spectra are simulated by combining the SF6 absorption spectrum and filter wave band. SF6 absorption is proportional to the temperature difference between the background and the cloud. In Figure 6, SF6 spectra are simulated with a cloud temperature of 287 K and higher background temperature. From top to bottom, background temperatures are 0 K, 5 K, 15 K, 20 K, and 25 K higher than the cloud. The difference between filters 4 and 5 is SF6 absorption intensity. Figure 6 shows that intensity increases with temperature difference. Intensity may be lower than noise in small temperature difference conditions, which cannot be detected.
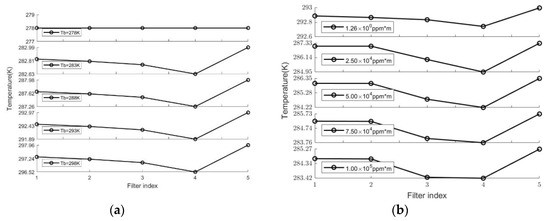
Figure 6.
(a) Simulated SF6 spectra with different background temperature, shown as Tb, at cloud temperature 278 K, CL 2e4 ppm*m. (b) Simulated SF6 spectra with different concentration at background temperature 293 K, air temperature 278 K.
The reason behind the decrease in filters 3 to 1 in Figure 6 is that the SF6 absorption peak integration varies with the filter’s waveband. The small proportion of SF6 peak area in the filter’s waveband corresponds to the small decrease.
Gas absorption intensity also relates to CL values. Figure 6b simulates different CL conditions for SF6. It can be seen that multi-spectra change little at small CL values, such as lower than 5e-2 molecules*m, but at big CL values, filter 3 intensity increases and filter 4 saturates.
Considering all possible conditions, the multi-spectra are classified using the SVM (support vector machine) method [17,18]. SVM is a supervised machine learning algorithm for classification. The decision hyperplane is determined by support vectors. By specifying SVM kernels, high dimensional cases may be effectively solved. By generating background and target spectral datasets, the SVM model is trained to classify measured spectra. In this paper, the Gaussian kernel is adopted for model training.
4.2. Atmosphere Interference
The atmosphere interference cannot be neglected in long-distance scenarios, and the atmosphere outdoors has such strong absorption that the target signal is overwhelmed or transformed. In some cases, most background objects are a short distance away, about a few hundred meters, but some sky occupies part of the image’s background. In other cases, the background is about a few kilometers away, and the atmosphere has obvious absorption in the spectrum. SF6 transmittance is calculated according to Equation (2), and atmosphere transmittance is simulated by MODTRAN. The combined transmittance of the atmosphere and SF6 is a multiplication of both. Figure 7 shows atmosphere transmittance by MODTRAN and simulated multi-spectra, from which SF6 absorption is severely affected by atmosphere absorption.
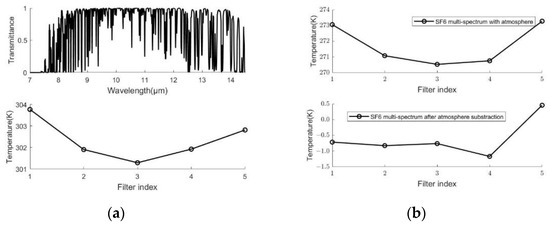
Figure 7.
(a) Atmosphere transmittance spectra by MODTRAN and its multi-spectrum. (b) SF6 multi-spectrum comparison before and after atmosphere subtraction.
However, the gas outdoors is fugacious and dissipated quickly. Taking advantage of this property, a time sequence differential method is devised to mitigate atmosphere interference. Multi-spectra are produced by subtraction of adjacent data cubes. Figure 7b shows SF6 multi-spectrum before and after atmosphere subtraction. SF6 intensity is rarely shown at strong atmosphere absorption, but with adjacent data cube subtraction, SF6 intensity is abstracted.
The SF6 release experiment is carried out outdoors. SF6 is released from the sealed steel cylinder 10 m away with a flow rate of 2 L/min. The following figures show the classification results frames with SF6 colored in yellow. Between each picture in Figure 8, there is an 8 s interval. The SF6 is obvious at ground level, but not visible at tree level due to its low temperature difference. The sky background is classified with data cube difference.
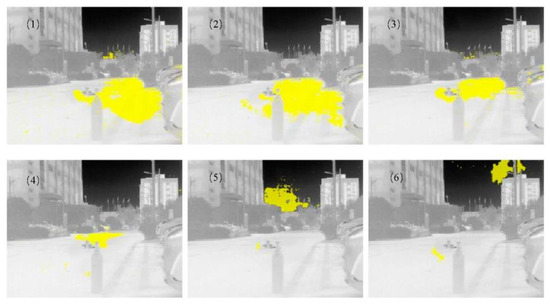
Figure 8.
SF6 release experiment and classification results colored in yellow. Each picture is taken 8 s intervals.
Although the SF6 release process is recorded in the image frames, the low rotation speed of filter wheel constrains image continuity. Moreover, more evaluation experiments should be undertaken, such as a sensitivity test, a detection limit test, and so on.
5. Conclusions
Hazardous gas in ambient temperatures is hard to detect using thermal imaging devices. Multi-spectra, generated by wide band filters, make it possible to detect and recognize gas at air temperature. Filter radiation increases fluctuation and unevenness of temperature images, and an ambient temperature blackbody is placed in front of the aperture to solve this problem. Calibration is carried out to obtain new coefficients of difference between the measured temperature and the blackbody. The temperature values of every wideband filter form multi-spectra. Simulated values correspond to measured ones according to filter band cutoffs. The SVM method is used in gas classification. Simulated multi-spectra are generated to train the SVM model. Differences of adjacent data cube improve detection ability with a cold sky background. The SF6 release experiment is conducted to verify the classification method. The preliminary outdoor test shows this multi-spectra setup is able to detect a gas leak in real-time. More performance ability experiments for field application are needed in areas such as detection limit ability, detection of mixtures of gases, and gas detection at different distances. False alarm rate is another big challenge for scenarios with moving objects that requires more robust detection algorithms.
Author Contributions
Conceptualization, F.-X.C. and A.-J.W.; methodology, F.-X.C.; software, J.W.; validation, Y.-Y.L., D.-C.L. and Y.Z.; formal analysis, Y.Z.; investigation, F.-X.M.; resources, W.-C.D.; data curation, F.-X.M.; writing—original draft preparation, F.-X.C.; writing—review and editing, F.-X.C.; visualization, A.-J.W.; supervision, Y.Z.; project administration, Y.Z.; funding acquisition, F.-X.M. All authors have read and agreed to the published version of the manuscript.
Funding
This research was funded by State Grid General Center Technology project (Project number: 521205210009).
Institutional Review Board Statement
The study was conducted in accordance with the Declaration of Helsinki, and approved by the Institutional Review Board of Anhui Institute of Optics and Fine Mechanics, (protocol code 230031 and approval date 2022-10-29), State Grid Anhui Electric Power Research Institute, (protocol code 230000 and approval date 2022-10-29).
Informed Consent Statement
Not applicable.
Data Availability Statement
Not applicable.
Conflicts of Interest
The authors declare no conflict of interest.
References
- Hagen, N. Survey of autonomous gas leak detection and quantification with snapshot infrared spectral imaging. J. Opt. 2020, 22, 103001. [Google Scholar] [CrossRef]
- Olbrycht, R.; Kaluza, M. Optical Gas Imaging With Uncooled Thermal Imaging Camera-Impact of Warm Filters and Elevated Background Temperature. IEEE Trans. Ind. Electron. 2020, 67, 9824–9832. [Google Scholar] [CrossRef]
- Hong, S.-Z.; Hu, Y.; Yu, H.-W. A VOCs Gas Detection Algorithm Based on Infrared Thermal Imaging. In Proceedings of the 31st Chinese Control and Decision Conference (CCDC), Nanchang, China, 3–5 June 2019. [Google Scholar]
- Eldon Puckrin, C.S.T.; Gagnon, M.; Bastedo, J. Vincent Farley and Martin Chamberland. In SPIE Defense, Security, and Sensing, Proceedings of the Airborne Infrared Hyperspectral Imager for Intelligence, Surveillance and Reconnaissance Applications, Baltimore, MD, USA, 23–27 April 2012; SPIE: Bellingham, WA, USA, 2012; Volume 8360, p. 836004. [Google Scholar]
- Thériault, J.-M.; Puckrin, E.; Lavoie, H.; Bouffard, F. Passive remote monitoring of multi-gas mixtures by FTIR radiometry. In Optics East, Proceedings of the Chemical and Biological Standoff Detection III, Boston, MA, USA, 23–26 October 2005; SPIE: Bellingham, WA, USA, 2005; Volume 5995, p. 59950F. [Google Scholar]
- Sabbah, S.; Harig, R.; Rusch, P.; Eichmann, J.; Keens, A.; Gerhard, J.H. Remote sensing of gases by hyperspectral imaging: System performance and measurements. Opt. Eng. 2012, 51, 111717. [Google Scholar] [CrossRef]
- Harig, R.; Keens, A.; Rusch, P.; Gerhard, J.; Sabbah, S. Hyperspectral Sensor for Analysis of Gases in the Atmosphere (HYGAS). In SPIE Defense, Security, and Sensing, Proceedings of the Algorithms and Technologies for Multispectral, Hyperspectral, and Ultraspectral Imagery XVI, Orlando, FL, USA, 5–9 April 2010; SPIE: Bellingham, WA, USA, 2010; Volume 7695, p. 76950B. [Google Scholar]
- Jean-Marc, T.; Puckrin, E. Remote sensing of chemical vapours by differential FTIR radiometry. Int. J. Remote Sens. 2005, 26, 981–995. [Google Scholar]
- Naranjo, E.; Baliga, S.; Bernascolle, P. IR Gas Imaging in an Industrial Setting. In Thermosense Xxxii; Dinwiddie, R.B., Safai, M., Eds.; SPIE-Int Soc Optical Engineering: Bellingham, WA, USA, 2010. [Google Scholar]
- Bernascolle, P.; Pelous, G.; Grenier, L. Remote detection of natural gas clouds in open field by IR imagery. In AeroSense, Proceedings of the Conference on Thermosense XXI, Orlando, FL, USA, 5–9 April 1999; SPIE: Bellingham, WA, USA, 1999. [Google Scholar]
- Gagnon, M.A.; Jahjah, K.A.; Marcotte, F.; Tremblay, P.; Farley, V.; Guyot, É.; Chamberland, M. Time-resolved Thermal Infrared Multispectral Imaging of Gases and Minerals. In Proceedings of the Conference on Multispectral, Hyperspectral, and Ultraspectral Remote Sensing Technology, Techniques and Applications V, Beijing, China, 14–16 October 2014. [Google Scholar]
- Farley, V.; Vallières, A.; Chamberland, M.; Villemaire, A.; Legault, J.F. Performance of the FIRST, a Longwave Infrared Hyperspectral Imaging Sensor. In Optics/Photonics in Security and Defence, Proceedings of the Optically Based Biological and Chemical Detection for Defence III, Stockholm, Sweden, 11–14 September 2006; SPIE: Bellingham, WA, USA, 2006; Volume 6398. [Google Scholar]
- Gao, L.; Kester, R.T.; Tkaczyk, T.S. Compact Image Slicing Spectrometer (ISS) for hyperspectral fluorescence microscopy. Opt. Express 2009, 17, 12293–12308. [Google Scholar] [CrossRef] [PubMed]
- Hagen, N.; Kester, R.T.; Walker, C. Real-time quantitative hydrocarbon gas imaging with the gas cloud imager (GCI). In SPIE Defense, Security, and Sensing, Proceedings of the Conference on Chemical, Biological, Radiological, Nuclear, and Explosives (CBRNE) Sensing XIII, Baltimore, MD, USA, 23–27 April 2012; SPIE: Bellingham, WA, USA, 2012. [Google Scholar]
- Nugent, P.W.; Shaw, J.A. Calibration of uncooled LWIR microbolometer imagers to enable long-term field deployment. In SPIE Defense + Security, Proceedings of the Conference on Infrared Imaging Systems—Design, Analysis, Modeling, and Testing XXV, Baltimore, MD, USA, 5–9 May 2014; SPIE: Bellingham, WA, USA, 2014. [Google Scholar]
- Beil, A.; Daum, R.; Harig, R.; Matz, G. Remote sensing of atmospheric pollution by passive FTIR spectrometry. In Remote Sensing, Proceedings of the Spectroscopic Atmospheric Environmental Monitoring Techniques, Barcelona, Spain, 21–25 September 1998; SPIE: Bellingham, WA, USA, 1998; Volume 3493, pp. 32–44. [Google Scholar]
- Chang, C.C.; Lin, C.J. LIBSVM: A Library for Support Vector Machines. ACM Trans. Intell. Syst. Technol. 2011, 2, 27. [Google Scholar] [CrossRef]
- Chang, C.C.; Lin, C.J. Training nu-support vector regression: Theory and algorithms. Neural Comput. 2002, 14, 1959–1977. [Google Scholar] [CrossRef] [PubMed]
Publisher’s Note: MDPI stays neutral with regard to jurisdictional claims in published maps and institutional affiliations. |
© 2022 by the authors. Licensee MDPI, Basel, Switzerland. This article is an open access article distributed under the terms and conditions of the Creative Commons Attribution (CC BY) license (https://creativecommons.org/licenses/by/4.0/).