
Topological and Optical Properties of Passeriformes’ Feathers: Biological UV Reflector Antenna

 ,
,  , , ,
, , , 
 and
and
Abstract
1. Introduction
2. Methods
3. Results and Discussion
3.1. Light Propagation from Air to Keratin Layer
3.2. Light Propagation from the Keratin Layer to the Melanin Layer
3.3. Multilayer Analysis
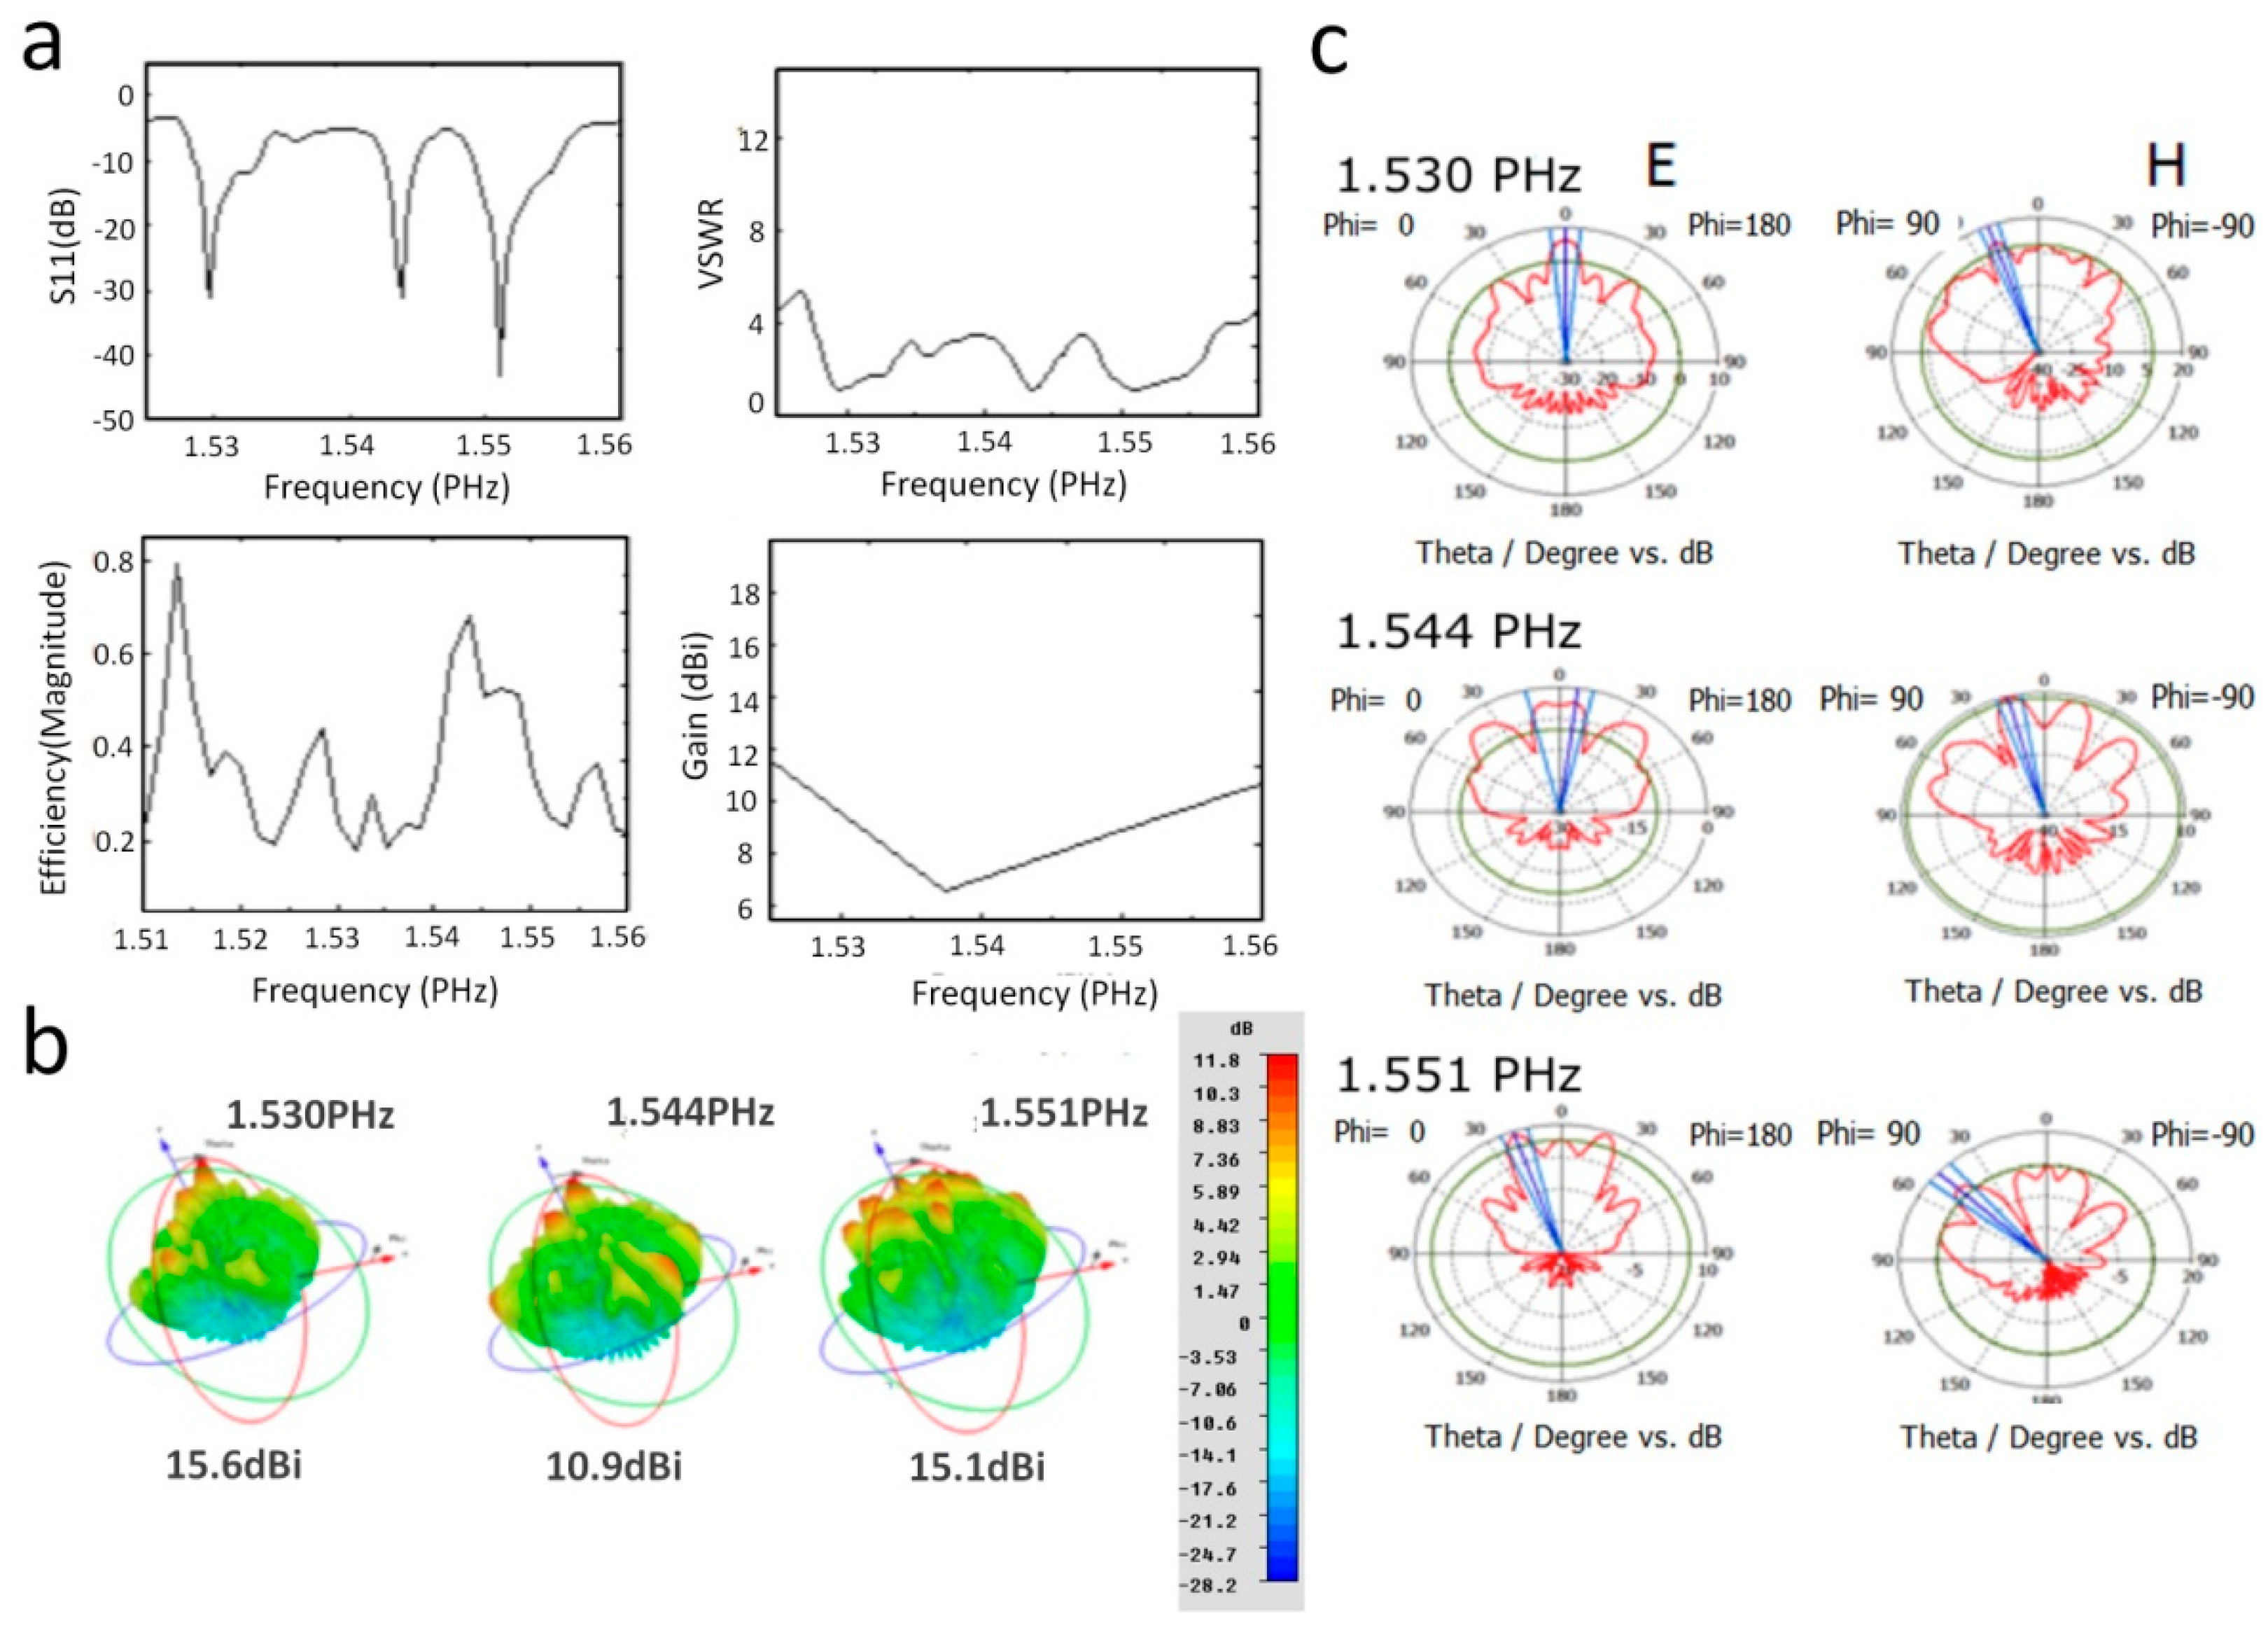
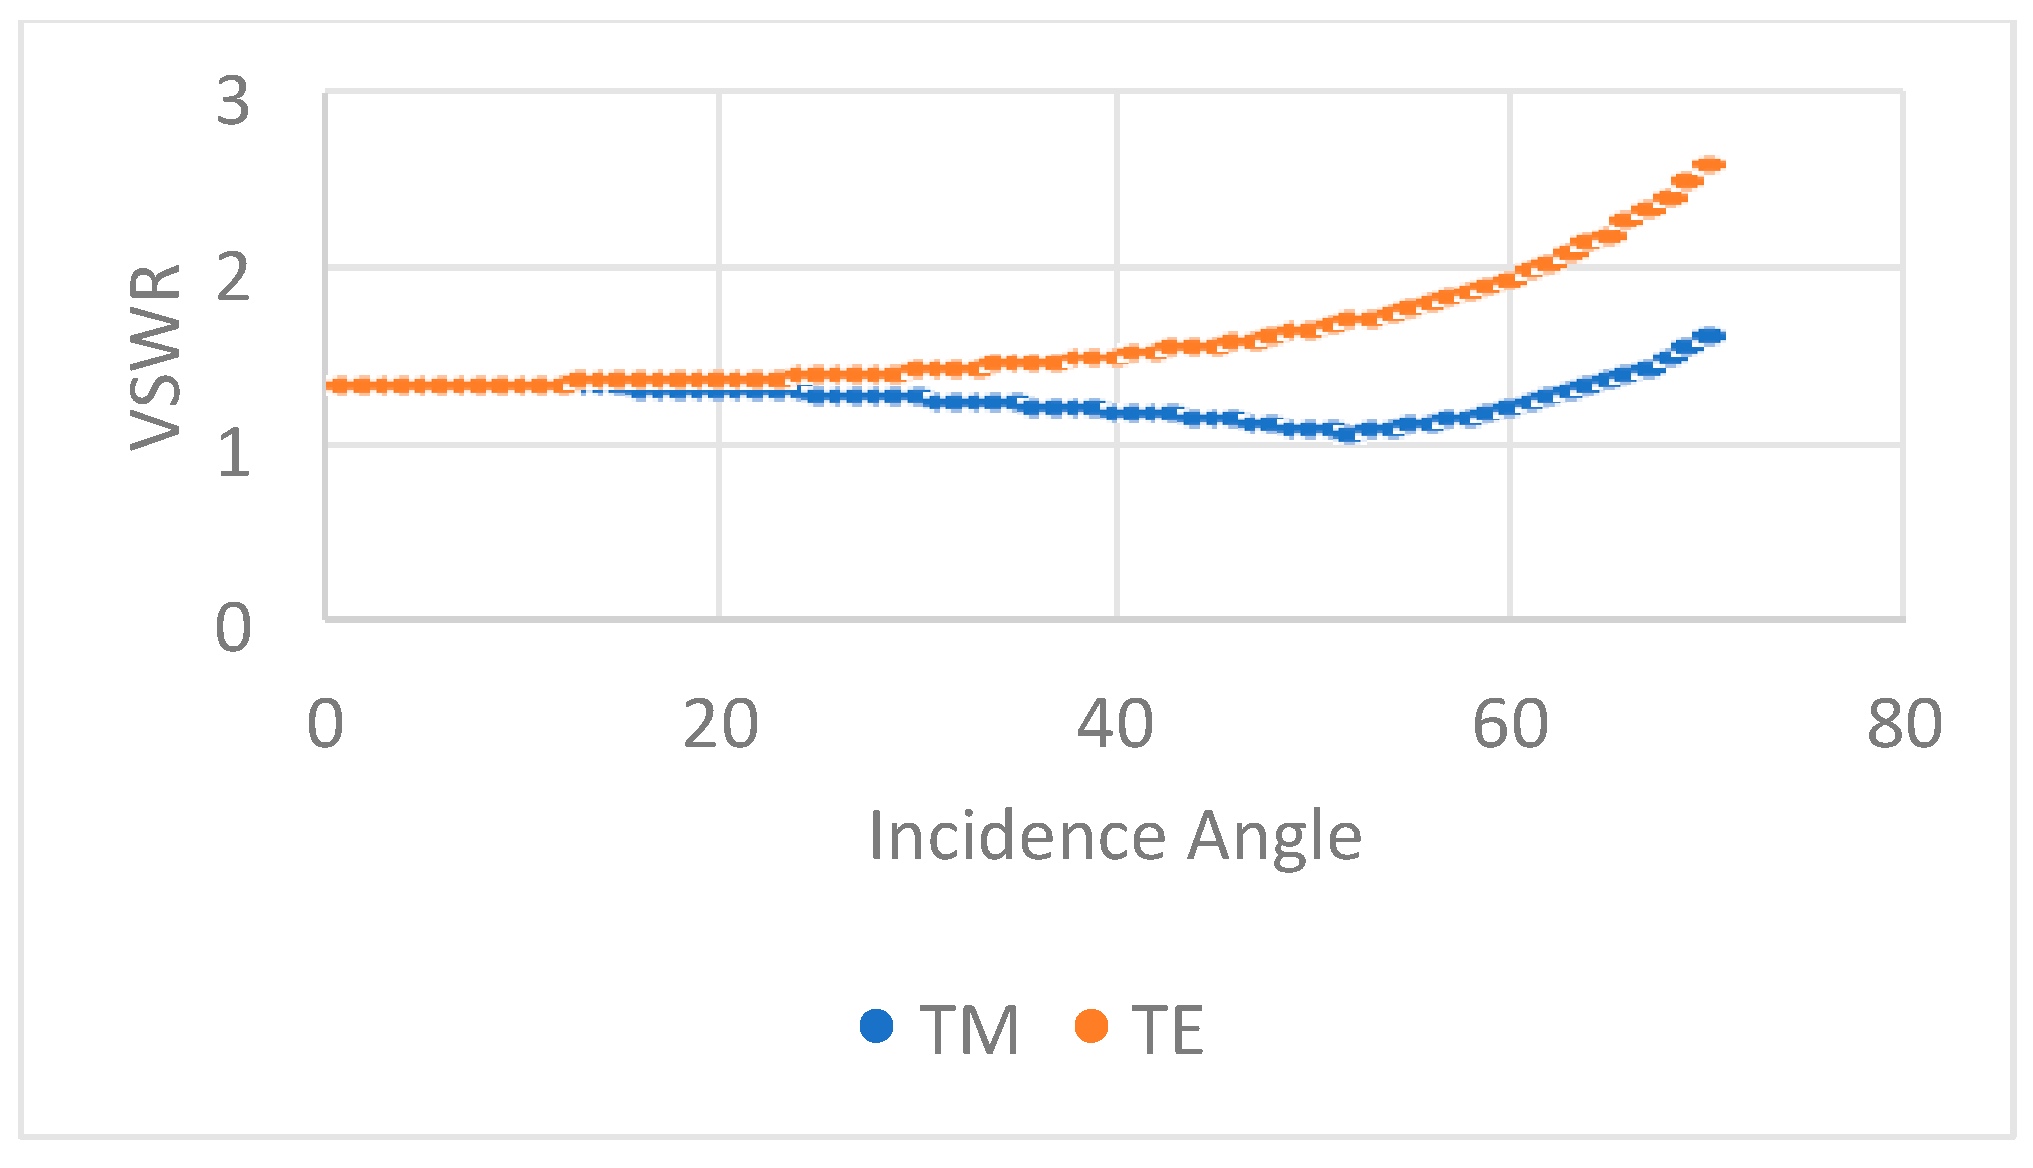
3.4. UV Antenna
4. Conclusions
Author Contributions
Funding
Data Availability Statement
Acknowledgments
Conflicts of Interest
References
- Yoshioka, S.; Kinoshita, S. Effect of Macroscopic Structure in Iridescent Color of the Peacock Feathers. Forma 2002, 17, 169–181. [Google Scholar]
- Mullen, P.; Pohland, G. Studies on UV reflection in feathers of some 1000 bird Species: Are UV peaks in feathers correlated with violet-sensitive and ultraviolet-sensitive cones. J. Compil. 2008, 150, 59–68. [Google Scholar] [CrossRef]
- Greenwalt, C.H.; Brandt, W.; Friel, D.D. Iridescent colors of hummingbird feathers. J. Opt. Soc. Am. 1960, 50, 1005–1013. [Google Scholar] [CrossRef]
- Prum, R.O.; Torres, R.; Williamson, S.; Dyck, J. Constructive inference of light by blue feather barbs. Nature 1998, 396, 28–29. [Google Scholar] [CrossRef]
- Shawkey, M.D.; Saranathan, V.; Pa'lsdo'ttir, H.; Crum, J.; Ellisman, M.H.; Auer, M.; Prum, R.O. Electron tomography, three-dimensional Fourier analysis and color prediction of a three-dimensional amorphous biophotonic nanostructure. J. R. Soc. Interface 2009, 6, S213–S220. [Google Scholar] [CrossRef]
- Stuart-Fox, D.; Newton, E.; Mulder, R.A.; D’Alba, L.; Shawkey, M.D.; Igic, B. The microstructure of white feathers predicts their visible and near-infrared reflectance properties. PLoS ONE 2018, 13, e0199129. [Google Scholar] [CrossRef]
- Shawkey, M.D.; Morehouse, N.I.; Vukusic, P. A protean palette: Color materials and mixing in birds and butterflies. J. R. Soc. Interface 2009, 6, S221–S231. [Google Scholar] [CrossRef]
- Saranathan, V.; Forster, J.D.; Noh, H.; Liew, S.-F.; Mochrie Simon, G.J.; Cao, H.; Dufresne Eric, R.; Prum Richard, O. Structure and optical function of amorphous photonic nanostructures from avian feather barbs: A comparative small-angle X-ray scattering (SAXS) analysis of 230 bird species. J. R. Soc. Interface 2012, 9, 2563–2580. [Google Scholar] [CrossRef]
- Osorio, D.; Ham, A.D. Spectral reflectance and directional properties of structural coloration in bird plumage. J. Exp. Biol. 2002, 205, 2017–2027. [Google Scholar] [CrossRef]
- D’Alba, L.; Van Hemert, C.; Spencer, K.A.; Heidinger, B.J.; Gill, L.; Evans, N.P.; Monaghan, P.; Handel, C.M.; Shawkey, M.D. Melanin-Based Color of Plumage: Role of Condition and of Feathers’ Microstructure. Integr. Comp. Biol. 2014, 54, 633–644. [Google Scholar] [CrossRef]
- Wiltsa, B.D.; Michielsenb, K.; Raedta, H.D.; Stavenga, D.G. Sparkling feather reflections of a bird-of-paradise are explained by finite-difference time-domain modeling. Proc. Natl. Acad. Sci. USA 2014, 111, 4363–4368. [Google Scholar] [CrossRef] [PubMed]
- Parnell, A.J.; Washington, A.L.; Mykhaylyk, O.O.; Hill, C.J.; Bianco, A.; Burg, S.L.; Dennison, A.J.; Snape, M.; Cadby, A.J.; Smith, A.; et al. Spatially modulated structural colour in bird feathers. Sci. Rep. 2015, 5, 18317. [Google Scholar] [CrossRef] [PubMed]
- Stavenga, D.G. Thin film and multilayer optics cause structural colors of many insects and birds. Mater. Today Proc. 2014, 1, 109–121. [Google Scholar] [CrossRef]
- Norden, K.K.; Faber, J.W.; Babarović, F.; Stubbs, T.L.; Selly, T.; Schiffbauer, J.D.; Štefanić, P.P.; Mayr, G.; Smithwick, F.M.; Vinther, J. Melanosome diversity and convergence in the evolution of iridescent avian feathers—Implications for paleocolor reconstruction. Evolution 2019, 73, 15–27. [Google Scholar] [CrossRef]
- Eliason, C.M.; Bitton, P.P.; Shawkey, M.D. How hollow melanosomes affect iridescent colour production in birds. Proc. R. Soc. B Biol. Sci. 2013, 280, 1505. [Google Scholar] [CrossRef]
- Mcgraw, K.J.; Safran, R.J.; Wakamatsu, K. How feather color reflects its melanin content. Funct. Ecol. 2005, 19, 816–821. [Google Scholar] [CrossRef]
- Riedler, R.; Pesme, C.; Druzik, J.; Gleeson, M. A review of color-producing mechanisms in feathers and their influence on preventive conservation strategies. J. Am. Inst. Conserv. 2014, 53, 44–65. [Google Scholar] [CrossRef]
- McCoy, D.E.; Feo, T.; Harvey, T.A.; Prum, R.O. Structural absorption by barbule microstructures of super black bird of paradise feathers. Nat. Commun. 2018, 9, 1–8. [Google Scholar] [CrossRef]
- Torre-Ibarra, M.H.; Santoy, F.M.M. Interferometric study on bird’s feather. J. Biomed. Opt. 2013, 18, 056011. [Google Scholar] [CrossRef]
- Singh, P.; Doti, R.; Lugo, J.E.; Faubert, J.; Rawat, S.; Ghosh, S.; Bandyopadhyay, A. Biological Infrared Antenna and Radar. In Soft Computing: Theories and Applications; Advances in Intelligent Systems and, Computing; Pant, M., Ray, K., Sharma, T., Rawat, S., Bandyopadhyay, A., Eds.; Springer: Singapore, 2018; Volume 584, pp. 223–232. [Google Scholar]
- Singh, P.; Doti, R.; Lugo, J.E.; Faubert, J.; Rawat, S.; Ghosh, S.; Bandyopadhyay, A. DNA as an Electromagnetic Fractal Cavity Resonator: Its Universal Sensing and Fractal Antenna Behavior. In Soft Computing: Theories and Applications; Advances in Intelligent Systems and Computing; Pant, M., Ray, K., Sharma, T., Rawat, S., Bandyopadhyay, A., Eds.; Springer: Singapore, 2018; Volume 584, pp. 213–223. [Google Scholar]
- Singh, P.; Doti, R.; Lugo, J.E.; Faubert, J.; Rawat, S.; Ghosh, S.; Bandyopadhyay, A. Fractal and Periodical Biological Antennas: Hidden Topologies in DNA, Wasps and Retina in the Eye. In Soft Computing Applications; Studies in Computational Intelligence; Ray, K., Pant, M., Bandyopadhyay, A., Eds.; Springer: Singapore, 2018; Volume 761, pp. 113–123. [Google Scholar]
- Xiao, M.; Dhinojwala, A.; Shawkey, M. Nanostructural basis of rainbow-like iridescence in common bronzewing Phaps chalcoptera feathers. Opt. Express 2014, 22, 14627. [Google Scholar] [CrossRef]
- Stavenga, D.G.; Leertouwer, H.L.; Osorio, D.C.; Wilts, B.D. High refractive index of melanin in shiny occipital feathers of a bird of paradise. Light Sci. Appl. 2015, 4, 1–6. [Google Scholar] [CrossRef]
- Wilts, B.D. Brilliant Biophotonics: Physical Properties, Pigmentary Tuning & Biological Implications. Ph.D. Thesis, University of Groningen, Groningen, The Netherlands, 2013. [Google Scholar]
- Leertouwer, H.L.; Wilts, B.D.; Stavenga, D.G. Refractive index and dispersion of butterfly chitin and bird keratin measured by polarizing interference microscopy. Opt. Express 2011, 19, 24061–24066. [Google Scholar] [CrossRef] [PubMed]
- Yoshioka, S.; Kinoshita, S. Direct determination of the refractive index of natural multilayer systems. Phys. Rev. E Stat. Nonlin. Soft Matter Phys. 2011, 83, 051917. [Google Scholar] [CrossRef] [PubMed]
- Wolbarsht, M.L.; Walsh, A.W.; George, G. Melanin, a unique biological absorber. Appl. Opt. 1981, 20, 2184–2186. [Google Scholar] [CrossRef]
- Sihvola, A.H. Electromagnetic Mixing Formulas and Applications; The Institution of Engineering and Technology: Herts, UK, 1999. [Google Scholar]
- Alexander, I.L. Fresnel Equations. 2013. Available online: https://docslib.org/doc/6183407/fresnel-equations-alexander-i (accessed on 12 February 2022).
- Sambit, S.; Abhishek, P.; Chittaranjan, N. Transfer matrix optimization of a one- dimensional photonic crystal cavity for enhanced absorption of monolayer graphene. Appl. Opt. 2022, 61, 8613–8623. [Google Scholar]
- Kinoshita, S. Structural Colors in the Realm of Nature; World Scientific: Singapore, 2008. [Google Scholar]
- Land, M.F. The physics and biology of animal reflectors. Progr. Biophys. 1972, 24, 77–105. [Google Scholar] [CrossRef]
- Sandeep, K.M.; Sumi, K. A Review Paper on Microwave Transmission using Reflector Antennas. Int. J. Sci. Eng. Res. 2017, 8, 251–254. [Google Scholar]


Publisher’s Note: MDPI stays neutral with regard to jurisdictional claims in published maps and institutional affiliations. |
© 2022 by the authors. Licensee MDPI, Basel, Switzerland. This article is an open access article distributed under the terms and conditions of the Creative Commons Attribution (CC BY) license (https://creativecommons.org/licenses/by/4.0/).
Share and Cite
Singh, P.; Jalil, M.A.; Yupapin, P.; Ali, J.; Palomino, M.A.; Toledo-Solano, M.; Misaghian, K.; Faubert, J.; Ray, K.; Bandyopadhyay, A.; et al. Topological and Optical Properties of Passeriformes’ Feathers: Biological UV Reflector Antenna. Optics 2022, 3, 462-472. https://doi.org/10.3390/opt3040039
Singh P, Jalil MA, Yupapin P, Ali J, Palomino MA, Toledo-Solano M, Misaghian K, Faubert J, Ray K, Bandyopadhyay A, et al. Topological and Optical Properties of Passeriformes’ Feathers: Biological UV Reflector Antenna. Optics. 2022; 3(4):462-472. https://doi.org/10.3390/opt3040039
Chicago/Turabian StyleSingh, P., M. A. Jalil, P. Yupapin, J. Ali, M. A. Palomino, M. Toledo-Solano, K. Misaghian, J. Faubert, K. Ray, A. Bandyopadhyay, and et al. 2022. "Topological and Optical Properties of Passeriformes’ Feathers: Biological UV Reflector Antenna" Optics 3, no. 4: 462-472. https://doi.org/10.3390/opt3040039
APA StyleSingh, P., Jalil, M. A., Yupapin, P., Ali, J., Palomino, M. A., Toledo-Solano, M., Misaghian, K., Faubert, J., Ray, K., Bandyopadhyay, A., & Lugo, J. E. (2022). Topological and Optical Properties of Passeriformes’ Feathers: Biological UV Reflector Antenna. Optics, 3(4), 462-472. https://doi.org/10.3390/opt3040039