Article

Frequency Alteration Built on an Electro-Optical Sampling SOA–MZI Using a Differential Modulation Schema

Lab-STICC, CNRS UMR 6285, ENSTA Bretagne, 2 Rue François Verny, CEDEX 09, 29806 Brest, France
*
Author to whom correspondence should be addressed.
Optics 2022, 3(3), 225-233; https://doi.org/10.3390/opt3030022
Submission received: 1 June 2022 / Revised: 1 July 2022 / Accepted: 7 July 2022 / Published: 11 July 2022
(This article belongs to the Special Issue Fiber Communication Technology: Latest Advances and Prospects)

Abstract

:
In this paper, we present a real and simulated study of a frequency up mixing employing an electro-optical sampling semiconductor optical amplifier Mach–Zehnder interferometer (SOA–MZI) along with the differential modulation schema. The sampling signal is generated by an optical pulse clock (OPC) at a frequency of f s = 19.5 GHz. The quadratic phase shift keying (QPSK) signal at an intermediate frequency (IF) f I F is shifted to high frequencies n f s   ±   f I F at the SOA–MZI output. Using a simulator entitled Virtual Photonics Inc. (VPI), we generate sampled QPSK signals and analyze their merits during conversion gains and error vector magnitudes (EVMs). We conducted simulations of mixing in the SOA–MZI operating in a high-frequency band up to 195.5 GHz. The positive conversion gain is accomplished over the mixing frequencies. The EVM is used to evaluate the performance of the electro-optical sampling up-convertor. The EVM reaches 14% at a data rate of 5 Gbit/s at 195.5 GHz. During the experimental work, the results obtained in simulations are set side by side with the factual ones in the frequency range up to 59 GHz. Thus, the comparison between them confirms that they have approximately the same performance.

1. Introduction

Millimeter-wave systems have received great importance thanks to augmented data rates [1]. Moreover, a variety of mixing appliances have evolved to generate radio frequency (RF) signals with a 1.5 THz frequency [2,3]. Furthermore, radio over fiber (RoF) systems have achieved main merits, such as: good optical transmission with little losses, small weight, and spacious bandwidth. They can be implemented in a wireless fidelity (WiFi), radar systems [4], and cellular communications.
Optical mixers have some major attributes that play a substantial role in order to achieve frequency mixing with good performances, especially their nonlinear implementation, such as the four-wave mixing (FWM) or the cross-phase modulation (XPM) phenomena [4] and the physical characteristics. Mach–Zehnder modulators (MZMs) that achieve high-performance characteristics [4,5] and electro-absorption modulators (EAM) based on the cross-absorption modulation (XAM) situation [6,7] can be used for frequency conversion. Furthermore, photodiodes (PDs), especially uni-traveling carrier PDs (UTC-PDs), can also be employed for frequency mixing because of their response to nonlinear currents [8,9].
Semiconductor optical amplifiers (SOAs) rely on their nonlinearity such as cross-gain modulation (XGM) [10] and XPM [11,12,13,14,15,16,17,18,19,20] can also be used for shifting at the same time in the layout of a detached apparatus or implemented in an interferometric structure such as an SOA–Mach–Zehnder Interferometer (SOA–MZI). SOA–MZIs can achieve good performance, such as a frequency range up to 100 GHz [19]. All-optical mixing based on a sampling SOA–MZI [11,12,13,14,15,16,17] has achieved excellent characteristics such as high positive conversion gain for both experimental and simulation studies. The used SOA–MZI combined with an optical pulse source that uses a mode-locked laser in order to generate an optical pulse train can be used up and down conversion simultaneously with good efficiency.
Frequency up-conversion by an all-optical sampling concept based on a photonic SOA–MZI is one of the main technologies for producing an optical radio frequency (RF) signal that is the sampled signal, which is converted to an electrical one through a PD at a receiver at a range of frequencies, for RoF transmission systems, in order to enhance the efficiency performance of this optical system. Various setups for the frequency up-conversion have been elucidated by utilizing nonlinear behaviors of the SOA–MZI in real and simulation studies [11,12,13,14,15,16,17]. At the same time, these architectures offered a very large bandwidth with respect to the mixing of the IF signal to be up-converted. In this paper, the use of electro-optical sampling in a differential SOA–MZI of the modulation schema is well implemented and attained very good performance characterizations.
Frequency mixing can also be achieved by modulating the SOA electrical port in both arms of the SOA–MZI. Then, this gives rise to modulating the SOAs carrier density for a differential schema [20,21,22,23]. Previously, the technique of an electro-optical up-converter based on the Reflective SOA (RSOA) has been demonstrated [23]. An IF (intermediate frequency) signal that loads of quadratic phase shift keying (QPSK) data have been up-converted to 15 GHz with a good quality signal corresponding to an error vector magnitude (EVM) less than 6% at a bit rate of 3 Mbit/s [23].
Some novel converter systems built on a generalized proportional integral observer (GPIO) based dynamic prescribed performance sliding mode control (DPPSMC) approach is developed to realize high-quality output voltage [24]. This leads to escalation in the transient effects of the converter system. The switching frequency is limited to 5 kHz due to the experiment hardware limitation. These types of converters, called nonlinear switch systems, have been broadly used in communication apparatus and computer systems. The benefits of these sorts of converted systems are fast response speed and powerful strength to outer disturbance, which are enhanced through some progressed control techniques such as sliding mode control (SMC). In comparison with our system, even though they are different in structures and used devices, they can be implemented in radar systems and cellular communications.
In this paper, we study, for the first time, novel electro-optical up-converters in a differential modulation schema based on a real and simulated SOA–MZI sampling mixer. The sampling signal is injected into the active zones of both SOAs. Moreover, the IF electrical subcarrier modulates the electrical ports for both SOAs. The proposed electro-optical sampling mixer shows features including broad bandwidth and high conversion gains. In order to confirm the simulation results, experimental setups by using a sampling SOA–MZI from CIP (40G-2R2-ORP) are built to compare with the simulation results.
The major benefits of our study are the novel concept that allows us to reach the highest, to our knowledge, frequency range of 195.5 GHz, observe EVMs at the data rate of 5 Gbit/s, and obtain positive conversion gains. This novel concept may pave the way toward mm-wave and microwave applications and wireless access applications [25].
The paper is arranged into several sections in addition to the introduction. In the second section, we demonstrate in detail the technique of the electro-optical up-converter in the modulation schema of the differential mode. In the third section, simulation setups are given, simulation results for the electro-optical up-converter spectrum are achieved, conversion gains are obtained, and then EVMs of QPSK data are presented. The real results are achieved and compared with simulation results in the fourth section. Finally, in the last section, the conclusions are discussed.

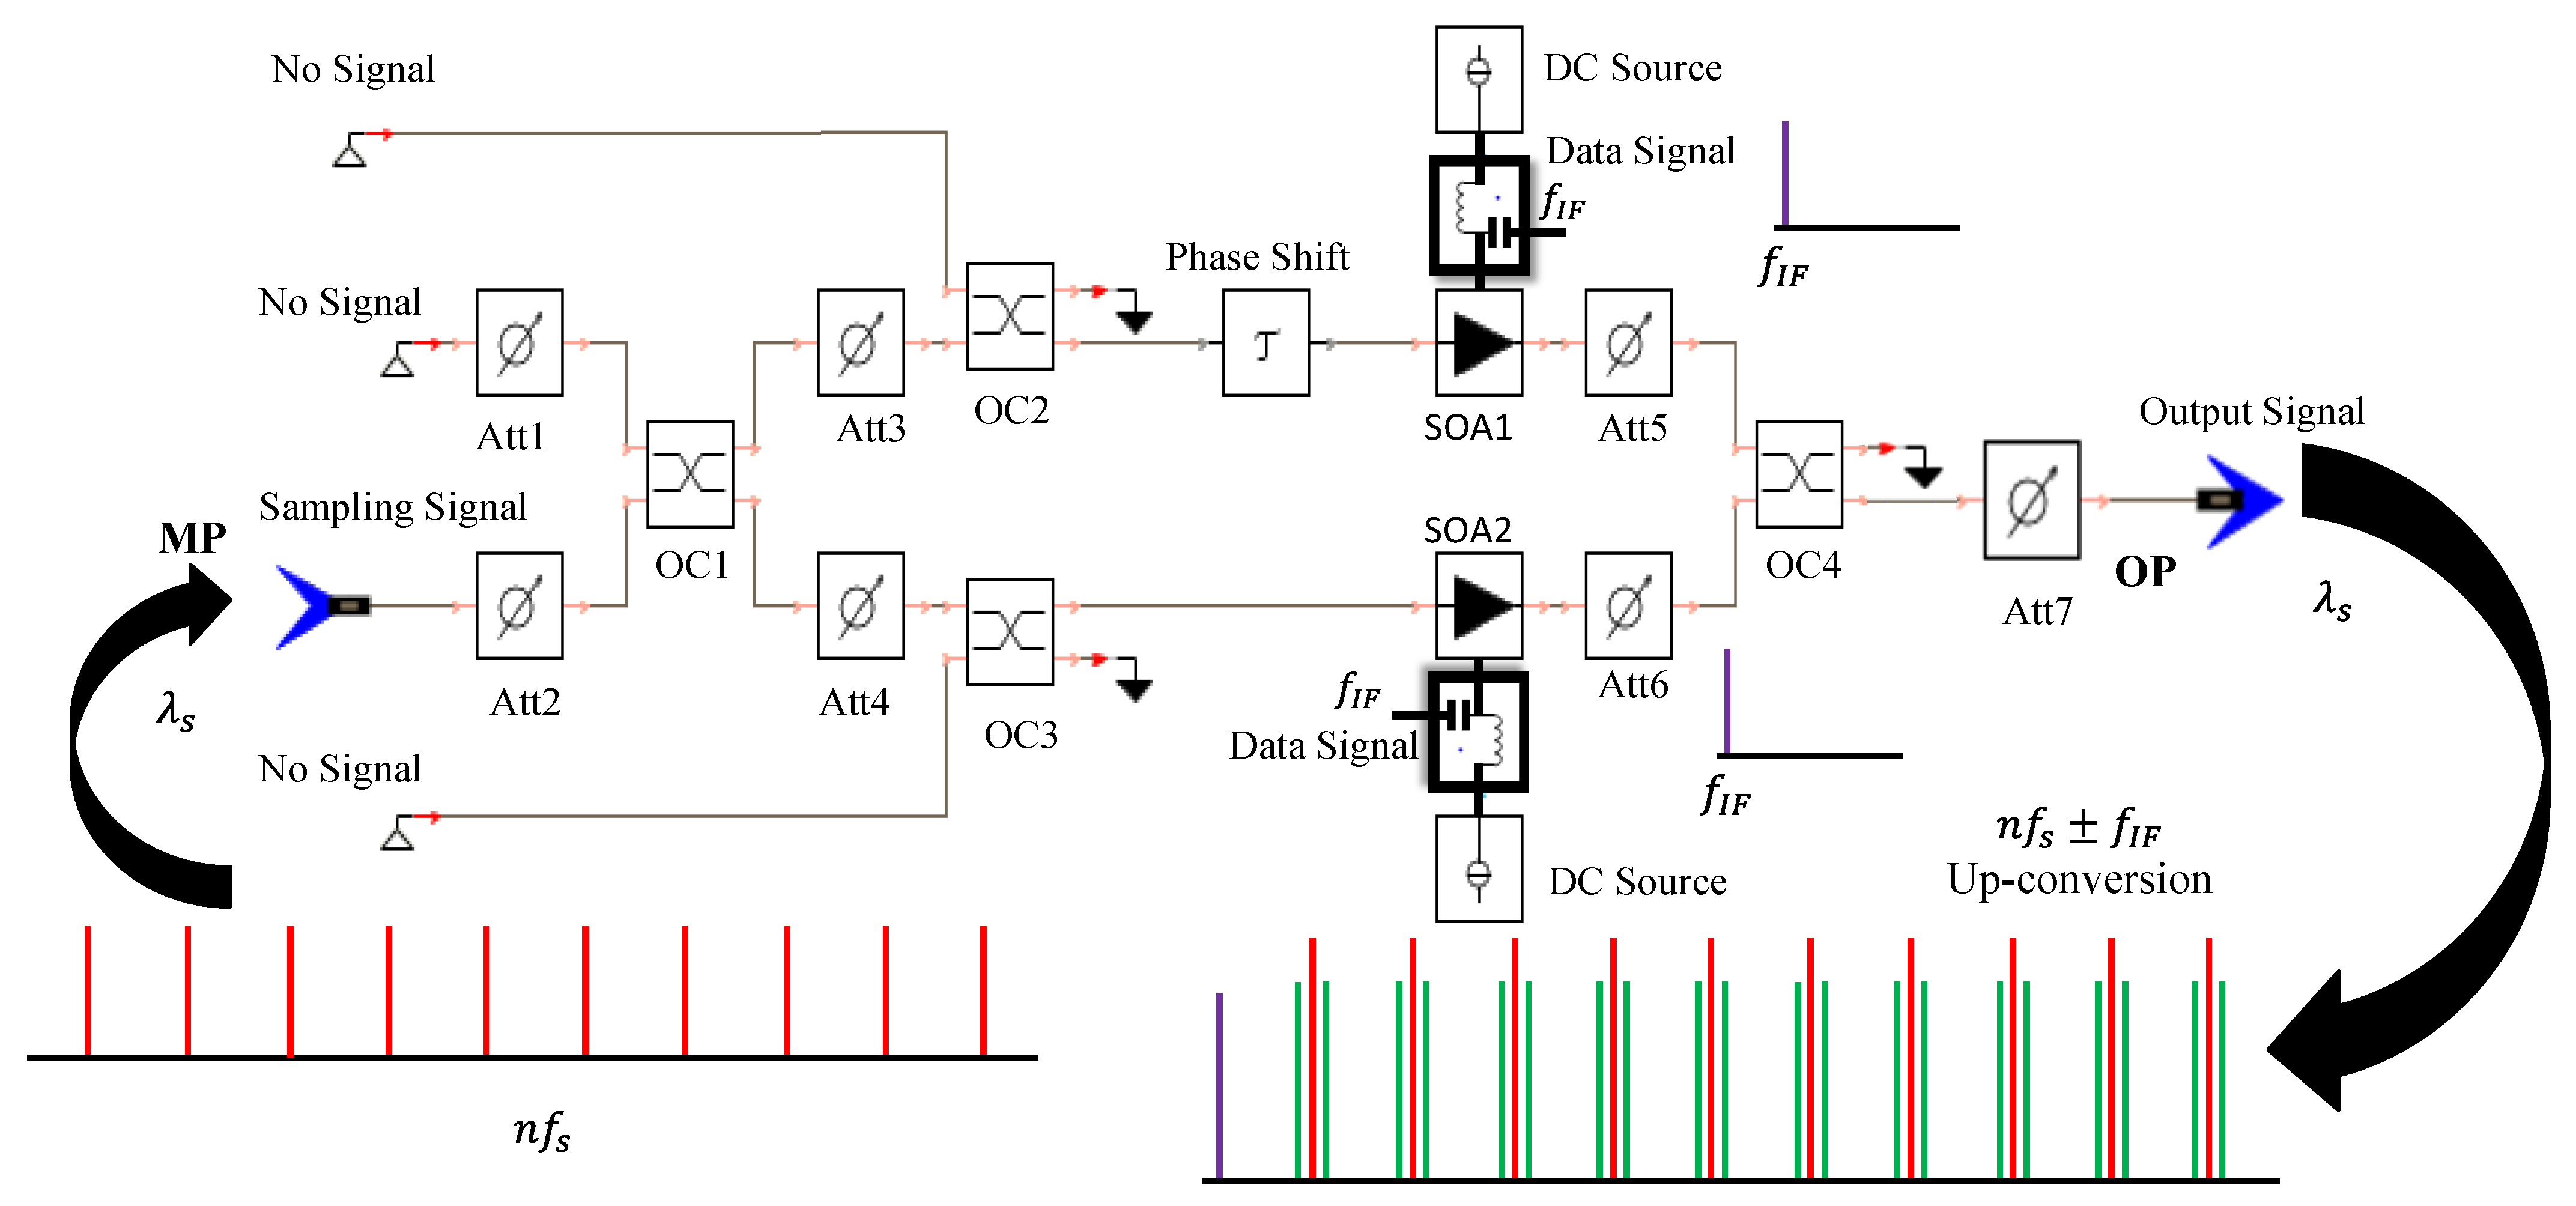
2. Electro-Optical Sampling Principle of Differential Modulation Architectonic

The architecture of the used SOA–MZI in a VPI simulator [26] is propounded in Figure 1. It explains, for the first time, the electro-optical up converter principle of the differential modulation based on a sampling SOA–MZI. We have previously demonstrated the up-conversion process based on a sampling method [11,12]. Furthermore, the approach of the electro-optical SOA up-converter was explained in [23].
The sampling signal is driven by an optical pulse clock (OPC) with a sampling frequency f s is divided into two similar signals to the upper and lower arms of the SOA–MZI by the middle port (MP). Recently, we have used f s = 19.5 GHz in [14].
The proposed differential modulation relies on two electrical subcarriers in the MZI. In this scheme, two subcarriers at f I F , which have similar characteristics, are entered into the electrode of upper and lower SOAs leading to fine-tuning their bias currents. The IF signals are capable of regulating the carrier density of each SOA by their bias currents in the upper and lower arm, and then the sampling signal will be directly modulated by the IF signals in both arms. These two sampled signals are combined at the outer port of the SOA–MZI, beneficial to acquiring the mixed signal. The benefit of the differential modulation is to enhance the quality of the harmonics of the sampling signal and the power level of the replicas of the signal to be mixed. The sampled signal is considerably ameliorated at the outer port of the SOA–MZI because of enhancing the harmonic power of the sampling control signal in both arms, which preserves the identical amplitude of its harmonics regardless of the amounts of the positions of the harmonics n . As we can monitor from the electrical spectrum of the signal to be mixed that the IF signal is up-converted from f I F to n f s ± f I F .

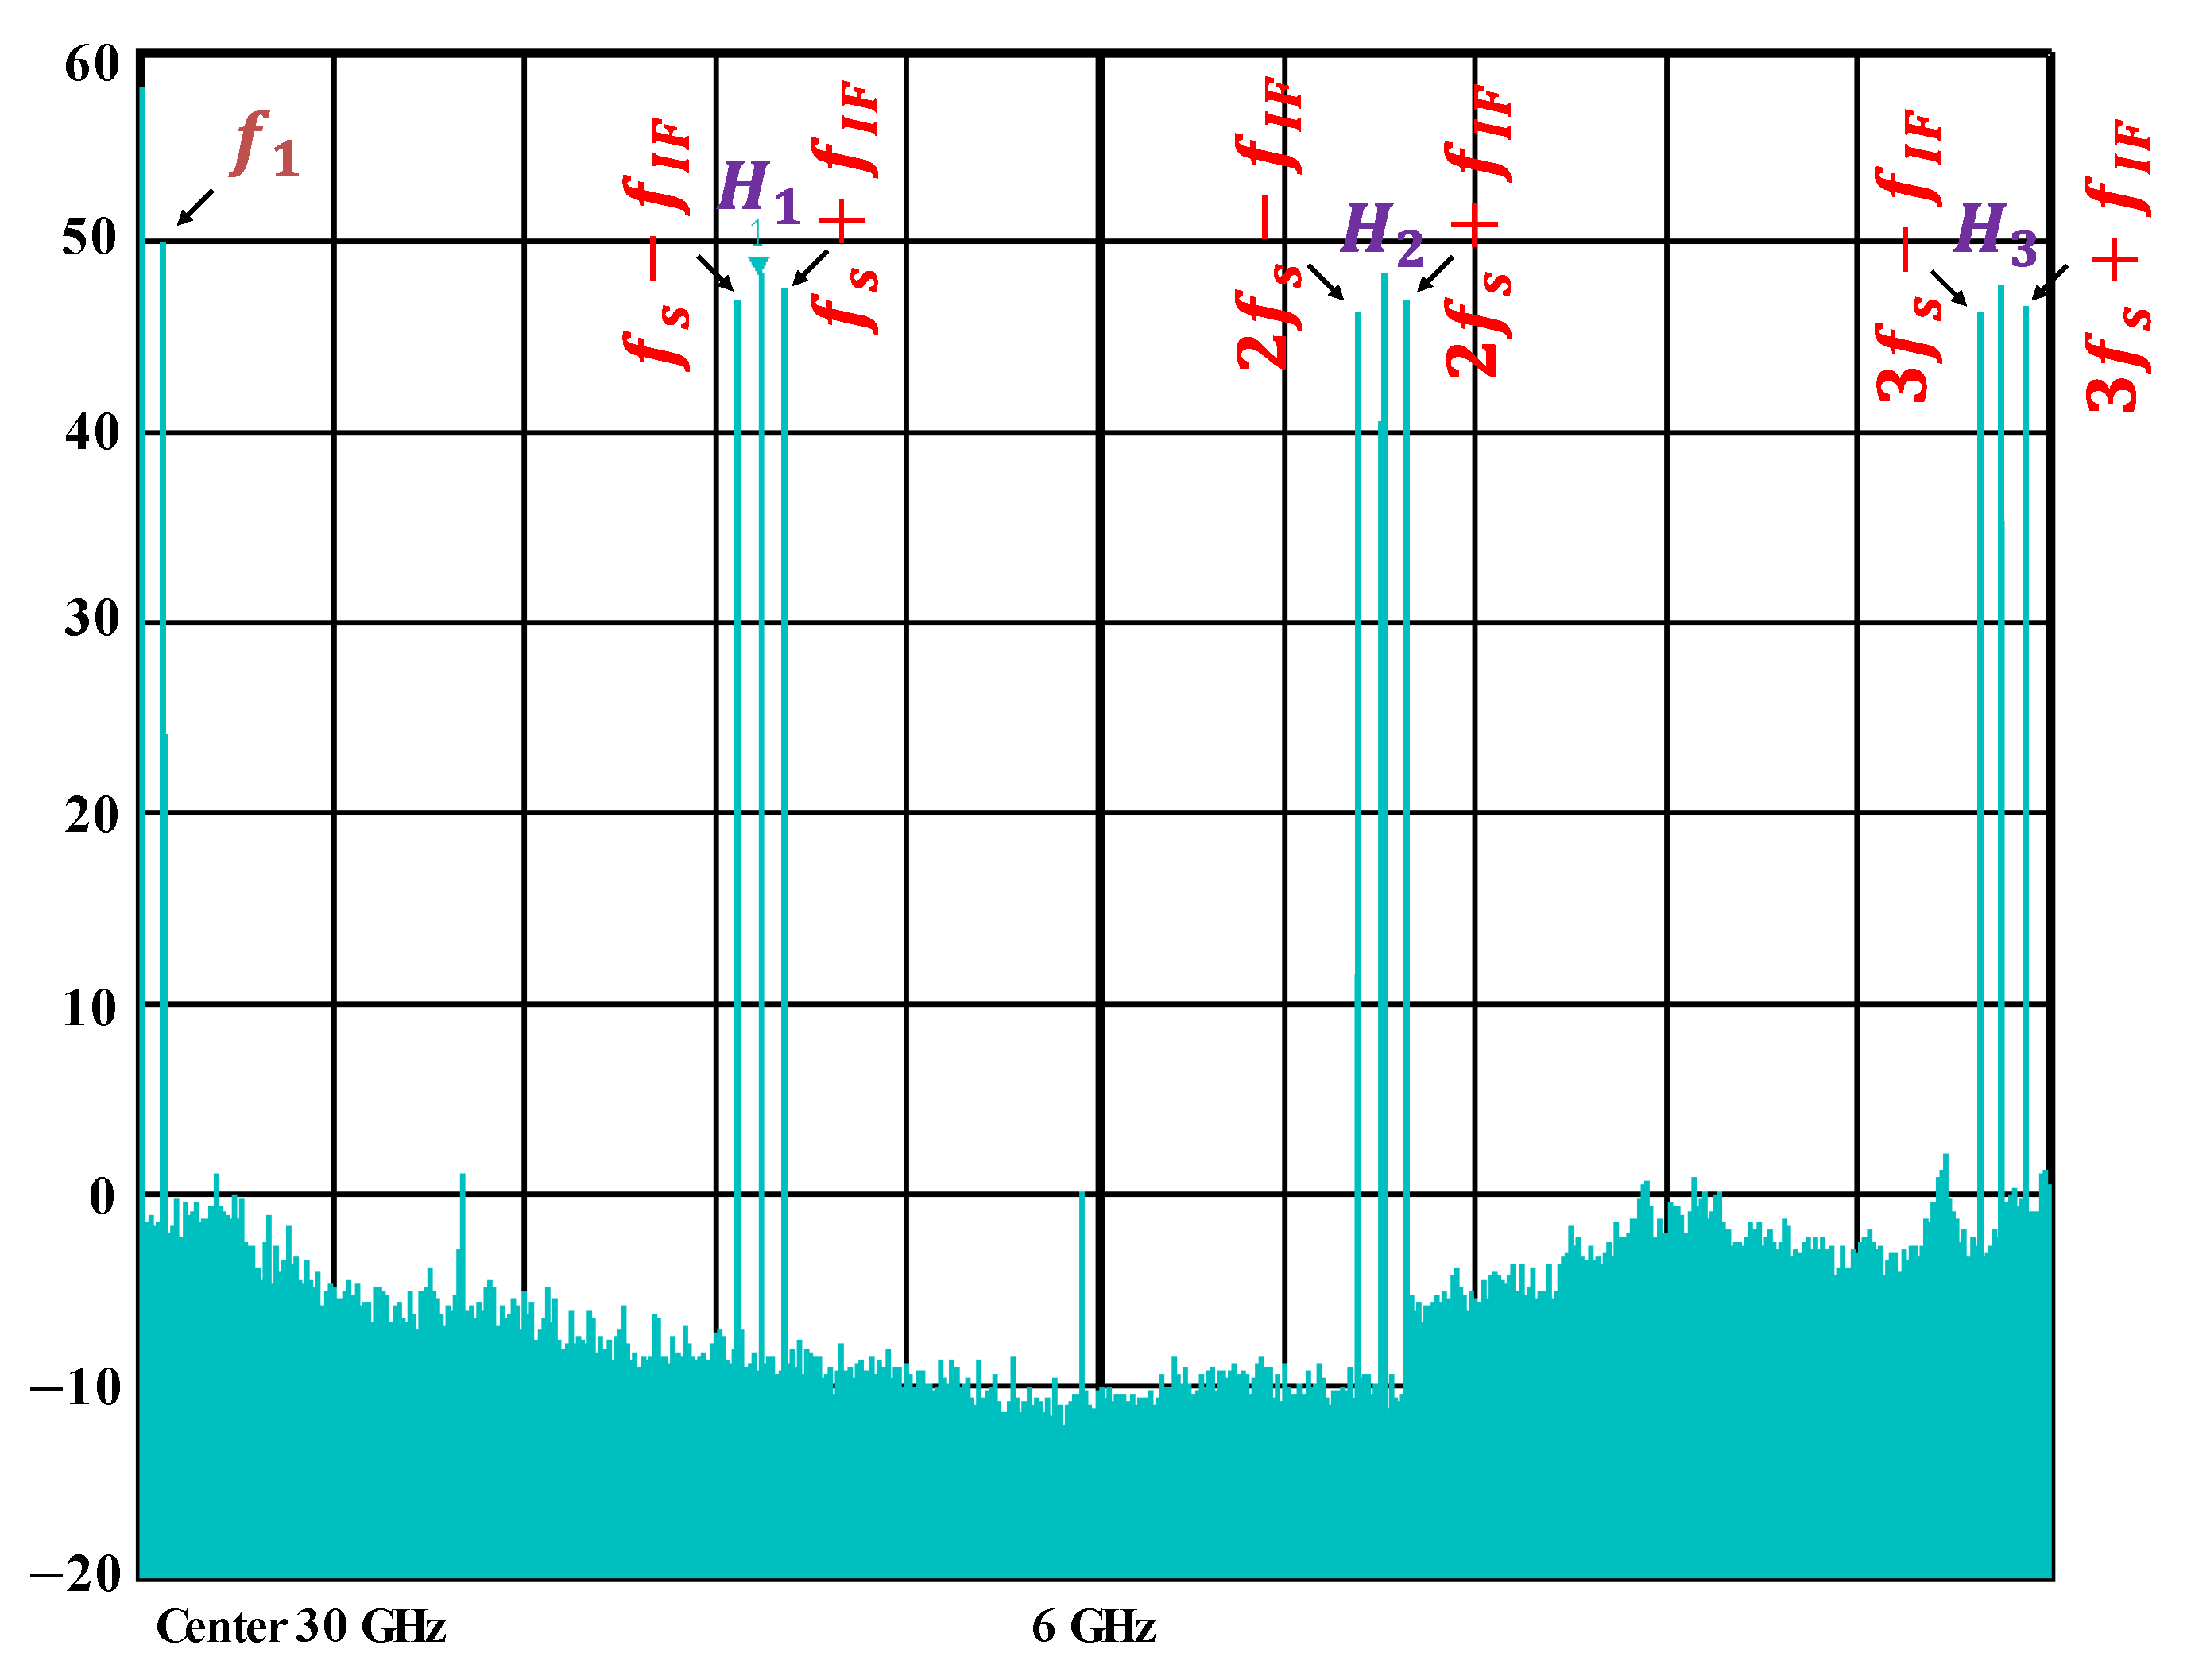
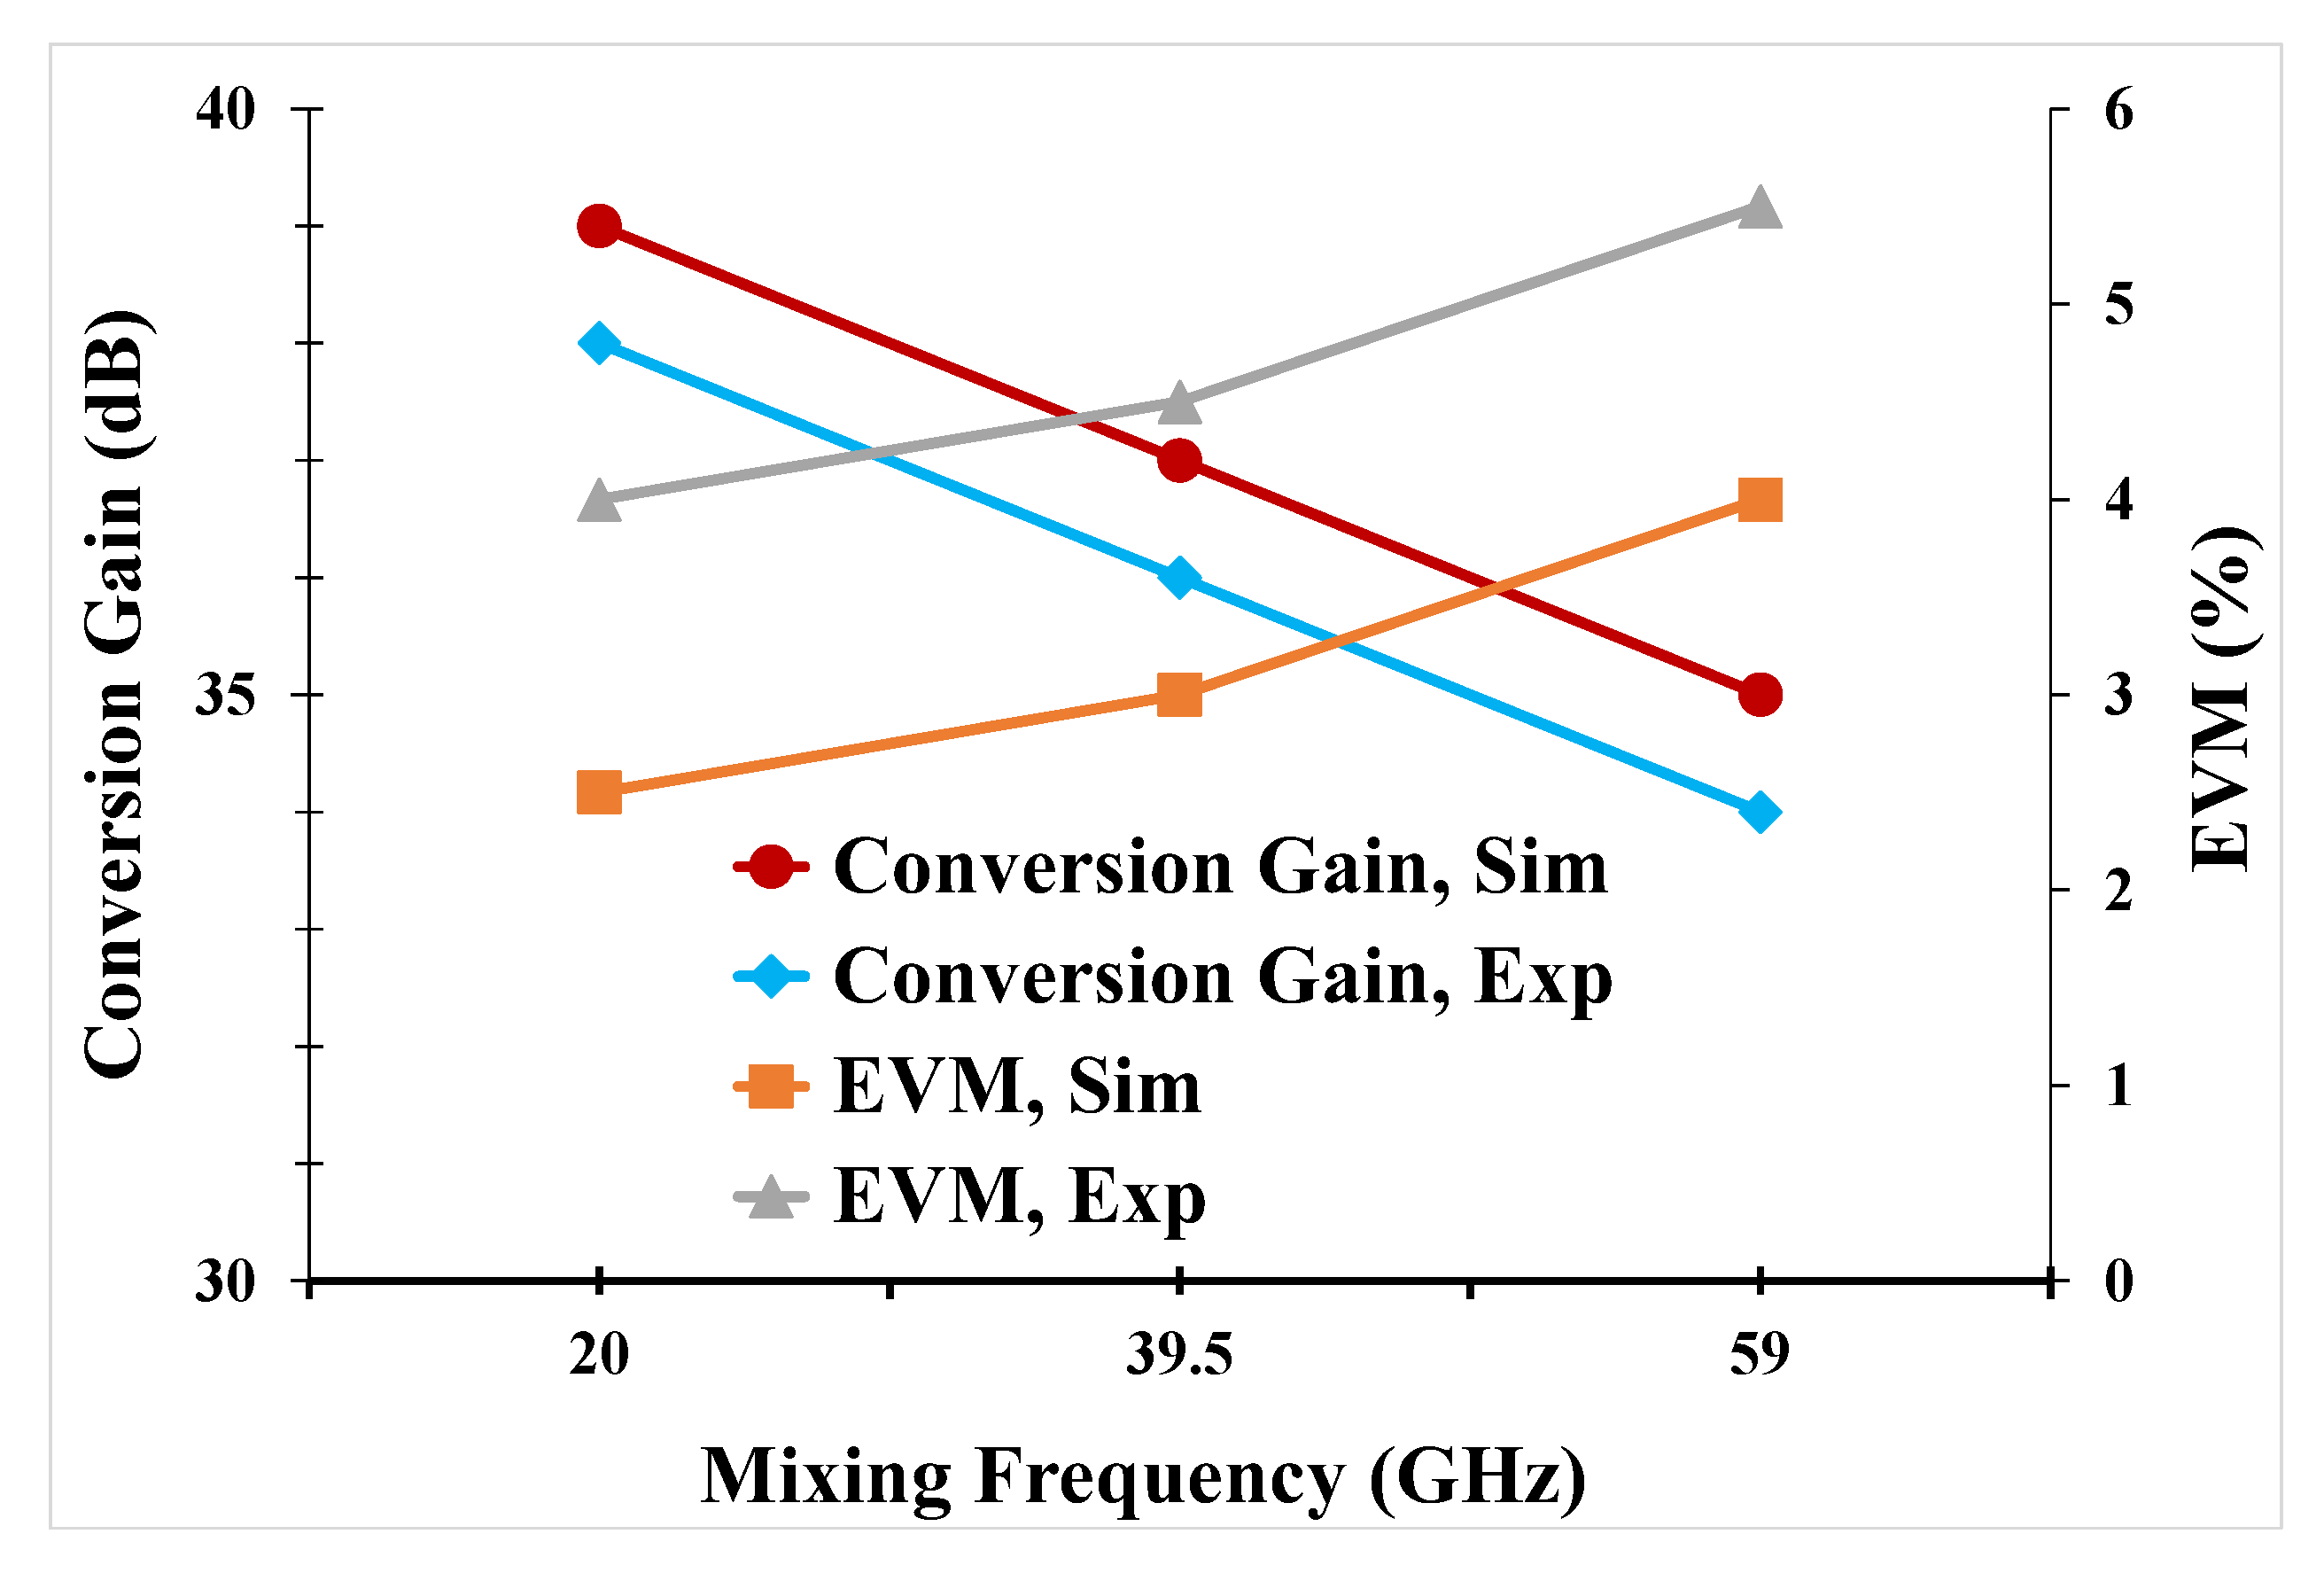
3. Setup Characterization Used in a VPI Simulator

The setup used in a VPI simulator of electro-optical up-converter is shown in Figure 2. In our study, two IF signals with the same characteristics are entered at the electoral port of each SOA that is biased at the value of the 350-mA bias current. Moreover, the SOA electrical port is adapted to 50 Ω. The IF signals are intensity modulated by a subcarrier in the electrical domain at f I F = 0.5 GHz. The modulation power of the data signal is 13 dBm.
The signal is generated by an optical pulse clock (OPC) having a wavelength of 1550 nm at a sampling frequency of 19.5 GHz. The electrical spectrum of this sampling signal shows a variety of harmonics at H n = n f s . This signal is an SOA–MZI input through its MP by using plenty of contrasting optical signal mode fibers. In order to achieve frequency shifting, the mean optical power of the OPC signal is managed to be −1 dBm.
At the outer port of the used SOA–MZI, the optical filter (OF) adjusted at 1550 nm is used in order to remove unwanted signals. Then, the sampled signal is passed through a photodiode (PD) to obtain a photo-detected signal after sampling. This PD has a 300 GHz bandwidth and a sensitivity of 0.85 A/W. The photo-detected signal is amplified by a 33 dB-gain low-noise amplifier (LNA) and subsequently propounded on an electrical spectrum analyzer (ESA) to procure the spectrum of the signal to be mixed or used in the BER_EL-M-QAM module to demodulate the data with a view to finding its EVM. The used PD for photo-detection in a VPI simulator corresponds to a uni-traveling carrier (UTC) PD [9].
The use of the VPI simulator assists us in applying plenty of simulations that imitate the actual work [26]. In order to validate the electro-optical differential modulation principle, we propound the electrical spectrum of the signal to be mixed at the outer port of the used SOA–MZI, as seen in Figure 3. It is validated that the data signals are mixed at requested frequencies n f s ± f I F . The harmonic powers of the OPC signal decrease slightly with the position of harmonics 𝑛. The difference between the tenth harmonic H 10 = 10 f s and the first one H 1 = f s is about 8 dB. This degradation is a result of the dynamic behavior of the used SOA–MZI [11,15] that cannot be avoided. Moreover, the mixed signals are amplified considerably at high mixing frequencies, as observed in the electro-optical differential modulation. Hence, the highest frequency range is 10 f s + f I F = 195.5 GHz. In conclusion, differential modulation enhances the characteristics of the sampled signals [16,17].
To evaluate the sampling mixer efficiency for electro-optical deferential modulation, the conversion gain G c is obtained. It is savvied as the difference of electrical powers in dBm between the signal to be mixed at n f s + f I F and the data signal at f I F .
As apparent in Figure 4, the electro-optical differential modulation considerably improves G c . It reaches 24 dB at the frequency of 195.5 GHz, which corresponds to the maximum frequency of the signal to be mixed. The variation between the initial G c and the final one is 14 dB. Moreover, conversion gains that have positive values are obtained for all mixing frequencies related to H n due to SOAs gains. Because of the SOA–MZI dynamic behavior, G c degrades at frequencies that have top values. Regardless of that, the principle of differential modulation plays a significant function in the augmentation of the electrical power of the signal to be mixed at the top frequencies. In fact, it is tricky to acquire similar power levels of the harmonics as well as the identical replica of the electrical power of the signal to be mixed at the outer gate of the SOA–MZI because of the SOA–MZI dynamic behavior. As a result, the harmonics of the sampling OPC signal play the main role in improving the mixed signal because they are improved considerably at the top frequencies due to the modulation schema. This also leads to ameliorating the performance of this optical transmission system.
Up-conversion simulations of the signal to be mixed that loads QPSK data are assessed at the data rate of 5 Gbit/s. Two subcarriers are entered into the SOAs electrodes for differential modulation. The quality of the mixing is evaluated through the error vector magnitude (EVM) [27] calculated in order to estimate the quality of the signal to be mixed. The BER_El-M-QAM module is employed to compute the bit error rate (BER) of the signal to be mixed. Hence, EVM values are found from the BER [28]. The EVM boundary of the QPSK data is 17.5% [29].
As exhibited in Figure 4, the EVM of the signal to be mixed enlarges with its frequency at 5 Gbit/s. The EVM value upgrades at the top frequencies compared to all-optical sampling SOA–MZI [11,12,13,14,15,16] and electro-optical RSOA [23]. It reaches 14% at 195.5 GHz, which is beneath the EVM boundary. The EVM of the signal to be mixed at the top frequency downgrades more than the one at the lowest one because of H n of the OPC signal. Following the higher position of harmonics play the essential function of enhancing the sampled signal because of the electro-optical differential modulation principle.

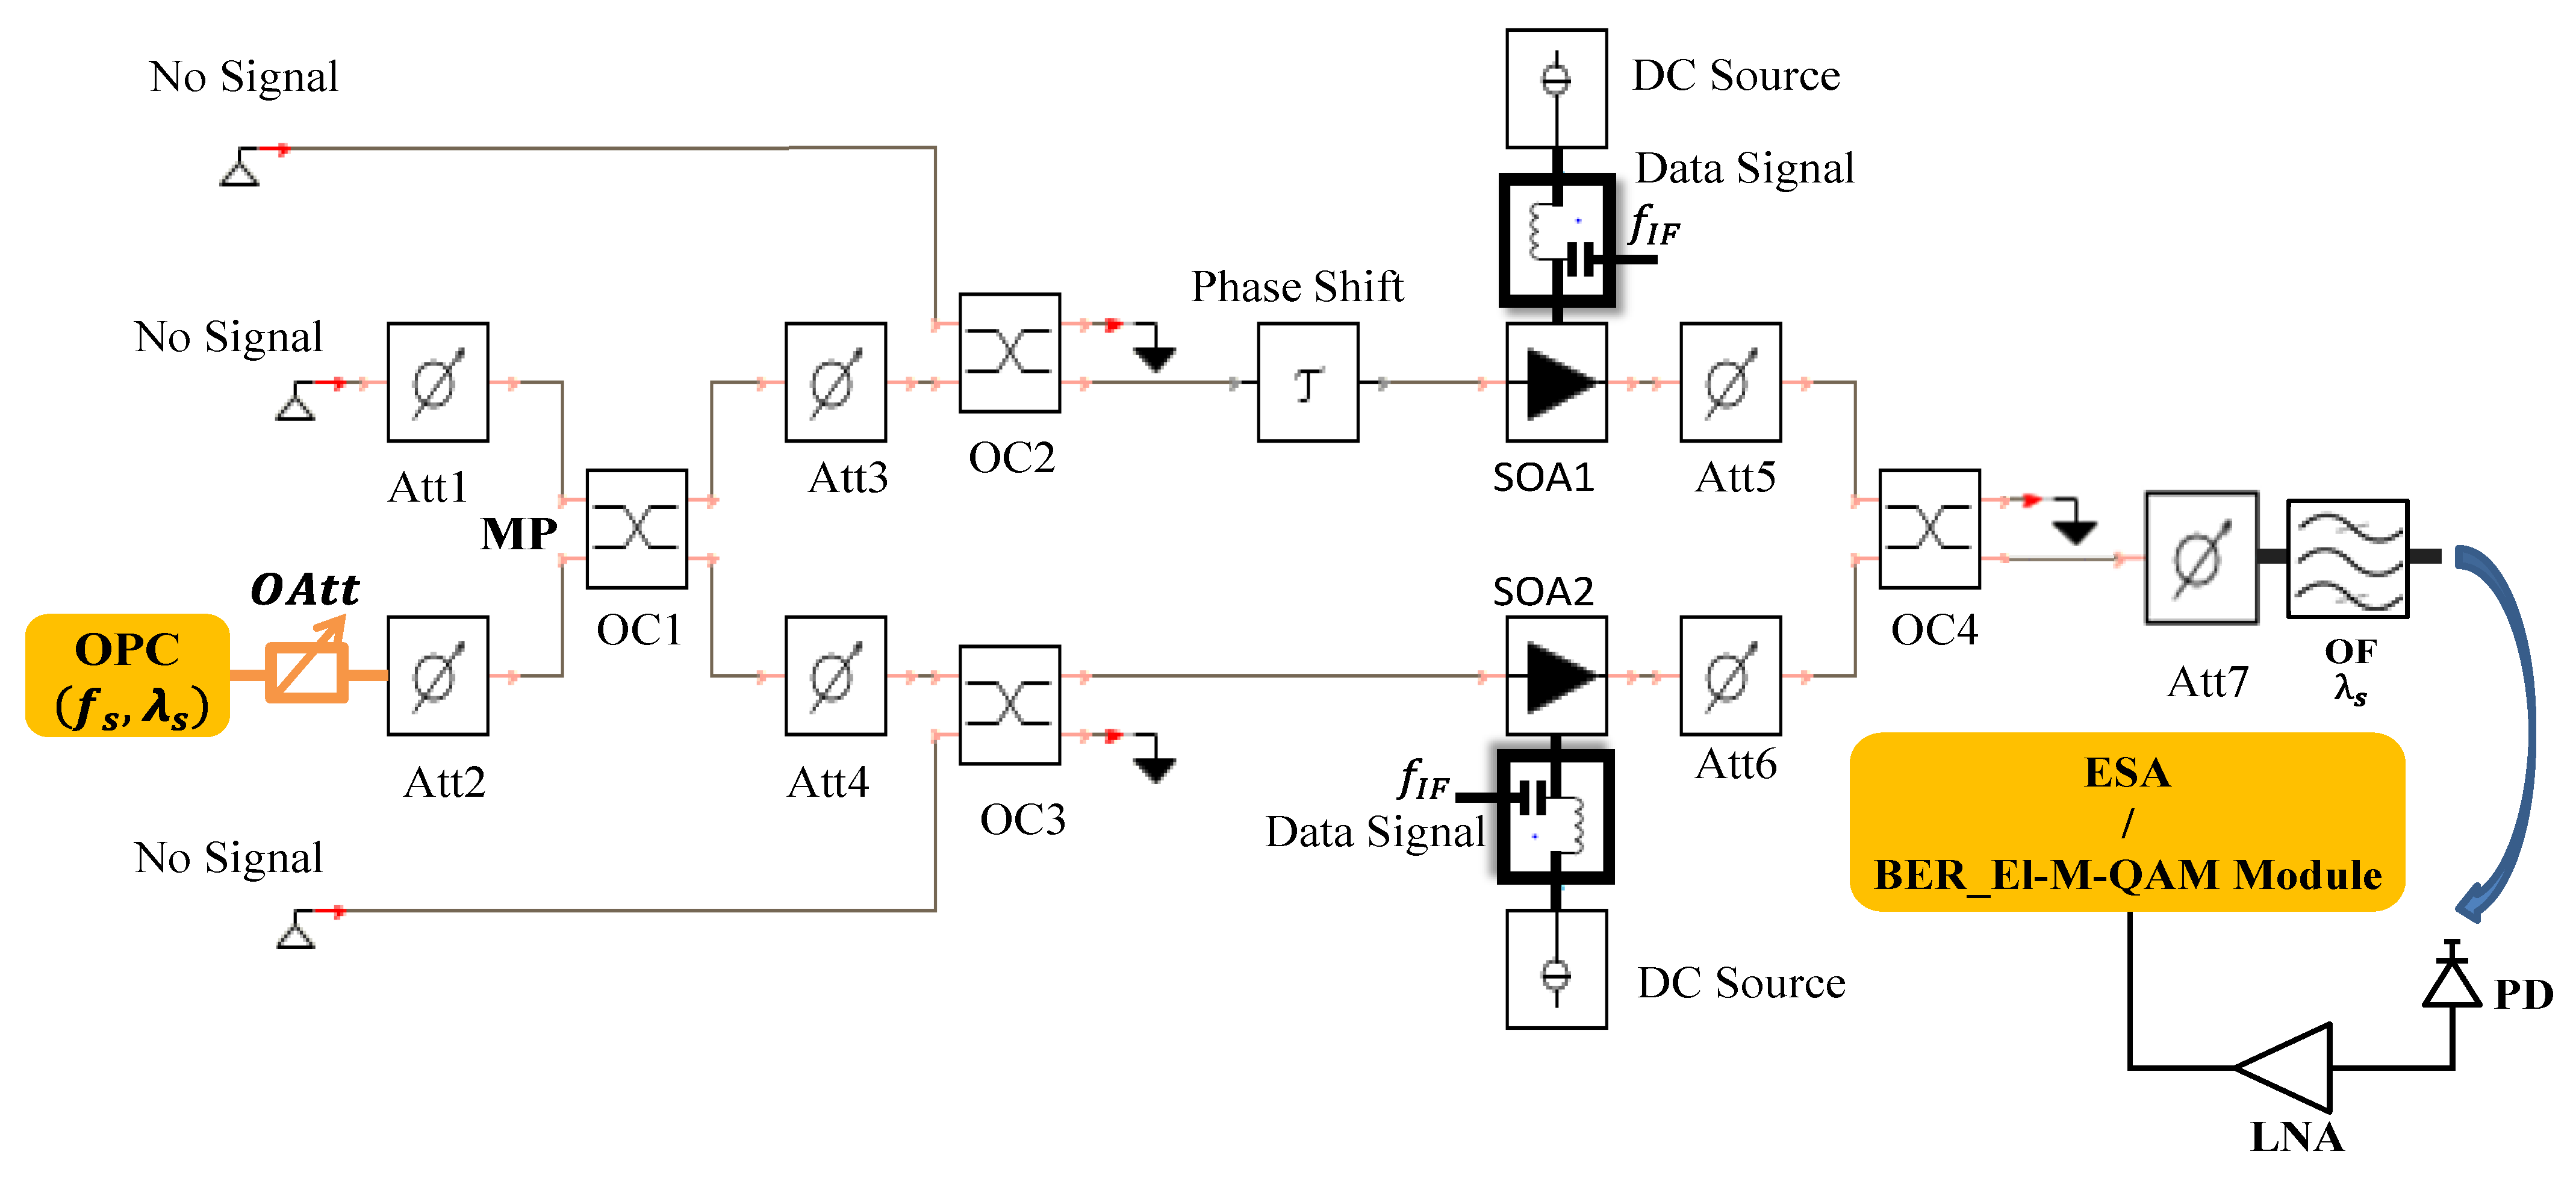
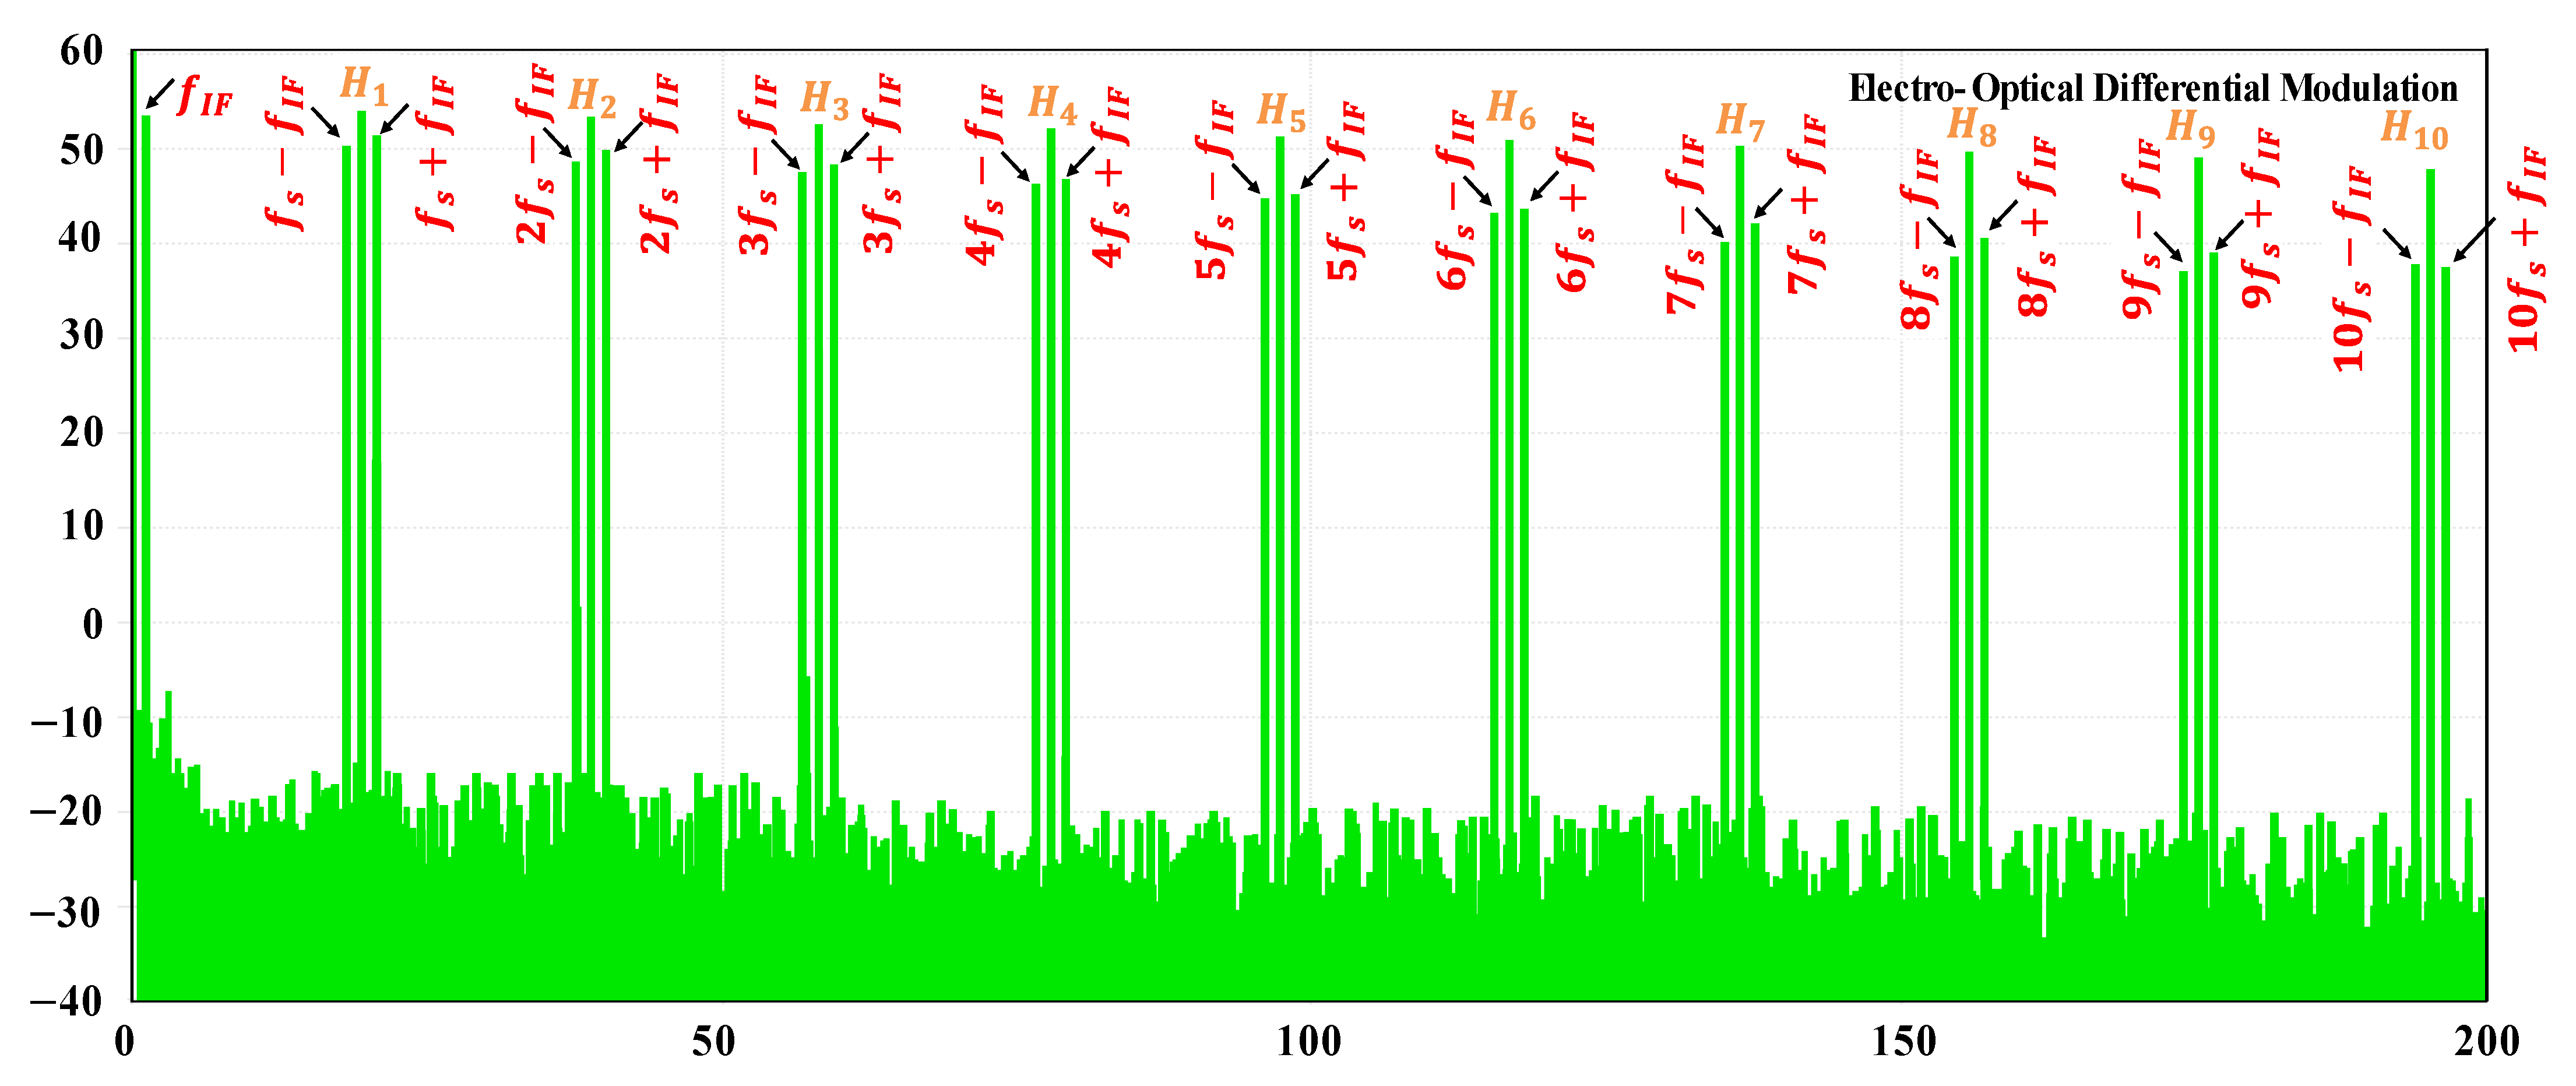
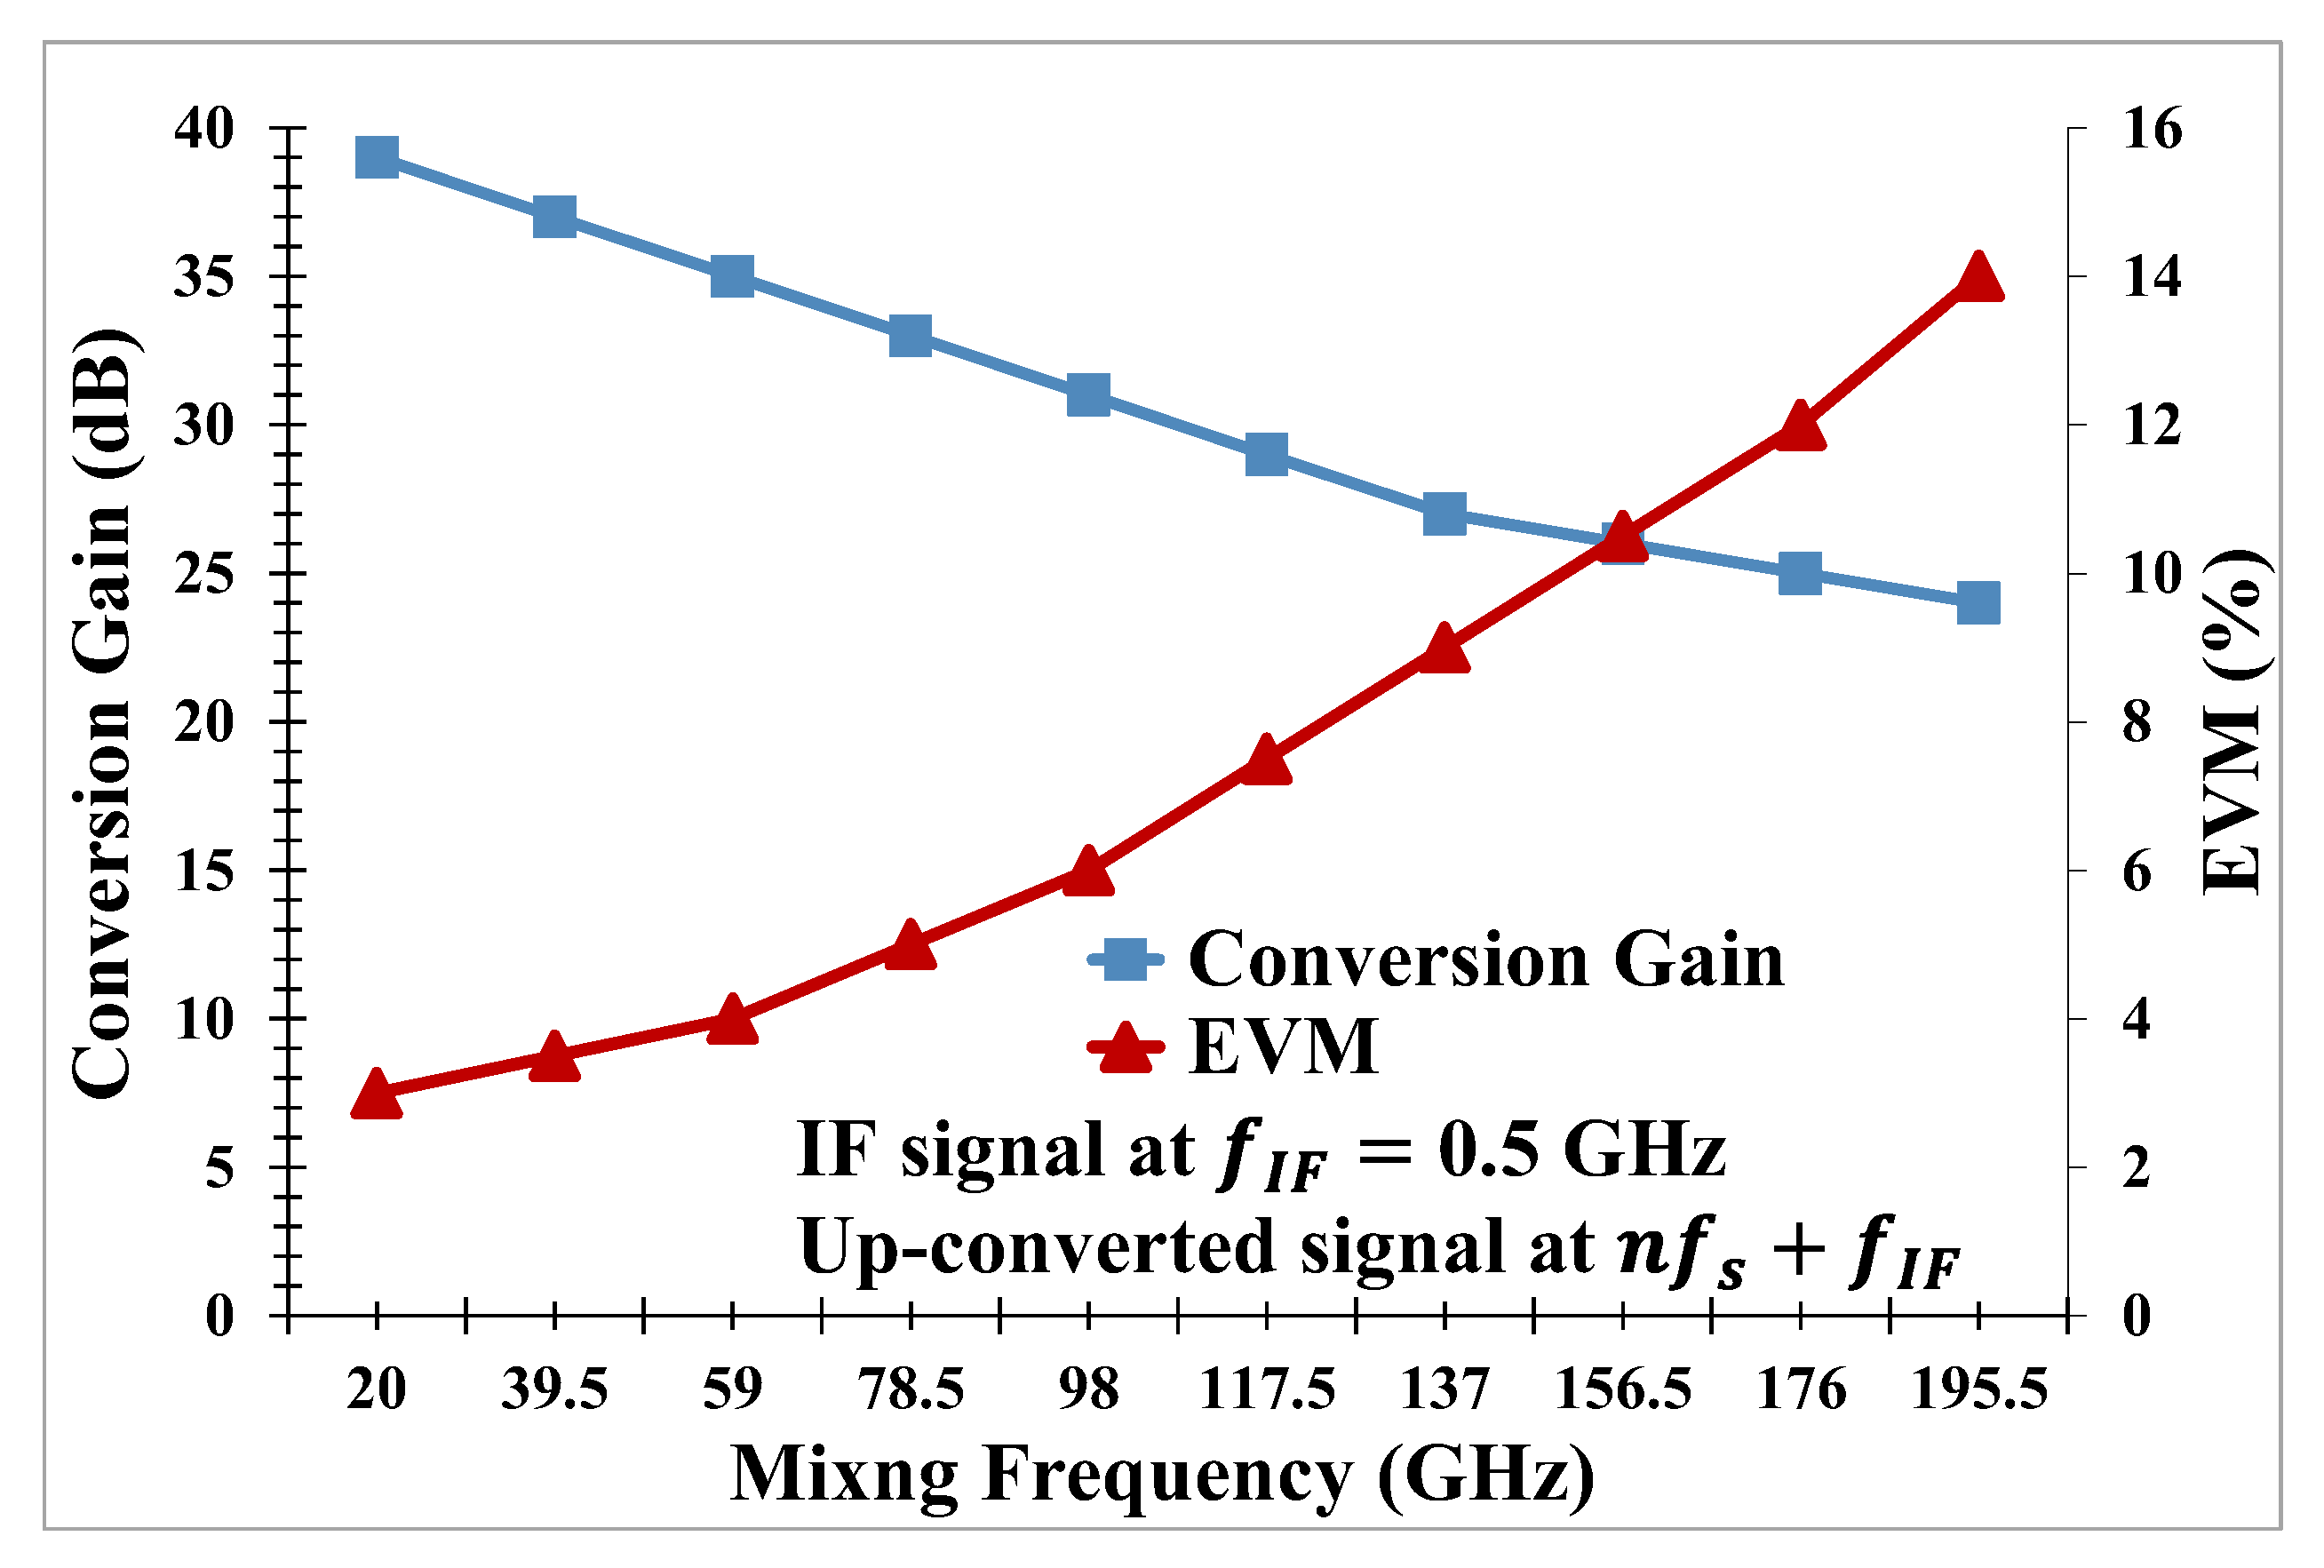
4. Experimental Setup Characterization

In this experiment, real SOA–MZI and other devices are used in order to create the experimental setup that is the same as the simulation one (see Figure 2). Moreover, all the operating points used in the simulations are also used in the actual setup because of obtaining a fair differentiation between them. During the experimental work, the frequency range of the signal to be mixed only reached 59 GHz because of the restriction of the ESA bandwidth. Hence, the contrast of the signal to be mixed between the real and simulated results will be in the frequency range that corresponds to the frequencies of the signal to be mixed at the outer gate of the SOA–MZI from f s + f I F   = 20 GHz to 3 f s + f I F = 59 GHz. The spectrum of the shifted signal in the electrical domain is also obtained at the outer port of the SOA–MZI for the real work. The first three harmonics of the sampling OPC signal, as well as the duplication of the shifted signal related to these harmonics, are shown in Figure 5.
Hence, the degradation of the replicas is almost as similar to the ones calculated for simulations. In both works, the signals to be up-converted follow the retreating of H n of the sampling OPC signal. The same results are achieved for simulations seen in Figure 3. However, the obvious enhancement of the electro-optical modulation of the differential mode is at the higher frequency range up to 195.5 GHz in simulations.
The G c of the up-converted signals is measured at f s + f I F , 2 f s + f I F , and 3 f s + f I F , as shown in Figure 6. It is obtained at the same range as the simulations in order to confirm the results. The measured G c is 1 dB below the simulated one as a consequence of the receiver noise and optical losses of the optical fiber. The experimental work confirms that the G c has the same behavior in comparison with the simulations for the differential modulation.
In order to gauge the quality of the electro-optical differential modulation, the EVM of the signal to be mixed that carries QPSK data is achieved and compared with the results obtained by using a VPI simulator at the data rate of 5 Gbit/s as exhibited in Figure 6. The real EVM values are larger than the ones in simulations due to the unexpected noise in the actual measurements. For the real experimentation, the EVM degrades 2% in comparison with the simulations. Moreover, all the EVM values of the mixed signals are below the EVM limits. This also confirms that the electro-optical differential modulation realizes good performances in terms of its quality through EVM as well as its efficiency through G c . It is worth noting that, for the real study, the real-time oscilloscope used in the experimental setup is called a digital sampling oscilloscope (DSO) that is used to digitalize the signal to be up-converted. Then a vector signal analyzer (VSA) software is directly exploited to compute the EVM values.
Table 1, which is another view of Figure 6, shows the comparison between the real and simulated results of the electro-optical transmission system based on a sampling SOA–MZI at 59 GHz in terms of the efficiency through conversion gains and the quality performance through EVM values. It also displays the characteristics of the sampled signal at 195.5 GHz in simulation investigations. The simulated conversion gains and EVM values obtained through the VPI simulator are in very good agreement with those attained through the real schema. The results in both cases validate the principle of the electro-optical sampling SOA–MZI in differential modulation architectures.

5. Conclusions

This paper aims to design an electro-optical up-converter based on a sampling SOA–MZI used as an optical mixer by applying the modulation of the differential mode, for the first time, to a top frequency up to 195.5 GHz. We have propounded important results obtained by utilizing a VPI simulator based on an electro-optical SOA–MZI sampling mixer. The efficiency of this optical transmission system has been assessed by the most important parameter called conversion gains. Moreover, high conversion gains that have positive values are reached for the entire range of mixing frequencies. The frequency conversion of QPSK data offers excellent EVM values at 5 Gbit/s. Furthermore, the EVM of the QPSK signal to up-converted attains 14% at 195.5 GHz, relevant to the tenth harmonic of the sampling OPC signal at 5 Gbit/s. In order to confirm the behavior of the simulation results, the experimental study is inspired. The comparison between them shows that they have the same performance. Finally, this novel designed system is efficacious, low cost, and can be stratified to a variety of modernistic applications. Our future work is dependent on the investigation of the frequency down-conversion process based on an electro-optical sampling SOA–MZI and compared to the outstanding performance of this system.

Author Contributions

All the authors, H.T. and A.M., contributed equally to this paper. All authors have read and agreed to the published version of the manuscript.

Funding

This research received no external funding.

Institutional Review Board Statement

Not Applicable.

Informed Consent Statement

Not Applicable.

Data Availability Statement

Data underlying the results presented in this paper are not publicly available at this time but may be obtained from the authors upon reasonable request.

Conflicts of Interest

The authors declare no conflict of interest.

References

  1. Kleine-Ostmann, T.; Nagatsuma, T. A Review on Terahertz Communications Research. J. Infrared Millim. Terahertz Waves 2011, 32, 143–171. [Google Scholar] [CrossRef]
  2. Rouvalis, E.; Renaud, C.; Moodie, D.G.; Robertson, M.J.; Seeds, A.J. Traveling-wave Uni-Traveling Carrier Photodiodes for continuous wave THz generation. Opt. Express 2010, 18, 11105–11110. [Google Scholar] [CrossRef] [PubMed]
  3. Preu, S.; Döhler, G.H.; Malzer, S.; Wang, L.J.; Gossard, A.C. Tunable, continuous-wave Terahertz photomixer sources and applications. J. Appl. Phys. 2011, 109, 061301. [Google Scholar] [CrossRef] [Green Version]
  4. Thomas, V.A.; El-Hajjar, M.; Hanzo, L. Millimeter-Wave Radio Over Fiber Optical Upconversion Techniques Relying on Link Nonlinearity. IEEE Commun. Surv. Tutor. 2016, 18, 29–53. [Google Scholar] [CrossRef] [Green Version]
  5. Hassan, T.; Ali, N. Real & Simulated QPSK Up-Converted Signals by a Sampling Method Using a Cascaded MZMs Link. Photonics 2022, 9, 34. [Google Scholar] [CrossRef]
  6. Chul, S.P.; Choong, K.; Chung, G.L.; Dong-Hwan, K.; Chang-Soo, P. A photonic up-converter for a WDM radio-over-fiber system using cross-absorption modulation in an EAM. IEEE Photonics Technol. Lett. 2005, 17, 1950–1952. [Google Scholar] [CrossRef]
  7. Thouras, J.; Benazet, B.; Leblond, H.; Aupetit-Berthelemot, C. Photonic radio frequency down-converter based on parallel electro-absorption modulators in Ku/Ku band for space applications. In Proceedings of the 2016 21st OptoElectronics and Communications Conference (OECC) Held Jointly with 2016 International Conference on Photonics in Switching (PS), Niigata, Japan, 3–7 July 2016; pp. 576–578. [Google Scholar]
  8. Ahmad, W.M.; Haymen, S.C.L.; Chris, G.; Michele, N.; Alwyn, J.S.; Cyril, C.R. 60-GHz Transmission link using uni-traveling carrier photodiodes at the transmitter and the re-ceiver. J. Lightwave Technol. 2018, 36, 4507–4513. [Google Scholar]
  9. Rouvalis, E.; Fice, M.; Renaud, C.; Seeds, A.J. Millimeter-Wave Optoelectronic Mixers Based on Uni-Traveling Carrier Photodiodes. IEEE Trans. Microw. Theory Tech. 2012, 60, 686–691. [Google Scholar] [CrossRef]
  10. Bohemond, C.; Rampone, T.; Sharaiha, A. Performances of a Photonic Microwave Mixer Based on Cross-Gain Modulation in a Semiconductor Optical Amplifier. J. Lightwave Technol. 2011, 29, 2402–2409. [Google Scholar] [CrossRef]
  11. Termos, H.; Rampone, T.; Sharaiha, A.; Hamié, A.; Alaeddine, A. All-Optical Radiofrequency Sampling Mixer Based on a Semiconductor Optical Amplifier Mach–Zehnder Interferometer Using a Standard and a Differential Configuration. J. Lightwave Technol. 2016, 34, 4688–4695. [Google Scholar] [CrossRef]
  12. Termos, H.; Rampone, T.; Sharaiha, A.; Hamié, A. Up and down frequency conversion of a QPSK signal by an all-optical radiofrequency sampling mixer based on a semiconductor optical amplifier Mach-Zehnder interferometer. In Proceedings of the 2015 International Topical Meeting on Microwave Photonics (MWP), Paphos, Cyprus, 25–29 October 2015; pp. 1–4. [Google Scholar]
  13. Termos, H.; Rampone, T.; Sharaiha, A.; Hamie, A.; Alaeddine, A. OFDM signal up and down frequency conversions by a sampling method using a SOA-MZI. In Proceedings of the 2017 29th International Conference on Microelectronics (ICM), Beirut, Lebanon, 10–13 December 2017; pp. 1–5. [Google Scholar]
  14. Termos, H.; Rampone, T.; Sharaiha, A. Sampling rate influence in up and down mixing of QPSK and OFDM signals using an SOA-MZI in a differential configuration. Electron. Lett. 2018, 54, 990–991. [Google Scholar] [CrossRef]
  15. Termos, H.; Mansour, A.; Nasser, A. Simultaneous up- and down-frequency mixing based on a cascaded SOA-MZIs link. Appl. Opt. 2021, 60, 8336–8348. [Google Scholar] [CrossRef] [PubMed]
  16. Hassan, T.; Ali, M.; Abbass, N. Simultaneous Up-Conversion Based on a Co- & Counter-Directions SOA-MZI Sam-pling Mixer with Standard & Differential Modulation Modes. Photonics 2022, 9, 109. [Google Scholar] [CrossRef]
  17. Termos, H.; Mansour, A. OFDM signal down frequency conversion based on a SOA-MZI sampling mixer using differ-ential modulation and switching architectures. Opt.-Int. J. Light Electron Opt. 2021, 245, 167761. [Google Scholar] [CrossRef]
  18. Song, H.-J.; Lee, J.S.; Song, J.-I. Signal up-conversion by using a cross-phase-modulation in all-optical SOA-MZI wave-length converter. IEEE Photon. Technol. Lett. 2004, 16, 593–595. [Google Scholar] [CrossRef]
  19. Kim, H.-J.; Lee, S.-H.; Song, J.-I. Generation of a 100-GHz opticalSSB signal using XPM-based all-optical frequency up-conversion in an SOAMZI. Microw. Opt. Technol. Lett. 2014, 57, 35–38. [Google Scholar] [CrossRef]
  20. Kim, D.-H.; Lee, J.-Y.; Choi, H.-J.; Song, J.-I. All-optical single sideband frequency up conversion utilizing the XPM effect in an SOAMZI. Opt. Express 2016, 24, 20309–20317. [Google Scholar] [CrossRef]
  21. Capmany, J.; Sales, S.; Pastor, D.; Ortega, B. Optical mixing of microwave signals in a nonlinear semiconductor laser am-plifier modulator. Opt. Express 2002, 10, 183–189. [Google Scholar] [CrossRef]
  22. Bohémond, C.; Sharaiha, A.; Rampone, T.; Khaleghi, H. Electro-optical radiofrequency mixer based on semiconductor optical amplifier. Electron. Lett. 2011, 47, 331–333. [Google Scholar] [CrossRef]
  23. Rampone, T.; Zulma, R.; Sharaiha, A. Electro-optical radiofrequency up-converter based on a semiconductor optical am-plifier. In Proceedings of the 2011 International Topical Meeting on Microwave Photonics Jointly Held with the 2011 Asia-Pacific Microwave Photonics Conference, Singapore, 18–21 October 2011; Volume 31, pp. 145–148. [Google Scholar]
  24. Wang, J.; Rong, J.; Yu, L. Dynamic prescribed performance sliding mode control for DC–DC buck converter system with mismatched time-varying disturbances. ISA Trans. 2022. [Google Scholar] [CrossRef]
  25. Gomes, N.J.; Monteiro, P.P.; Gameiro, A. Next Generation Wireless Communications Using Radio over Fiber; Wiley: Hoboken, NJ, USA, 2012. [Google Scholar]
  26. VPI Transmission Maker/VPI Component Maker, User’s Manual, Photonic Modules Reference Manuals. VPI Photonics Official Website. Available online: http://www.vpiphotonics.com (accessed on 1 July 2022).
  27. Schmogrow, R.; Nebendahl, B.; Winter, M.; Josten, A.; Hillerkuss, D.; Koenig, S.; Meyer, J.; Dreschmann, M.; Huebner, M.; Koos, C.; et al. Error Vector Magnitude as a Performance Measure for Advanced Modulation Formats. IEEE Photonics Technol. Lett. 2011, 24, 61–63. [Google Scholar] [CrossRef]
  28. Mestre, M.A.; Mardoyan, H.; Caillaud, C.; Rios-Müller, R.; Renaudier, J.; Jennevé, P.; Blache, F. Compact InP-based DFB-EAM enabling PAM-4 112 Gb/s transmission over 2 km. J. Lightwave Technol. 2016, 34, 1572–1578. [Google Scholar] [CrossRef]
  29. 3GPP TS 36.104, Base Station (BS) Radio Transmission and Reception, Version 14.3.0 Release 14. 2017. Available online: https://www.etsi.org/deliver/etsi_ts/136100_136199/136104/14.03.00_60/ts_136104v140300p.pdf (accessed on 1 July 2022).
Figure 1. Electro-optical shifting based on a sampling SOA–MZI using the modulation of differential schema. MP: Middle Port, OP: Output Port, OC: Optical Coupler, and Att: Attenuator.
Optics 03 00022 g001
Figure 2. Mixing setup used in a VPI simulator counted on the modulation of the differential mode. ESA: Electrical Spectrum Analyzer, Att: Attenuator, OF: Optical Filter, LNA: Low-Noise Amplifier, BER: Bit Error Rate, QAM: Quadrature Amplitude Modulation, PD: Photodiode, and OPC: Optical Pulse Clock.
Optics 03 00022 g002
Figure 3. Electrical spectrum that represents the power in dBm of the signal to be mixed at the outer port of SOA–MZI versus the mixing frequencies n f s ± f I F in GHz for the modulation of differential mode.
Optics 03 00022 g003
Figure 4. Conversion gain and EVM of the signal to be mixed that loads QPSK at n f s + f I F .
Optics 03 00022 g004
Figure 5. Experimental electrical spectrum of the signal to be up-converted at n f s ± f I F at the outer port of the SOA–MZI.
Optics 03 00022 g005
Figure 6. Conversion gain and EVM of the signal to be up-converted at frequencies ranging from f s + f I F = 20 GHz to 3 f s + f I F = 59 GHz for simulation (Sim) and Experimentation (Exp) studies.
Optics 03 00022 g006
Table 1. The comparison between the real and simulated work depended on the differential modulation SOA–MZI by the electro optical sampling.
Results
RealitySimulations
Frequency Range (GHz) 3 f s + f I F = 59 3 f s + f I F = 59 10 f s + f I F = 195.5
Conversion gain (dB)343524
EVM (%)5.5414
Publisher’s Note: MDPI stays neutral with regard to jurisdictional claims in published maps and institutional affiliations.

