1. Introduction
The measurement of positions is a main goal for many vision-based measurement applications. Within that domain, the measurement of deformations of extended structures, especially bridges and high-rise buildings, is of great interest in civil engineering. Large deformations are warning signs for deficiencies in the structural integrity [
1,
2]. Adaptive structures usually come with the necessary sensory equipment already integrated [
1,
3,
4]. However, there could be a large number of structures which could benefit from an installation of deformation sensors, even though they are not adaptive and were not meant to be equipped with them.
Especially for adaptive systems, which are feedback controlled, it is imperative to achieve high spatial accuracy (sub-mm), high temporal accuracy ( 100 ) as well as low latency (few ) for multi-modal oscillation detection/measurement.
Time-of-flight sensors typically have distance accuracies of 0.1–1 of the measuring distance, but not better than one millimeter [
5]. Furthermore, for a large field of view (FOV), the scanning method results in either low lateral resolutions or slow refresh rates (a few frames per second). Total stations and terrestrial laser scanners are far more common, especially when used in the construction of buildings and bridges. Nowadays, they come with absolute distance meters, which offer sub-
longitudinal and a few
lateral accuracy over a 100 m distance [
6]. Yet, they also lack high refresh rates for large FOVs. Interferometric methods can be quite accurate but are costly, slow and not feasible for continuous and fast measurement over a long time. In general, the scanning-based methods presented above are not applicable if fast movements (e.g., vibrations) of extended structures are to be continuously monitored.
Photogrammetric measurement systems easily meet the requirements for high temporal resolution and high lateral accuracies [
7,
8]. Naturally, temporal or spatial averaging can further improve accuracy, but air turbulence limits the maximum achievable accuracy to about
pixel in image space [
9].
Even photogrammetric measurement systems are limited to a low accuracy when using a small focal length for investigating large scenes. The following sections are focused on eliminating this shortcoming for a discrete number of measurement points.
2. Image Replication and Holographic Lens
When high accuracy is required for photogrammetrically measuring or monitoring a remote position, the first logical step is to employ long focal length imaging systems. As a result, the magnification is large. However, for a given sensor size, the field is reduced. For the measurement of deformations of large structures, this is a problem since one is interested in the relative displacement of points on the large structure.
One possible approach is to use sensor networks, e.g., consisting of multiple cameras, which are calibrated with respect to each other [
10]. In practice, however, it is difficult to maintain (extrinsic) calibration of the cameras. Even extremely slight angular changes lead to large measurement errors for deformation measurements.
Another approach is to avoid this problem by using a short focal length in combination with extremely accurate image processing. We have shown such an approach in previous publications [
11,
12,
13,
14] where we employed computer-generated holograms (CGH) in order to achieve accuracies in the range of hundreds to thousands of a pixel.
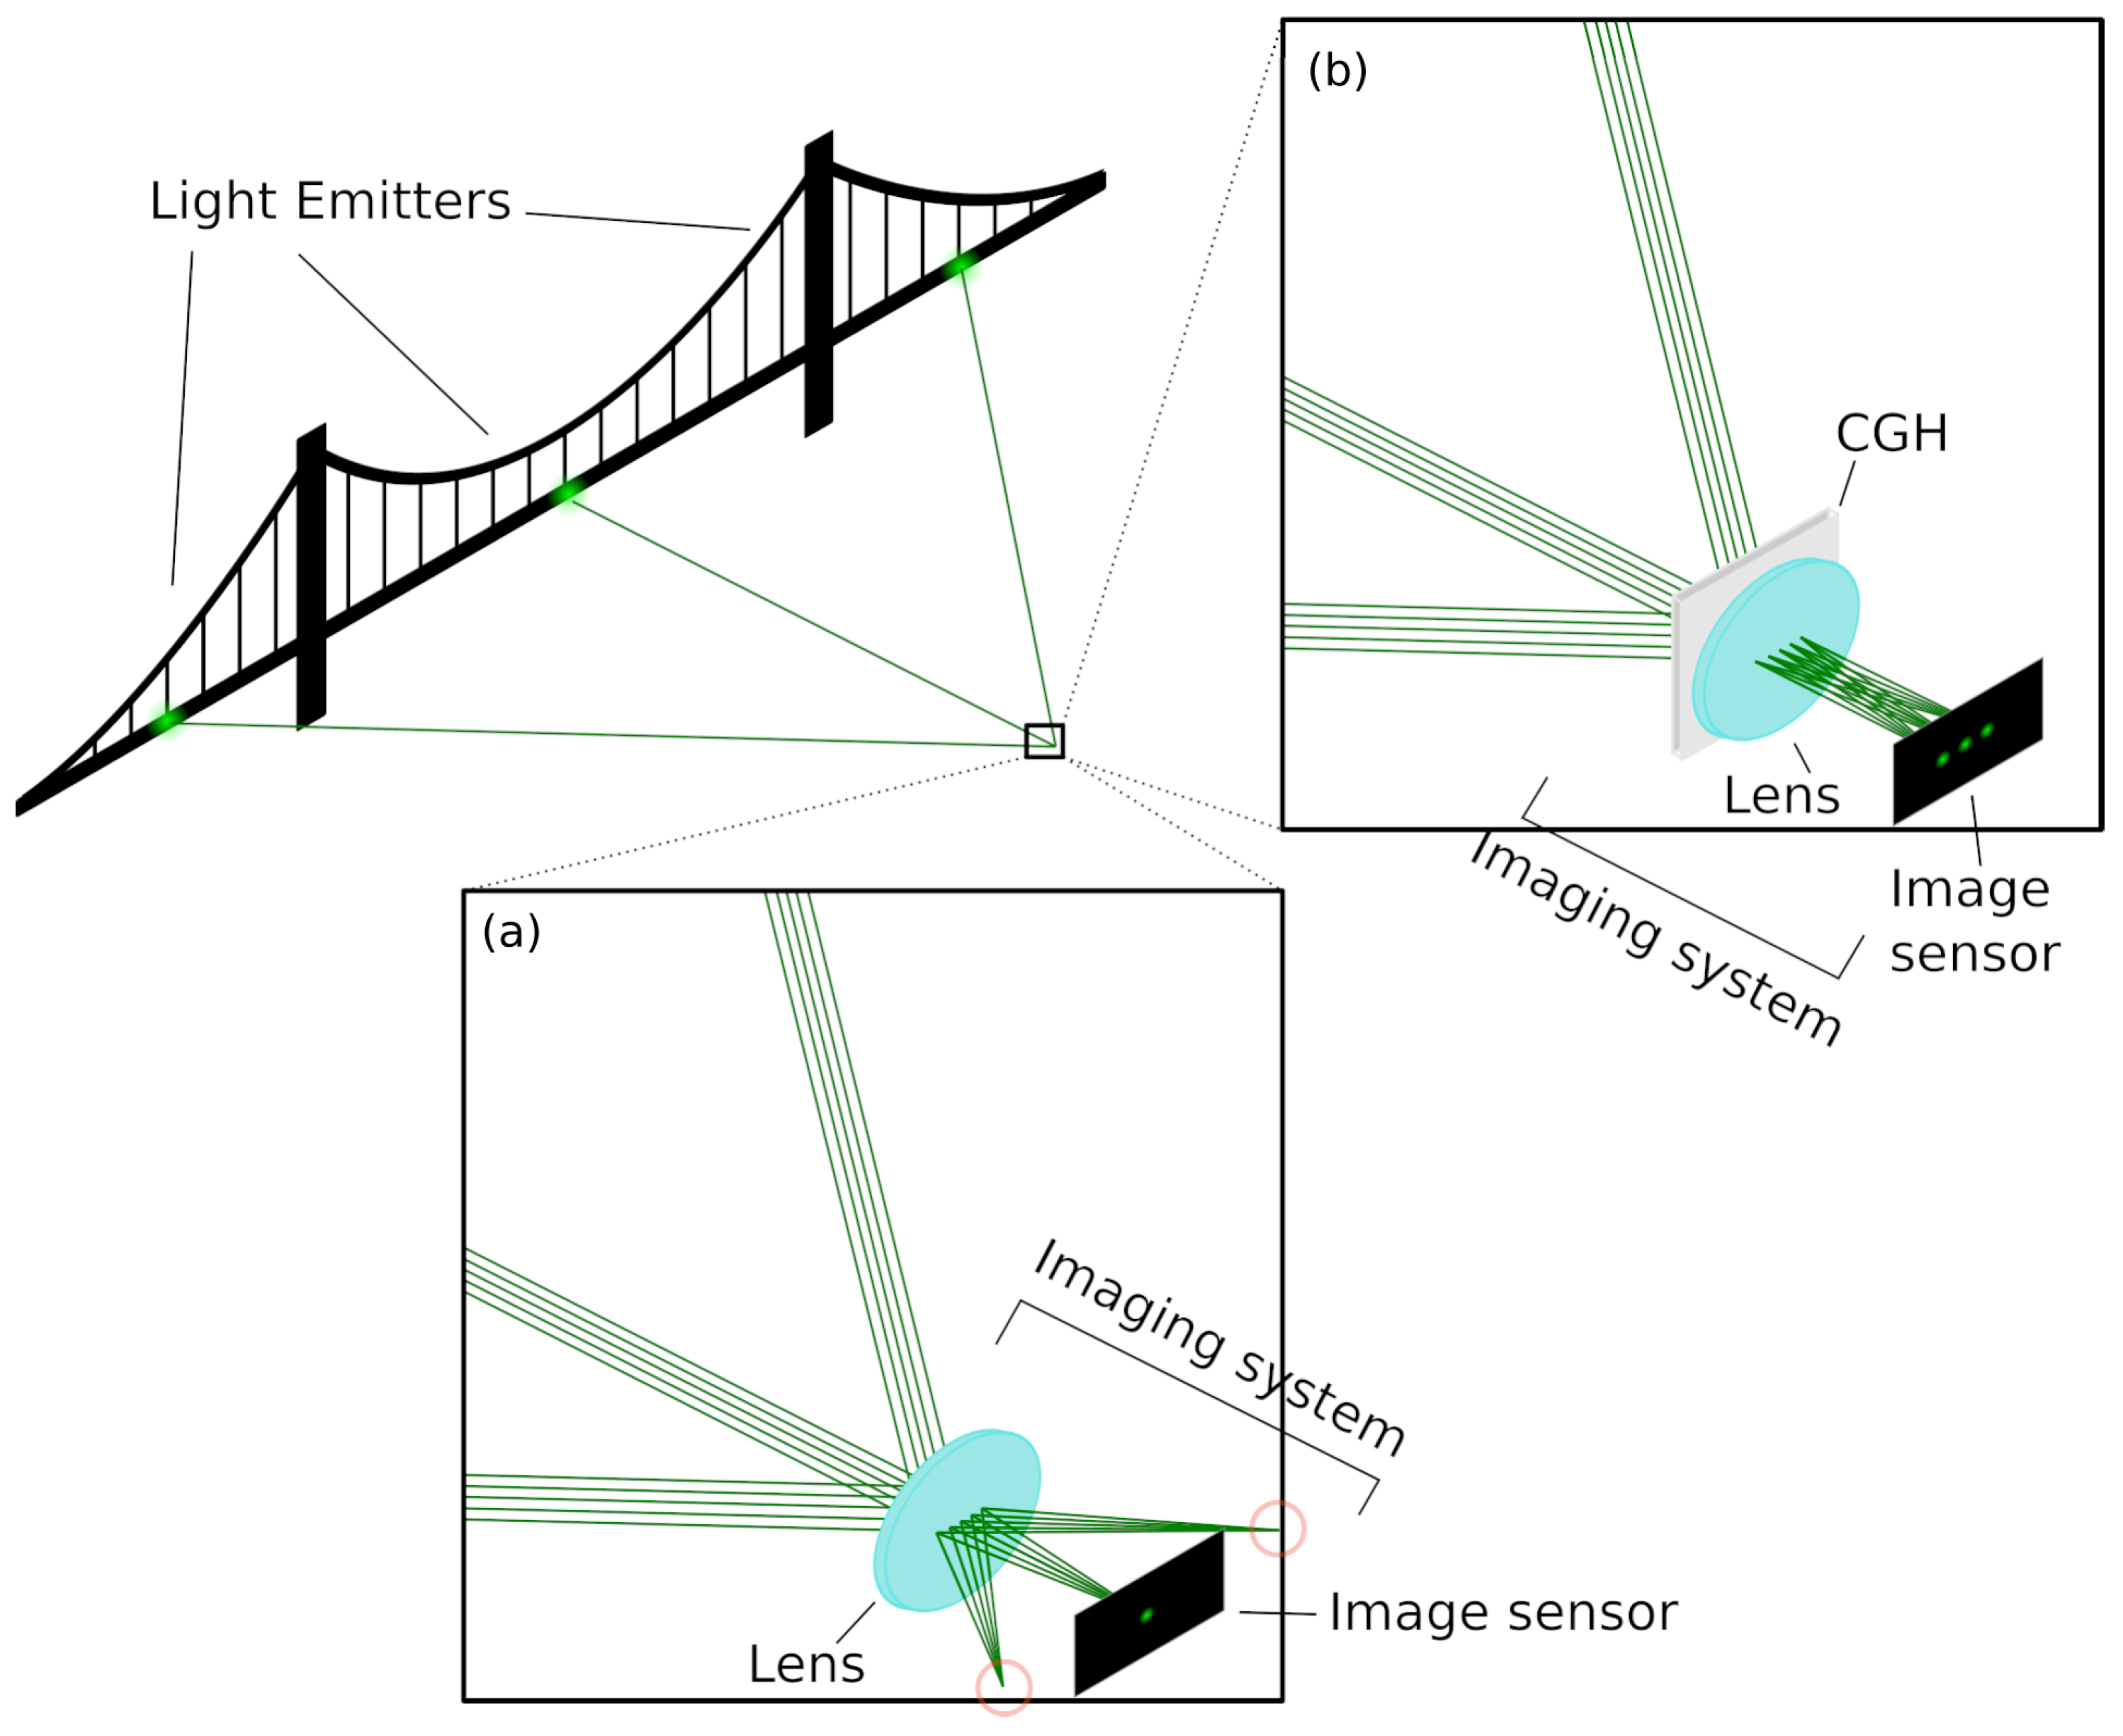
As an illustration of the problem, an extended structure (bridge) is to be monitored at three measurement points. As measurement points, LED or laser emitters are used, which are placed at a large horizontal distance to each other at one side of the structure (beginning, end, and middle of the bridge). The imaging system (achromat with long focal length and camera) is positioned at a large distance in the center of the front side.
Figure 1a) shows that due to the long focal length, only the light coming from the middle emitter—which is located on the optical axis—can be imaged on the sensor.
To circumvent the problem of imaging just a small section of the bridge onto the sensor, a CGH is used to image the additional axially distant emitters onto the sensor. For this purpose, the CGH is put in front of the achromatic lens as shown in
Figure 1b). The incident peripheral beams are diffracted at the CGH to become approximately on-axis beams. This enables the imaging of (a limited discrete number of) distant image sections. Therefore, high-resolution monitoring of measurement points by a single imaging system becomes possible.
The CGH is optimized using an iterative Fourier transform algorithm (IFTA) to diffract light to a limited number of points [
15,
16]. Obviously, if there is a total of three emitters, the CGH must produce −1st, 0th and 1st order diffraction for light coming from each emitter. For an ideal CGH (100% diffraction efficiency, 2/3 of the light would be lost into unwanted diffraction orders. This situation becomes worse the more LEDs or image sections are to be imaged on the sensor, and one has to design the system such that the unwanted diffraction orders will not overlap with the desired orders, and the stray light is not disturbing.
3. Experimental Setup
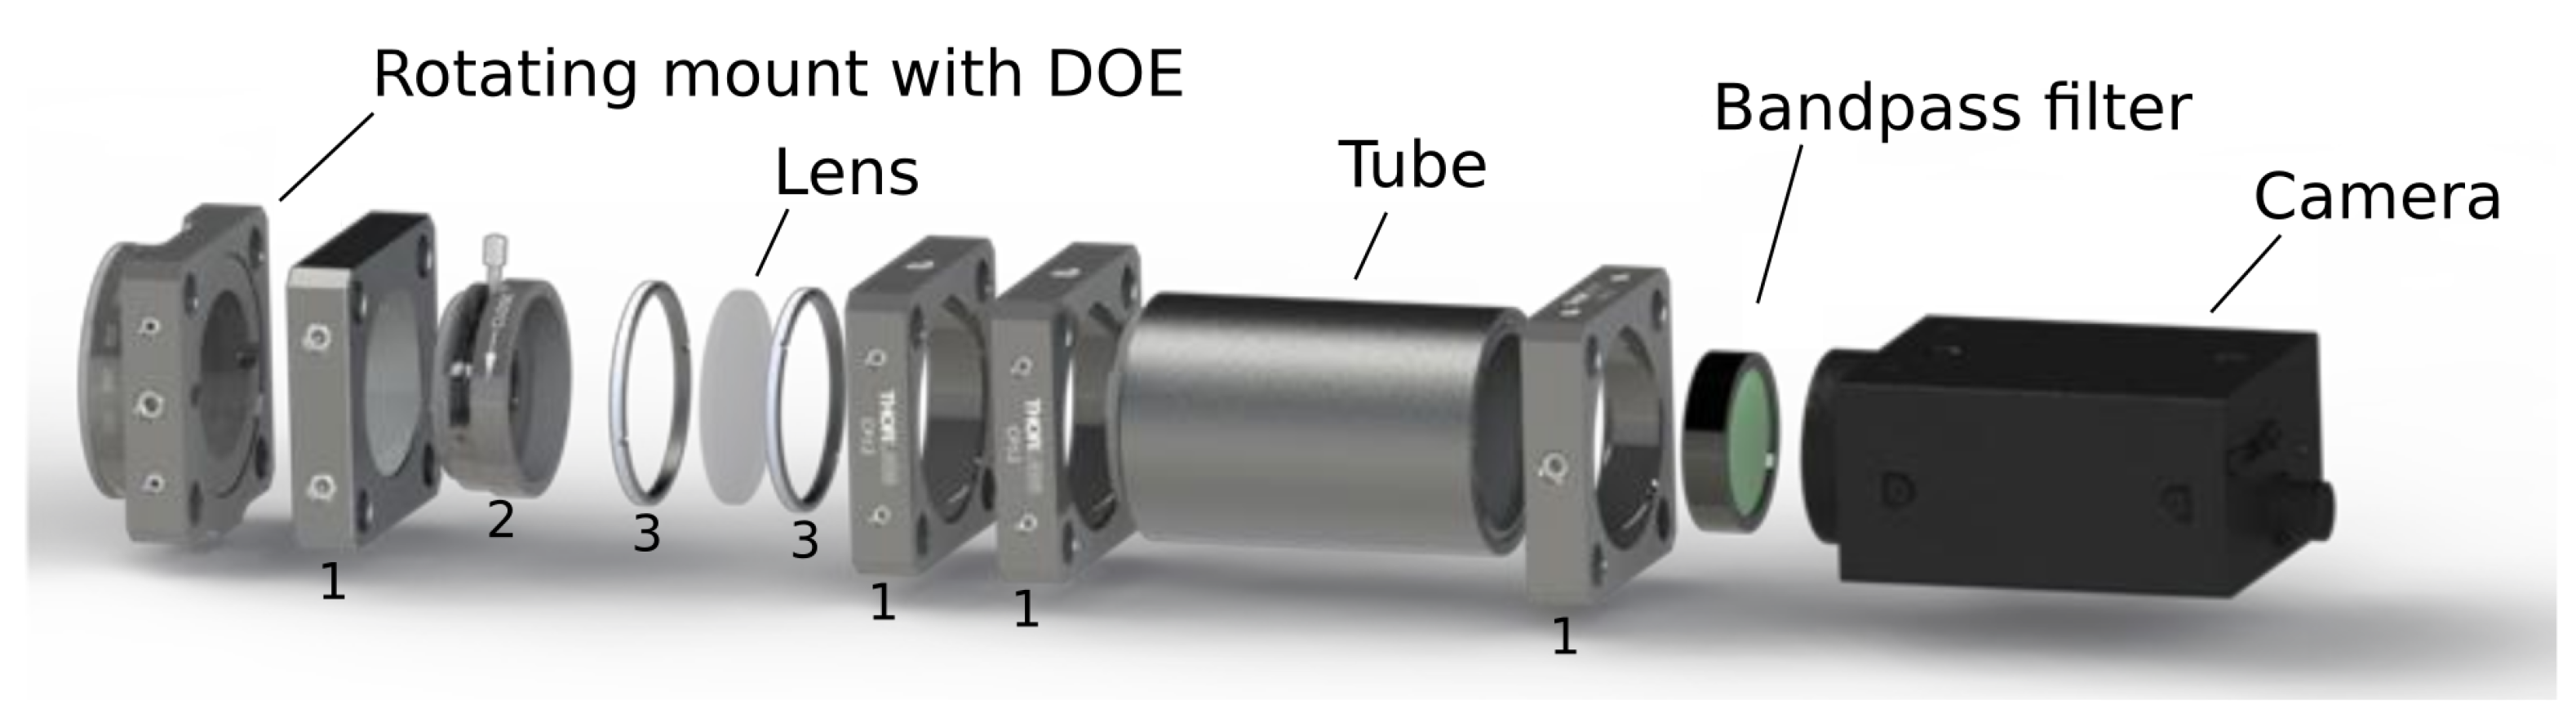
The imaging system (shown in
Figure 2) consists of the CGH, a
200
tube lens, a narrow band-pass filter (at
532
with FWHM = 2
) and a FLIR USB3.0 Grasshopper 3 monochrome image sensor (GS3-U3-23S6M-C: 2.3 MP, 163 FPS, SONY IMX174). The band-bass filter is used to reduce unwanted background light. The FOV of the camera, considering the magnification and sensor size, is
, or
at 10 m distance. Adding the CGH replicates this FOV to specific angular locations reaching
. This widens the (discrete) FOV by a factor of
.
For the laboratory setup we use laser diodes as emitters (Laserfuchs LFD532-1-3(12 × 60)-001 with 5
optical power) housed inside an aluminum box in combination with a planoconvex lens (LA1540-A-ML) to realize a light emitting cone. One of the emitters is mounted on a motorized labjack from Thorlabs (MLJ150) which moves upwards and downwards as shown in
Figure 3 in order to simulate deformations. The other two emitters are positioned
apart, which is ≈
m.
The captured images are processed using the open-source software package, ITOM [
17]. For each spot, the center of gravity (COG) is computed—as described in [
8]—where a threshold
t is subtracted to reduce noise, and the values (after subtraction) are limited to positive values:
where
I is the recorded intensity, and
denotes the image coordinates in pixels.
The COG is computed using
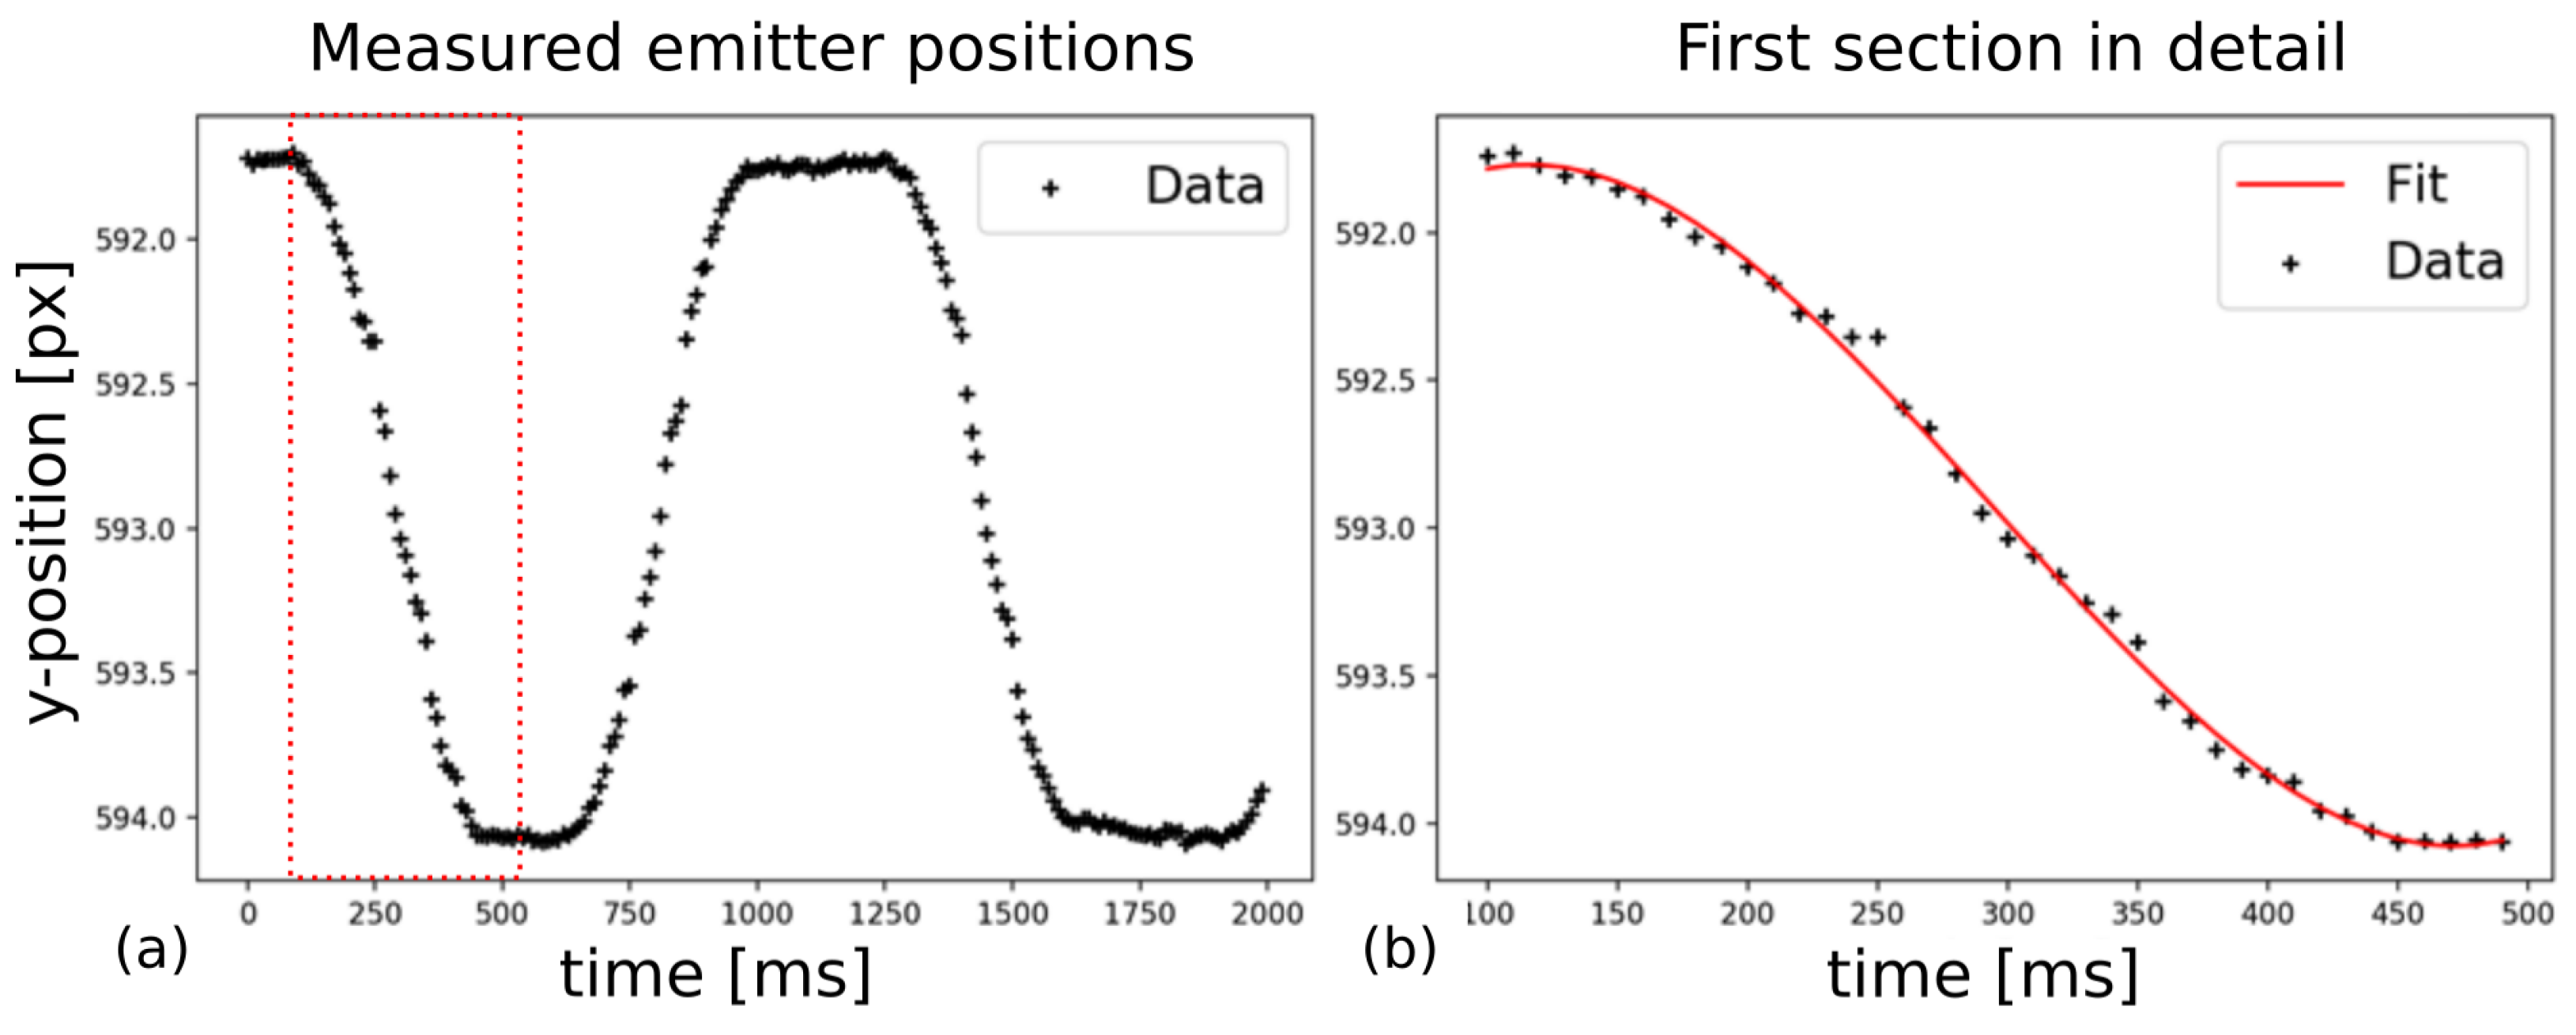
Figure 4 shows the upwards and downwards movement over the time of the light emitter mounted on the stage. To better enhance the visibility of the positional uncertainty of each measurement, the core movement of the stage can be fitted by a third-degree polynomial. The nonlinear movement of the stage due to acceleration and deceleration is visible. If one subtracts this core movement, the residual variation is the measurement uncertainty.
The calculated measurement uncertainties
of the individual segments range from 0.036pixel–0.042pixel, which are within the range of achievable sub-pixel accuracies discussed by Feng et al. [
18]. By using the magnification equation and considering the pixel size of 5.86
µm, the positional accuracy can be calculated from the sensor accuracy without further calibration since the relative spot movement is within a few pixel. This leads to an object-sided measurement uncertainty of 10 μ
. The resulting measurement accuracy was the best that could be achieved considering the accuracy of the stage and the visible air turbulence.
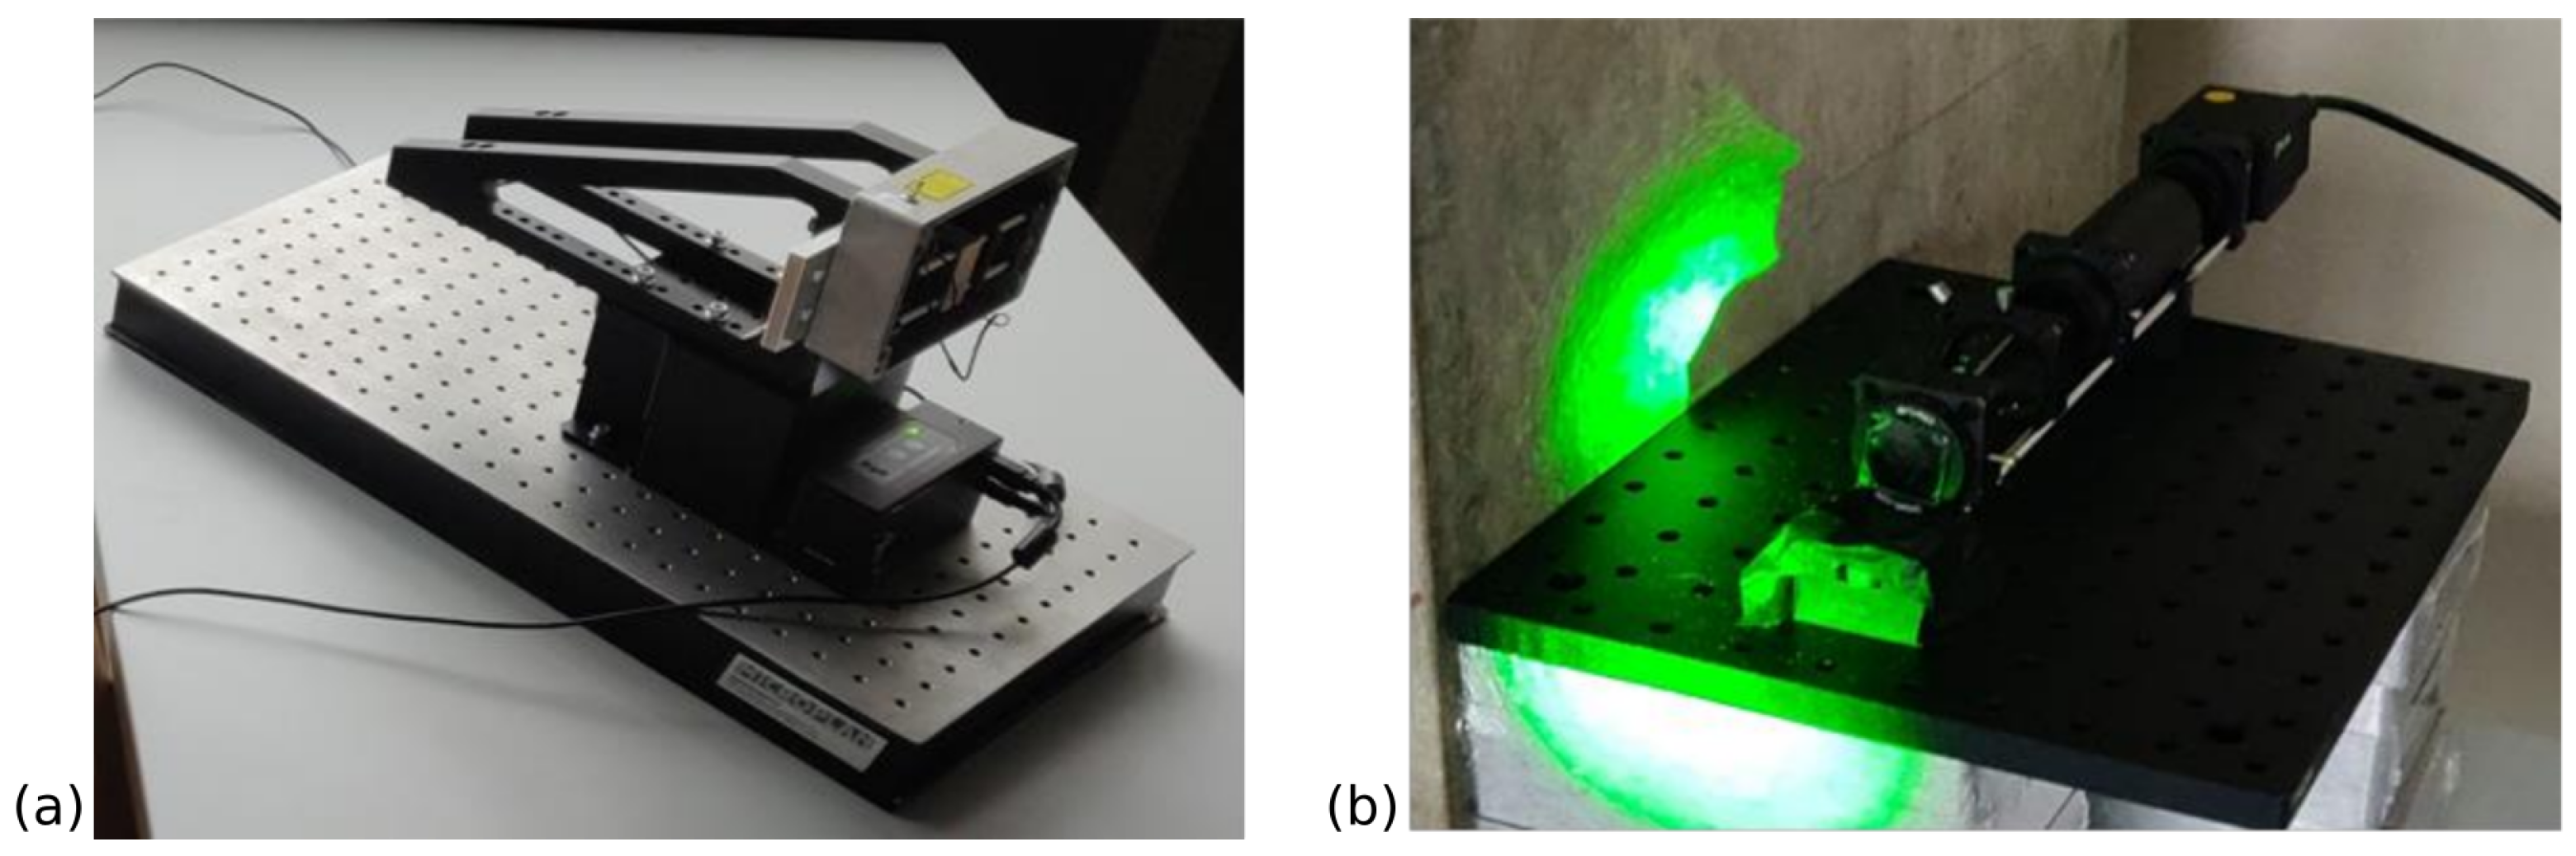
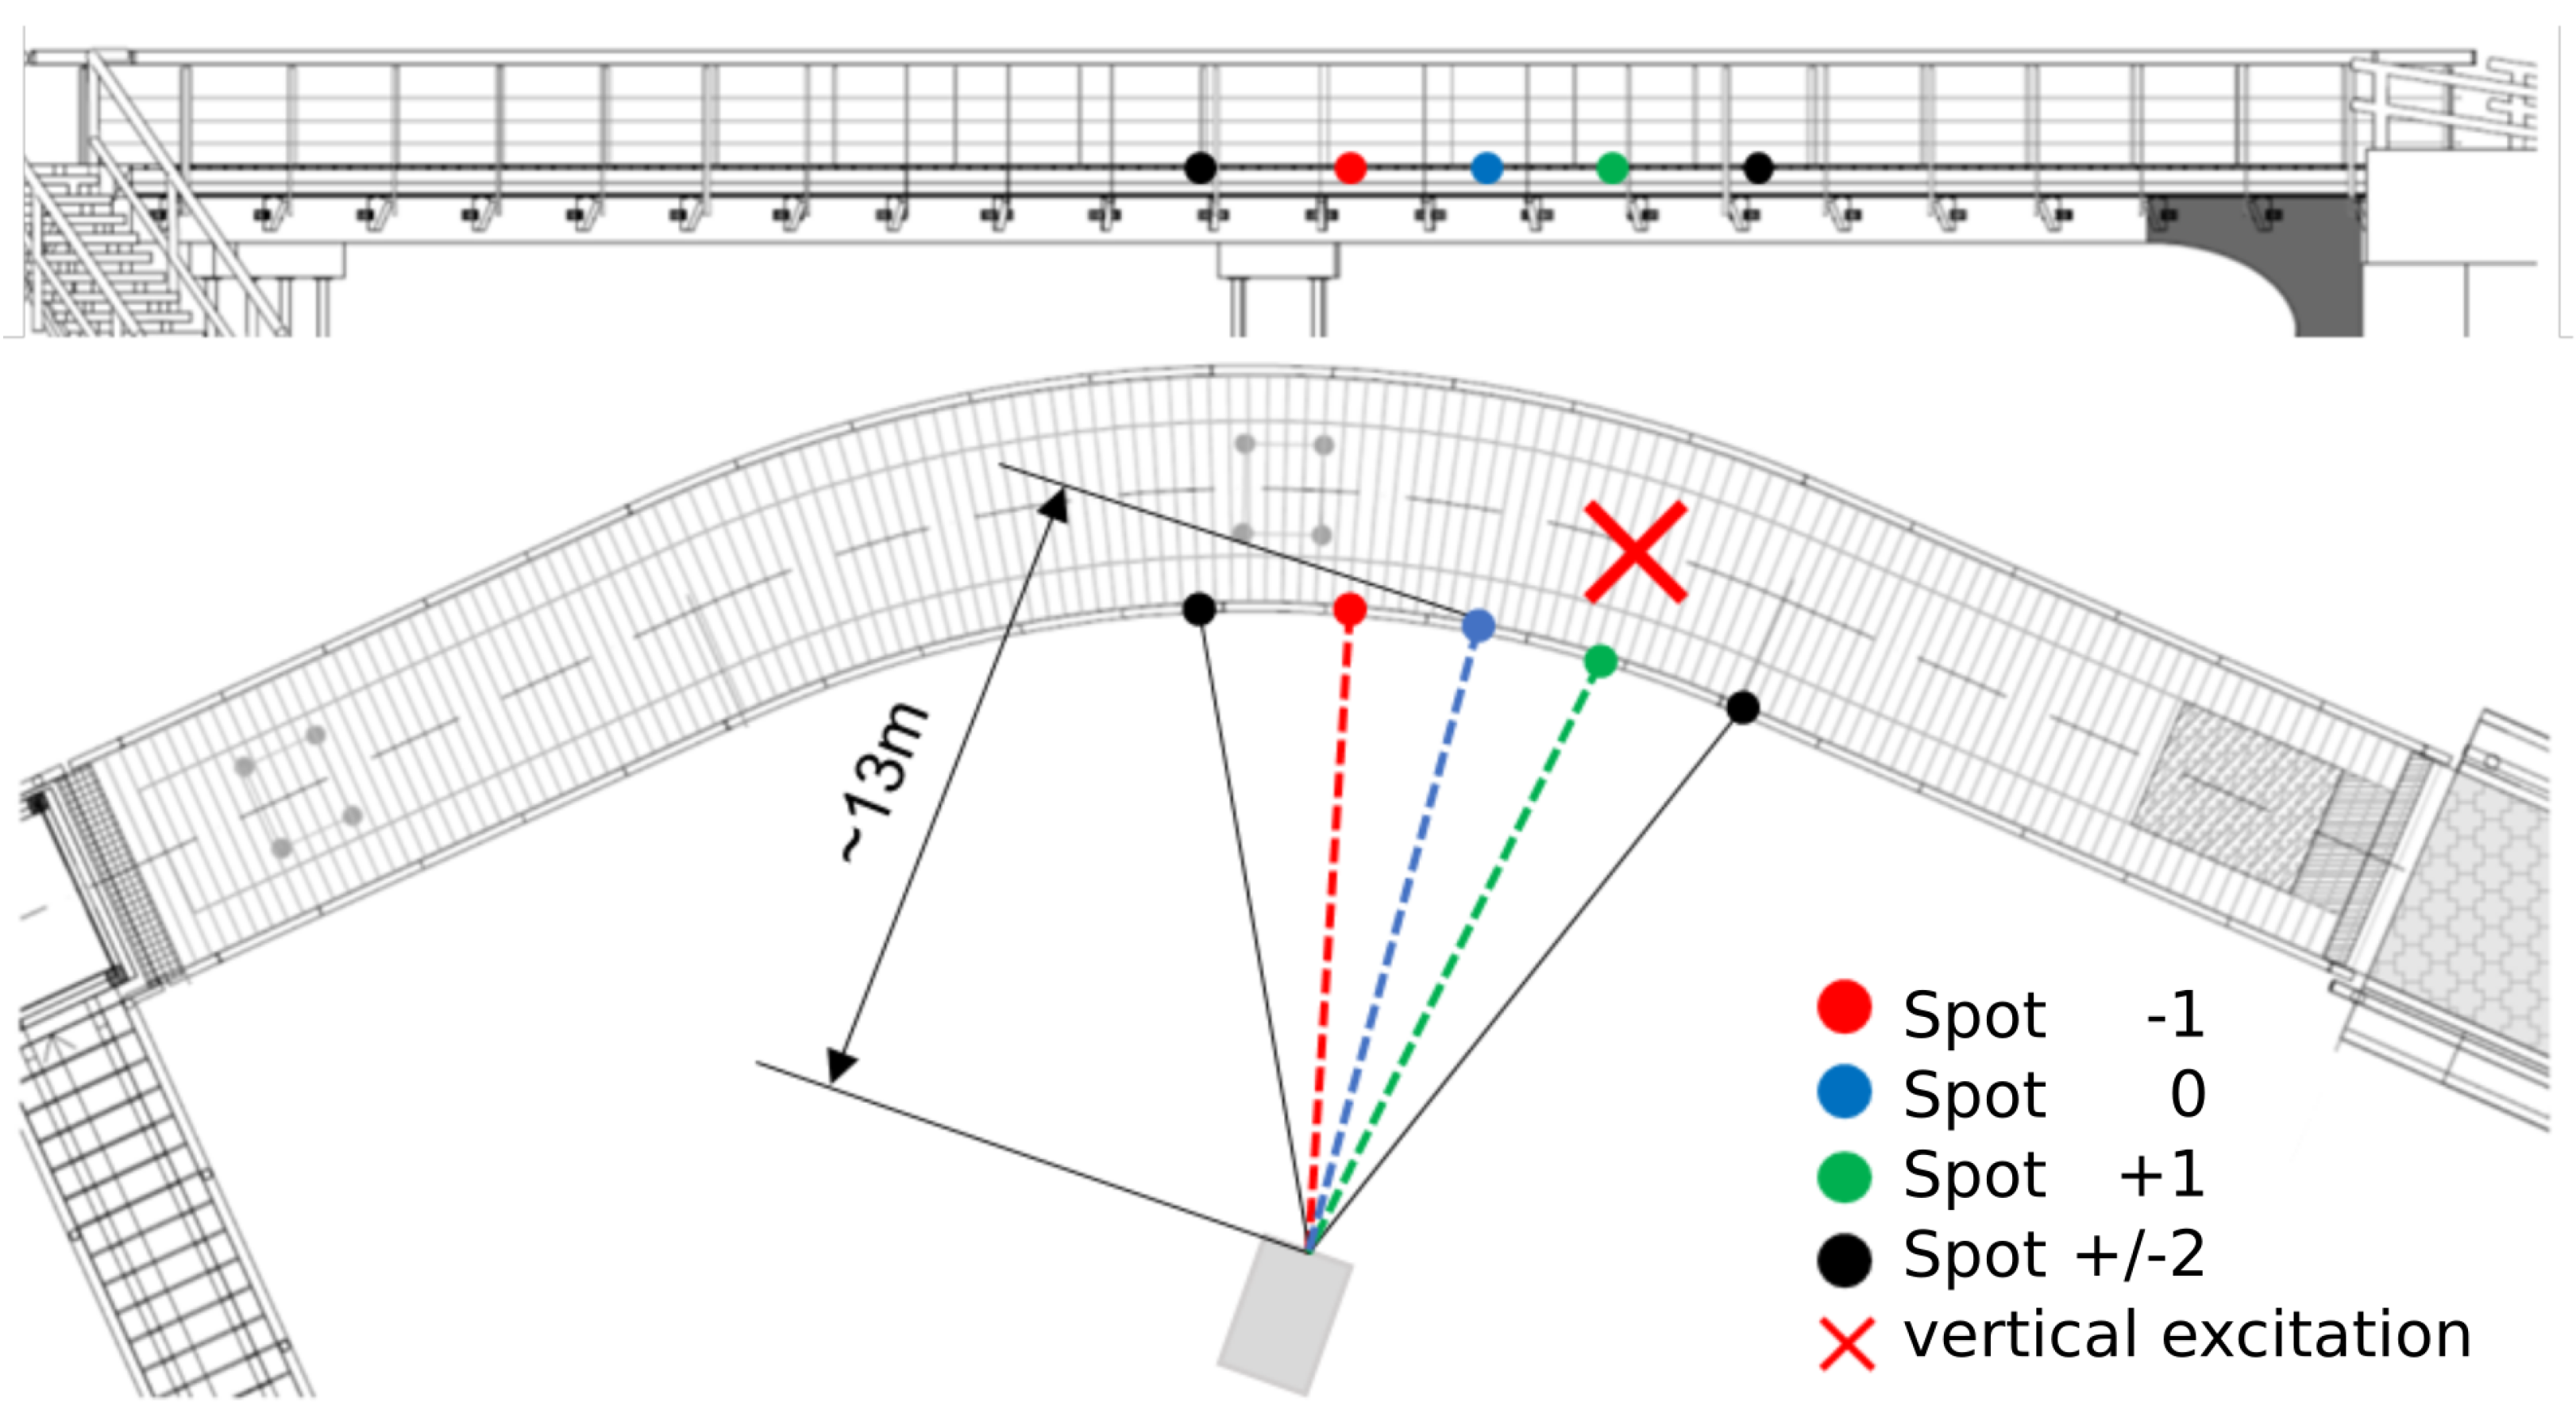
4. Outdoor Test
To further evaluate the scalability of our approach, we conducted our outdoor experiment with five spots in total, where the outermost ones are imaged onto the sensor via their second diffraction order. Due to eye safety considerations, the laser emitters were not usable anymore and we utilized Roithner G58A5111P LEDs ( = 100 at = 50 , ). Moreover, we observed in other laboratory tests that contamination with dust and dirt—which is common when using equipment outdoors—can cause trouble with speckles.
Figure 5 shows the outdoor setup using a wooden prototype bridge, which is exclusively used by pedestrians and bicycles. LEDs are positioned with a pitch of
viewing angle from the camera, ≈2.6 m apart. For the vertical force application, a person with a mass of 85
was positioned above the spot
. To achieve maximum bridge deflection with a single person, the load was applied dynamically by jumping. The deflection—and, consequentially, the oscillation of the bridge—was then measured with the same imaging system we used indoors.
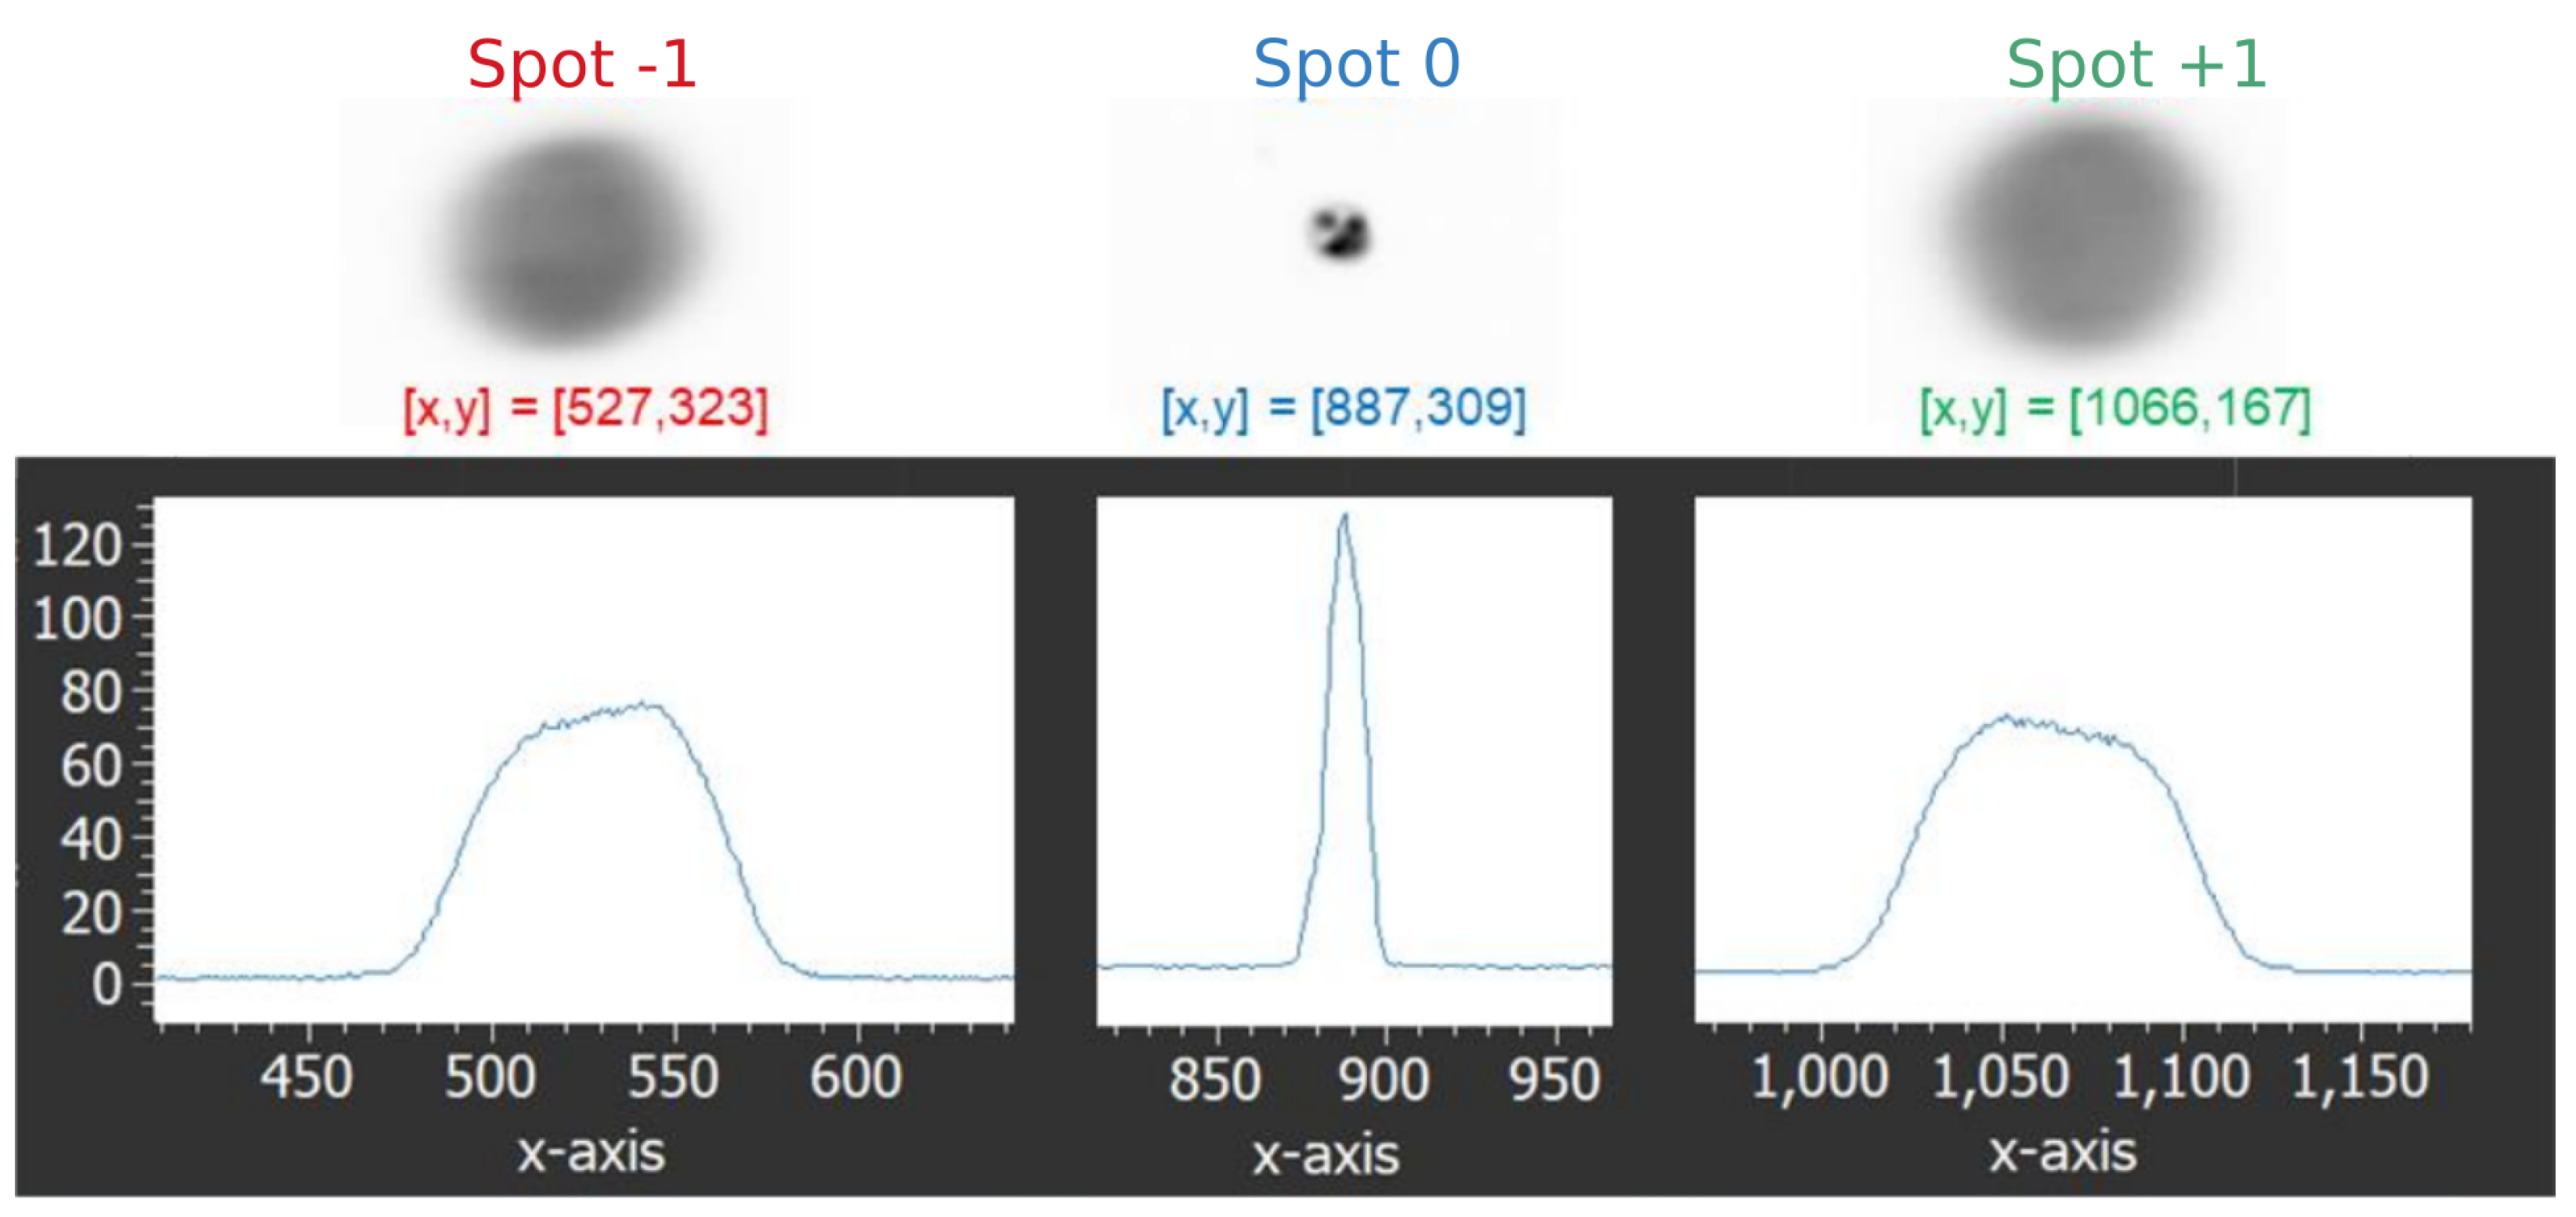
Spots and which are positioned at , cannot be reconstructed and evaluated with the employed exposure time of 5 due to the low diffraction efficiency of the the corresponding orders of the CGH.
Spot 1 (
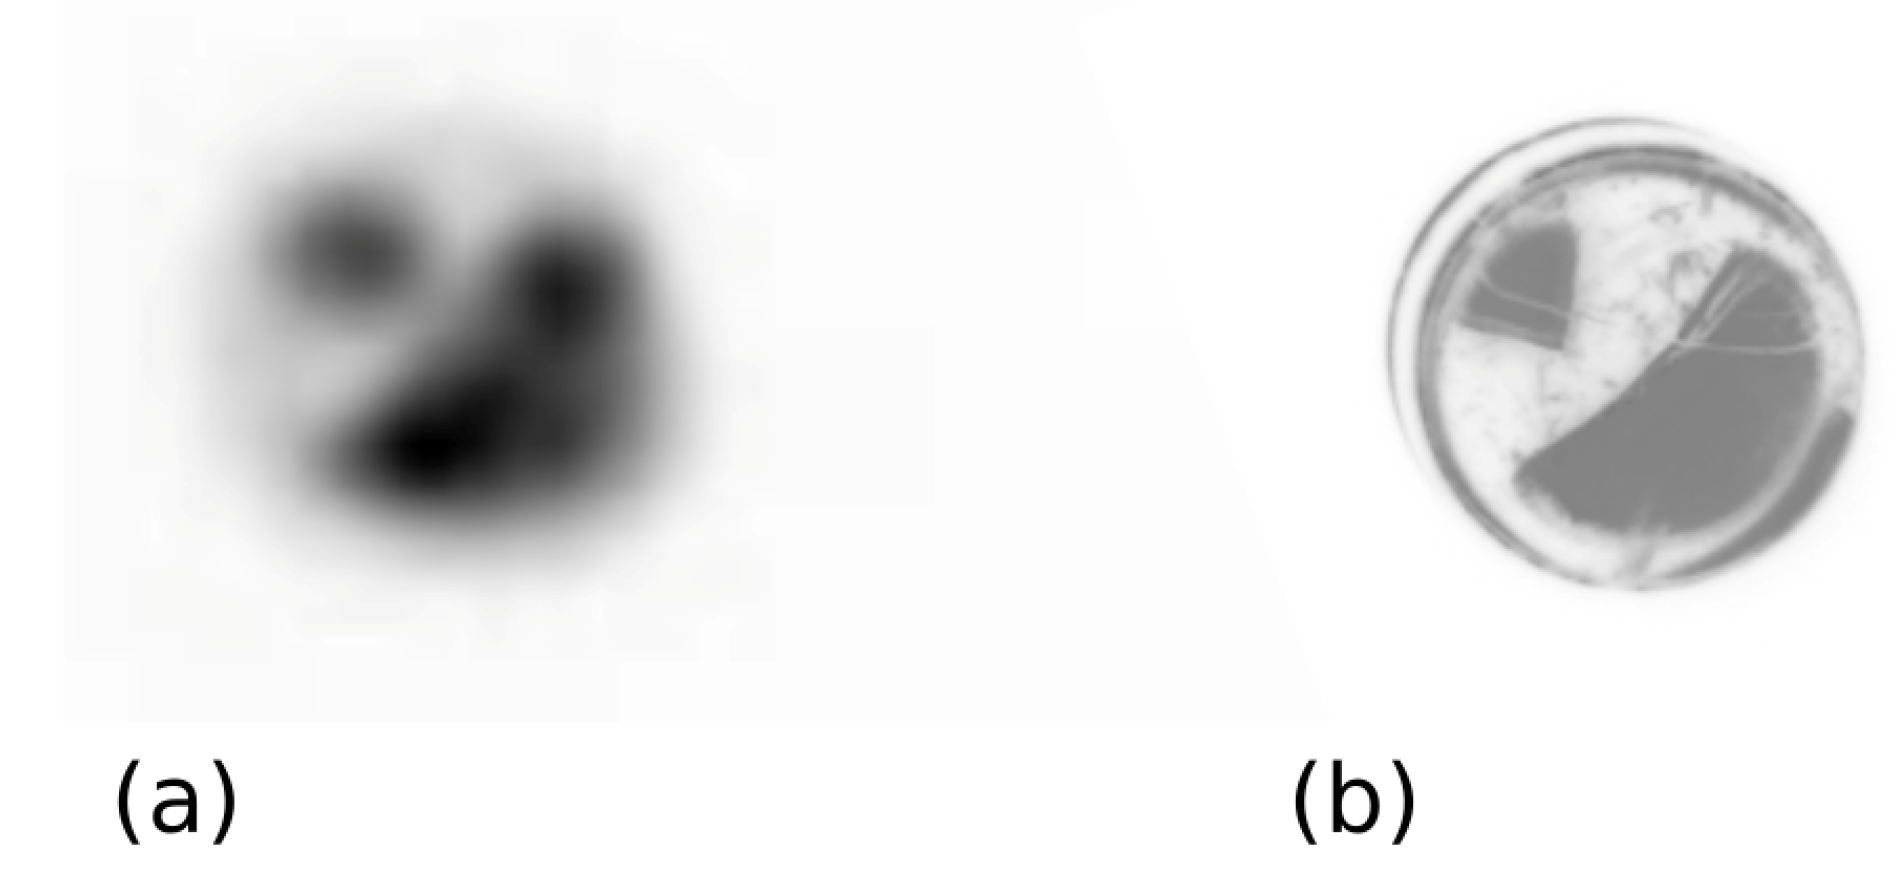
Figure 6) is striking to observe. We find a kind of bisection of the single spot. One possible explanation for this phenomenon is the large magnification combined with the camera focusing the LED. Due to the design of the LED, a two-part spot is created, which reflects the inner circuitry (mainly the anode and cathode) of the LED. The theory seems confirmed when comparing the central spot (0th order) with a macro picture of the LED (
Figure 7).
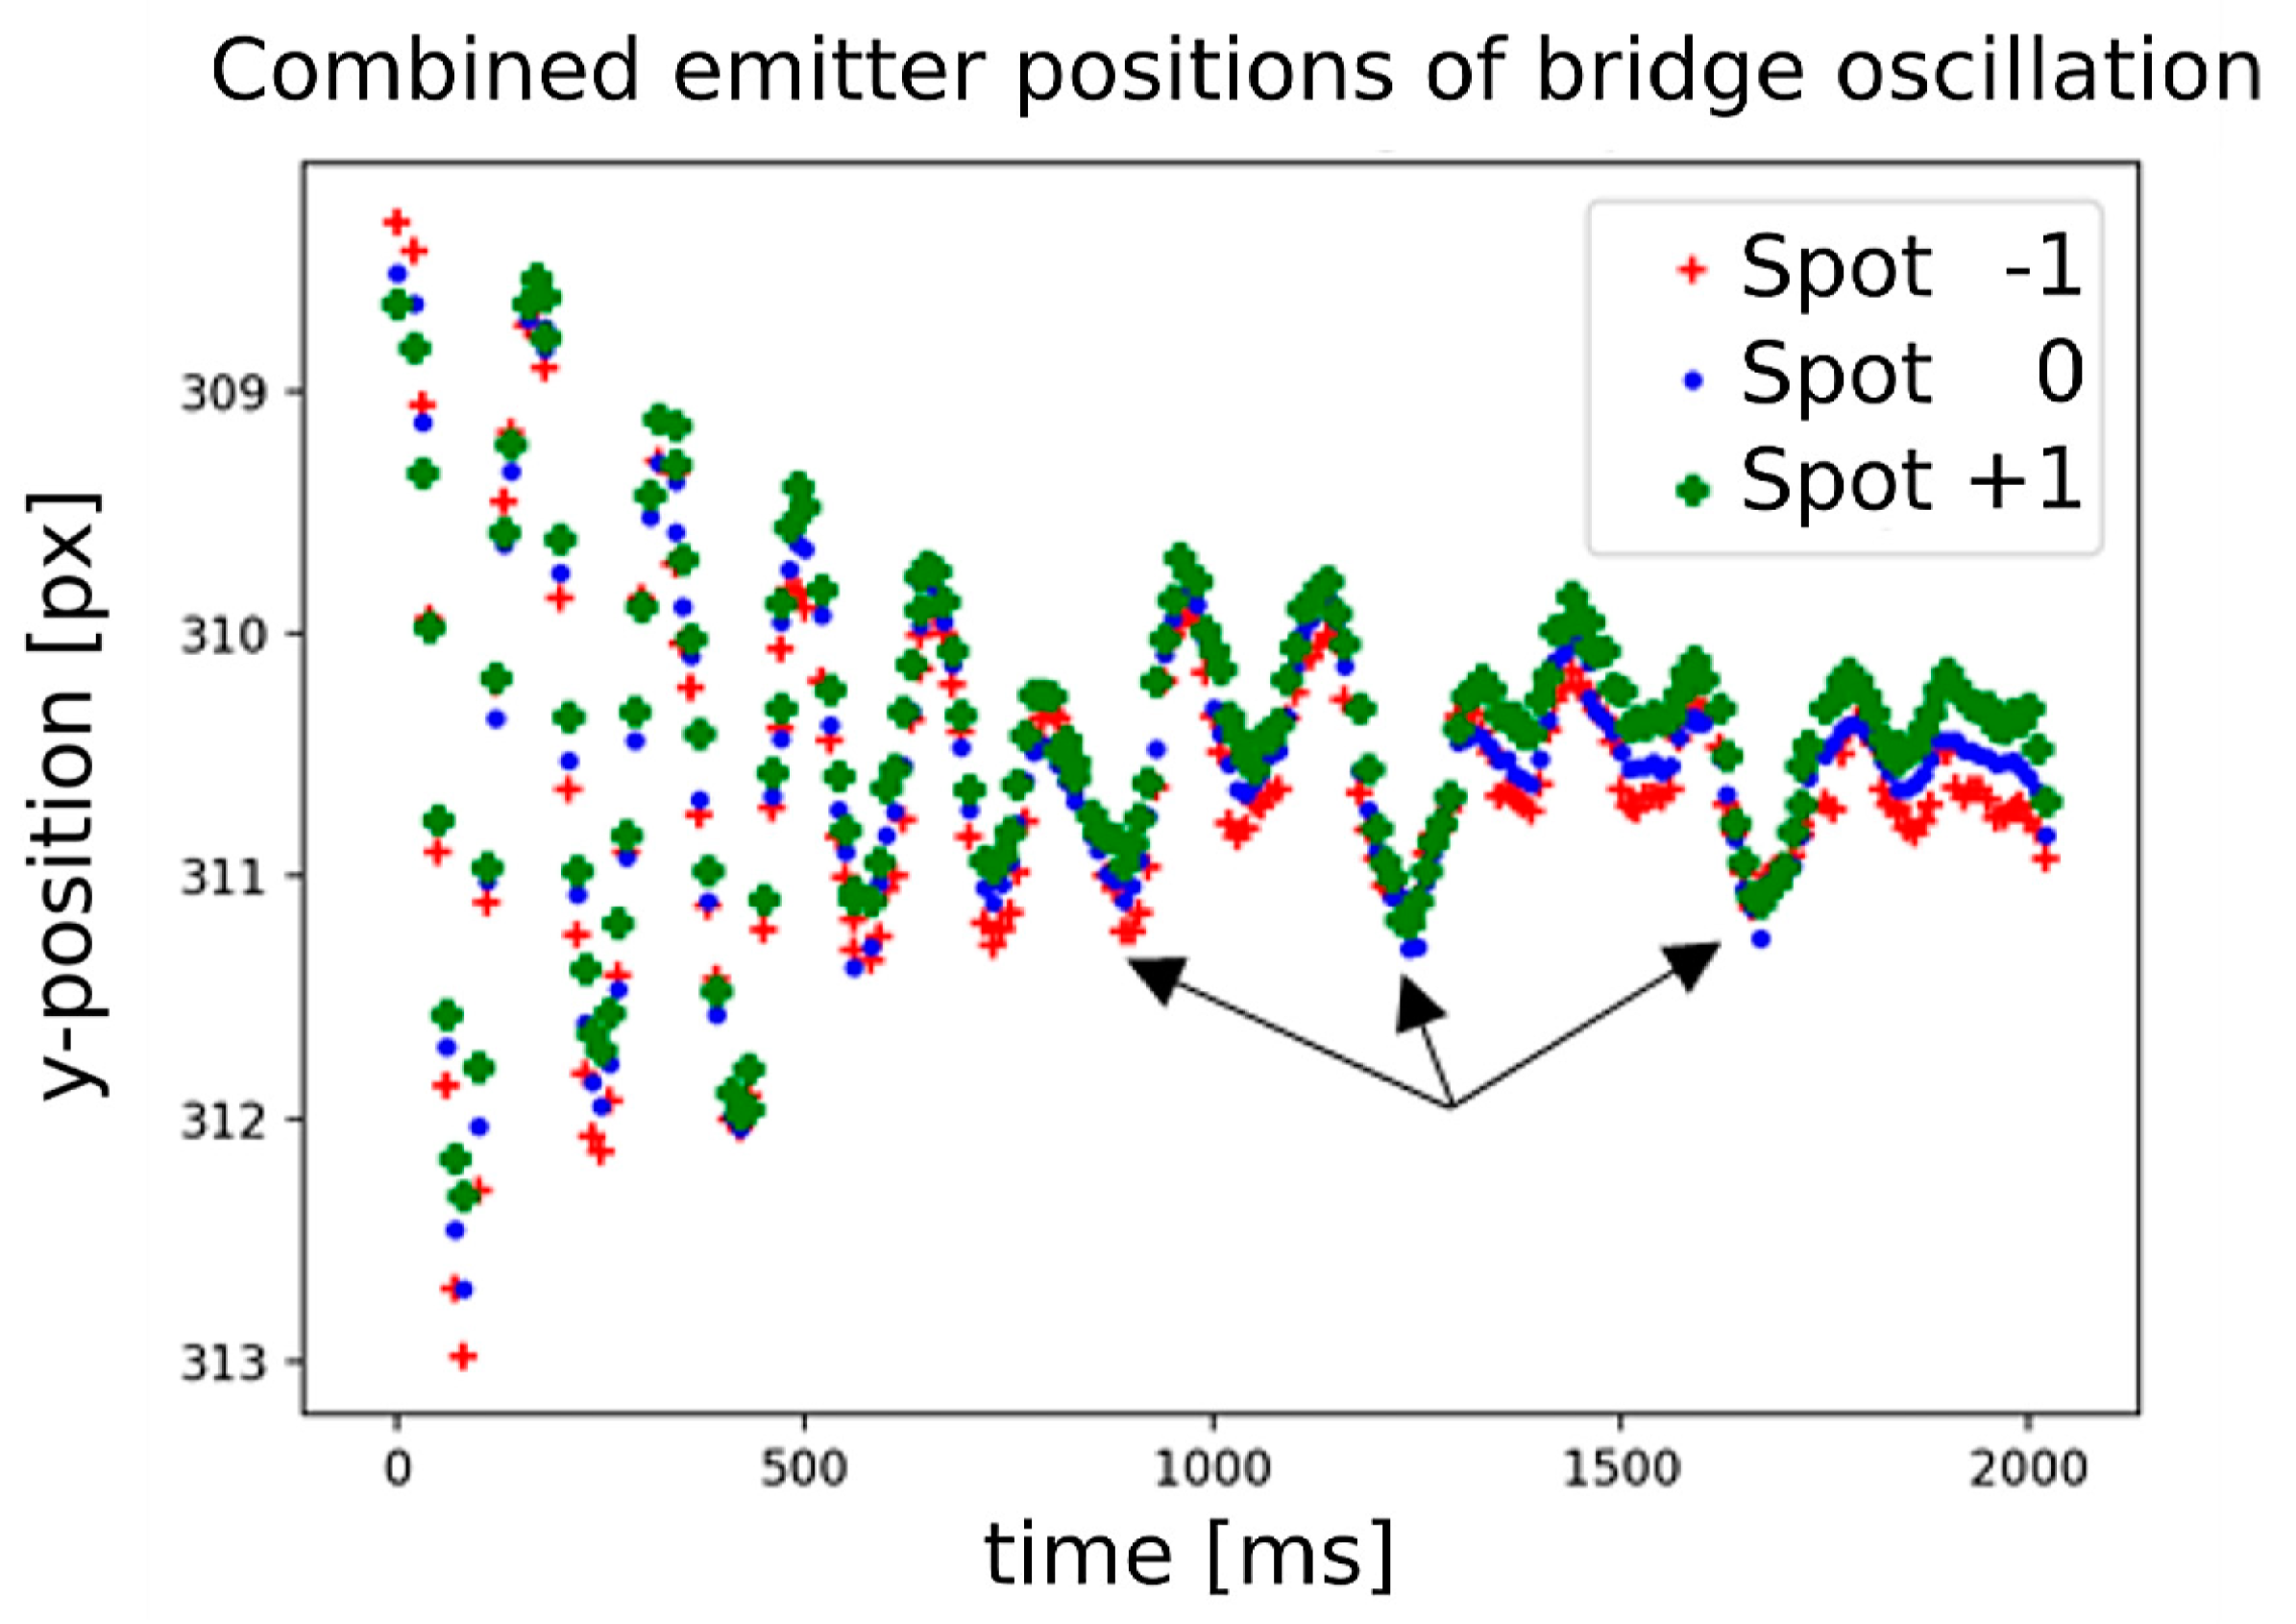
Several test runs and test jumps were performed to obtain different intensities and frequencies of the applied force (shown in
Figure 8). It is possible that during the damped oscillation, further force was applied. The nearly exact overlap of the y-positions of the single spots at the force application times and the lack of reaching the rest position support the thesis.
Spot , which is located directly below the position where the force is applied, experiences the largest positional shift. In line with this, spot , which is located at the greatest distance to the applied force, experiences the smallest displacement.
The field test shows that a relative position deviation can be measured and evaluated with the presented system. In order to improve the comparability of different bridge excitation frequencies and to enable the calculation of the resulting relative position deviations, a defined mechanical, periodic force application should be used for future tests.
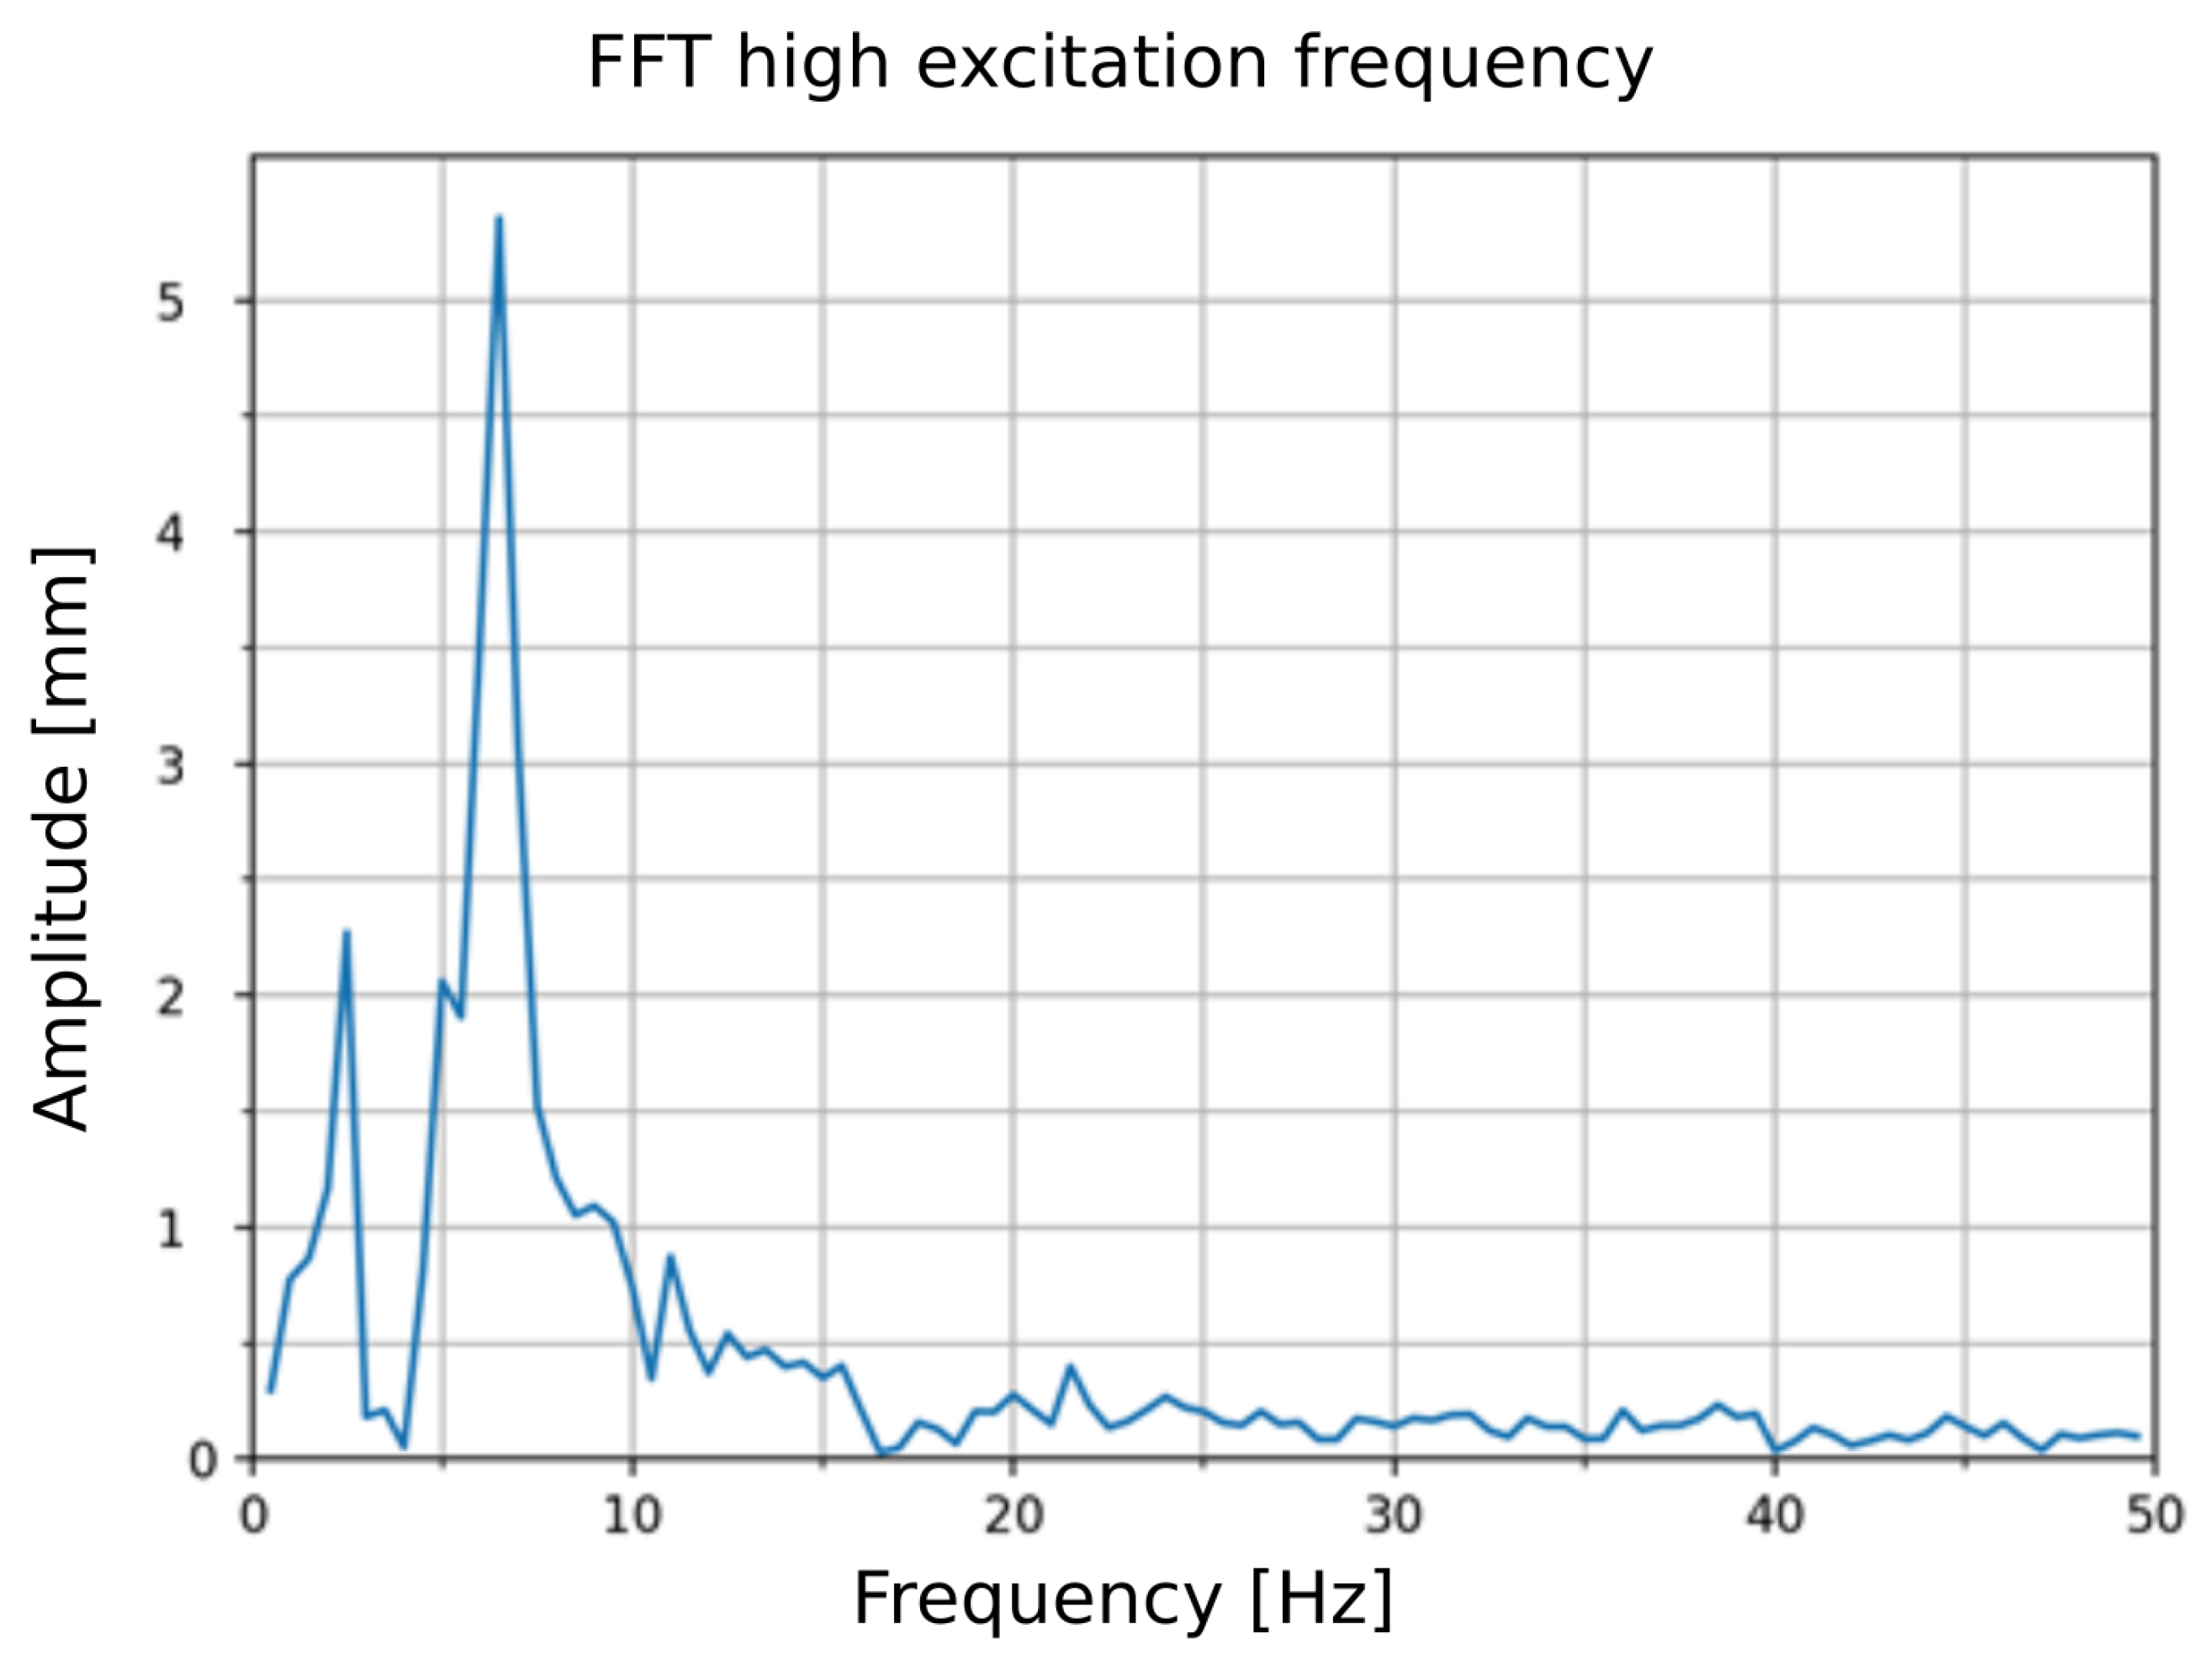
Due to the periodic signal waveform in
Figure 8 at a high bridge excitation frequency, the spectrum of the excited pedestrian and bicycle bridge can be determined by the fast Fourier transform (FFT), shown in
Figure 9. In this way, individual frequencies acting on the structure can be analyzed.
The highest peak at and a second visible peak at probably represent the two fundamental oscillation frequencies of the bridge, where the first one has a significantly lower amplitude than the highest peak.
5. Conclusions
We demonstrated a new method for a camera-based measurement of slight deformations of large extended structures. The core idea is to use a computer-generated hologram in combination with conventional imaging to realize long focal-length imaging with a large field of view. Compared to conventional imaging-based measurements, the field-related accuracy can be strongly increased using a very simple extension of a conventional camera (additional CGH). Compared to sensor networks consisting of multiple cameras, the cost is strongly reduced, the system is much more stable, and continuous long-term operation becomes possible. One important limitation for the proposed method is the inherent need for light emitters on the structure to be measured. Only clearly separated light emitters can be tracked with high accuracy, so the method is not applicable for measuring whole field deformations, e.g., deformations for each pixel of the image sensor.
The basic functionality of the presented system was demonstrated under laboratory conditions using laser emitters and on a real bridge using LEDs. Especially for adaptive systems, the relative position measurement is accurate enough without the need for extensive calibration as with absolute measurement. To achieve stability within a closed-loop feedback system, it is not important that sensory data are perfectly calibrated. Even if a displacement is 1% off, if the displacement is in the order of millimeters, the error is negligible. Finally, measurement uncertainties of 10 μ for a 10 structure at a distance of 10 could be achieved at high temporal resolution using a standard monochrome image sensor. This corresponds to an angular measurement uncertainty of 1 µrad.
In the future, the method may be combined with the multi-point method [
9] to further increase the accuracy.
Author Contributions
Conceptualization, F.G. and T.H.; methodology, T.H.; software, F.G. and P.W.; validation, F.G., P.W. and T.H.; formal analysis, T.H.; investigation, F.G.; resources, F.G. and T.H.; data curation, P.W.; writing—original draft preparation, F.G.; writing—review and editing, F.G. and T.H.; visualization, F.G. and P.W.; supervision, T.H.; project administration, T.H.; funding acquisition, F.G. and T.H. All authors have read and agreed to the published version of the manuscript.
Funding
Funded by the Deutsche Forschungsgemeinschaft (DFG, German Research Foundation)—Project-ID 279064222—SFB 1244.
Institutional Review Board Statement
Not applicable.
Conflicts of Interest
The authors declare no conflict of interest.
Abbreviations
The following abbreviations are used in this manuscript:
| CGH | Computer-generated hologram |
| FOV | Field-of-view |
| IFTA | Iterative Fourier transform algorithm |
| FFT | Fast Fourier transform |
References
- Braunstein, J.; Ruchala, J.; Hodac, B. Smart structures: Fiber-optic deformation and displacement monitoring. In Proceedings of the 1st International Conference on Bridge Maintenance, Safety and Management, Barcelona, Spain, 14–17 July 2002. [Google Scholar]
- Gikas, V.; Karydakis, P.; Mpimis, T.; Piniotis, G.; Perakis, H. Structural integrity verification of cable stayed footbridge based on FEM analyses and geodetic surveying techniques. Surv. Rev. 2016, 48, 1–10. [Google Scholar] [CrossRef]
- Saifeldeen, M.; Fouad, N.; Huang, H.; Wu, Z. Health monitoring of bridges based on distributed long gauge carbon fiber sensors. In Proceedings of the 2nd International Conference on Bridge Testing, Monitoring & Assessment, Cairo, Egypt, 27–29 December 2015; pp. 27–29. [Google Scholar]
- Li, X.; Peng, G.D.; Rizos, C.; Ge, L.; Tamura, Y.; Yoshida, A. Integration of GPS, accelerometer and optical fiber sensors for structural deformation monitoring. In Proceedings of the ION GNSS 17th International Technical Meeting of the Satellite Division, Long Beach, CA, USA, 21–24 September 2004; pp. 211–224. [Google Scholar]
- Jaboyedoff, M.; Oppikofer, T.; Abellán, A.; Derron, M.H.; Loye, A.; Metzger, R.; Pedrazzini, A. Use of LIDAR in landslide investigations: A review. Nat. Hazards 2012, 61, 5–28. [Google Scholar] [CrossRef] [Green Version]
- Schill, F.; Eichhorn, A. Monitoring of Supporting Structures with Profile Laser Scanning. 2018. Available online: https://jgcc.geoprevi.ro/docs/2018/9/jgcc_2018_no9_1.pdf (accessed on 7 December 2021).
- Guerra, F.; Hartlieb, S.; Warsewa, A.; Haist, T.; Osten, W.; Sawodny, O. Deformation measurement of large buildings by holographical point replication. In Optics for Arts, Architecture, and Archaeology VII; Liang, H., Groves, R., Targowski, P., Eds.; International Society for Optics and Photonics, SPIE: Bellingham, WA, USA, 2019; Volume 11058, pp. 32–38. [Google Scholar] [CrossRef]
- Guerra, F.; Haist, T.; Warsewa, A.; Hartlieb, S.; Osten, W.; Tarín, C. Precise building deformation measurement using holographic multipoint replication. Appl. Opt. 2020, 59, 2746–2753. [Google Scholar] [CrossRef] [PubMed]
- Haist, T.; Gronle, M.; Duc Anh, B.; Jiang, B.; Pruss, C.; Schaal, F.; Osten, W. Towards one trillion positions. In Automated Visual Inspection and Machine Vision; SPIE Optical Metrology: Munich, Germany, 2015; Volume 9530. [Google Scholar] [CrossRef]
- Park, J.W.; Lee, J.J.; Jung, H.J.; Myung, H. Vision-based displacement measurement method for high-rise building structures using partitioning approach. NDT E Int. 2010, 43, 642–647. [Google Scholar] [CrossRef]
- Haist, T.; Dong, S.; Arnold, T.; Gronle, M.; Osten, W. Multi-image position detection. Opt. Express 2014, 22, 14450–14463. [Google Scholar] [CrossRef] [PubMed]
- Haist, T.; Gronle, M.; Arnold, T.; Bui, D.A.; Osten, W. Verbeserung von Positionsbestimmungen mittels holografischer Mehrpunktgenerierung. In Forum Bildverarbeitung 2014; Puente Leon, F., Heizmann, M., Eds.; Technisches Messen, KIT Scientific Publishing: Karlsruhe, Germany, 2014; pp. 239–247. [Google Scholar]
- Hartlieb, S.; Tscherpel, M.; Guerra, F.; Haist, T.; Osten, W.; Ringkowski, M.; Sawodny, O. Hochgenaue Kalibrierung eines holografischen Multi-Punkt Positionsmesssystems. tm-Tech. Mess. 2020, 87. [Google Scholar] [CrossRef] [Green Version]
- Hartlieb, S.; Tscherpel, M.; Guerra, F.; Haist, T.; Osten, W.; Ringkowski, M.; Sawodny, O. Highly accurate imaging based position measurement using holographic point replication. Measurement 2021, 172, 108852. [Google Scholar] [CrossRef]
- Wyrowski, F.; Bryngdahl, O. Iterative Fourier-transform algorithm applied to computer holography. J. Opt. Soc. Am. A 1988, 5, 1058–1065. [Google Scholar] [CrossRef]
- Wyrowski, F. Diffraction efficiency of analog and quantized digital amplitude holograms: Analysis and manipulation. J. Opt. Soc. Am. A 1990, 7, 383–393. [Google Scholar] [CrossRef]
- Gronle, M.; Lyda, W.; Wilke, M.; Kohler, C.; Osten, W. itom: An open source metrology, automation, and data evaluation software. Appl. Opt. 2014, 53, 2974–2982. [Google Scholar] [CrossRef] [PubMed]
- Feng, D.; Feng, M.Q. Experimental validation of cost-effective vision-based structural health monitoring. Mech. Syst. Signal Process. 2017, 88, 199–211. [Google Scholar] [CrossRef]
| Publisher’s Note: MDPI stays neutral with regard to jurisdictional claims in published maps and institutional affiliations. |
© 2022 by the authors. Licensee MDPI, Basel, Switzerland. This article is an open access article distributed under the terms and conditions of the Creative Commons Attribution (CC BY) license (https://creativecommons.org/licenses/by/4.0/).


