Abstract
Transmission spheres used in interferometry are specified by f-number and source wavelength. In this paper, we explore a broadband variable transmission sphere (BVTS) system based on freeform Alvarez lenses that enables variable operation across a broad range of f-numbers and wavelengths. Potential applications and performance tradeoffs are discussed in comparison to conventional spherical transmission spheres. Simulation results are presented for f/15 to f/80 configurations from visible to long-wave infrared sources in a Fizeau interferometer. Simulation results highlight that spherical, coma, and astigmatism impose limits on surface measurement quality.
1. Introduction
1.1. Transmission Spheres in Fizeau Interferometry
Fizeau interferometry is an industry standard for measuring the form of optical surfaces. This non-contact characterization approach uses high-quality transmission spheres to create high-quality spherical wavefronts designed to match the shapes of nominally spherical test surfaces [1,2,3,4,5,6,7]. Optical path differences due to variations in the shape of the test surface result in constructive and destructive interference fringes on a detector when the wavefront reflected from the test surface is recombined with a reference wavefront. The appropriate f-number transmission sphere must be chosen such that the center of curvature of the surface under test and the focal plane of the transmission sphere are aligned, allowing the test wavefront to match the test surface. The cost of multiple transmission spheres can be significant, and time is required to switch components and re-calibrate if consecutive surfaces under test are not within the same curvature range or have multiple curvatures on one surface, such as aspheres or freeforms [8,9,10,11]. Most transmission spheres are designed to operate at a single design wavelength, and a change in source wavelength requires a change in the transmission sphere used or an alternative transmission sphere, such as an adaptive optical element [1,12]. An alternative to the conventional spherical transmission sphere would be a system capable of variable focal length (and f-number), allowing for the measurement of a broader range of surface curvatures with one system. In this work, we explore a method for replacing a set of fixed transmission spheres with a variable focus element, with a goal of reducing the required inventory of transmission spheres needed in laboratories performing these types of measurements. We find that, particularly for source wavelengths in the infrared, the accuracy of this approach is sufficient that a variable focus element may provide a practical option for optical form measurements in future interferometric systems.
Variable-focal-length optical systems as transmission spheres have been previously proposed and tested for use in Fizeau interferometers [13,14,15,16,17,18]. Bielke designed and tested a variable-focal-length Moirè lens, capable of variation in focal length by equal and opposite rotation of two elements [13,16,17]. Bielke’s system is diffractive and therefore monochromatic, requiring additional systems for other source wavelengths. Others have explored adaptive optics such as liquid lenses to achieve nominally achromatic systems of variable focal length as transmission spheres, but these are narrowly limited in the range of achievable f-numbers and achromatic source ranges [18].
1.2. Alvarez Lenses
In this work, we explore the Alvarez varifocal lens as a single replacement for multiple spherical transmission spheres. Alvarez and Lohmann varifocal lenses are classic examples of systems which vary in focal length through relative lateral shifts of paired freeform surfaces [19,20,21,22,23,24,25,26]. In the simplest case, the freeform surfaces can be described by Equation (1):
where the z-axis is the direction of light propagation and the x-axis is the axis along which the freeform elements are translated in equal and opposite directions with respect to each other. A is the surface sag coefficient and is related to the system’s optical power. Additional polynomial coefficients can be added in optimization steps to reduce surface depth modulation and wavefront aberrations. It has previously been shown that A is related to the focal length, f, of the system at the lateral shift, d, and the index of refraction of the freeform elements, n(λ) [19].
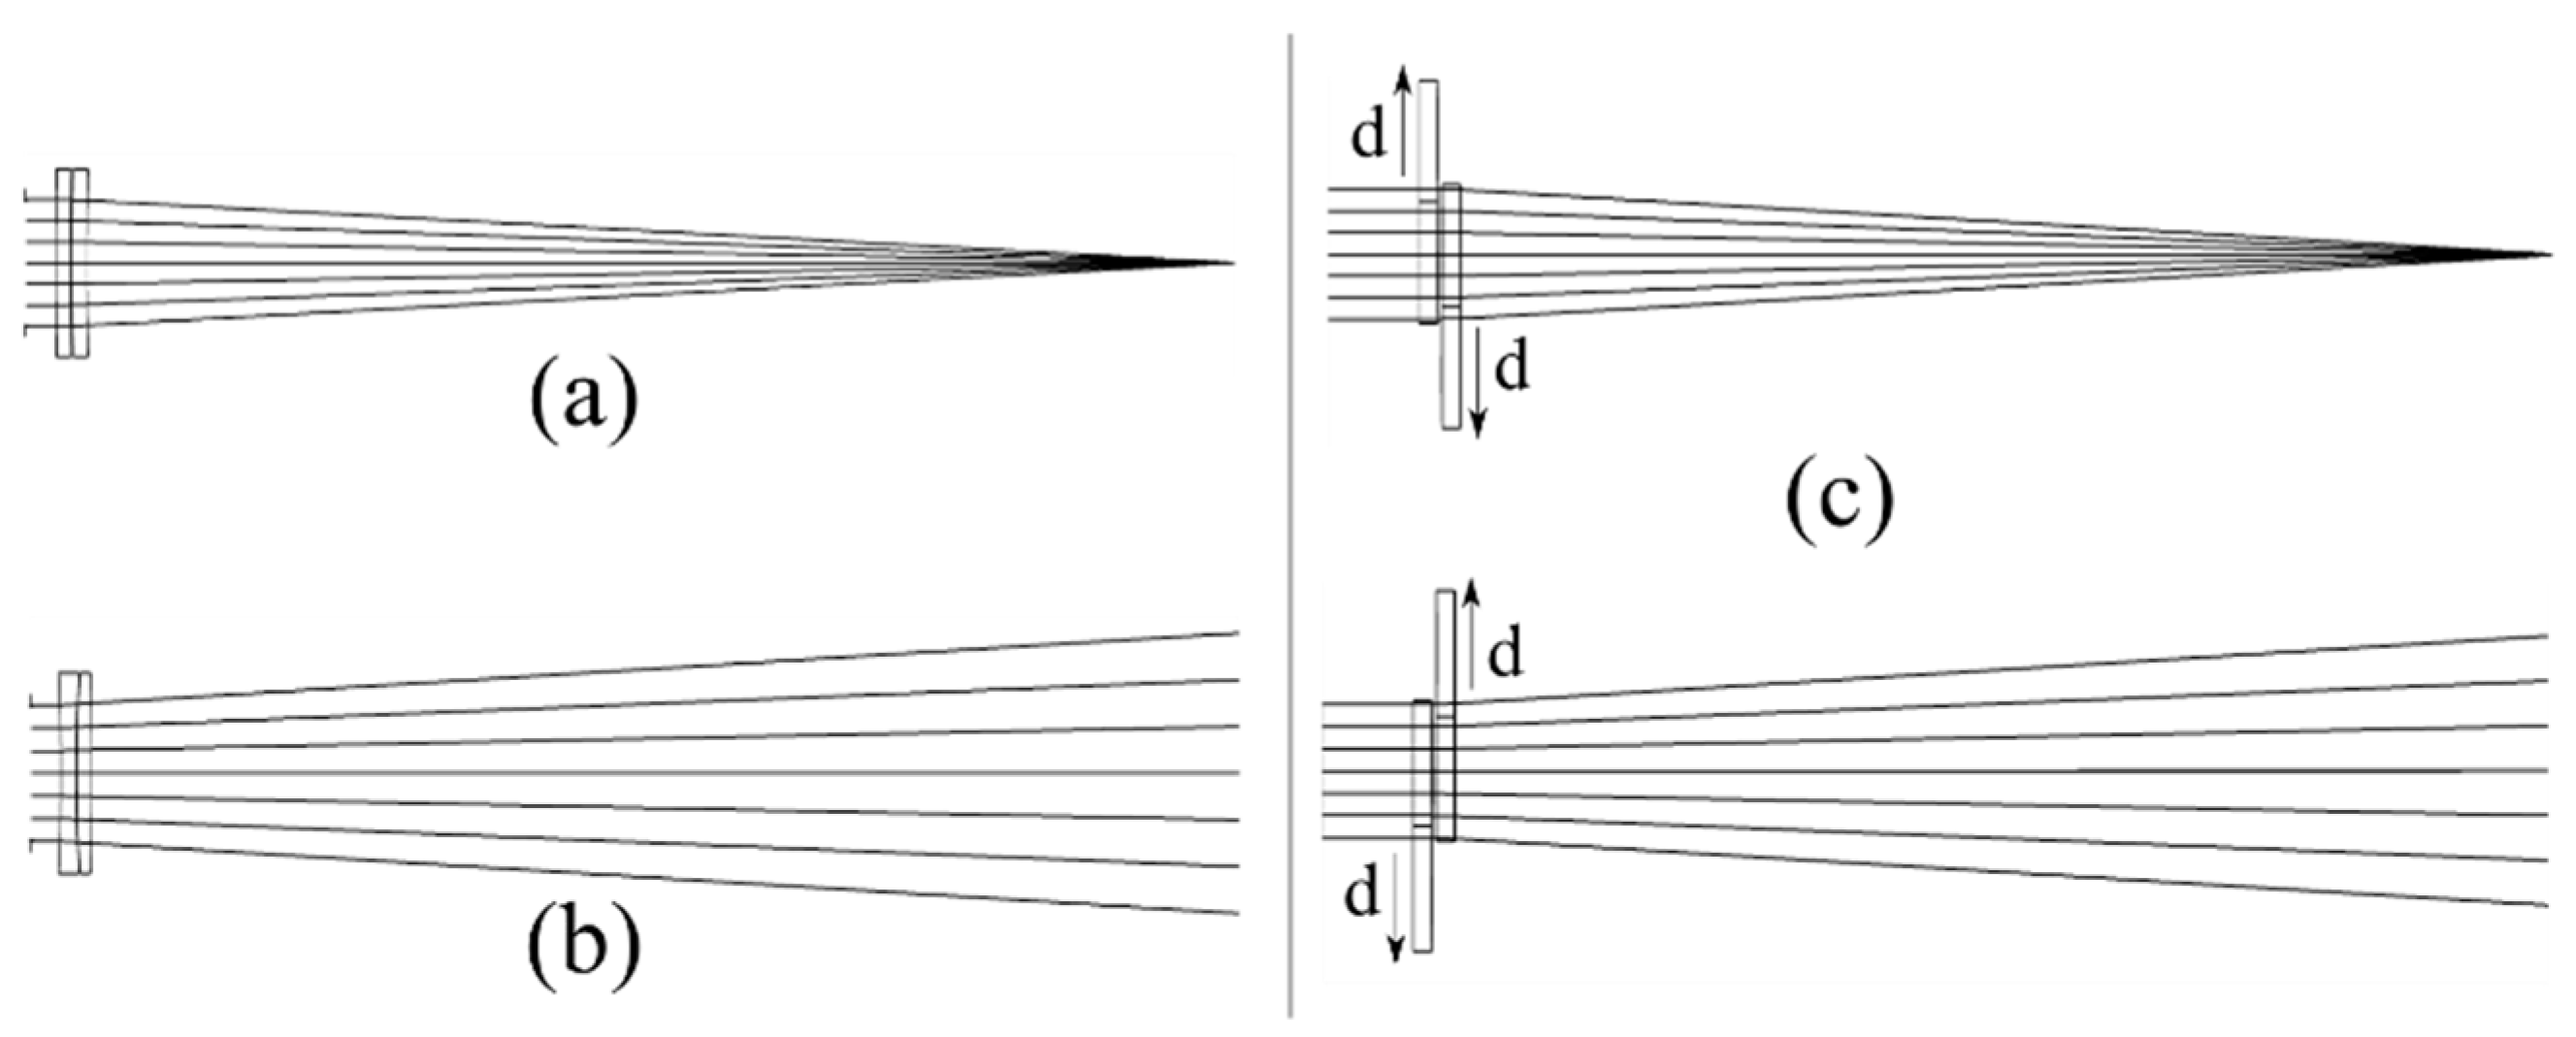
An Alvarez lens can transform a planar wavefront into a range of converging or diverging wavefronts and thus is variable in f-number (Figure 1).
Figure 1.
Converging (a) and diverging (b) transmission spheres, and an Alvarez lens (c) shifted to match (a,b).
In addition to the variable f-number enabled by the Alvarez lens, there is a unique form of broadband functionality. While not inherently achromatic, an Alvarez lens can achieve the same focal lengths for different source wavelengths through small shifts of the freeform elements (Figure 2).

Figure 2.
Broadband functionality: Alvarez lens shifted such that (a) design wavelength is in focus and (b) non-design wavelength is now in focus.
The analytical designs discussed here assume no separation between the freeform surfaces, but in reality a small air gap is needed so that the surfaces do not collide during translation.
Transmission spheres require a reference surface such that the planar wavefront from the source is divided in amplitude [27]. The reference wavefront reflects off the reference surface and propagates to the detector. The remainder of the wavefront incident on the reference surface propagates to the test surface, reflects off the test surface, and propagates back through the transmission sphere to the detector where it interferes with the reference wavefront. Spherical transmission spheres are designed such that the surface closest to the part under test has a radius of curvature (ROC) equal to its focal length, resulting in exit rays normal to the reference surface. A BVTS system has no spherical surfaces to use as reference surfaces, so a separate flat surface of one of the plano-freeform elements of the BVTS can be used.
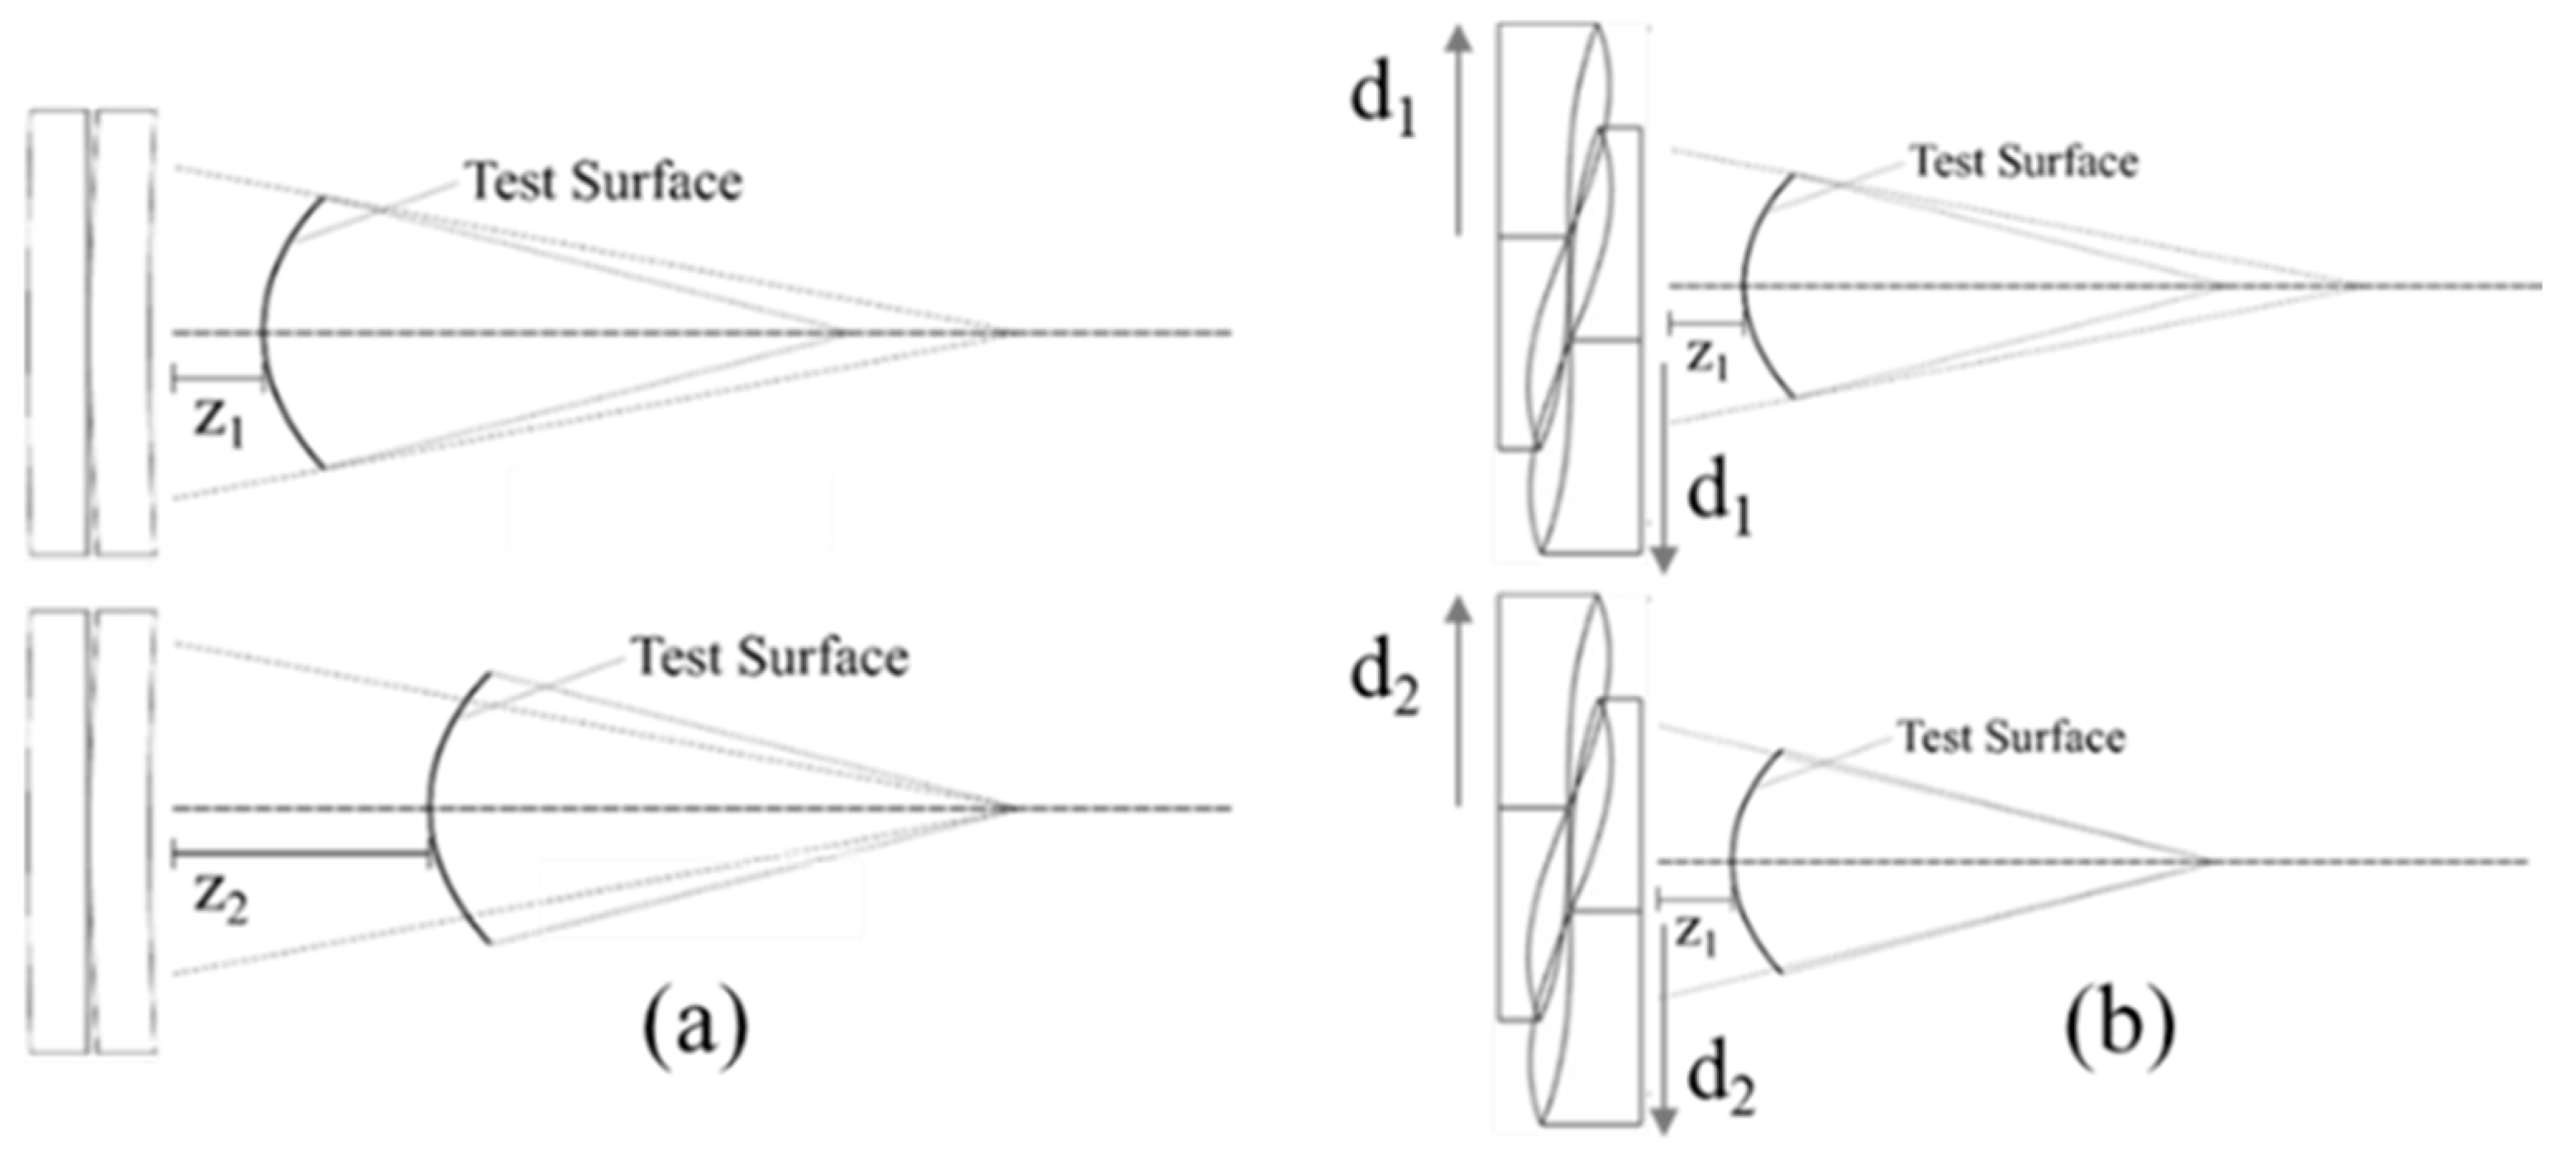
A practical advantage of the BVTS is its ability to generate a null interferogram without significantly shifting the test part along the optical axis. Laterally shifting the BVTS components until the f-number matches the test surface eliminates the need to translate the test surface so that its center of curvature and the transmission sphere focal plane are coincident, which is required when using a fixed f-number transmission sphere (Figure 3). Translating the test part along the optical axis as needed for a fixed f-number transmission sphere results in a loss of surface coverage. This is illustrated in Figure 3 and numerically represented in Table 1 for the example BVTS system described in Section 2.2.
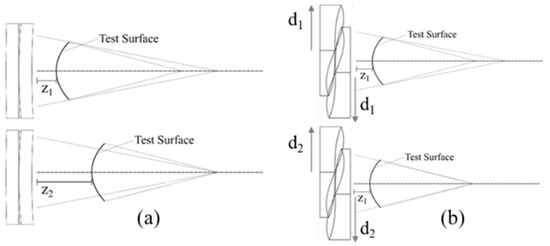
Figure 3.
Translation of: (a) test surface along optical axis or (b) Alvarez elements to align test surface and wavefront.

Table 1.
Optical element locations for wavefront matching surface curvature of first example BVTS system (Section 2.2, 632.8 nm source).
Two BVTS systems were first designed in Zemax OpticStudio™ and then used in VirtualLab Fusion™ to simulate measurements of spherical surfaces in a Fizeau interferometer. In the following section, we present the design process and simulation setup.
2. Design of BVTS Systems
2.1. System Parameters
Zygo’s Transmission Sphere Selection Guide was used to determine general system parameters of BVTS systems designed in Zemax OpticStudio™ [1]. The entrance pupil diameter (EPD) from this set is 101.6 mm. The optical systems in the selection guide range from ±f/15 to ±f/80. For this investigation, visible to long-wave infrared laser wavelengths were chosen (0.6328, 1.55, 3.39, and 10.6 μm). Zinc sulfide (ZnS) was chosen as the optical material for this study because of its transmissivity and relatively low dispersion over the entire band of interest. Other materials could also be considered based on manufacturability and transmissivity across smaller wavelength ranges, for example zinc selenide or germanium for mid- to long-wave IR sources, and fused silica or quartz for ultraviolet to near-IR sources.
Element diameters larger than the EPD are needed to accommodate the EPD and the required lateral shifts of the Alvarez lens. First, light passing through the EPD must have a clear path through the BVTS without reflection off the edge walls when the BVTS system is shifted to the fastest f-number configuration (the largest shift distance). Second, the relation between element shift distance, d, and surface coefficient A in Equation (2) and manufacturing challenges such as surface sag and slope must be considered to reduce the necessary air gap between the two freeform surfaces. For this study, element diameters of 190.5 mm and a maximum shift, d, of 44.45 mm were used, with a 25.4 mm center thickness of each element.
The BVTS system was optimized in Zemax OpticStudio™ with the goals of: (1) a diffraction-limited spot for each f-number and source wavelength combination and (2) less than λ/10 of peak-to-valley (PV) and root-mean-square (RMS) wavefront errors. These initial optimization metrics were chosen based on the performance targets set for conventional transmission spheres in the Zygo Transmission Sphere Section Guide [1]. The Multi-Configuration Editor (MCE) tool was used to optimize the BVTS system. In the MCE tool, system parameters can be duplicated in copies of the first system such that surface parameters are fixed but optical element locations and parameters such as f-number can be different in each configuration. By doing so, we can optimize the BVTS system for each f-number and source wavelength at the same time, achieving the best overall results for the system in each of the BVTS configurations. We now consider two different BVTS designs based on the Alvarez lens geometry.
2.2. BVTS Example 1
To achieve better performance, additional low-order polynomials can be added to the basic freeform surface in Equation (1) and allowed to vary during optimization. The resulting freeform surface coefficients are shown in Table 2.

Table 2.
Surface coefficients for BVTS example 1 (Equation (3)).
Diffraction-limited spot sizes were achieved for the system, except for the visible source at f/15. All slower f-numbers achieved diffraction-limited spot sizes. PV and RMS wavefront results with respect to centroid (with piston and tilt subtracted) are shown in Table 3, indicating acceptable performance at IR wavelengths.

Table 3.
Wavefront errors for BVTS example 1 (Equation (3)).
2.3. BVTS Example 2
Grewe et al. reviewed earlier designs from Smilie to analyze aberrations induced by an Alvarez system [23,25]. They identified a method to compensate for aberrations induced by the freeform surfaces by adding fourth-order polynomial terms to the surface. It is of interest to compare the performance of this system with the BVTS in the previous section. Beginning with the BVTS system from the previous section and following Grewe’s analysis, x4, x2y2, x2, and y4 terms were added (Equation (4)) and the system was optimized for spot size and PV wavefront error as before. Table 4 outlines the resulting surface coefficients for this second BVTS example.

Table 4.
Surface coefficients for BVTS example 2 (Equation (4)).
Diffraction-limited spot sizes were met for the IR sources with more ray distribution symmetry than the original BVTS. Results for the second BVTS example are shown in Table 5. PV and RMS wavefront results (with respect to centroid) are smaller and decrease more consistently for slower f-numbers than the first BVTS design. Further, results at 1.55 μm miss the PV target only for the f/15 configuration. RMS values are negligible for all source wavelengths.

Table 5.
Wavefront errors for BVTS example 2 (Equation (4)).
3. Fizeau Interferometer Simulation
A model for a Fizeau interferometer with 101.6 mm EPD was configured in VirtualLab Fusion™ for characterizing and comparing the performance of a BVTS system and spherical transmission spheres, as shown in Figure 4 [28]. In our model, a collimated source was directed towards a beam-splitter with the transmitted light incident on the transmission sphere and transmitted to the test surface. Light reflected from the transmission sphere and from the test surface was reflected to the detector by the beam-splitter. An aperture was placed on the BVTS planar surface nearest to the test piece to block unwanted light from reflecting through the system at the edges of the BVTS when configured to the maximum lateral shift.

Figure 4.
Diagram view of Fizeau interferometer in VirtualLab Fusion™ for convex and concave surfaces.
All components except for the transmission sphere and test surface were ‘ideal’ components, as defined in VirtualLab Fusion™ to simplify the simulations. At the detector, the reference and test wavefronts interfere with each other, resulting in an interferogram corresponding to variations in the surface with respect to the reference wavefront. Measurements of ideal test surfaces were simulated using both BVTS systems, and the phase data from the interferograms were exported as ASCII files for analysis.
A MATLAB® script was written to import and evaluate phase data from the simulated interferograms obtained in VirtualLab Fusion™. Two phase-unwrapping algorithms were used for comparison to ensure results were reasonably unwrapped [29,30]. Unwrapping the phase and converting to optical path differences results in a ‘height map’ corresponding to deviations between the wavefront and the test surface. Since both the surface parameters and the ideal wavefront parameters are known, we can calculate the ideal height maps, which for our perfect test surfaces and an ideal wavefront should be zero everywhere. We can find the surface measurement errors by taking the difference between the ideal case and our simulation. For this case, our height maps are also maps of the errors in the simulated results. PV and RMS magnitudes of the height maps were calculated and the ZernikeCalc MATLAB® function was used to fit Fringe Zernike polynomials to the height map for aberration analysis [31,32]. A representative visual representation of the conversion from interferogram phase to height data is shown in Figure 5.

Figure 5.
(a) Interferogram phase, (b) unwrapped phase, and (c) phase converted to height map for 1.55 μm source, f/25 configuration, and test surface with 2.5 m radius of curvature.
4. Results and Discussion
4.1. Surface Measurements of Ideal Spherical Surfaces Using BVTS Systems
To characterize the performance of BVTS, surface measurements of perfect spherical surfaces were simulated using the Fizeau interferometer model described previously. The test surfaces were chosen to match commercially available transmission spheres [1]. Specifically, r-numbers (test surface ROC divided by test area diameter) from −81.5 to 80 were evaluated for 100 mm-diameter test surfaces. In order to measure a convex surface, the focal length of the BVTS must be greater than the ROC of the test surface, as illustrated in Figure 3 [1]. Since the BVTS EPD is larger than the test surface diameter, an f/80 configuration (for example) can be used to measure a convex r/80 test surface. However, obtaining a matching wavefront for a concave surface with a diverging wavefront configuration requires a focal length shorter than the test surface ROC, and thus an r/# slower than the f/# of the BVTS. The initial data are reported in terms of height maps and PV error magnitudes. As before, the target is PV ≤ λ/10.
The first four Fringe Zernike polynomial aberration terms (piston (Z1), tip (Z2), tilt (Z3), and defocus (Z4)) are often removed from interferometric measurement results since they can arise from system misalignments. While the results presented here are based on simulation and alignment errors do not contribute, these four aberration terms were noticeable in the results. The presence of these lower-order aberrations is undesirable and indicates the need for an alternative optimization metric.
Since Zernike polynomials are orthogonal, the data can be filtered by subtracting individual terms from the height data obtained from simulation [31,32]. The first four Zernike terms were subtracted from the height data, and the RMS and PV errors of the filtered height data were calculated to isolate higher-order aberrations. RMS errors were consistently sub-nanometer in scale and therefore negligible for both BVTS systems. Table 6 shows the filtered PV results for both systems.

Table 6.
PV wavefront errors for ideal surface measurements (filtered).
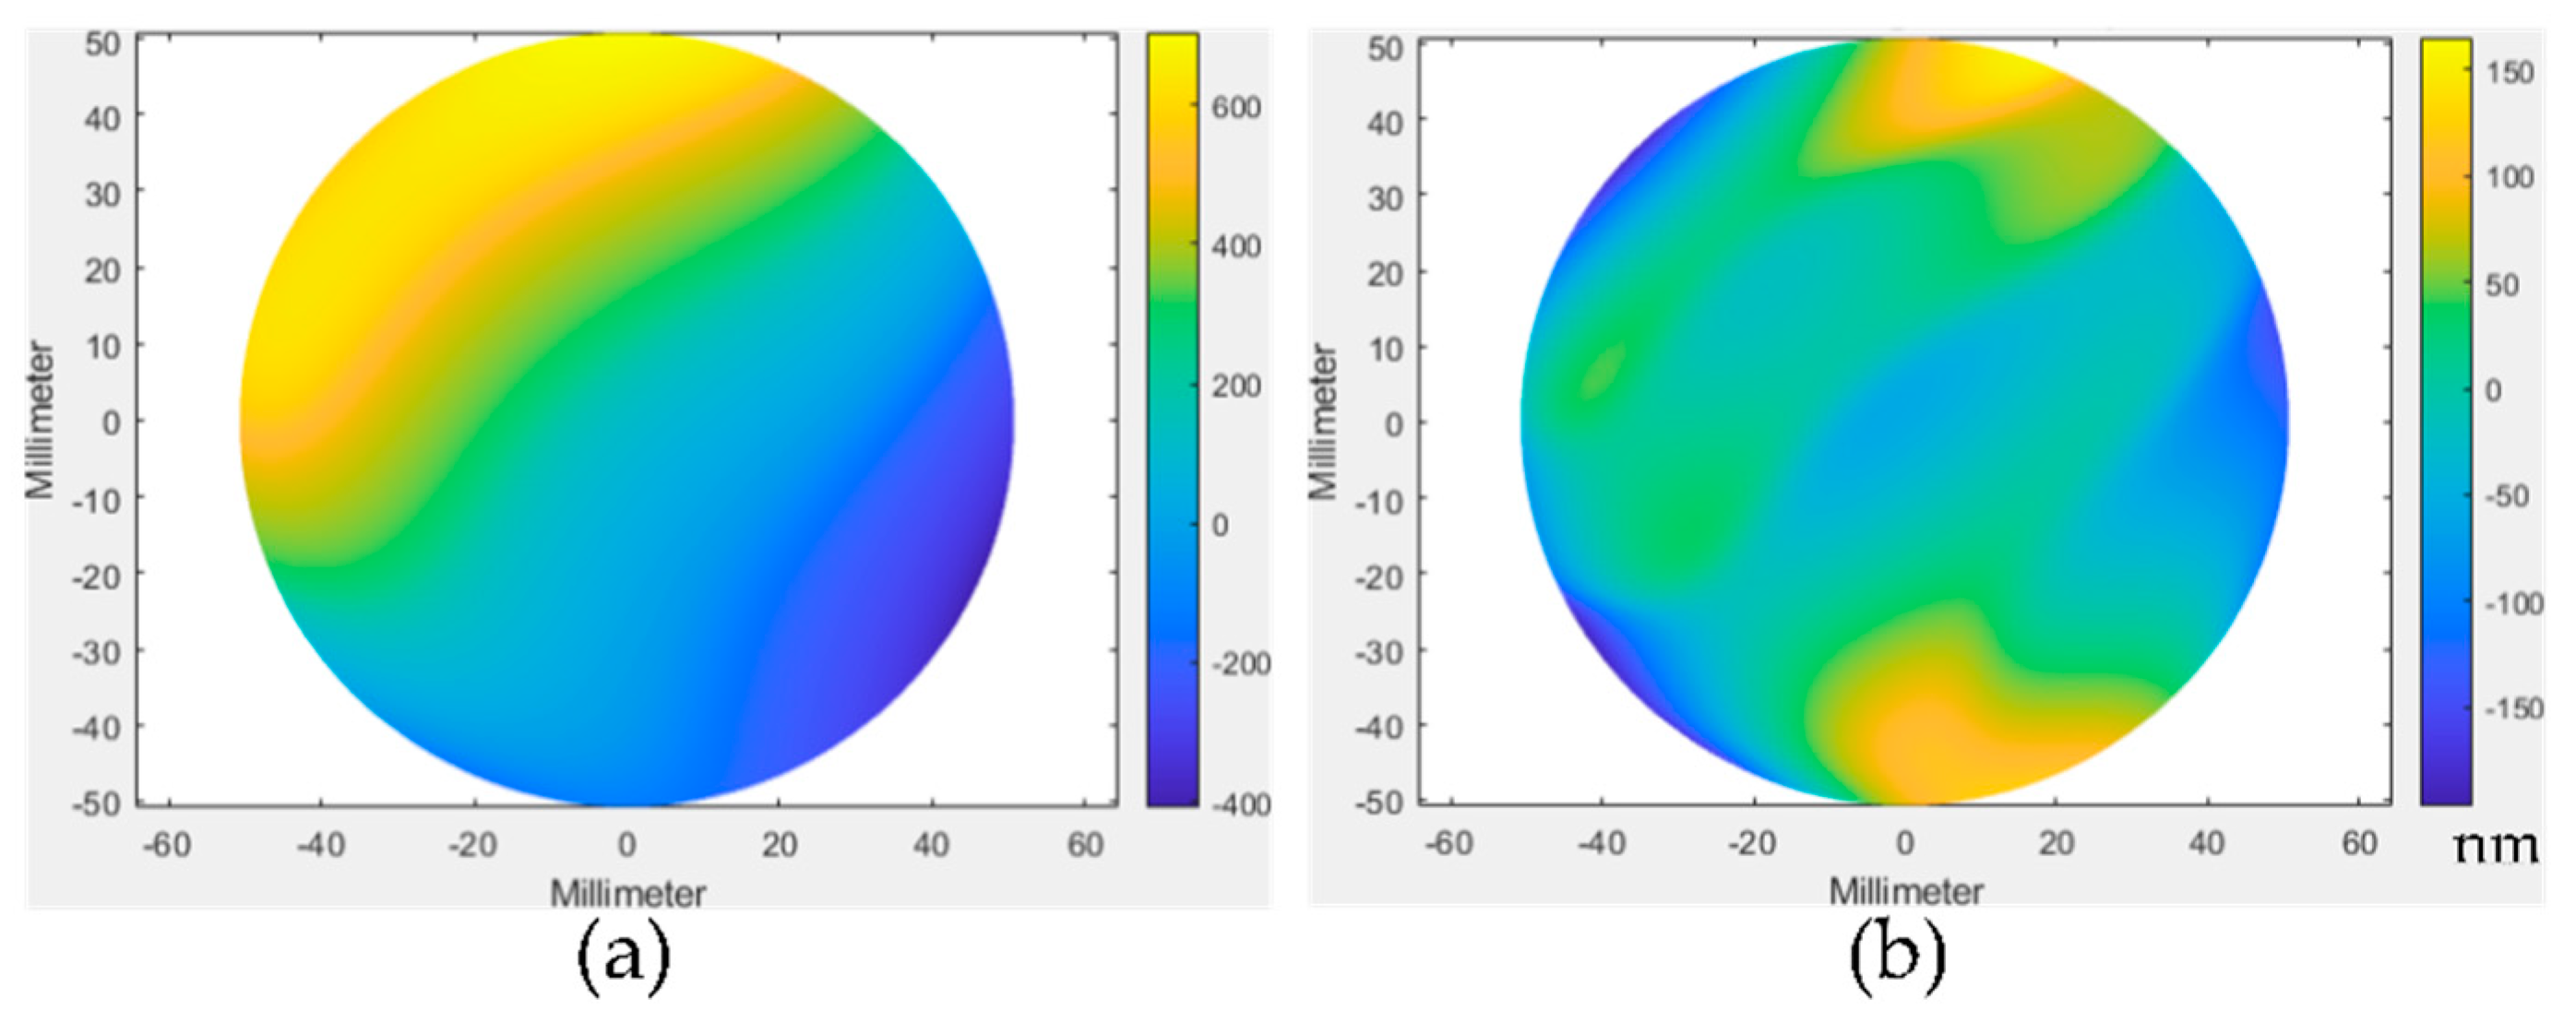
The results for the 0.6328 and 1.55 μm sources did not meet our targets in either BVTS system for any r-number (r/#). The PV error exceeded λ/10 waves of aberration for all r-numbers, although RMS errors were in the order of 10−7 waves or less and were therefore negligible. Further, for both systems, the interferogram data possesses unwanted fringes such that accurate phase unwrapping is challenging. When the lower terms are filtered, artifacts of the fringes can be seen. Representative height data for an r/15 convex surface measurement from the first BVTS system are shown in Figure 6. The second BVTS example system has greater fringe density issues, likely due to a larger tip term (Z2), which can be seen in Figure 5. As the source wavelength increases, the fringe density decreases, as does the magnitude of the surface PV errors and aberrations. It is worth noting here that for the concave surfaces, the second BVTS on average, but not in each instance, has a decreased PV error. The first BVTS has smaller PV errors for positive r-numbers while the second BVTS has smaller PV errors for negative r-numbers. This indicates that the first BVTS will result in better measurements of convex surfaces while the second BVTS will be more suited to measuring concave surfaces. We note that the standard deviation of the PV error between all r-numbers was smaller for the second BVTS, resulting in less variation across all configurations.
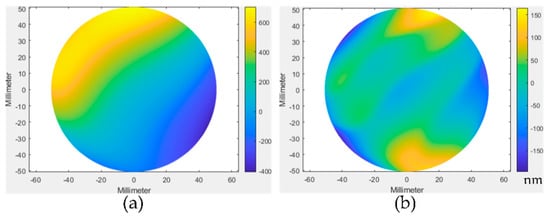
Figure 6.
Example of (a) unfiltered and (b) filtered height data from the first BVTS system (0.6328 μm source wavelength, r/15 surface measurement).
Systems with the 3.39 µm source wavelength met our performance targets for a handful of configurations. RMS error was once again negligible. The unfiltered PV error met the ≤λ/10 target for the r/45 convex and r/81.5 concave surface measurements with the first BVTS example system. When filtered, the first BVTS also met the PV target for the r/35 convex surface measurement. The second BVTS did not meet the PV target for any configuration, filtered or unfiltered, but the PV error was ≤λ/4 for all filtered results except the r/45 convex and r/16 concave measurements. While at this point not fully understood, it should be noted that the Fringe Zernike tip term (Z2) for the second BVTS was exceptionally large (λ/10 to 3λ/5). This term appeared to have a significant impact on the phase unwrapping but requires further study to determine the exact impact and its possible correction.
The 10.6 μm source wavelength configuration achieved the ≤λ/10 PV target for all filtered configurations of both BVTS systems except the r/16 concave surface measurements with the first BVTS system. RMS error was once again negligible. The unfiltered case for the second BVTS did not meet the ≤λ/10 PV target for the r/25 and r/15 convex surface measurements and the r/36, r/26, and r/16 concave surface measurements. Despite aberrations, the 10.6 μm source wavelength configuration afforded the most consistent and capable results for surface measurements. The Z2 term also dominated the surface measurement error of the second BVTS but with far less impact due to smaller amplitudes (λ/50 to λ/6).
4.2. Higher-Order Surface Aberrations
Aberrations that remained in the filtered data illustrate differences between the first and second BVTS systems. In the Fringe Zernike polynomial ordering, terms Z5–Z9 correspond to Vertical Astigmatism (Z5), Oblique Astigmatism (Z6), Horizontal Coma (Z7), Vertical Coma (Z8), and Primary Spherical (Z9) terms. For the first BVTS system, these aberrations showed no consistent trend for r-number (Table 7). With respect to source wavelength, the overall aberration magnitudes decreased with an increase in source wavelength, as expected. The inconsistencies here may be due to fringe density issues due to the Zernike tip term present or due to inherent aberrations of the BVTS systems and doubling of these aberrations upon the test wavefront’s second pass through the BVTS elements.

Table 7.
Magnitude of higher-order aberrations for BVTS example 1 (waves/1000).
Table 8 presents the same aberrations as Table 7 for the second BVTS system. For this BVTS system, these aberrations also showed no consistent trend for r-number but did demonstrate a significant reduction, if not elimination, of Z6 and Z8. Undesirably, there was a significant increase in the other three aberrations compared to the first BVTS design. The source of this increase is not clear, but as noted in the previous section, the tip term for this system was significantly higher than in the first BVTS system and may have skewed the phase unwrapping. This indicates the need for either a different optimization method of the BVTS to reduce the tip term or a method to counteract the variable tip term present, or both. The overall aberration magnitudes also decreased with the increase in source wavelength.

Table 8.
Magnitude of higher-order aberrations for BVTS example 2 (waves/1000).
5. Conclusions
The BVTS systems presented here may be able to replace multiple conventional transmission spheres with one Alvarez lens-based system. The results with the smallest errors in the simulated height maps were seen with IR source wavelengths in the range of f/15 to f/80. To put this in context, even if only the 10.6 µm source wavelength is considered, ten conventional transmission spheres could be replaced by a single BVTS system [1]. Additionally, the BVTS system would be functional for additional f-numbers between the conventional values. In addition to potentially replacing tens of conventional transmission spheres, a single BVTS system could possibly reduce material costs and the system alignment and calibration time needed for changing out transmission spheres. The extents of these benefits are yet to be quantified as a BVTS will include manufacturing costs and requires precision actuators for translation of the freeform elements. Applications which do not require high-precision surface measurements and can use a longer source wavelength may be well-served by the flexibility of the wavefront curvature of the BVTS systems presented here. A refined BVTS system capable of a better performance at shorter wavelengths would greatly expand the applicability of the BVTS system concept.
BVTS systems as shown do not yet replace high-precision transmission spheres when tight tolerances are required. It will be important to further investigate the sources and impacts of the residual aberrations seen in the simulated surface measurements in BVTS systems. It may be possible to improve performance through consideration of alternative optimization metrics and methods, use of freeform surfaces with higher-order polynomials, or use of additional optical components to increase design freedoms and refined phase unwrapping.
Going forward, the source and impact of the observed errors requires further study, especially in relation to limits they may present when used to measure non-ideal surfaces. Characterizing the retrace error for ideal and aberrated surfaces would assist in further understanding of the BVTS system. Reducing the range of allowed source wavelengths and/or f-numbers would allow for alternative materials and systems which may be able to achieve improved measurement accuracy. It also remains to be seen how well BVTS systems can maintain their performance when experimentally implemented. Form and mid-spatial frequency errors resulting from freeform manufacturing processes will likely decrease performance [8]. Alignment errors will also need to be understood for a laterally shifting system in a real Fizeau interferometer.
Author Contributions
Conceptualization, J.K. and T.J.S.; methodology, J.K. and T.J.S.; formal analysis, J.K.; investigation, J.K.; writing—original draft preparation, J.K.; writing—review and editing, G.D.B. and T.J.S.; supervision, T.J.S. All authors have read and agreed to the published version of the manuscript.
Funding
This research received no external funding.
Acknowledgments
The authors would like to acknowledge useful discussions with Sara Moein and Chris Evans from the University of North Carolina at Charlotte. J.K. would like to acknowledge the support of the DoD SMART Scholarship Program. This work is synergistic with the NSF I/UCRC Center for Freeform Optics (IIP-1822049 and IIP-1822026).
Conflicts of Interest
The authors declare no conflict of interest.
References
- ZYGO. ZYGO Transmission Sphere Selection Guide; ZYGO: Middlefield, CT, USA, 2014. [Google Scholar]
- Yang, P.; Xu, J.; Zhu, J.; Hippler, S. Transmission sphere calibration and its current limits. In Proceedings of the SPIE 8082, Optical Measurement Systems for Industrial Inspection VII, Munich, Germany, 23–26 May 2011; p. 80822L. [Google Scholar] [CrossRef]
- Gao, Z.; Chen, L.; Zhou, S.; Zhu, R. Computer-aided alignment for a reference transmission sphere of an interferometer. Opt. Eng. 2004, 43, 69–74. [Google Scholar] [CrossRef]
- Peng, W.-J.; Ho, C.-F.; Lin, W.-L.; Yu, Z.-R.; Huang, C.-Y.; Hsu, W.-Y. Design and tolerance analysis of a transmission sphere by interferometer model. In Proceedings of the SPIE 9582, Optical System Alignment, Tolerancing, and Verification IX, San Diego, CA, USA, 9 August 2015; p. 958208. [Google Scholar] [CrossRef]
- Peng, W.-J.; Ho, C.-F.; Lin, W.-L.; Yu, Z.-R.; Huang, C.-Y.; Kuo, C.-H.; Hsu, W.-Y. Design, tolerance analysis, fabrication, and testing of a 6-in. dual-wavelength transmission sphere for a Fizeau interferometer. Opt. Eng. 2017, 56, 035105. [Google Scholar] [CrossRef]
- Peng, W.-J.; Ho, C.-F.; Yu, Z.-R.; Huang, C.-Y.; Kuo, C.-H.; Hsu, W.-Y. Mounting of reference surface for a transmission sphere. In Proceedings of the SPIE 9684, 8th International Symposium on Advanced Optical Manufacturing and Testing Technologies: Optical Test, Measurement Technology, and Equipment, Suzhou, China, 27 September 2016; p. 96840G. [Google Scholar] [CrossRef]
- Pinto, J. Transmission spheres more than just a reference surface! In Proceedings of the SPIE 10314, Optifab 2003: Technical Digest, Rochester, NY, USA, 19–22 May 2003; p. 1031415. [Google Scholar] [CrossRef]
- Rolland, J.P.; Davies, M.A.; Suleski, T.J.; Evans, C.; Bauer, A.; Lambropoulos, J.C.; Falaggis, K. Freeform optics for imaging. Optica 2021, 8, 161–176. [Google Scholar] [CrossRef]
- Dumas, P. Enabling Higher Precision Freeform Surfaces though Developments in Magnetorheological Finishing (MRF) and Subaperture Stitching Interferometry (SSI). In Proceedings of the Renewable Energy and the Environment, Tucson, AZ, USA, 3 November 2013; p. FT3B.1. [Google Scholar]
- Murphy, P.; Supranowitz, C. Freeform testability considerations for subaperture stitching interferometry. In Proceedings of the SPIE 11175, Optifab, Rochester, NY, USA, 15 November 2019; p. 111750Z. [Google Scholar] [CrossRef]
- Supranowitz, C.; Lormeau, J.-P.; Maloney, C.; Murphy, P.; Dumas, P. Freeform metrology using subaperture stitching interferometry. In Proceedings of the SPIE 10151 Optics and Measurement International Conference, Liberec, Czech Republic, 11 November 2016; p. 101510D. [Google Scholar] [CrossRef]
- Wang, Y.; Zhang, Q.; Chen, Q.; Xu, S.; Han, S. Design of multi-wavelength achromatic transmission sphere based on zoom principle. In Proceedings of the SPIE 11552, Optical Metrology and Inspection for Industrial Applications VII, Online, 10 October 2020; p. 1155217. [Google Scholar] [CrossRef]
- Bielke, A.; Baer, G.; Pruss, C.; Osten, W. Model-based calibration of an interferometric setup with a diffractive zoom-lens. In Proceedings of the SPIE 9618, 2015 International Conference on Optical Instruments and Technology: Optical Systems and Modern Optoelectronic Instruments, Beijing, China, 5 August 2015; p. 961807. [Google Scholar] [CrossRef]
- Ohsaki, Y.; Suzuki, A.; Saitoh, K. Interferometer and Interferance Measurement Method. U.S. Patent 6,842,255, 11 January 2005. [Google Scholar]
- Suzuki, A.; Sekine, Y. Interferometer and Interferance Measurement Method. U.S. Patent 7,106,455, 12 September 2006. [Google Scholar]
- Bielke, A.; Pruss, C.; Osten, W. Design of a variable diffractive zoom lens for interferometric purposes. Opt. Eng. 2017, 56, 14104. [Google Scholar] [CrossRef]
- Bielke, A.; Pruss, C.; Osten, W. Experimental demonstration of a diffractive zoom-lens for an interferometric setup. In Proceedings of the Optical Fabrication and Testing Classical Optics, Kohala Coast, HI, USA, 22–26 June 2014; p. OTu4A. 3. [Google Scholar]
- Reichelt, S.; Zappe, H. Design of spherically corrected, achromatic variable-focus liquid lenses. Opt. Express 2007, 15, 14146–14154. [Google Scholar] [CrossRef] [PubMed]
- Alvarez, L.W. Two-Element Variable-Power Spherical Lens. U.S. Patent 3,305,294, 21 February 1967. [Google Scholar]
- Babington, J. Alvarez lens systems: Theory and applications. In Proceedings of the SPIE 9626, Optical Systems Design 2015: Optical Design and Engineering VI, Jena, Germany, 23 September 2015; p. 962615. [Google Scholar] [CrossRef]
- Barbero, S. The Alvarez and Lohmann refractive lenses revisited. Opt. Express 2009, 17, 9376–9390. [Google Scholar] [CrossRef] [PubMed]
- Barbero, S.; Rubinstein, J. Adjustable-focus lenses based on the Alvarez principle. J. Opt. 2011, 13, 125705. [Google Scholar] [CrossRef][Green Version]
- Grewe, A.; Hillenbrand, M.; Sinzinger, S. Aberration analysis of optimized Alvarez–Lohmann lenses. Appl. Opt. 2014, 53, 7498–7506. [Google Scholar] [CrossRef] [PubMed]
- Roth, E.; Scheibe, H.; Koehler, T.; Schindler, C. Building Challenging Optical Systems with Alvarez Lenses. In Proceedings of the Optical Design and Fabrication 2019 (Freeform, OFT), Washington, DC, USA, 10–12 June 2019; p. FW4B.6. [Google Scholar]
- Smilie, P.J.; Suleski, T.J.; Dutterer, B.; Lineberger, J.L.; Davies, M.A. Design and characterization of an infrared Alvarez lens. Opt. Eng. 2012, 51, 13006. [Google Scholar] [CrossRef]
- Lohmann, A.W. A new class of varifocal lenses. Appl. Opt. 1970, 9, 1669–1671. [Google Scholar] [CrossRef]
- Burge, J.H. Fizeau interferometry for large convex surfaces. In Proceedings of the SPIE 2536, Optical Manufacturing and Testing, San Diego, CA, USA, 8 September 1995; pp. 127–138. [Google Scholar] [CrossRef]
- Fizeau Interferometer for Optical Testing. Available online: https://www.lighttrans.com/use-cases/application-use-cases/fizeau-interferometer-for-optical-testing.html (accessed on 24 July 2021).
- Herráez, M.A.; Burton, D.R.; Lalor, M.J.; Gdeisat, M.A. Fast two-dimensional phase-unwrapping algorithm based on sorting by reliability following a noncontinuous path. Appl. Opt. 2002, 41, 7437–7444. [Google Scholar] [CrossRef]
- Zhao, Z.; Zhang, H.; Xiao, Z.; Du, H.; Zhuang, Y.; Fan, C.; Zhao, H. Robust 2D phase unwrapping algorithm based on the transport of intensity equation. Meas. Sci. Technol. 2018, 30, 015201. [Google Scholar] [CrossRef]
- Gray, R. ZernikeCalc, MATLAB Central File Exchange; MathWorks: Natick, MA, USA, 2021. [Google Scholar]
- Lakshminarayanan, V.; Fleck, A. Zernike polynomials: A guide. J. Mod. Opt. 2011, 58, 1678. [Google Scholar] [CrossRef]
Publisher’s Note: MDPI stays neutral with regard to jurisdictional claims in published maps and institutional affiliations. |
© 2022 by the authors. Licensee MDPI, Basel, Switzerland. This article is an open access article distributed under the terms and conditions of the Creative Commons Attribution (CC BY) license (https://creativecommons.org/licenses/by/4.0/).

