Article

Impact Testing of AISI 1010 Low-Carbon Steel Spot-Welded Joints

by
Ralph Kenneth Castillo
1,
Neamul Khandoker
2,*,
Sumaiya Islam
3 and
Abdul Md Mazid
2
1
Department of Mechanical Engineering, Faculty of Engineering and Science, Curtin University, CDT 250, Miri 98009, Malaysia
2
School of Engineering and Technology, Central Queensland University, Melbourne Campus, 120 Spencer Street, Melbourne, VIC 3000, Australia
3
Higher Education College, Chisholm Institute, 121 Stud Road, Dandenong, VIC 3175, Australia
*
Author to whom correspondence should be addressed.
Appl. Mech. 2025, 6(4), 79; https://doi.org/10.3390/applmech6040079 (registering DOI)
Submission received: 16 June 2025 / Revised: 15 September 2025 / Accepted: 17 October 2025 / Published: 24 October 2025

Abstract

Resistance spot welding is a process used to join overlapping metals using pressure and electric current, commonly applied in the automotive industry for joining car bodies. This study aimed to understand the mechanical performance of spot welds under dynamic impact conditions. Various welding schedules were tested to observe the effects of different welding currents and times on the impact energy absorbed by spot welds. The results showed that the impact energy absorbed ranged from 26 J to 98 J, with higher welding currents and times generally increasing the impact energy due to more heat input. However, excessive welding parameters led to decreased impact energy. Statistical analysis and modeling revealed that optimal impact energy is achieved with a welding current of 5 kA and welding time of 6.728 cycles.

1. Introduction

Resistance spot welding (RSW), or simply spot welding, is the process of welding two or more overlapping metal pieces, commonly sheet metal, at a certain location indicated by a small point with the use of pressure and electric current. In many industries today, spot welding is used as the main method of joining two metal components. The most notable of these industries is the automotive industry, where 2000 to 5000 spot welds are used to join several components that form a car body [1]. The reason why the spot-welding method is used by several industries is because it is very simple, highly reliable and easy to automate. Spot welding is also a welding method with low cost while having a high production rate. Furthermore, the process is autogenous, which means that it does not require filler metals unlike other welding processes.
For all materials joined using spot welding, energy during a crash is transferred through the automobile structure. Spot welds also function as the initiation sites of folds, which allow impact energy to be mitigated. This means that the crashworthiness of automobiles, which is defined as the capability of a vehicle structure to offer the necessary protection to the passengers during a crash [2], is heavily dependent on the mechanical performance and the behavior of the spot welds joining the car structure. Furthermore, it has been determined that the failure joints joining the vehicle structure is one of the most common failures observed during car crashes [2]. Therefore, the mechanical performance of resistance spot welds during a crash sequence needs to be understood so that vehicles can be made stronger and safer. However, this usually requires a full-scale car crash test, which is very complicated and expensive. Impact testing, on the other hand, offers a simple method of understanding the dynamic behavior of spot welds.
The microstructures of spot welds were well studied by Darwish and Ghanya [3], as shown in Figure 1. It shows different grain regions as unaffected, transition, refined, coarsened and fused zones. The unaffected zone corresponds to the typical grain shapes of the parent low-carbon steel sheet. It has not been heated enough to reach the critical zone. The transient zone faced incomplete recrystallization transformation temperatures. The refined zone with austenite transforms to ferrite and pearlite. At higher temperatures and at the adjacent zone to melting, coarse austenite is produced and subsequently converted to a coarse structure of a coarsened zone. At temperatures above the solidus, real melting of the parent metal takes place and resolidifies by quick epitaxially, which results in perfect unification.
There are many studies available on the mechanical behaviors of spot weld joints [4,5,6]. But they are not a true portrayal of the loading conditions in service. Recently, Ákos Meilinger et al. [7] came up with a new analysis method and designed new testing equipment for impact bending, which gave force time result to characterize the resistance of spot-welded joints in dynamic conditions. They tested DP600 and DP800 steels against the spot-welding process parameters. Olakunle Timothy Betiku et al. [8] recently studied the dynamic behavior of spot weld joints. Their testing technique compares the mechanical properties of a conventional and in situ post-weld heat treatment schedule. But no correlations between energy absorption and weld failure modes were indicated in these studies.
In this study, impact testing will be performed on spot-welded specimens to determine the effects of spot-welding process parameters, (namely the welding current and welding time), and spot weld failure modes on the impact energy. A novel specimen design will be presented so that a conventional impact testing machine can be used for experimentation. Analysis will then be performed on the experimental data using Response Surface Methodology to determine the relationship between the welding current and the welding time, as well as to create a prediction model. Following that, optimization will be performed to determine the best combination of parameters that yields the spot weld with the best impact energy absorption capability.

2. Experimental Procedures

2.1. Material and Specimen Design

AISI 1010 low-carbon steel was used for manufacturing specimens with a thickness of 1.0 mm. The thickness of the steel sheet was measured with vernier calipers. This grade of low-carbon steel is frequently used in the automobile industry for parts such as car body panels, fenders and transmission covers [9]. The material properties of AISI 1010 steel are presented in Table 1 and Table 2 below. The specimens had distinctive designs enabling them to perform impact testing; a sample photo of the specimen is shown in Figure 2b. The specimen was then manufactured following the dimensions of the design shown in Figure 2a. The resistance spot welding of the specimens was performed using a conventional spot-welding machine, which provided a range of 1–5 kA for the welding current, 3–9 cycles for the welding time and a maximum electrode force of 4120 N.

2.2. Welding Procedure

For this study, the welding current and the welding time were adjusted to investigate their effects on the spot weld and its dynamic performance. To do this, weld schedules were created so that different combinations of the welding current and welding time could be formed following the set of process parameters used in Table 3. The specimens were then welded according to these welding schedules. Since only the welding current and welding time were investigated, the electrode force was kept constant at around 4 kN during welding. The welding schedules are listed in Table 1. After welding, the nugget diameter was measured from the outer surfaces using vernier calipers.

2.3. Impact Testing

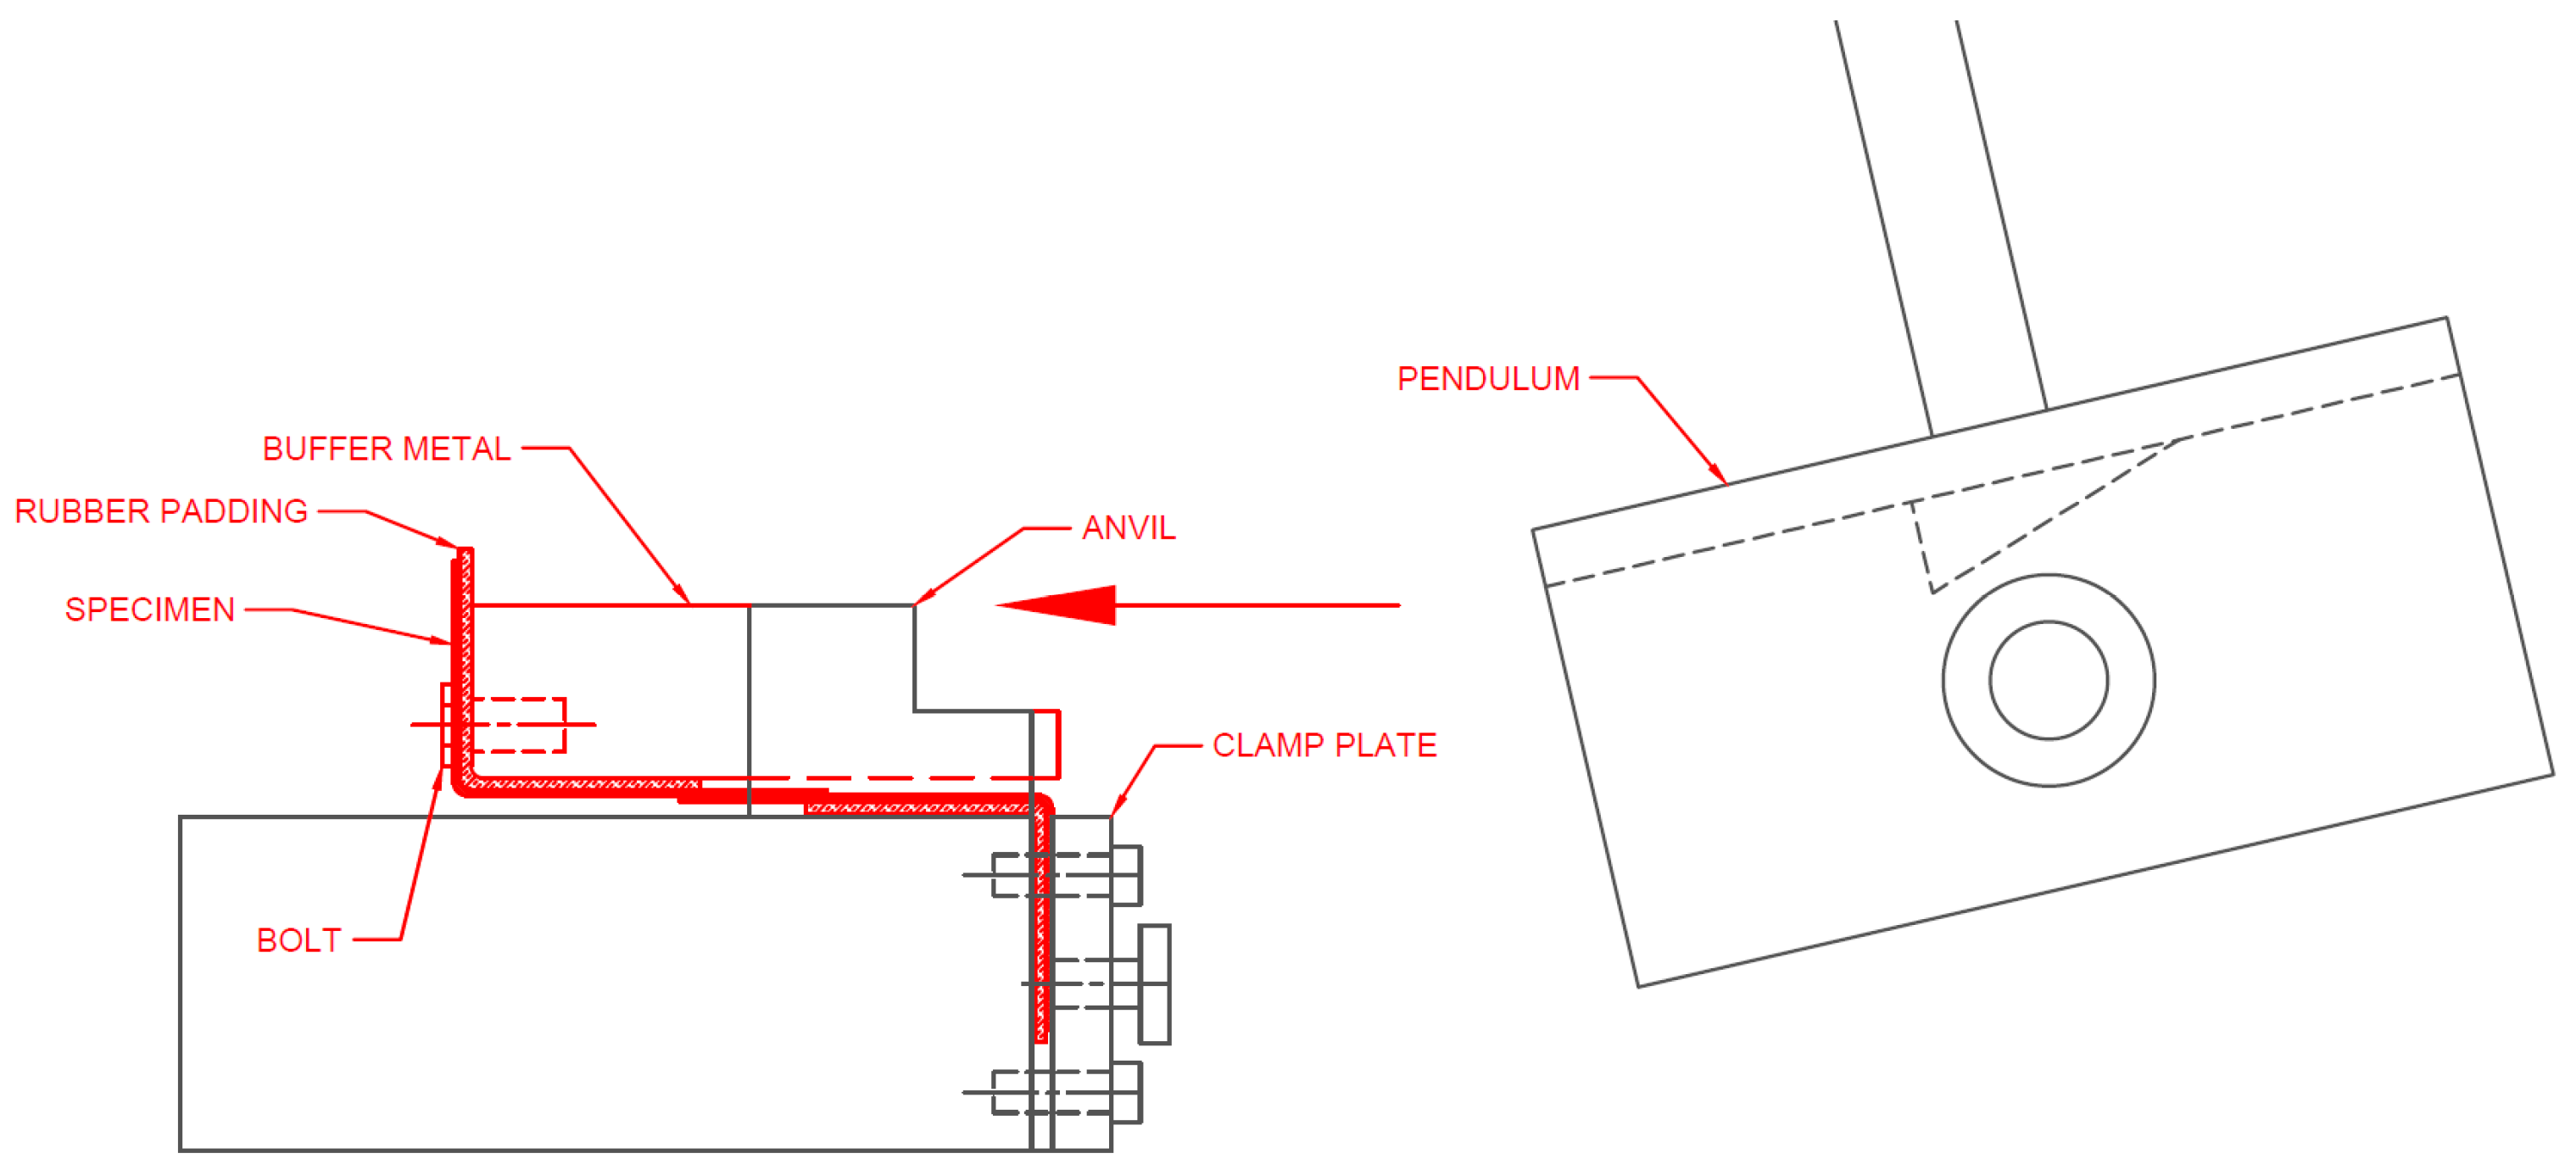
After performing the spot welding, impact testing was performed on the specimens using the MAT21 Universal Pendulum Impact Tester (pendulum mass 21.675 kg, striking velocity 5.35 m/s), as shown in Figure 3. This was set to the configuration for Charpy testing. A machined block of steel was attached to the specimen to allow the energy from the pendulum to be transferred to the specimen during testing. For each set of welding current and welding time, three samples were subjected to impact testing, and the impact energy values were recorded after each specimen was tested. The results from the impact tests as well as their corresponding parameters were then put into the statistical software, and analysis was performed using Response Surface Methodology. The analysis of variance was then used to determine which of the two spot-welding parameters were more significant. Then, a model was formulated to represent the experimental data and predict the impact energy that would be the result of a combination of welding current and welding time. Optimization was then performed to determine the values of the process parameters that would yield the highest impact energy.

3. Results and Discussion

3.1. Impact Test Results

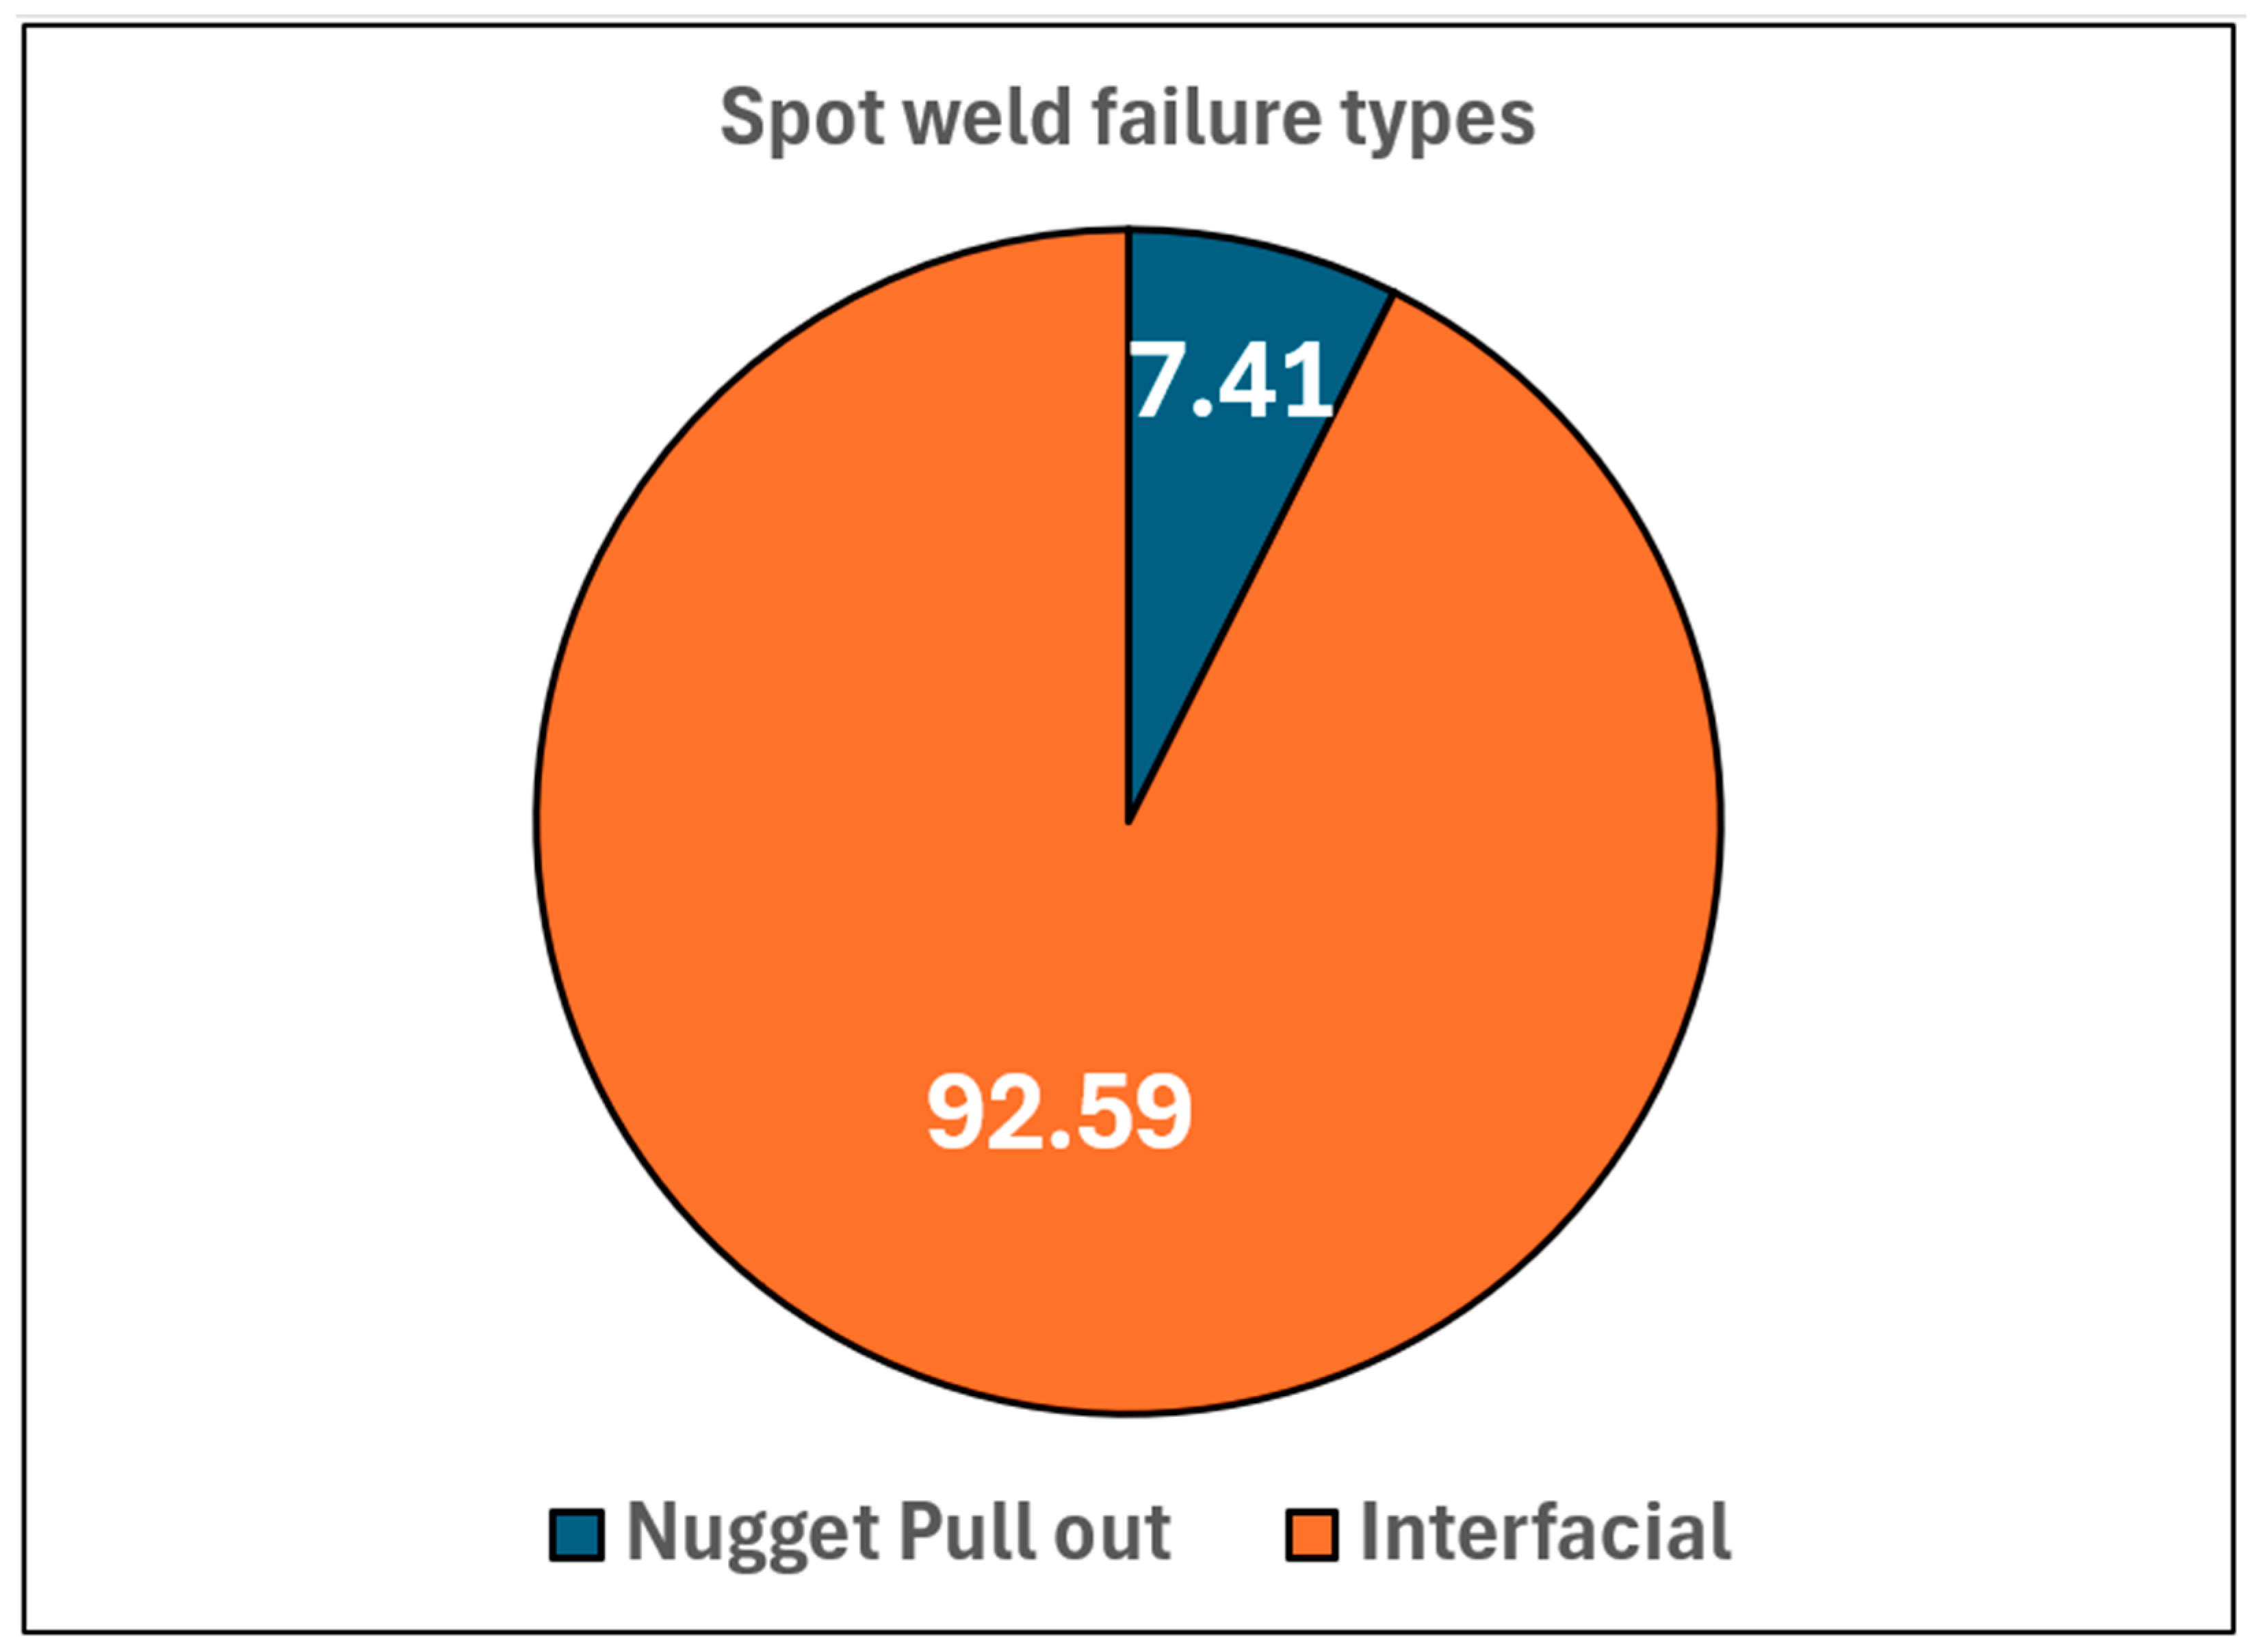
Table 2 shows the impact energy values obtained during the impact testing as well as the failure mode of the spot weld. From this table, the minimum value for the impact energy absorbed was 26 J and obtained from the set using the lowest welding current (at 3 kA) and welding time (at four cycles). The highest results were recorded for a welding current of 5 kA and welding time of seven cycles, where the impact energy absorbed was 98 J. It can also be seen from this table that almost all of the specimens failed via interfacial failure (93% in Figure 4 Pie graph) and only two specimens failed vial pullout failure (7% in Figure 4 Pie graph).
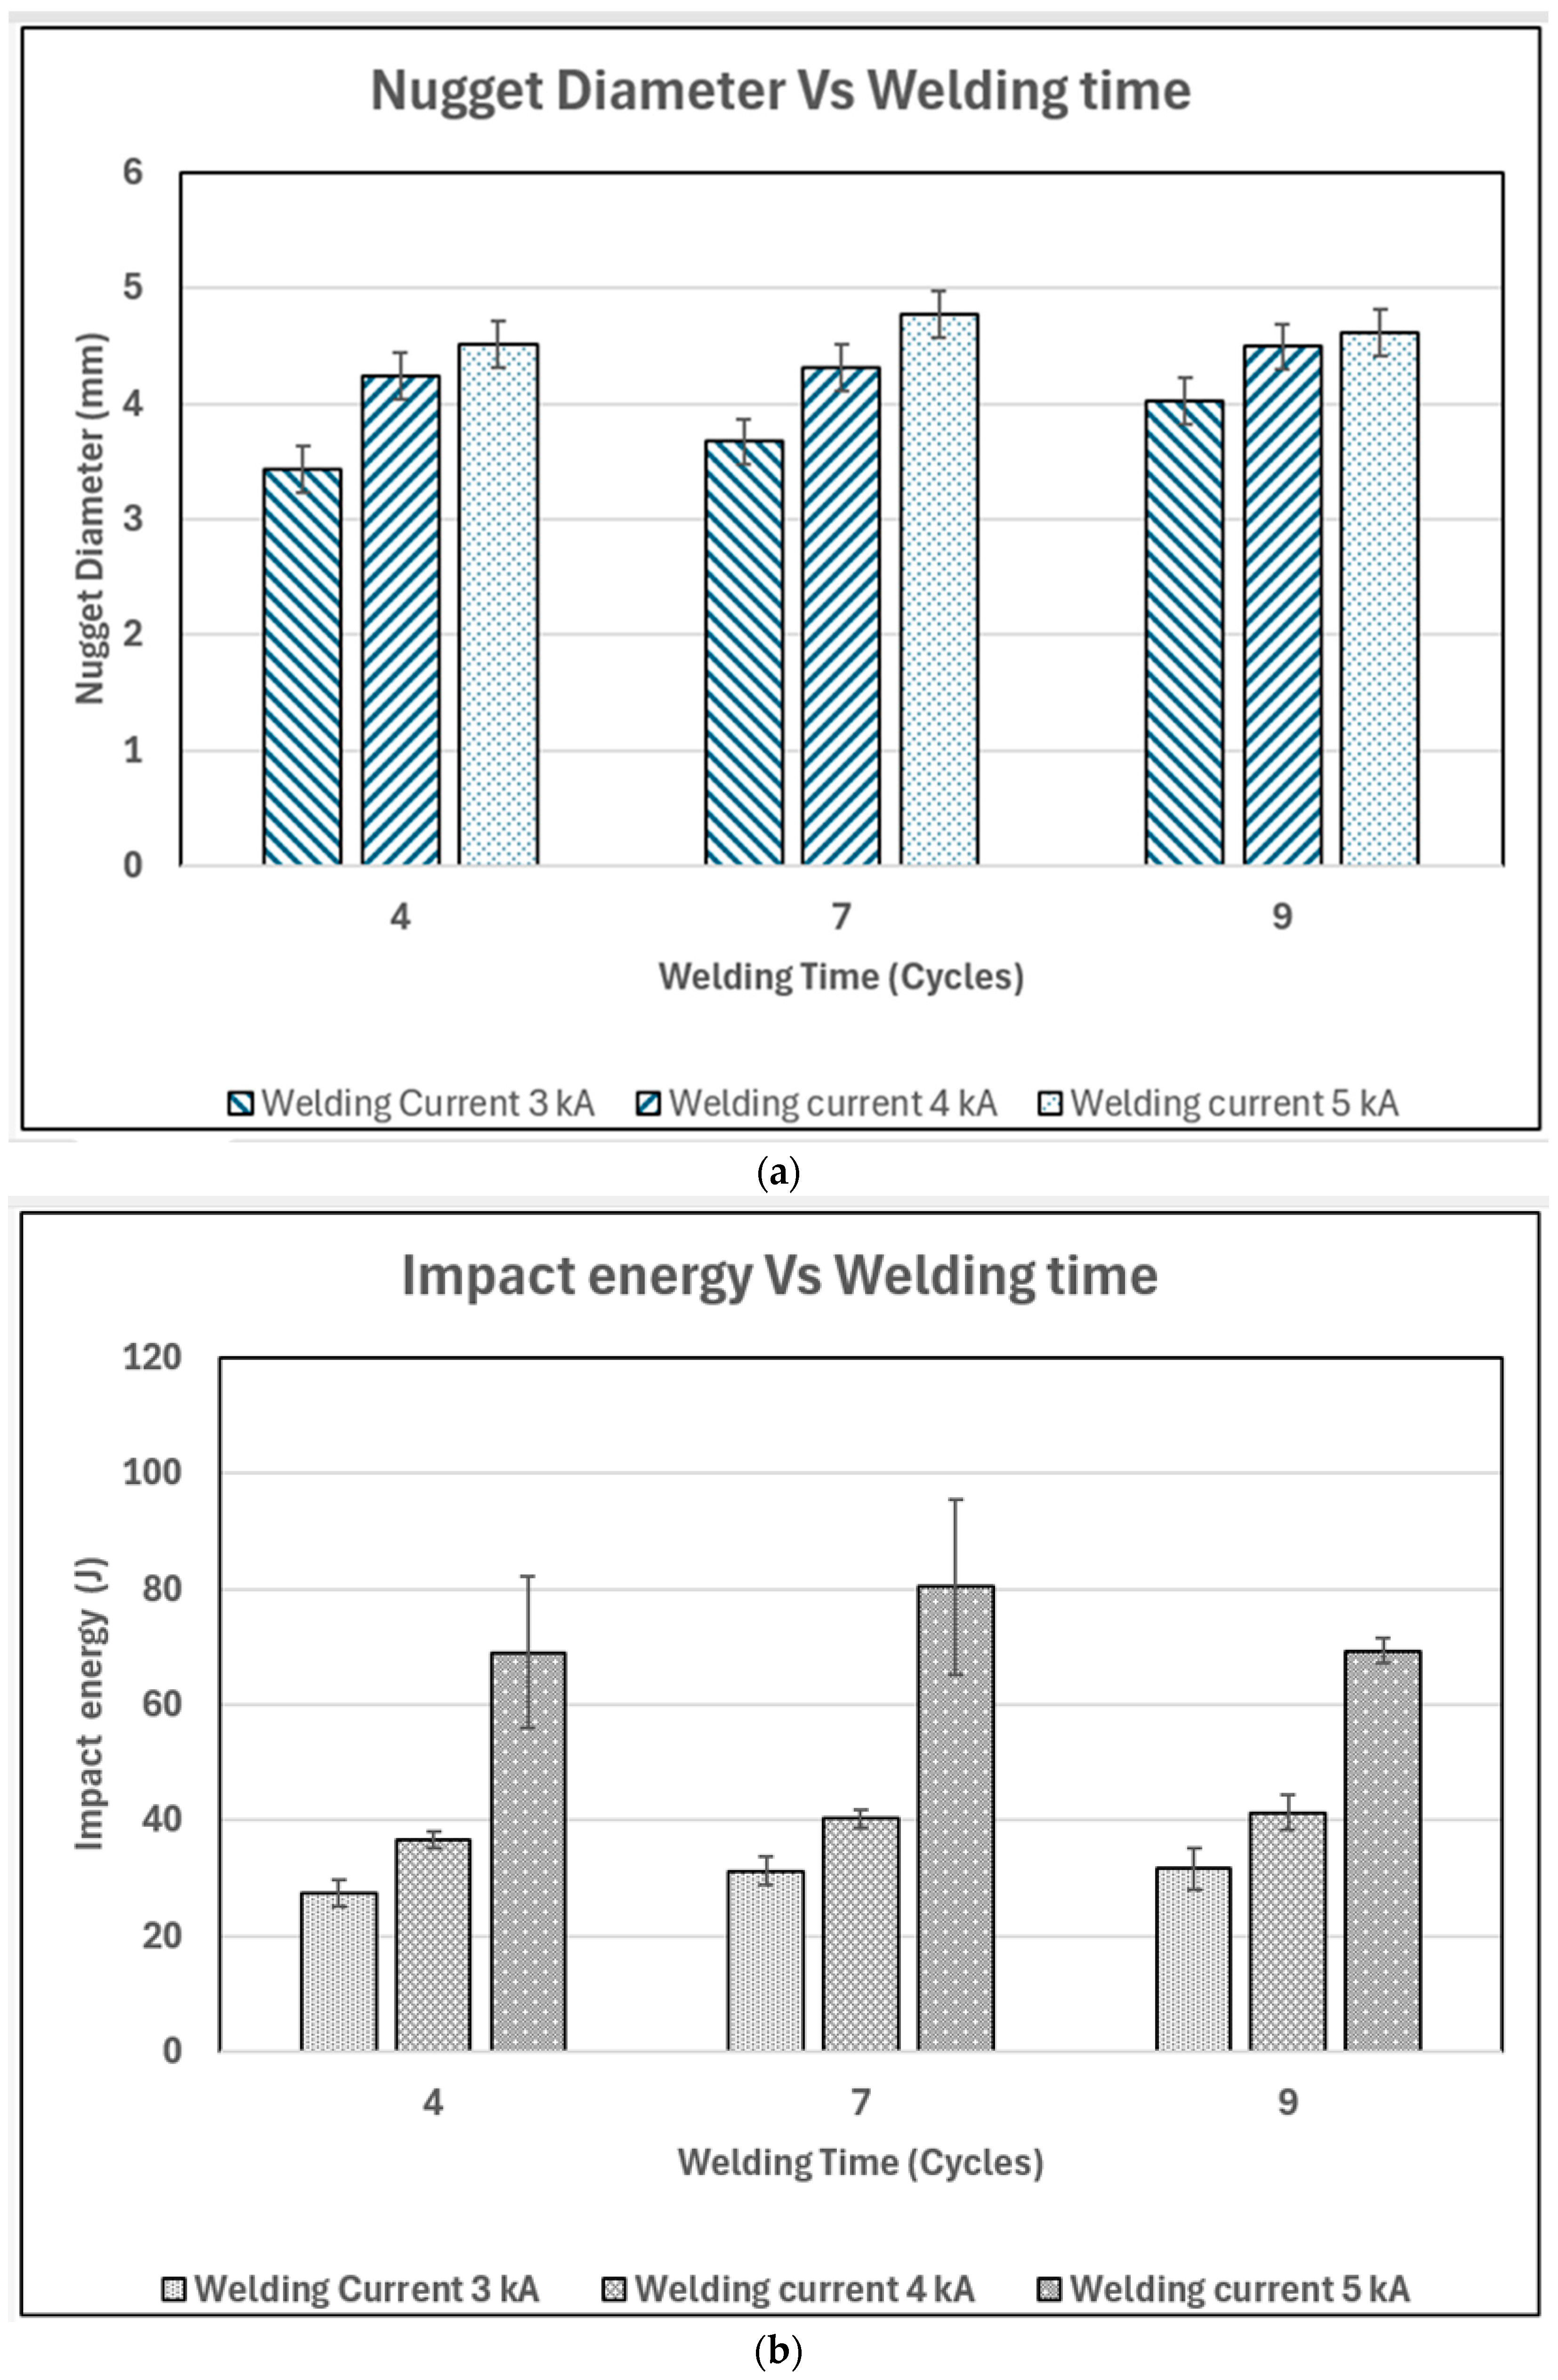
To be able to determine the effects of the welding parameters on the weld performance, the average values for the impact energy from Table 4 were calculated. The average sheet thickness and nugget diameter measurements for all sets of parameters were obtained. For the comparison later, the critical nugget diameter was also calculated from the thickness using the formula by Chao [1] given as d c r = 3.65 t 4 3 . All these values are in Table 5. It is clear from this table that both the impact energy and the nugget diameter increased with the increase in the welding current and welding time. However, when the welding time reached nine cycles for a welding current of 5 kA, the impact energy and the nugget diameter decreased.

3.1.1. Effect of Welding Current

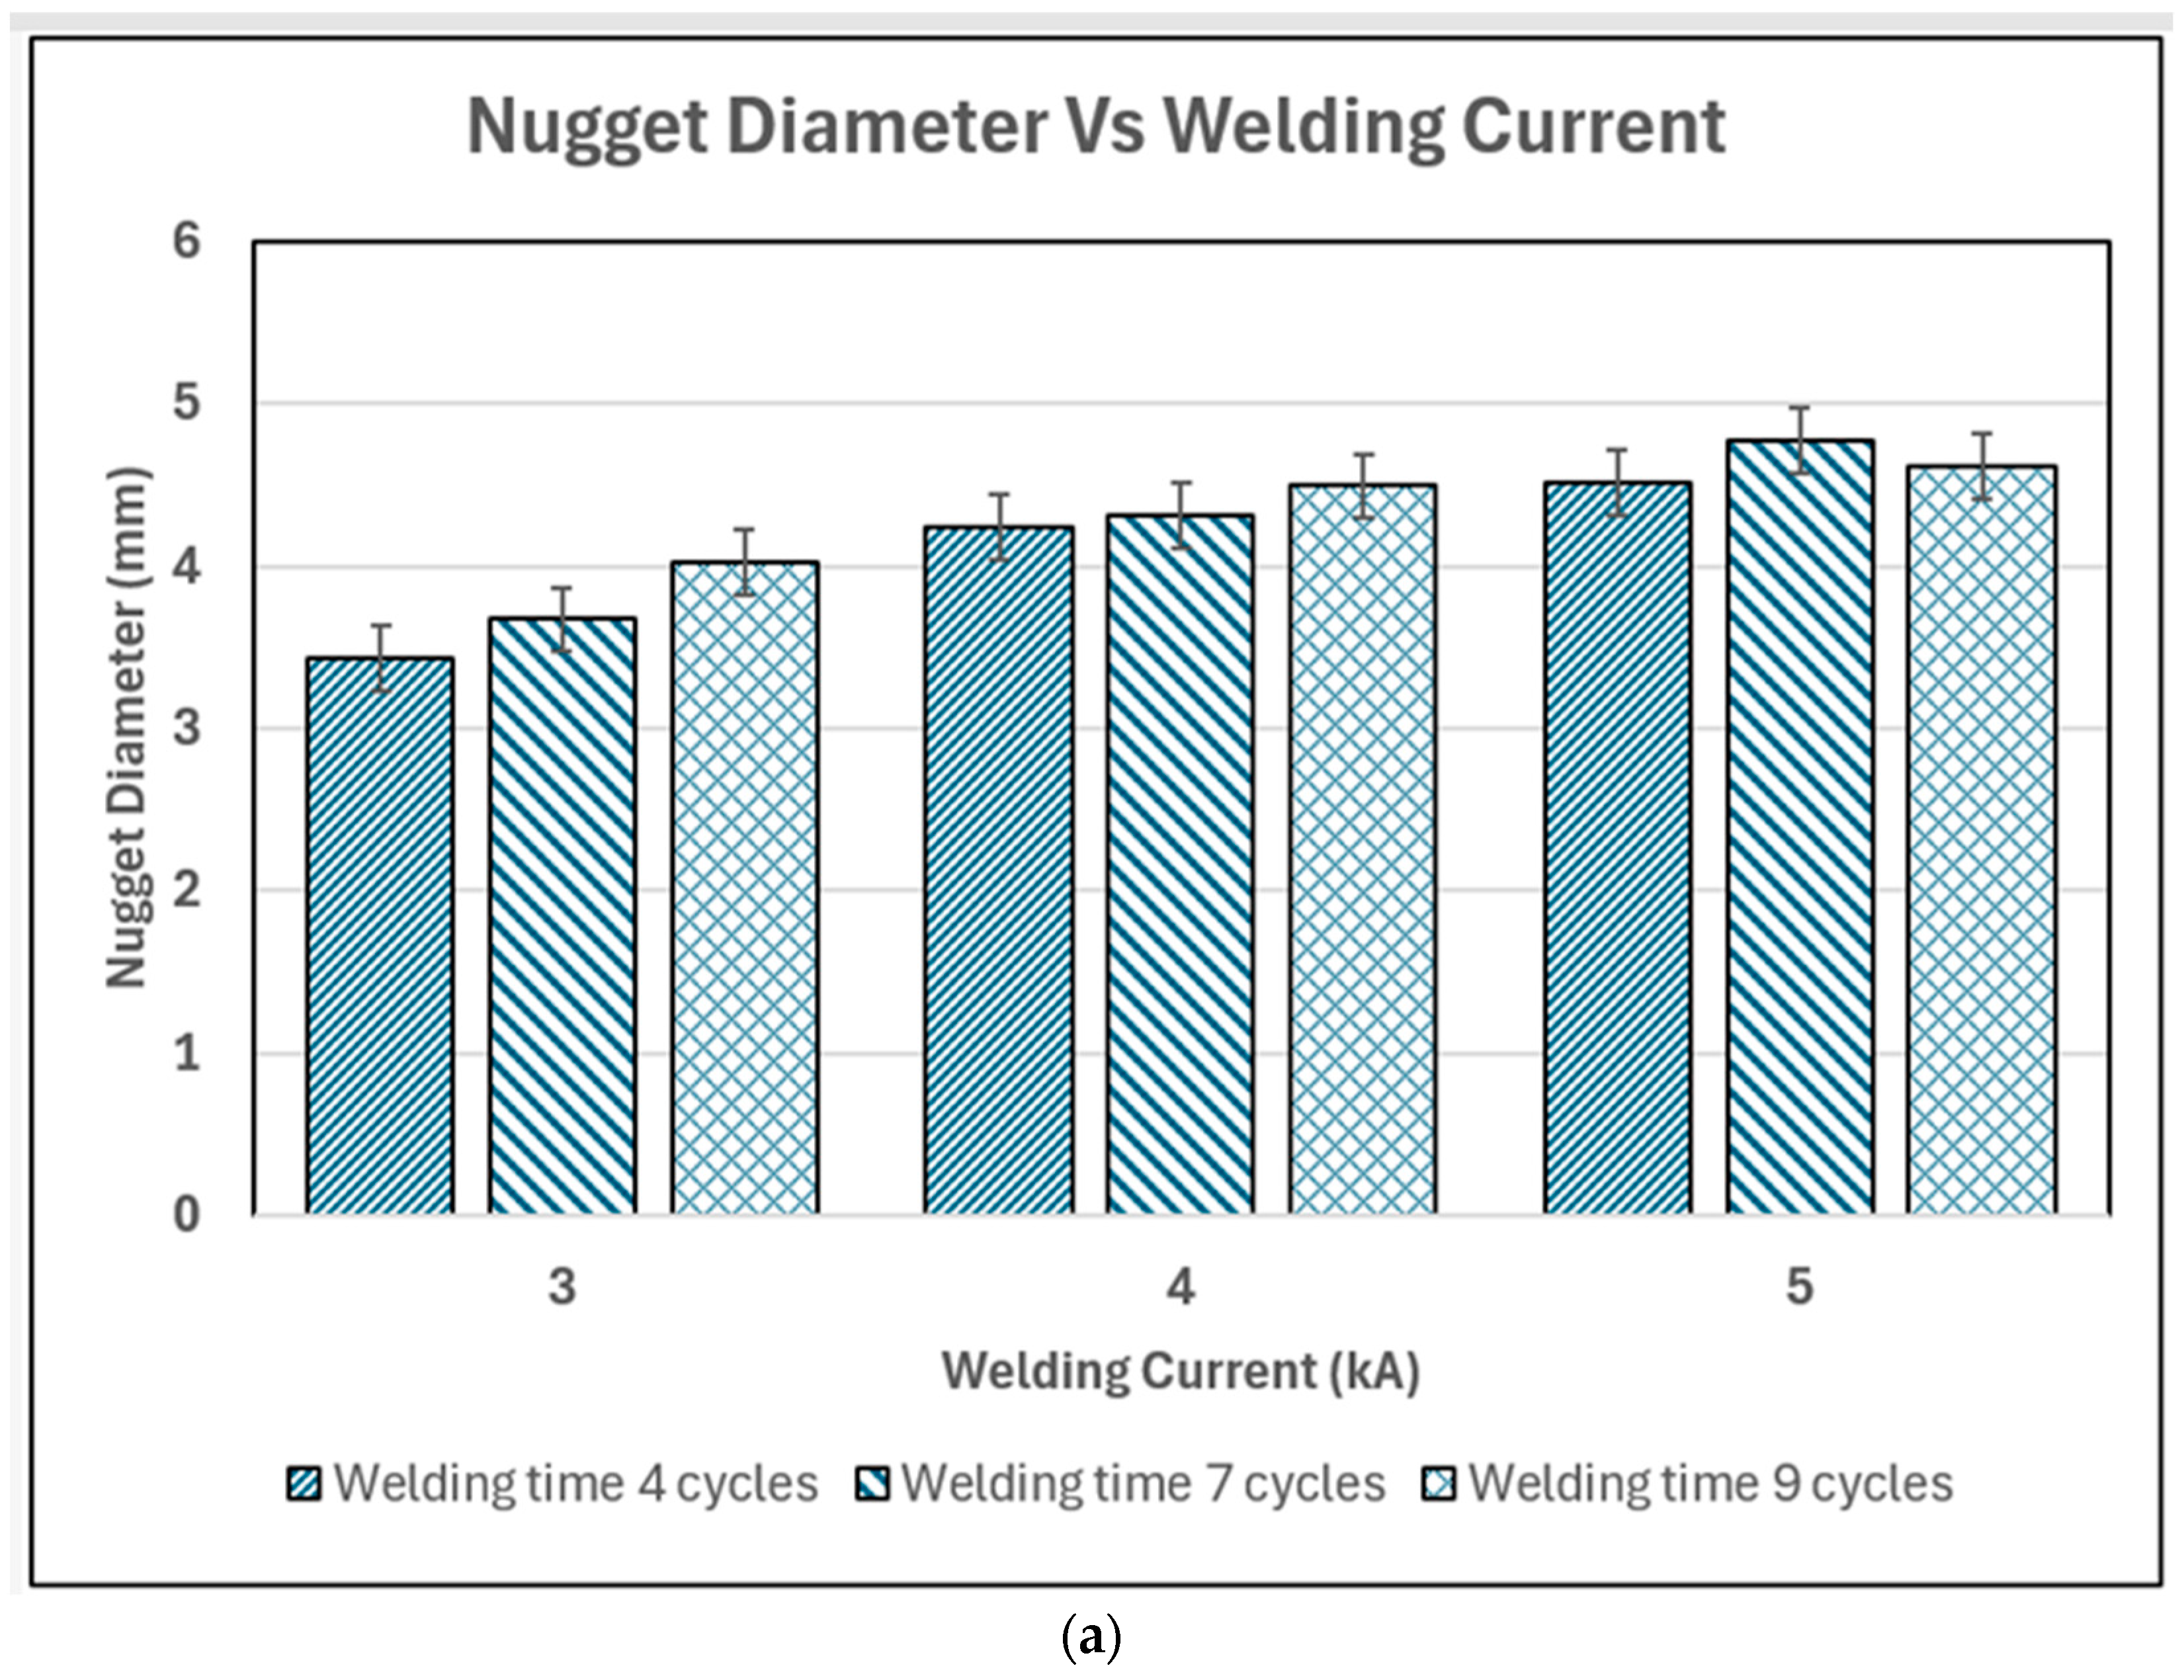
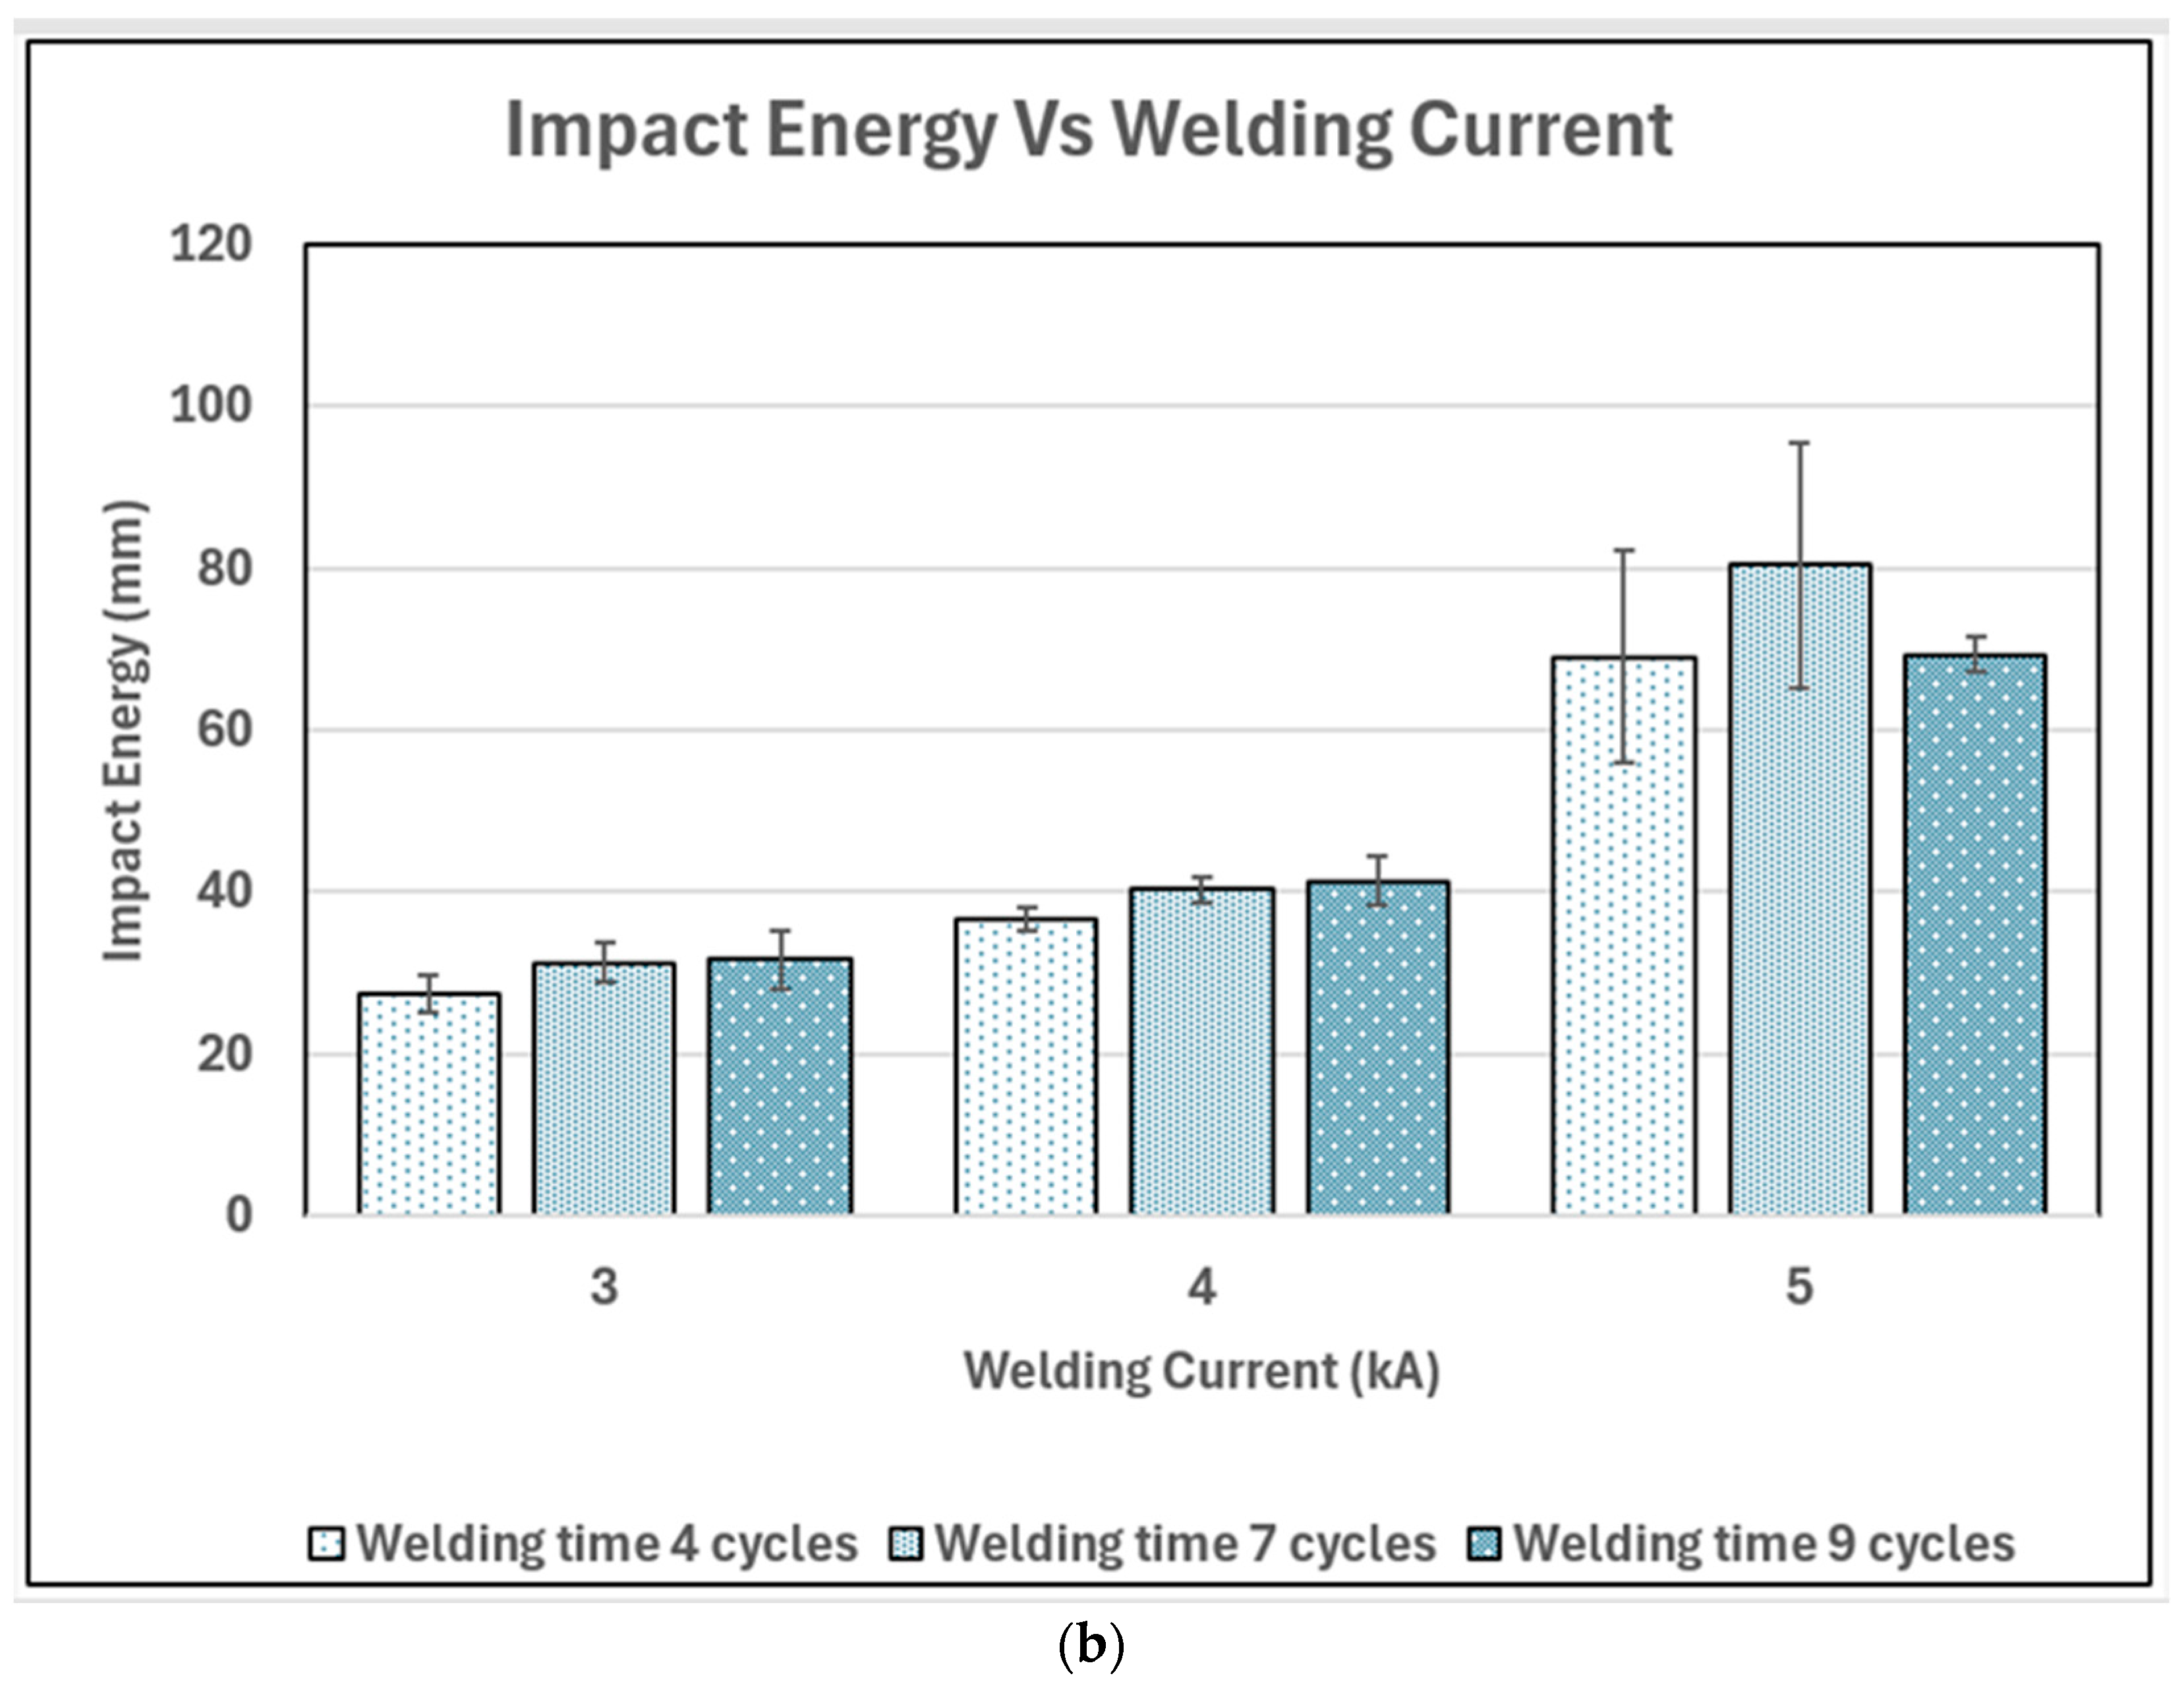
To easily describe the effect of welding current, Figure 5a,b were plotted. For Figure 5a, it is seen that nugget diameter of the specimens was larger when more welding current was applied during the spot-welding process. The reason for this is because increasing the welding current causes the resistance generated at the faying surface during the spot-welding process to also increase. It is known that there is a larger resistance at the point of contact between the two metal sheets, which results in the increase in the heat generated. As mentioned previously, the increase in heat input reduces the time needed to reach the melting temperature of the metal sheets, which means that a higher volume of the metal at the faying surface is molten and subsequently solidified into a larger spot weld nugget. However, at high current, severe reduction in resistance along the weld interface prevents the weld nugget from becoming larger, hence the leveling-off for the nine cycles plot [5]. Since the trend of Figure 5a matches the graphs by Goodarzi, Marashi and Pouranvari [10], it can be said that further increase in the welding current will result in expulsion causing less material to form the spot weld and the increase in heat loss within the nugget, which leads to the reduction in the spot weld nugget diameter.
Figure 5b shows the increase in impact energy due to the increase in welding current. As mentioned, higher welding current results in larger weld nuggets. And if the size of the nugget increases, several factors also increase such as shear resistance and twisting resistance, both of which determine the amount force or energy needed to make the spot weld fail [5]. This means that the increase in welding current increases the size of the spot weld nugget, which in turn, allows more energy to be absorbed by the spot-welded specimen. The trends of impact energy in Figure 5b for all welding cycles are similar except for 5 kA specimens. This is because of the trend observed in spot weld nugget diameter trend, as shown in Figure 5a.

3.1.2. Effect of Welding Time

Like the previous section, Figure 6a,b were plotted to easily describe the effect of welding time. For Figure 6a, increase in welding time resulted in larger weld nuggets. This is because the increase in welding time allowed for longer application of current during the joining process, so that an additional small volume of metal is molten [4]. Since more metal was molten, a larger nugget was formed that joined the two sheets of metal. The drop in the nugget diameter observed for a welding current of 5 kA occurred because the welding time was increased past a critical point, which led to a drop in the weld nugget size. This was caused by the weld nugget being exposed to a long welding time at a high welding current, which made the metal overheat and caused an increase in the heat loss at the spot weld nugget that prevented the formation of a larger nugget and instead resulted in a small fusion zone size.
Figure 6b shows the graph of impact energy vs. welding time. Here, when the welding current was either 3 or 4 kA, little increase in the impact energy was observed. As for time equal to 5 kA, a substantial increase was observed in the beginning before a large drop from the middle was seen. Like the welding current, the increase in the nugget diameter allowed for a slight increase in impact energy. However, the reduction for 5 kA was due to the overheating experienced by the weld, which reduced the strength of the weld nugget. The trends of impact energy in Figure 6b are all similar except for the 5 kA trend. This is because of the trend of spot weld nugget diameter trend, as shown in Figure 6a.

3.1.3. Failure Mode

According to Goodarzi et al. [10], the failure of a spot weld joint is a competitive process between the plastic deformation due to shear stress and the necking in the heat-affected zone (HAZ) or base metal (BM). During the impact testing, the specimens were subjected to a dynamic load over a short period of time. The main mechanism for interfacial failure mode is the shear stress located at the interface of the two steel sheets, while the main mechanism for pullout failure mode is the shear stress due to the bending moment from the overlapping of the two sheets and spot weld nugget rotation during testing. Based on these, the spot weld will fail through a certain failure mode, depending on which one reaches its critical value first.
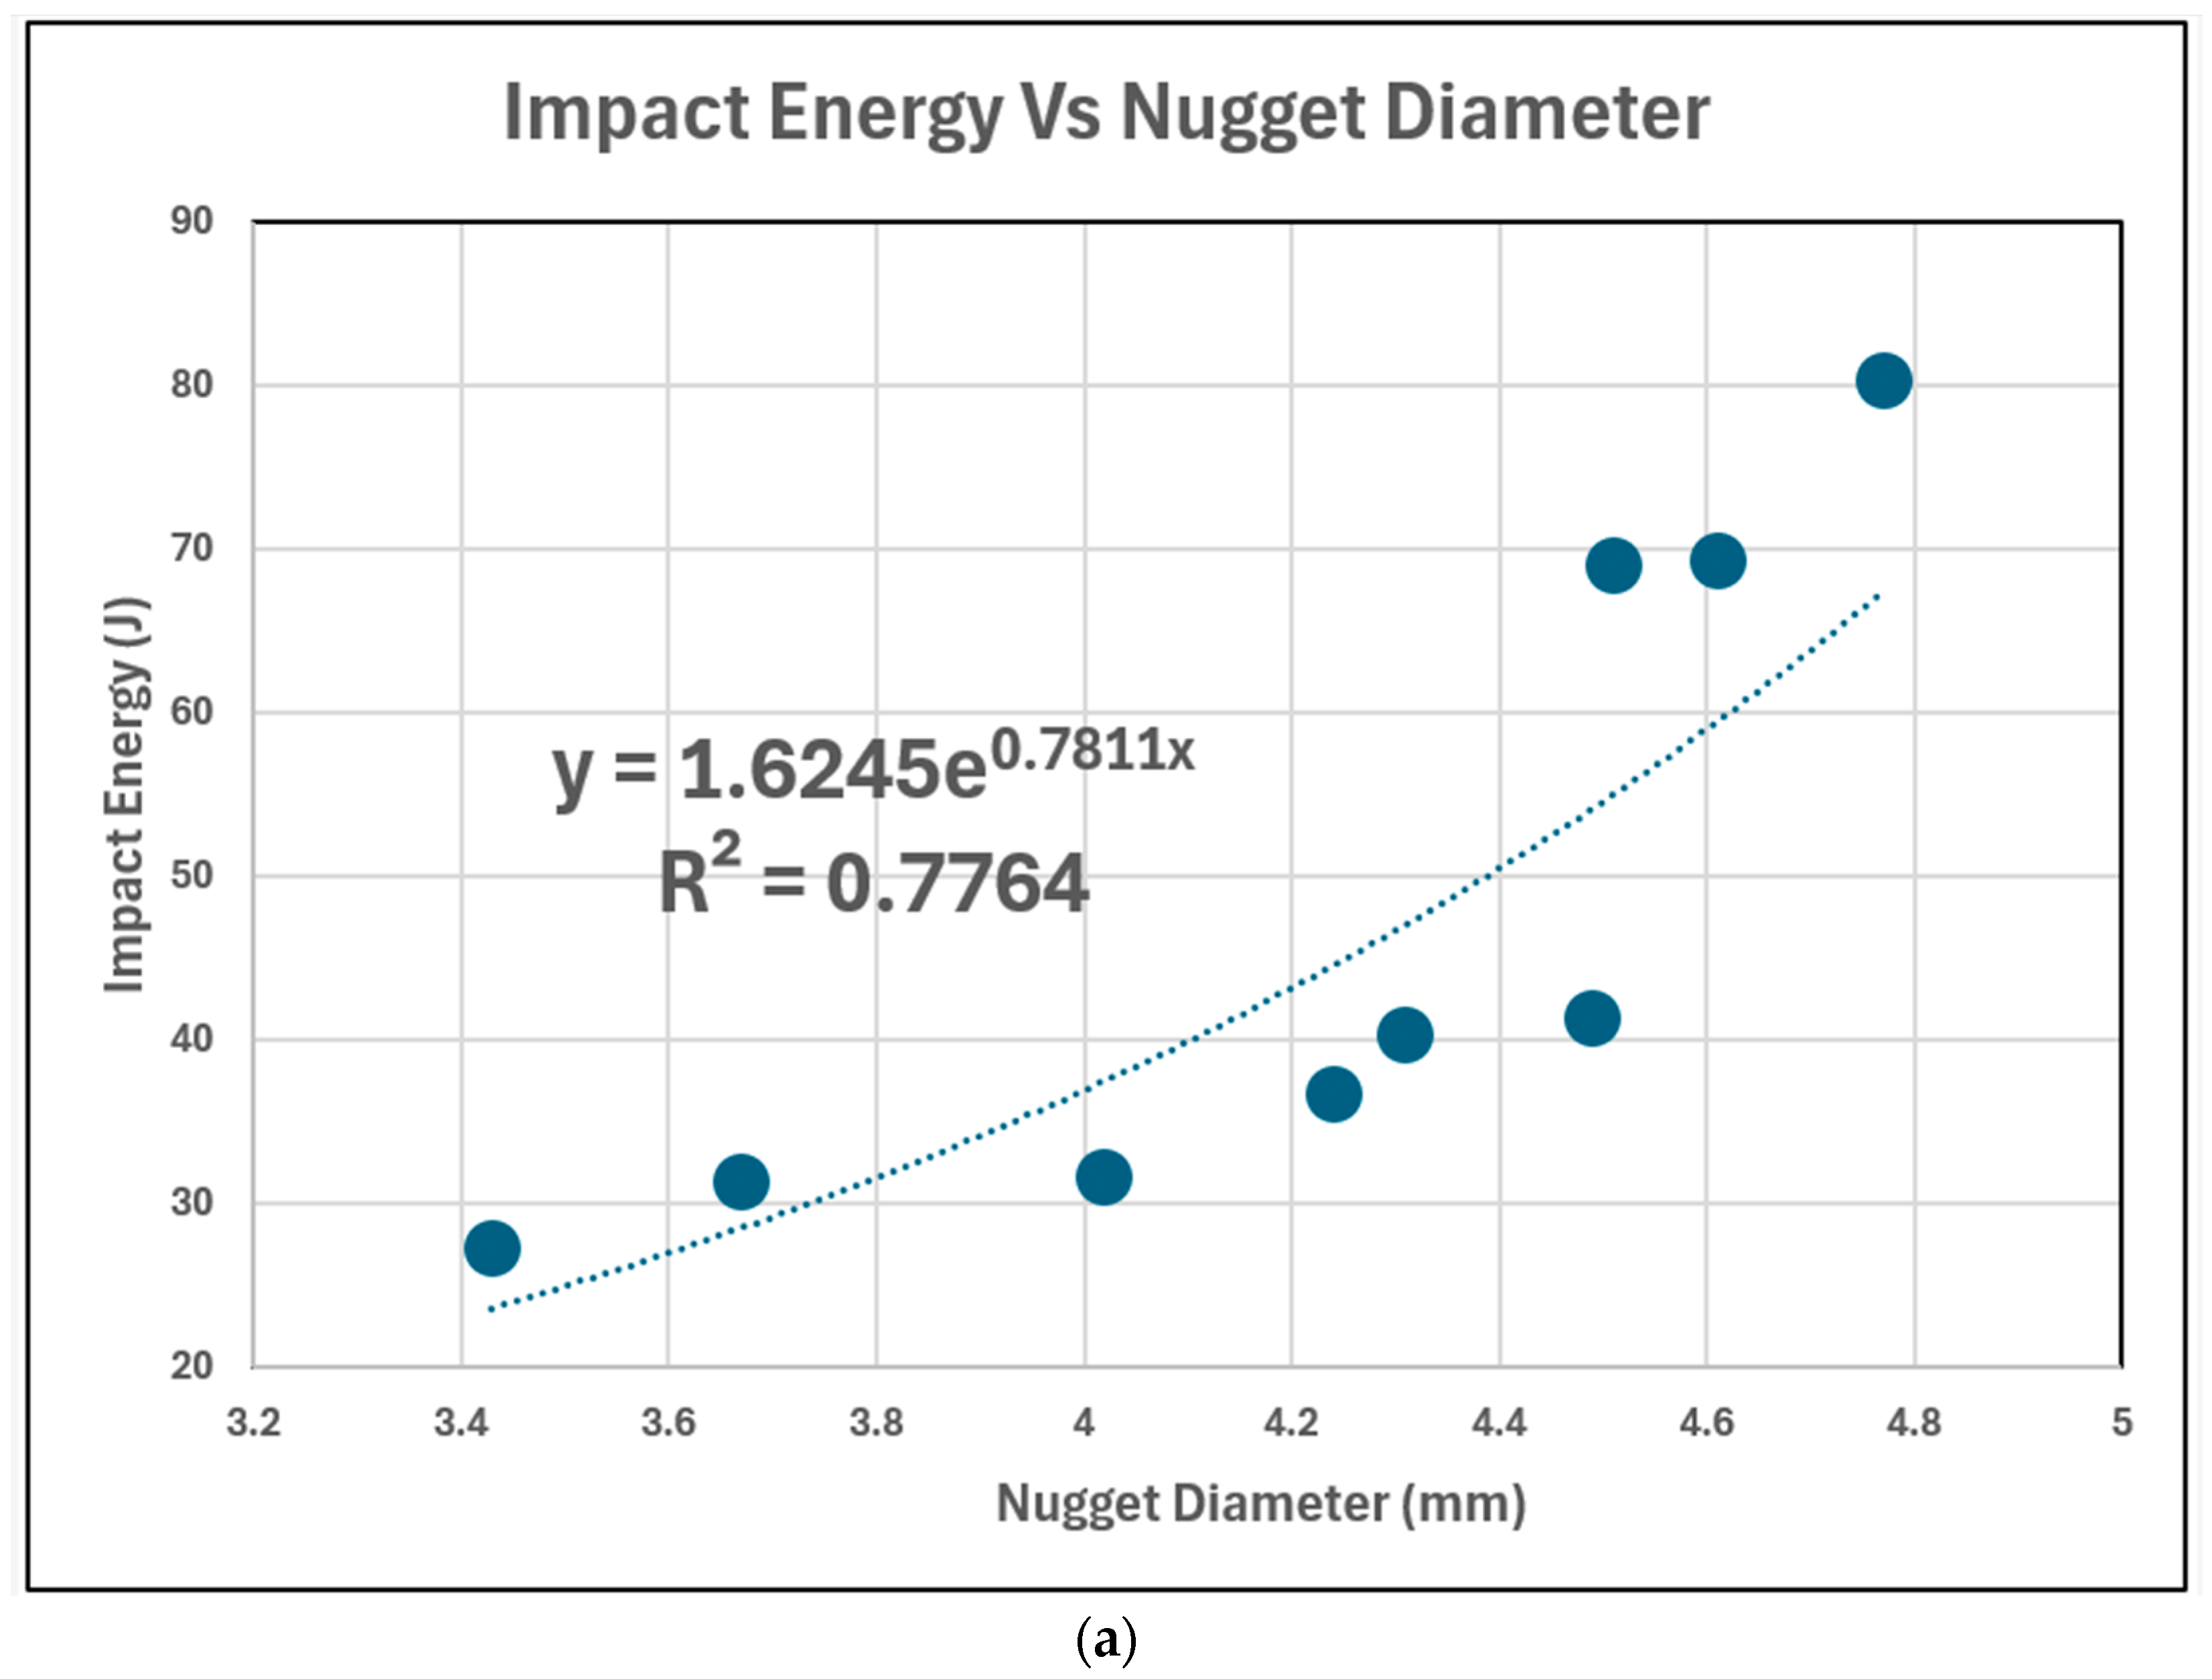
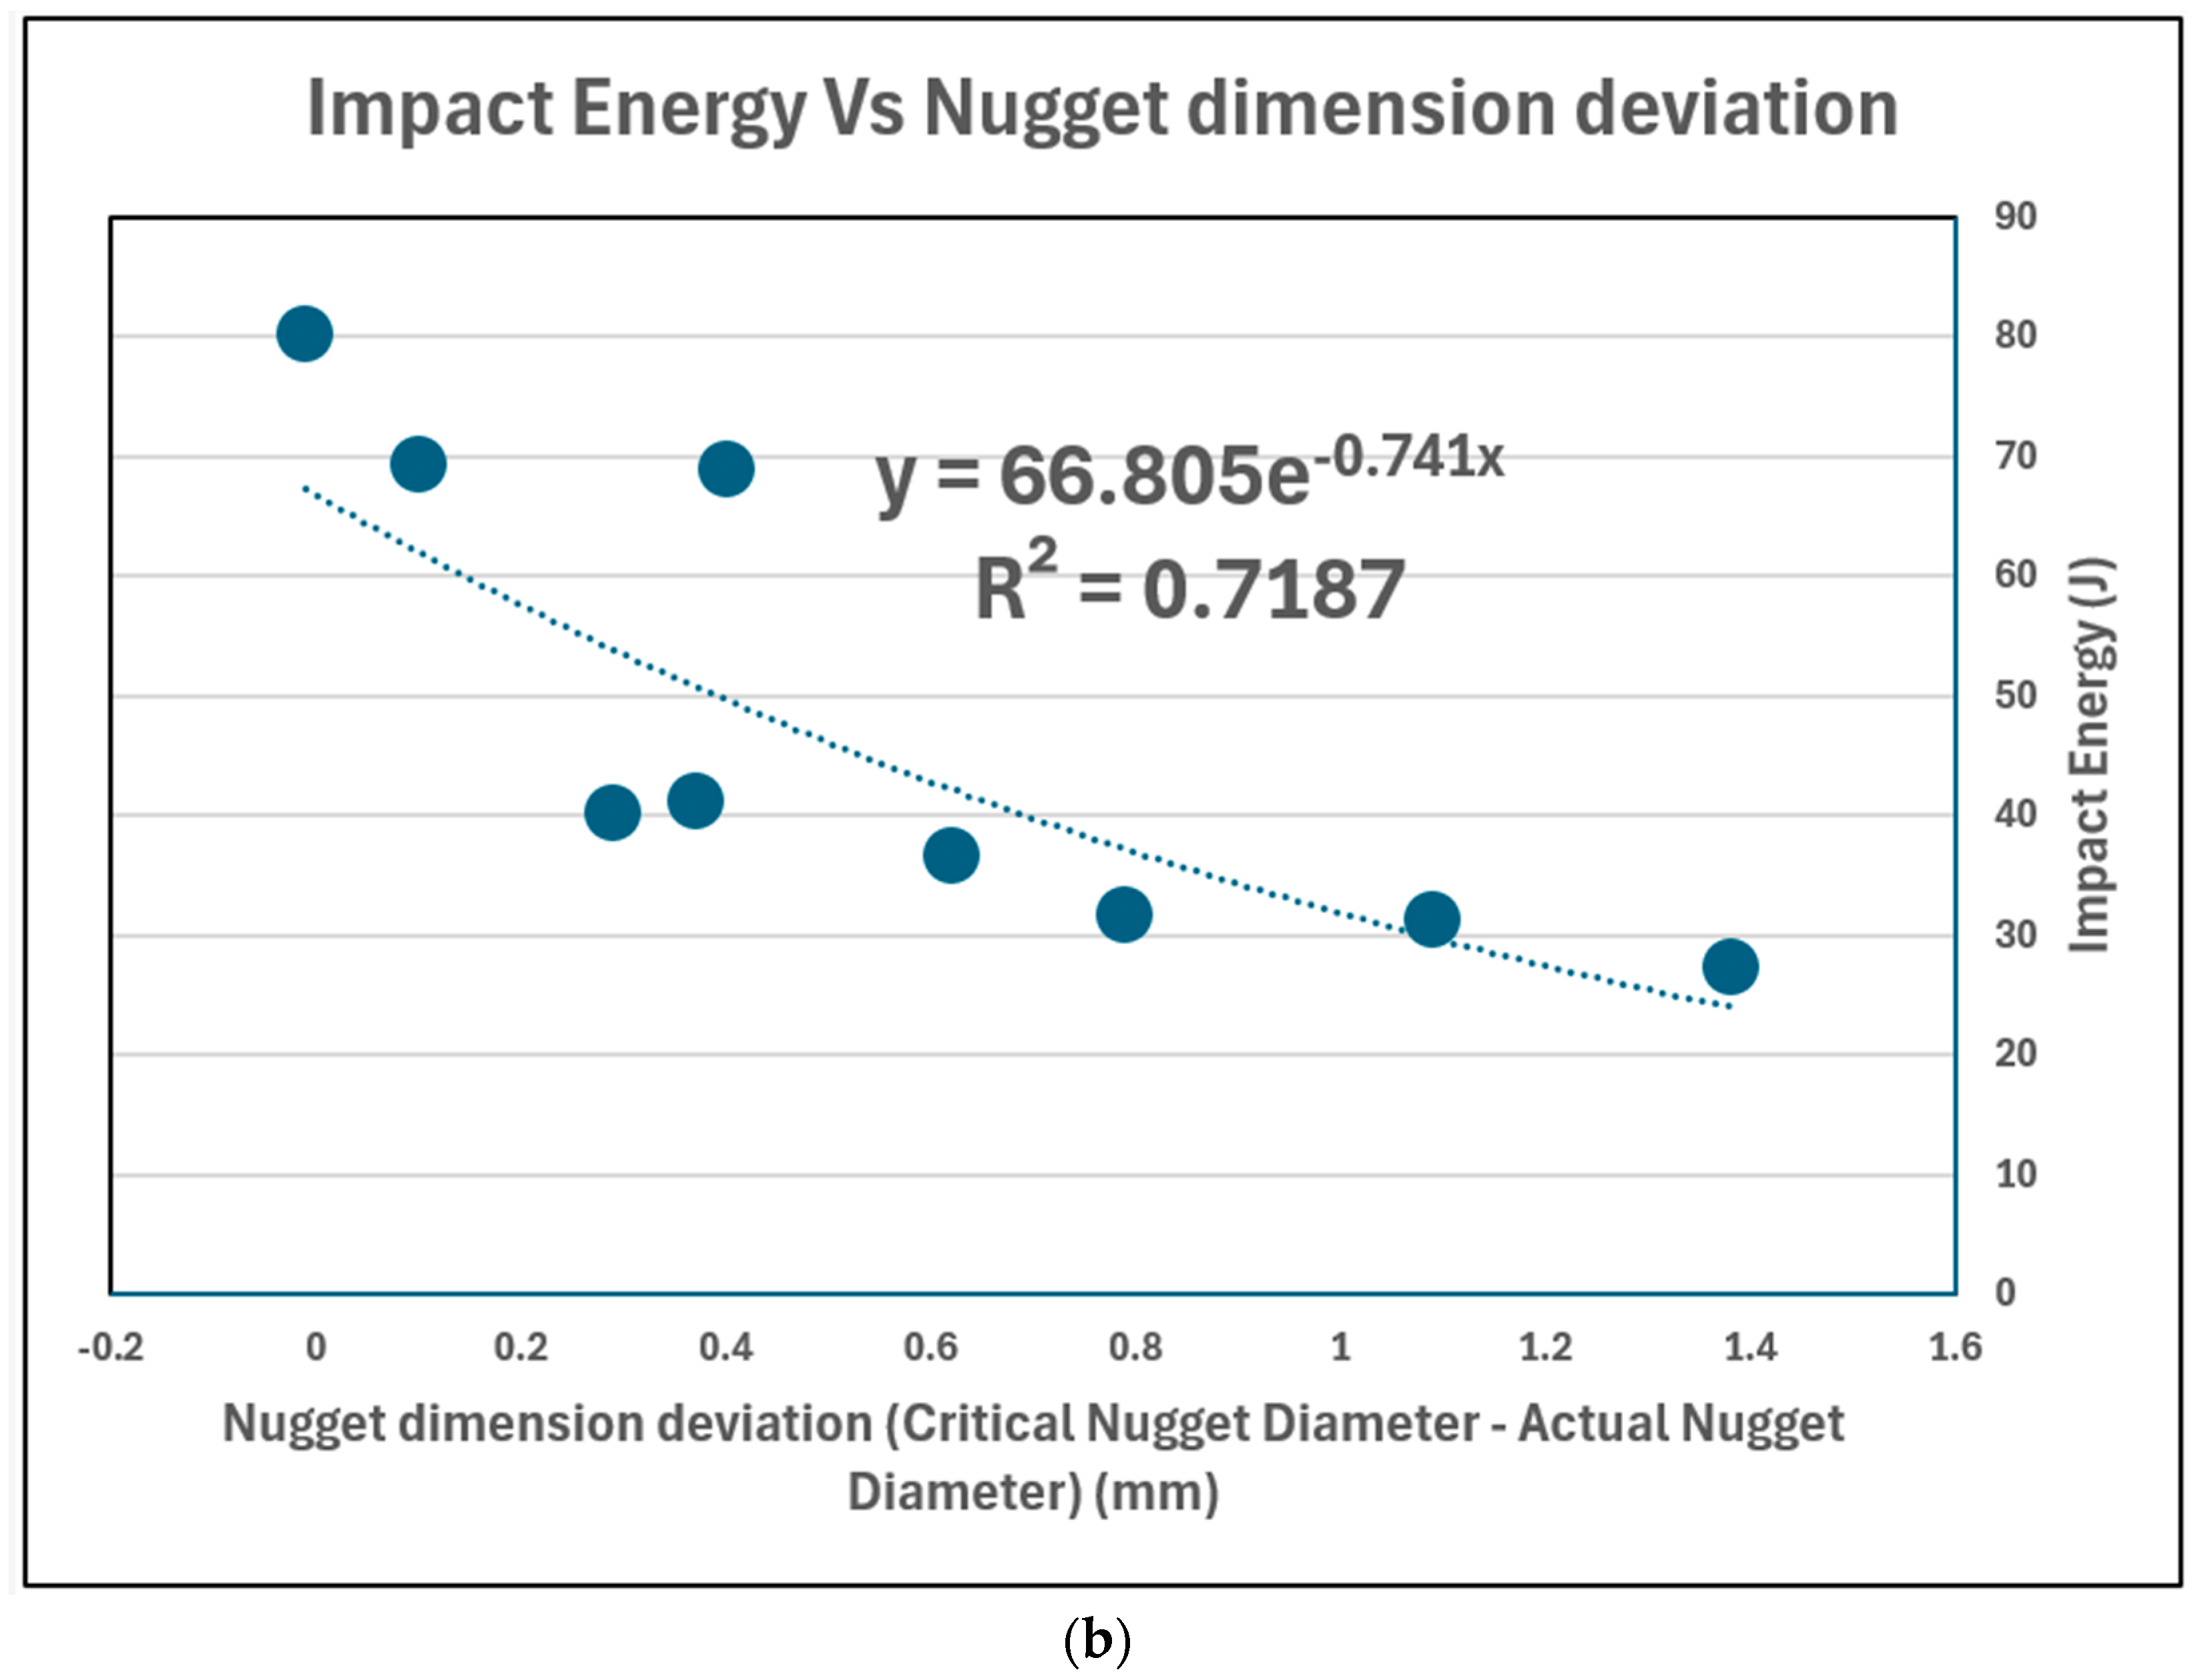
Goodarzi et al. [10] also stated that the increase in the size of the diameters leads to higher shear resistance and twisting resistance for spot welds. By following the previous paragraph, this means that larger spot welds are less likely to fail due to shearing and bending and that the size of the weld nugget can predict the mode of failure for spot welds. The correlations between the nugget diameter and impact energy are shown in Figure 7a. By comparing the measured nugget diameter with the critical nugget diameter, which is the transition point between the two failure modes, the nugget diameter for all but one set of parameters is less than the critical nugget diameter. For a spot weld to fail via pullout, the nugget diameter should be larger than the critical nugget diameter, as shown in Figure 7b, which will allow the spot weld to reach the critical necking value before the critical shear stress is reached. This, obviously, was not the case for almost all specimens, which is why they failed via the interfacial failure mode.

3.2. Analysis Using Response Surface Methodology

3.2.1. Analysis of Variance

The outcome of ANOVA for the Response Surface Quadratic model is shown in Table 6. In Table 6, the Model F-Value of 82.15 shows that it is significant and that there is less than 0.01% chance that the F-Value was caused by noise. The table also shows that both A and B are significant model terms because their Prob > F-Values are less than 0.05. The F-Value of 0.21 for the Lack of Fit indicates that the Lack of Fit, which represents how much the model fails to relate the experimental factors to the response, is not significant relative to the pure error. It is noted that the values in the tables are small because of the inverse power transformation applied during the analysis.
Table 7 shows the different R-squared values, which represent the amount of variation with respect to the mean value of the response. The reason for having the adjusted and predicted R-squared values is to make sure that there are not too many insignificant terms in the model. When the number of insignificant terms is increased, the adjusted R-squared becomes constant, while the predicted R-squared decreases. If the difference between these two values is less than 0.2, it signifies good agreement. From Table 7, all the R-squared values are above 0.9, which shows that the model has a very good fit with the results obtained from the impact testing. Furthermore, the difference between the adjusted and predicted R-squared is less than 0.2. All of these, plus the observations from Table 7, show that the model can be used to provide good predictions for average outcomes. Also, the adequate precision, which is the quantity that describes the predicted response range relative to the associated error (known as signal to noise ratio), is significantly higher than 4, which means that there is a good signal.
Table 8 shows the outputs for the coefficients of the coded factors for the model. Shown in the table are the estimated values for each of the coefficients. The standard deviation for these estimated values is represented by the standard error. The table also shows the 95% confidence intervals, which signify the lower and upper limits of each of the factor coefficients for a confidence level of 95%. The importance of this table is that it shows the upper and lower bounds of the coefficients for the coded factors. Also, the relative magnitude of the coefficient estimates can be used to identify which of the two main factors, the welding current and welding time, has a much more significant effect on the impact energy response. Since the welding current has a higher magnitude, it has a larger effect on the impact energy compared to the welding time.
Based on these coefficients, the program performs calculations to determine the true coefficient estimate for each of the factors listed. An equation for predicting the impact energy can then be developed as below.
I m p a c t   E n e r g y = [ + 0.062575 + 1.15572 × 10 3 W e l d i n g   C u r r e n t 5.78923 × 10 3 W e l d i n g   T i m e + 4.12781 × 10 4 W e l d i n g   C u r r e n t W e l d i n g   T i m e 1.72597 × 10 3 W e l d i n g   C u r r e n t 2 + 2.76848 × 10 4 W e l d i n g   T i m e 2 ] 1

3.2.2. Model Graphs

After performing the analysis, the surface and contour plots were obtained to represent the model for the input parameters and results. Figure 8a shows a 3D surface for the impact energy vs. the welding current and welding time. From this figure, the lowest values are shown in deep blue color, while the highest values are indicated in yellow color. The lowest values were caused by low welding current and welding time. Several points can also be seen from the 3D plot. These points signify where the experimental results fall on the response plot. The purpose of obtaining this plot is to visually display the relationship between the two factors and the response to know how the combination of welding time and welding current affects the impact energy. This plot can also be used to predict the impact energy that can be absorbed by a spot-welded joint using a certain value of welding current and welding time.
The contour plot of impact energy vs. the welding current and welding time is shown in Figure 8b. The areas shaded in deep blue indicate the lowest value for impact energy. Increase in the welding current and welding time causes the color to become brighter, meaning that the impact energy increases. The impact energy then reaches its maximum value when the color becomes yellow. The black lines highlight at which points the impact energy is at 30, 40, 50, 60 or 70 J. Also, a closer inspection shows outlines of curves in the figure that indicate the integer values of the predicted impact energy. For example, the outline to the right of the black line labeled 30 J shows which values of welding current and welding time result in an impact energy of 31 J. This contour plot is used to help in the visualization of the relationship between the welding current, welding time and the impact energy, as this can sometimes be difficult when only looking at the isometric view of the 3D surface plot.

3.3. Analysis Using RSM

After performing the analysis using Response Surface Methodology, a model was created and represented using the contour plot and 3D surface plot, as shown in the previous section. Using this model, optimization was performed to determine the set of process parameters that will yield the highest impact energy values. Using statistical software Design Expert, the first 10 solutions which maximize the impact energy are found and then tabulated in Table 9. The table shows the optimized values for the welding time and the welding current as well as the impact energy that is absorbed by a spot-welded specimen using the corresponding process parameters. The desirability is also shown in this table; this value represents how close the optimized response is to the maximum value. The highest predicted impact energy was 81.124 J with a desirability of 0.766 for the welding current of 5 kA and welding time of 6.728 cycles. The next two sets of values in the table also show a desirability of 0.766 and a slightly lower impact energy of 81.123 J. However, it is noticeable that the optimized impact energy value of 81 J is lower than the tested value of 98 J. This is because of the limitations of developed optimization models. The optimization model input had only two nugget pullout impact energy data. If more data for nugget pullout mode can be included in the optimization algorithm, reasonably accurate optimized impact energy prediction can be obtained.

4. Conclusions

A design has been created to allow for the impact testing of spot weld joints with a conventional impact testing machine. Modifications have been made to the setup so that the energy from the pendulum swing can be transferred to the spot-welded specimen. Results were then obtained from the performed impact testing. Following this, analysis and optimization were performed on the experimental data. Three-dimensional and contour plots have also been created to visualize the relationship between the impact energy and the welding current and welding time. The major findings from this study are listed below.
i.
The highest impact energy obtained during impact testing was 98 J for the specimen that was welded using 5 kA of welding current and nine cycles welding time.
ii.
Both welding current and welding time affect the impact energy absorption capability of the spot weld. The increase in welding current allowed the temperature at the faying surface to rapidly increase to melting temperature, melting more metal, which resulted in a larger diameter. This caused the impact energy to increase. The increase in welding time had a similar effect and led to larger weld nuggets but only slightly higher impact energy.
iii.
The increase in both spot-welding process parameters caused the impact energy to increase and the nugget diameter to be larger. This occurred until a certain point, after which both the impact energy and nugget diameter values became lower.
iv.
There is a correlation between the nugget diameter and impact energy, in that the impact energy increases when the nugget diameter is larger.
v.
Results from ANOVA showed that the welding current has a greater effect on the impact energy and the welding performance of the spot weld.
vi.
Optimization of the model showed that a welding current of 5 kA and welding time of 6.728 cycles will produce an impact energy equal to 81.124 J with a desirability of 0.766.

Author Contributions

R.K.C.: Methodology, formal analysis, writing—original draft preparation, N.K.: Conceptualization, methodology, formal analysis, writing—review and editing, supervision. S.I.: writing—review and editing, A.M.M.: writing—review and editing. All authors have read and agreed to the published version of the manuscript.

Funding

This research did not obtain any funding.

Institutional Review Board Statement

Not Applicable.

Informed Consent Statement

Not Applicable.

Data Availability Statement

Data are included in the original manuscript.

Acknowledgments

Curtin University, Malaysia mechanical engineering laboratory technicians are gratefully acknowledged for their help in conducting the experimental study.

Conflicts of Interest

The authors declare no conflicts of interest.

References

  1. Chao, Y.J. Failure Mode of Spot Welds: Interfacial Versus Pullout. Sci. Technol. Weld. Join. 2003, 8, 133. [Google Scholar]
  2. Pouranvari, M.; Marashi, S.P.H.; Safanama, D.S. Failure Mode Transition in AHSS Resistance Spot Welds. Part II: Experimental Investigation and Model Validation. Mater. Sci. Eng. A 2011, 528, 8344–8352. [Google Scholar] [CrossRef]
  3. Darwisha, S.M.H.; Ghanya, A. Critical assessment of weld-bonded technologies. J. Mater. Process. Technol. 2000, 105, 221–229. [Google Scholar] [CrossRef]
  4. Shojaee, M.; Midawi, A.R.H.; Barber, B.; Ghassemi-Armaki, H.; Worswick, M.; Biro, E. Mechanical properties and failure behavior of resistance spot welded third-generation advanced high strength steels. J. Manuf. Process. 2021, 65, 364–372. [Google Scholar] [CrossRef]
  5. Soomro, I.A.; Pedapati, S.R.; Awang, M. A review of advances in resistance spot welding of automotive sheet steels: Emerging methods to improve joint mechanical performance. Int. J. Adv. Manuf. Technol. 2022, 118, 1335–1366. [Google Scholar] [CrossRef]
  6. Ramachandran, D.C.; Betiku, O.T.; Shojaee, M.; Salandari-Rabori, A.; Midawi, A.R.H.; Kim, J.-U.; Bakhtiari, R.; Macwan, A.; Biro, E. Effect of paint baking on the fusion boundary softening and fracture behavior of Q&P 980 steel resistance spot welds. Mater. Charact. 2023, 206, 113383. [Google Scholar] [CrossRef]
  7. Meilinger, Á.; Prém, L.; Al Al, S.A.A.; Gáspár, M. Comparison of RSW technologies on DP steels with modified instrumented Charpy impact test. Weld. World 2023, 67, 1911–1922. [Google Scholar] [CrossRef]
  8. Betiku, O.T.; Kim, J.-U.; Ikic, A.; Okoroafor, S.; Sherepenko, O.; Ghassemi-Armaki, H.; Biro, E. A novel method to evaluate the mechanical properties of resistance spot welds under dynamic loading. Manuf. Lett. 2024, 39, 11–15. [Google Scholar] [CrossRef]
  9. AZoM. Aisi 1010 Carbon Steel (Uns G10100). 2012. Available online: http://www.azom.com/article.aspx?ArticleID=6539 (accessed on 15 May 2016).
  10. Goodarzi, M.; Marashi, S.P.; Pouranvari, M. Dependence of Overload Performance on Weld Attributes for Resistance Spot Welded Galvanized Low Carbon Steel. J. Mater. Process. Technol. 2009, 209, 4379–4384. [Google Scholar] [CrossRef]
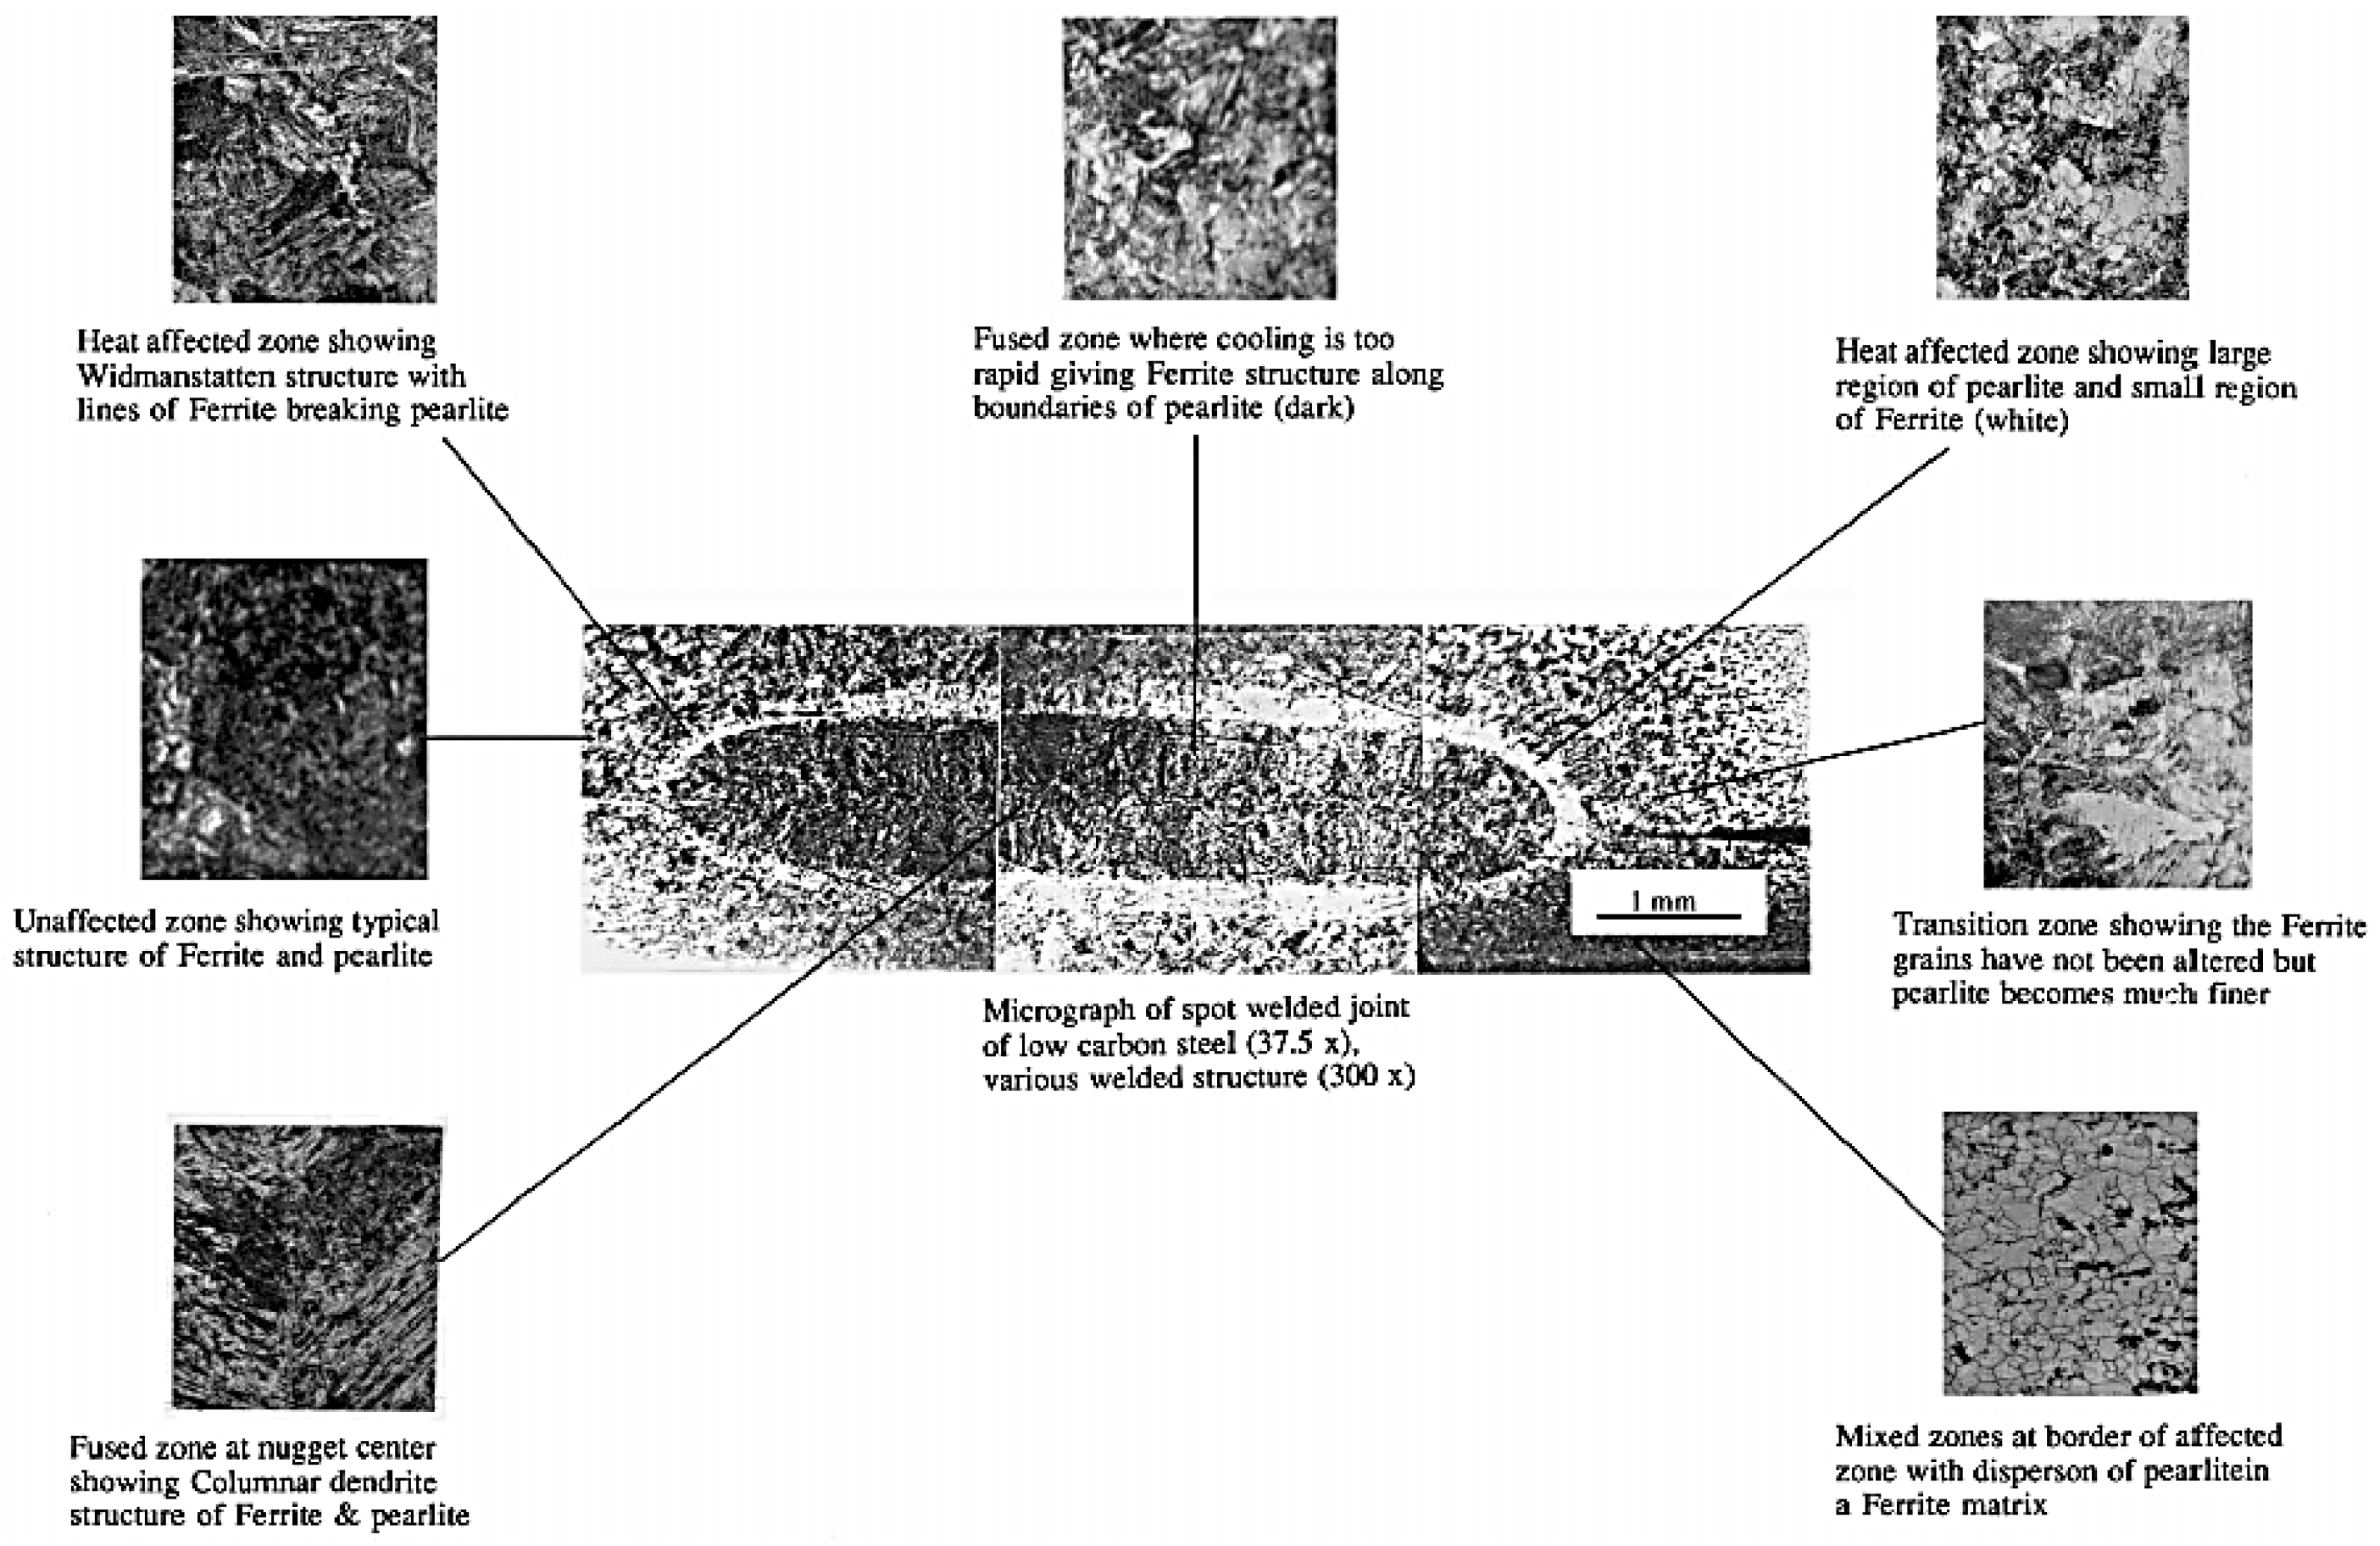
Figure 1. Microstructure of low-carbon steel spot weld joint [3].
Applmech 06 00079 g001
Figure 2. Lap-shear specimen design (a) dimensions and (b) actual photo.
Applmech 06 00079 g002
Figure 3. Spot weld impact test setup.
Applmech 06 00079 g003
Figure 4. Graph of spot weld failure modes.
Applmech 06 00079 g004
Figure 5. Graph of (a) nugget diameter vs. welding current and (b) impact energy vs. welding current.
Applmech 06 00079 g005aApplmech 06 00079 g005b
Figure 6. Graph of (a) nugget diameter vs. welding time and (b) impact energy vs. welding time.
Applmech 06 00079 g006
Figure 7. Graph of (a) impact energy vs. nugget diameter and (b) impact energy vs. nugget diameter deviation.
Applmech 06 00079 g007aApplmech 06 00079 g007b
Figure 8. (a) Three-dimensional surface plot and (b) contour plot for the impact energy vs. welding current and welding time.
Applmech 06 00079 g008
Table 1. Chemical composition of AISI 1010 low-carbon steel [9].
ElementContent (%)
Iron (Fe) 99.18 99.62
Carbon (C) 0.08 0.13
Manganese (Mn) 0.30 0.60
Sulfur (S) 0.05
Phosphorous (P) 0.04
Table 2. Physical and mechanical properties of AISI 1010 low-carbon steel [9].
PropertyValue
Density 7870   k g / m 3
Tensile Strength (Ultimate) 365   M P a
Tensile Strength (Yield) 305   M P a
Elastic Modulus (Young’s Modulus) 190 210   G P a
Shear Modulus 80   G P a
Elongation at break (in 50 mm) 20 %
Hardness, Vickers (after conversion from Brinell hardness)108
Table 3. Welding schedule for the resistance spot welding process.
Sample NumberWelding Current, I (kA)Welding Time, t (Cycles)
1–334
4–637
7–939
10–1244
13–1547
16–1849
19–2154
22–2757
25–2759
Table 4. Table of impact testing results.
SpecimenWelding Current (kA)Welding Time (Cycles)Impact Energy (J)Failure Mode
1.13430Interfacial
1.226Interfacial
1.326Interfacial
2.13729Interfacial
2.231Interfacial
2.334Interfacial
3.13928Interfacial
3.232Interfacial
3.335Interfacial
4.14437Interfacial
4.238Interfacial
4.335Interfacial
5.14740Interfacial
5.242Interfacial
5.339Interfacial
6.14944Interfacial
6.238Interfacial
6.342Interfacial
7.15471Interfacial
7.255Interfacial
7.381Interfacial
8.15798Pullout
8.268Interfacial
8.385Pullout
9.15970Interfacial
9.267Interfacial
9.371Interfacial
Table 5. Table of the average values for the impact energy, thickness, nugget diameter and critical nugget diameter.
Welding Current (kA)Welding Time (Cycles)Average Impact Energy (J)Thickness (mm)Nugget Diameter (mm)Critical Nugget Diameter (mm)
3427.3331.233.434.81
3731.3331.223.674.76
3931.6671.234.024.81
4436.6671.244.244.86
4740.3331.194.314.60
4941.3331.244.494.86
5469.0001.254.514.91
5780.3331.224.774.76
5969.3331.214.614.71
Table 6. Table of results from the analysis of variance.
SourceSum of SquaresDegree of FreedomMean SquareF-Valuep-Value Prob > F
Model1.850 × 10−353.700 × 10−482.15<0.0001
A—Welding Current1.777 × 10−311.777 × 10−3394.54<0.0001
B—Welding Time3.269 × 10−513.269 × 10−57.260.0136
AB1.295 × 10−511.295 × 10−52.870.1047
A21.787 × 10−511.787 × 10−53.970.0595
B21.634 × 10−511.634 × 10−53.630.0706
Residual9.459 × 10−5214.504 × 10−6
Lack of Fit3.169 × 10−531.056 × 10−60.210.8895
Pure Error9.142 × 10−5185.079 × 10−6
Corrected Total1.945 × 10−526
Table 7. Table of R-squared values and other statistical values.
TermValueTermValue
Standard Deviation2.122 × 10−3R-Squared0.9514
Mean0.024Adjusted R-Squared0.9398
Coefficient of Variation8.73Predicted R-Squared0.9157
PRESS1.640 × 10−4Adequate Precision24.030
Table 8. Table of values for the factor coefficient.
FactorCoefficient EstimateDegree of FreedomStandard Error95% CI Low95% CI HighVIF
Intercept0.02419.423 × 10−40.0220.027
A—Welding Current−9.969 × 10−315.019 × 10⁻⁴−0.011−8.925 × 10−31.01
B—Welding Time−1.348 × 10−315.002 × 10⁻⁴−2.388 × 10⁻³−3.074 × 10−41.01
AB1.032 × 10−316.086 × 10⁻⁴−2.337 × 10−42.298 × 10−31.01
A2−1.726 × 10−318.664 × 10⁻⁴−3.528 × 10−37.590 × 10−51.00
B21.730 × 10−319.085 × 10⁻⁴−1.591 × 10−43.620 × 10−31.01
Table 9. Table of the solutions from the optimization.
NumberWelding Current (kA)Welding Time (Cycles)Impact Energy (J)Desirability
156.72881.1240.766
256.75181.1230.766
356.70581.1230.766
456.60081.0930.765
556.56381.0740.765
656.98980.9970.764
756.21580.6350.759
857.27780.5640.758
957.51879.9750.750
1055.75479.3910.742
Disclaimer/Publisher’s Note: The statements, opinions and data contained in all publications are solely those of the individual author(s) and contributor(s) and not of MDPI and/or the editor(s). MDPI and/or the editor(s) disclaim responsibility for any injury to people or property resulting from any ideas, methods, instructions or products referred to in the content.