Article

Compressive Deformation Behavior of Artificial Pumice for Reinforcement of Existing Shelter Against Ballistic Ejecta of Volcanic Eruption

1
College of Design and Manufacturing Technology, Muroran Institute of Technology, 27-1 Mizumotocho, Muroran, Hokkaido 050-8585, Japan
2
Division of Information and Electronic Engineering, Muroran Institute of Technology, 27-1 Mizumotocho, Muroran, Hokkaido 050-8585, Japan
3
Asia Air Survey Co., Ltd., Shinyuri 21 Building, 1-2-2 Manpukuji, Asao-ku, Kawasaki, Kanagawa 215-0004, Japan
4
Department of Mechanical Engineering, National Defense Academy, 1-10-20, Hashirimizu, Yokosuka, Kanagawa 239-8686, Japan
*
Author to whom correspondence should be addressed.
Appl. Mech. 2025, 6(2), 43; https://doi.org/10.3390/applmech6020043
Submission received: 27 March 2025 / Revised: 27 May 2025 / Accepted: 5 June 2025 / Published: 8 June 2025

Abstract

:
The 2014 Mt. Ontake eruption in Japan highlighted the need for improved volcanic shelters. To contribute to their reinforcement, this study focuses on the energy absorption characteristics of pumice, particularly artificial pumice made from waste glass. Compression tests were conducted under unconfined and oedometric conditions using a universal testing machine, drop-weight testing machine, and split Hopkinson bar across a wide strain rate range (10−3 to 102 s−1). The deformation behavior was categorized into two types: one with a distinct initial peak followed by stress drop and another with a continuous transition to plateau deformation. Regardless of deformation type, the absorbed energy showed a positive dependence on strain rate. The average absorbed energy increased from approximately 1.6 MJ/m3 at 10−3 s−1 to over 4.3 MJ/m3 at 102 s−1. A simple predictive model was proposed to evaluate the energy absorption capacity of pumice reinforcement. The model’s predictions were in good agreement with experimental results for pumice layers up to 150 mm thick. These findings provide fundamental insights into the high strain rate behavior of artificial pumice and its potential application as a passive energy-absorbing material for impact-resistant volcanic shelters.

1. Introduction

On 27 September 2014, a volcanic eruption occurred at Mt. Ontake, along the border of Gifu and Nagano Prefectures in Japan. This eruption resulted in the deaths of numerous climbers near the summit (58 fatalities and 5 missing individuals). The main cause of casualties was the impact of volcanic blocks and lapilli (hereafter collectively referred to as ballistic ejecta) [1,2,3]. In the wake of this serious volcanic disaster, evacuation facilities, commonly referred to as volcanic evacuation shelters, have received a great deal of interest from both in Japan and abroad. All over the world, there has been an emphasis on the installation of robust volcanic shelters made of reinforced concrete or steel structures to withstand the impact of ballistic ejecta [4,5,6,7,8,9]. However, it is difficult to install such volcano shelters on high mountains, especially in terms of transportation. Therefore, approaches to reinforce existing mountain huts as volcanic evacuation shelters have attracted considerable attention. Regarding the improvement of the impact resistance of mountain huts, reinforcement methods using aramid fiber fabrics have been proposed [10]. Additionally, a simplified and cost-effective reinforcement method using combinations of wood materials for the roofs of wooden mountain huts has been reported as an alternative to aramid fiber fabric reinforcement [11].
As mentioned above, many methods of reinforcing shelters and mountain huts have been proposed, but additional reinforcement methods are needed because the damage from the ballistic ejecta can be devastating. Therefore, the installation of impact-absorbing materials on the roof of the evacuation facility as an additional reinforcement is being considered. In this study, we focused on artificial pumice made from waste glass, which is cheap and available in large quantities as an impact-absorbing material for additional reinforcement. This artificial pumice is an inorganic porous material made by pulverizing glass bottles, sintering, and foaming them. Due to this cellular structure, the artificial pumice is expected to have excellent impact absorption effects. Furthermore, even when installed on the roof of the evacuation facility, the artificial pumice looks almost like a stone, which aligns with the surrounding landscape. In terms of using pumice as an impact absorption material, there are few reports on the strength of pumice, which is a brittle material and has a cellular structure. For brittle materials without cellular structures, such as concrete and rock, numerous studies have been conducted on the effects of uniaxial constrained compression tests [12,13]. Recent investigations have further explored the influence of control modes and loading rates on the mechanical behavior of various rock types, including gray sandstone, red sandstone, mudstone, and granite [14]. Additionally, research on rock-like specimens with prefabricated cracks under varying strain rates has provided insights into the strain rate sensitivity of such materials, which is crucial for understanding their impact absorption capabilities [15]. Furthermore, several studies have reported on the mechanical properties of lightweight concrete using volcanic pumice as coarse aggregate, including evaluations of compressive and tensile strengths [16,17,18,19]. These studies suggest that the porous nature of pumice contributes to both the lightweight characteristics and energy absorption capacity of the material, providing valuable insights for understanding the mechanical behavior of artificial pumice examined in this study. In addition, recent work on microconcrete under dynamic loading conditions has demonstrated the importance of strain-rate-sensitive deformation mechanisms and energy dissipation characteristics, which are highly relevant to the present study [20,21]. For cellular structures that are not brittle materials, there are many reports on their impact absorption properties [22,23]. For instance, polymeric foams such as polymethacrylimide (PMI) exhibit excellent energy absorption and thermal insulation capabilities, making them suitable for applications in the automotive and aerospace sectors [24]. In addition, a wide variety of polymeric foams—including polyethylene (PE), polyurethane (PU), and ethylene-vinyl acetate (EVA)—have been shown to achieve excellent energy absorption through optimization of their cell morphology, relative density, and strain rate sensitivity, making them widely applicable in protective and structural energy dissipation systems [25]. However, there is little discussion on porous brittle materials, and testing methods for such materials have not been well established. Many natural porous volcanic ejecta, such as pumice and scoria, exist around active volcanoes, and there have been several reports on their geotechnical properties [26]. However, the stress–strain relationship at high strain rates and the impact absorption capacity considering strain rate dependence are not sufficiently clarified. Therefore, this study aims to evaluate the impact compression deformation behavior of artificial pumice and clarify its deformation mechanism, energy absorption capacity, and strain rate dependency. Three different testing methods were employed to conduct compression tests at various strain rates under unconfined and oedometric conditions, and the absorbed energy dependence on the strain rate for artificial pumice was evaluated. Moreover, based on the compressive properties and strain rate dependence of the artificial pumice obtained, we attempted to predict the effect of artificial pumice reinforcement on the penetration resistance of mountain hut roofs.

2. Materials and Methods
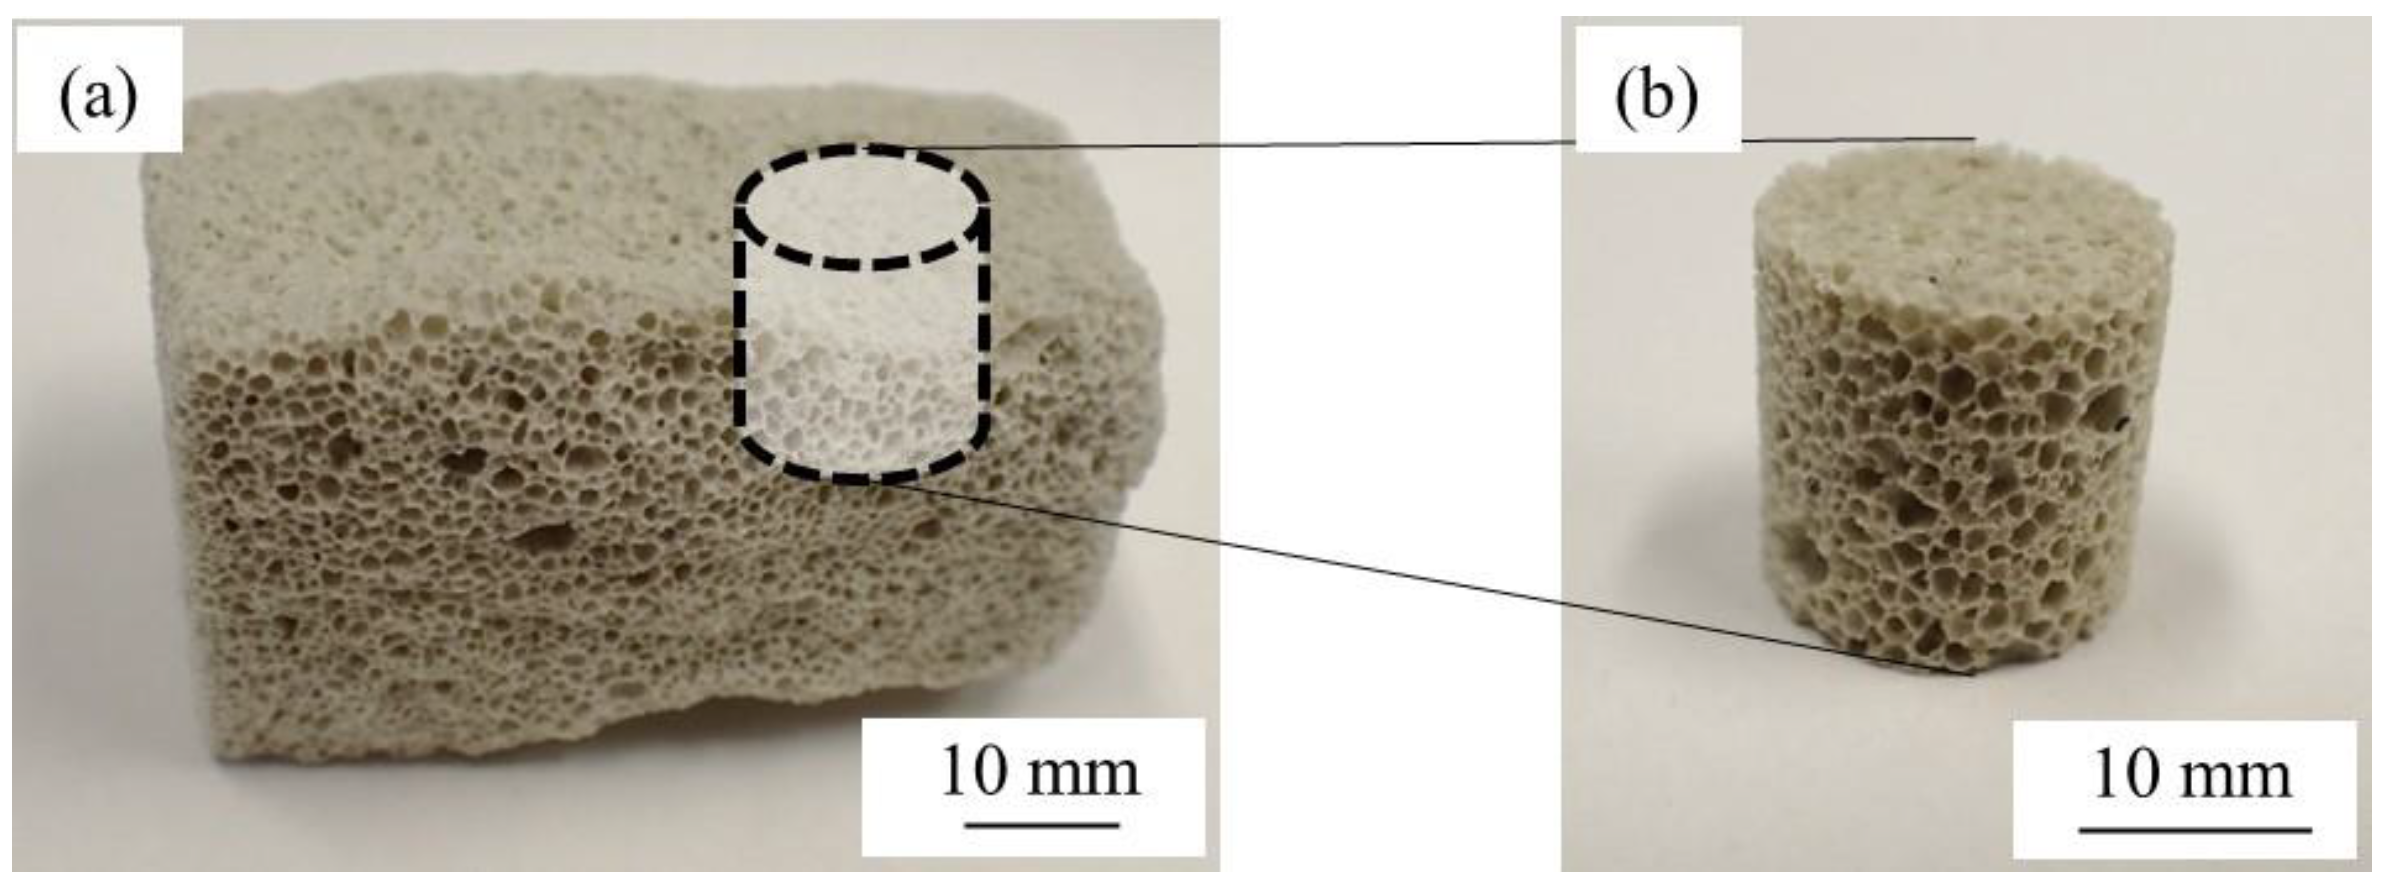
2.1. Materials

Artificial pumice (Super Sol L1, Glass Foam Business Cooperative), which is commercially available in Japan, was used in this study (Figure 1a). The main components of the prepared artificial pumice are SiO2, CaO, and Na2O. The measured densities of the materials used in this study were 268–357 kg/m3. The specimen was cut from artificial pumice using a cork borer and then cut so that the two end faces were parallel using an abrasive cutting machine, resulting in a diameter of approximately 16 mm and a height of approximately 16 mm (Figure 1b) for the unconfined and oedometric compression tests. Each specimen was prepared from a single grain of artificially produced pumice, which has an irregular and random shape. Due to the absence of any identifiable directional structure, it was not possible to control or assess anisotropy in the cutting process. Therefore, all specimens were cut without directional alignment. The pore structure of the artificial pumice is inherently heterogeneous, exhibiting a wide distribution in pore sizes, as seen in Figure 1. Although some variation in measured density was observed, all specimens used in this study were carefully selected from a large number of fabricated samples to ensure consistent volume. This approach was intended to minimize the influence of volume differences on the measured densities. Unprocessed artificial pumice (Figure 1a) was used for the simulated ballistic ejecta impact test described below.

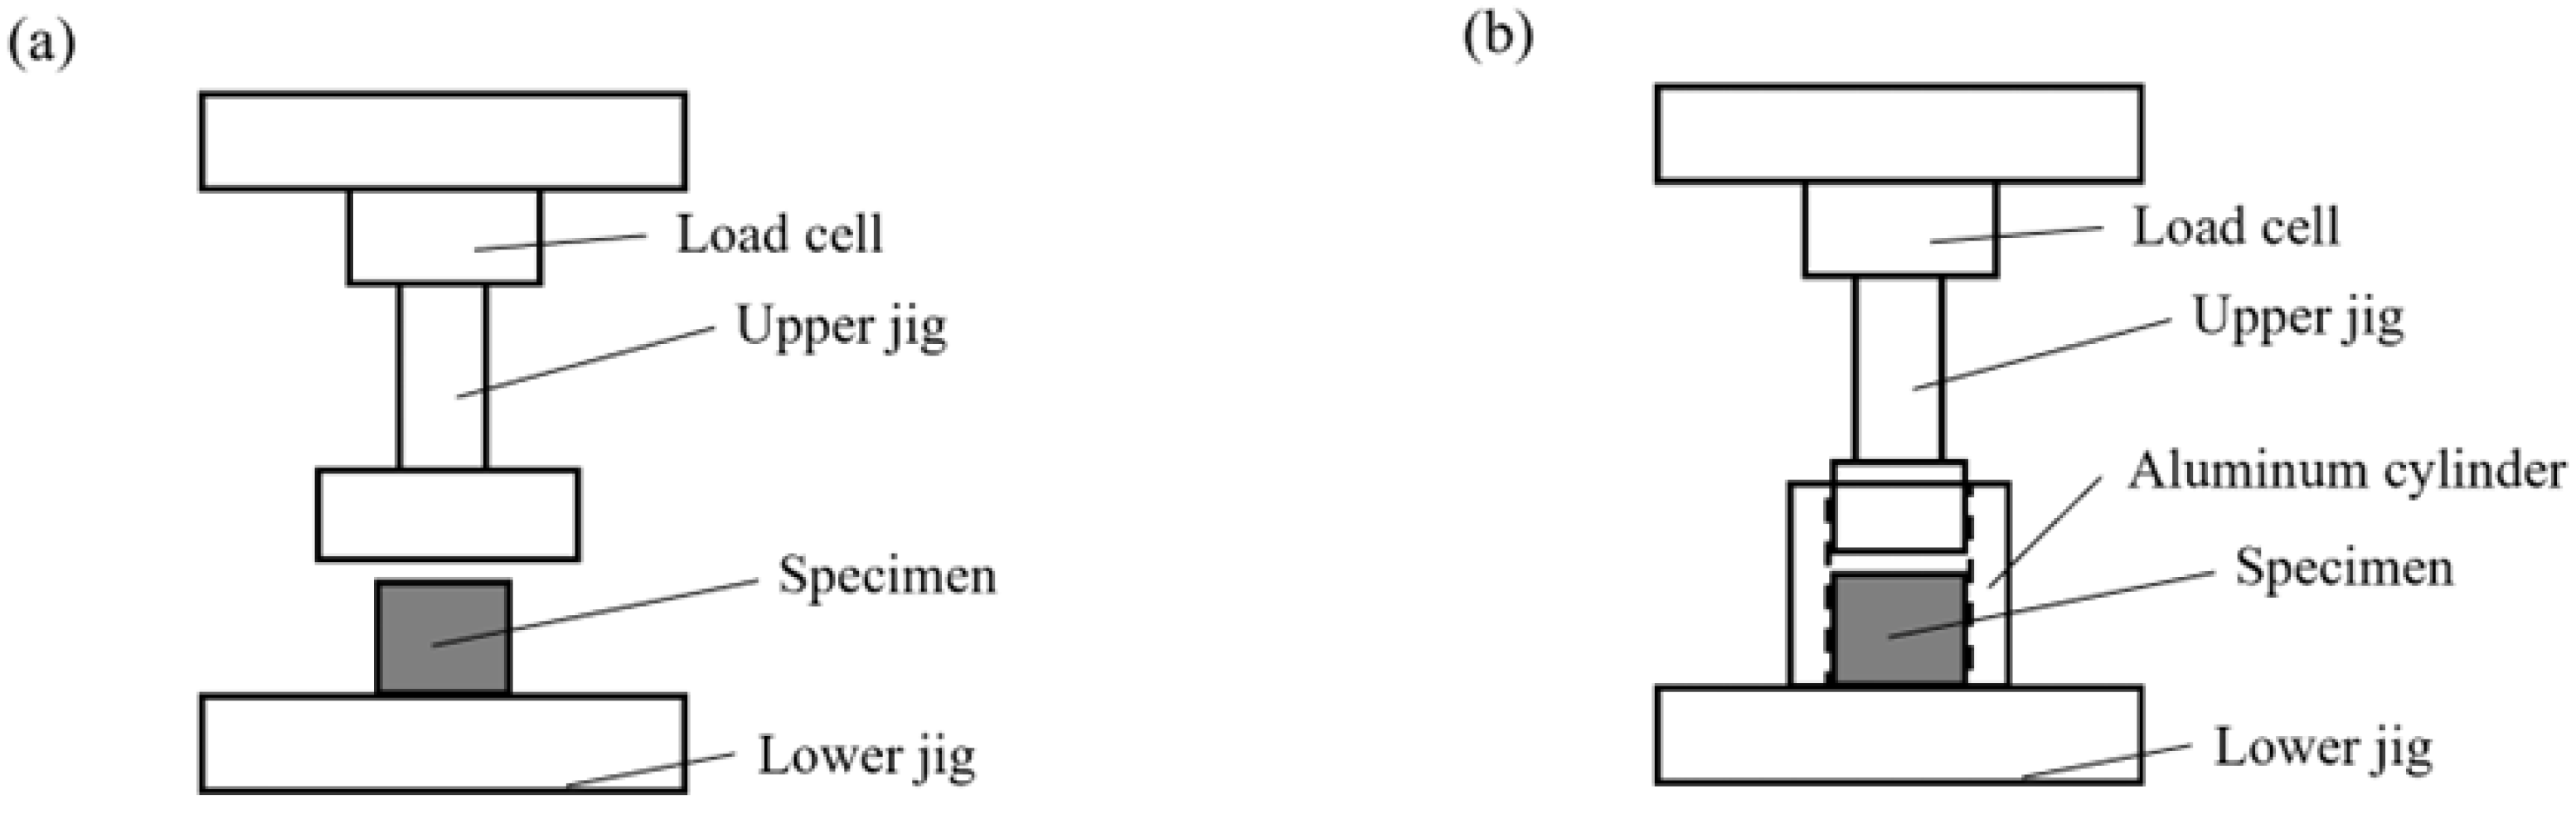
2.2. Quasi-Static Tests Under Unconfined and Oedometric Conditions

The quasi-static compression tests were conducted using a universal testing machine (model 5566, Instron) at strain rates of 1.0 × 10⁻³, 1.0 × 10⁻², and 1.0 × 10⁻¹ s−1 under each condition, with the crosshead speeds set to 0.016, 0.16, and 1.6 mm/s, respectively. Figure 2 shows a schematic view of the universal testing machine used for quasi-static tests. These tests were performed three times for each strain rate. For the quasi-static tests under oedometric conditions, an aluminum cylinder with an inner diameter of 16 mm and an outer diameter of 22 mm was used as the confinement vessel, with the specimen placed inside the cylinder, as shown in Figure 2b.

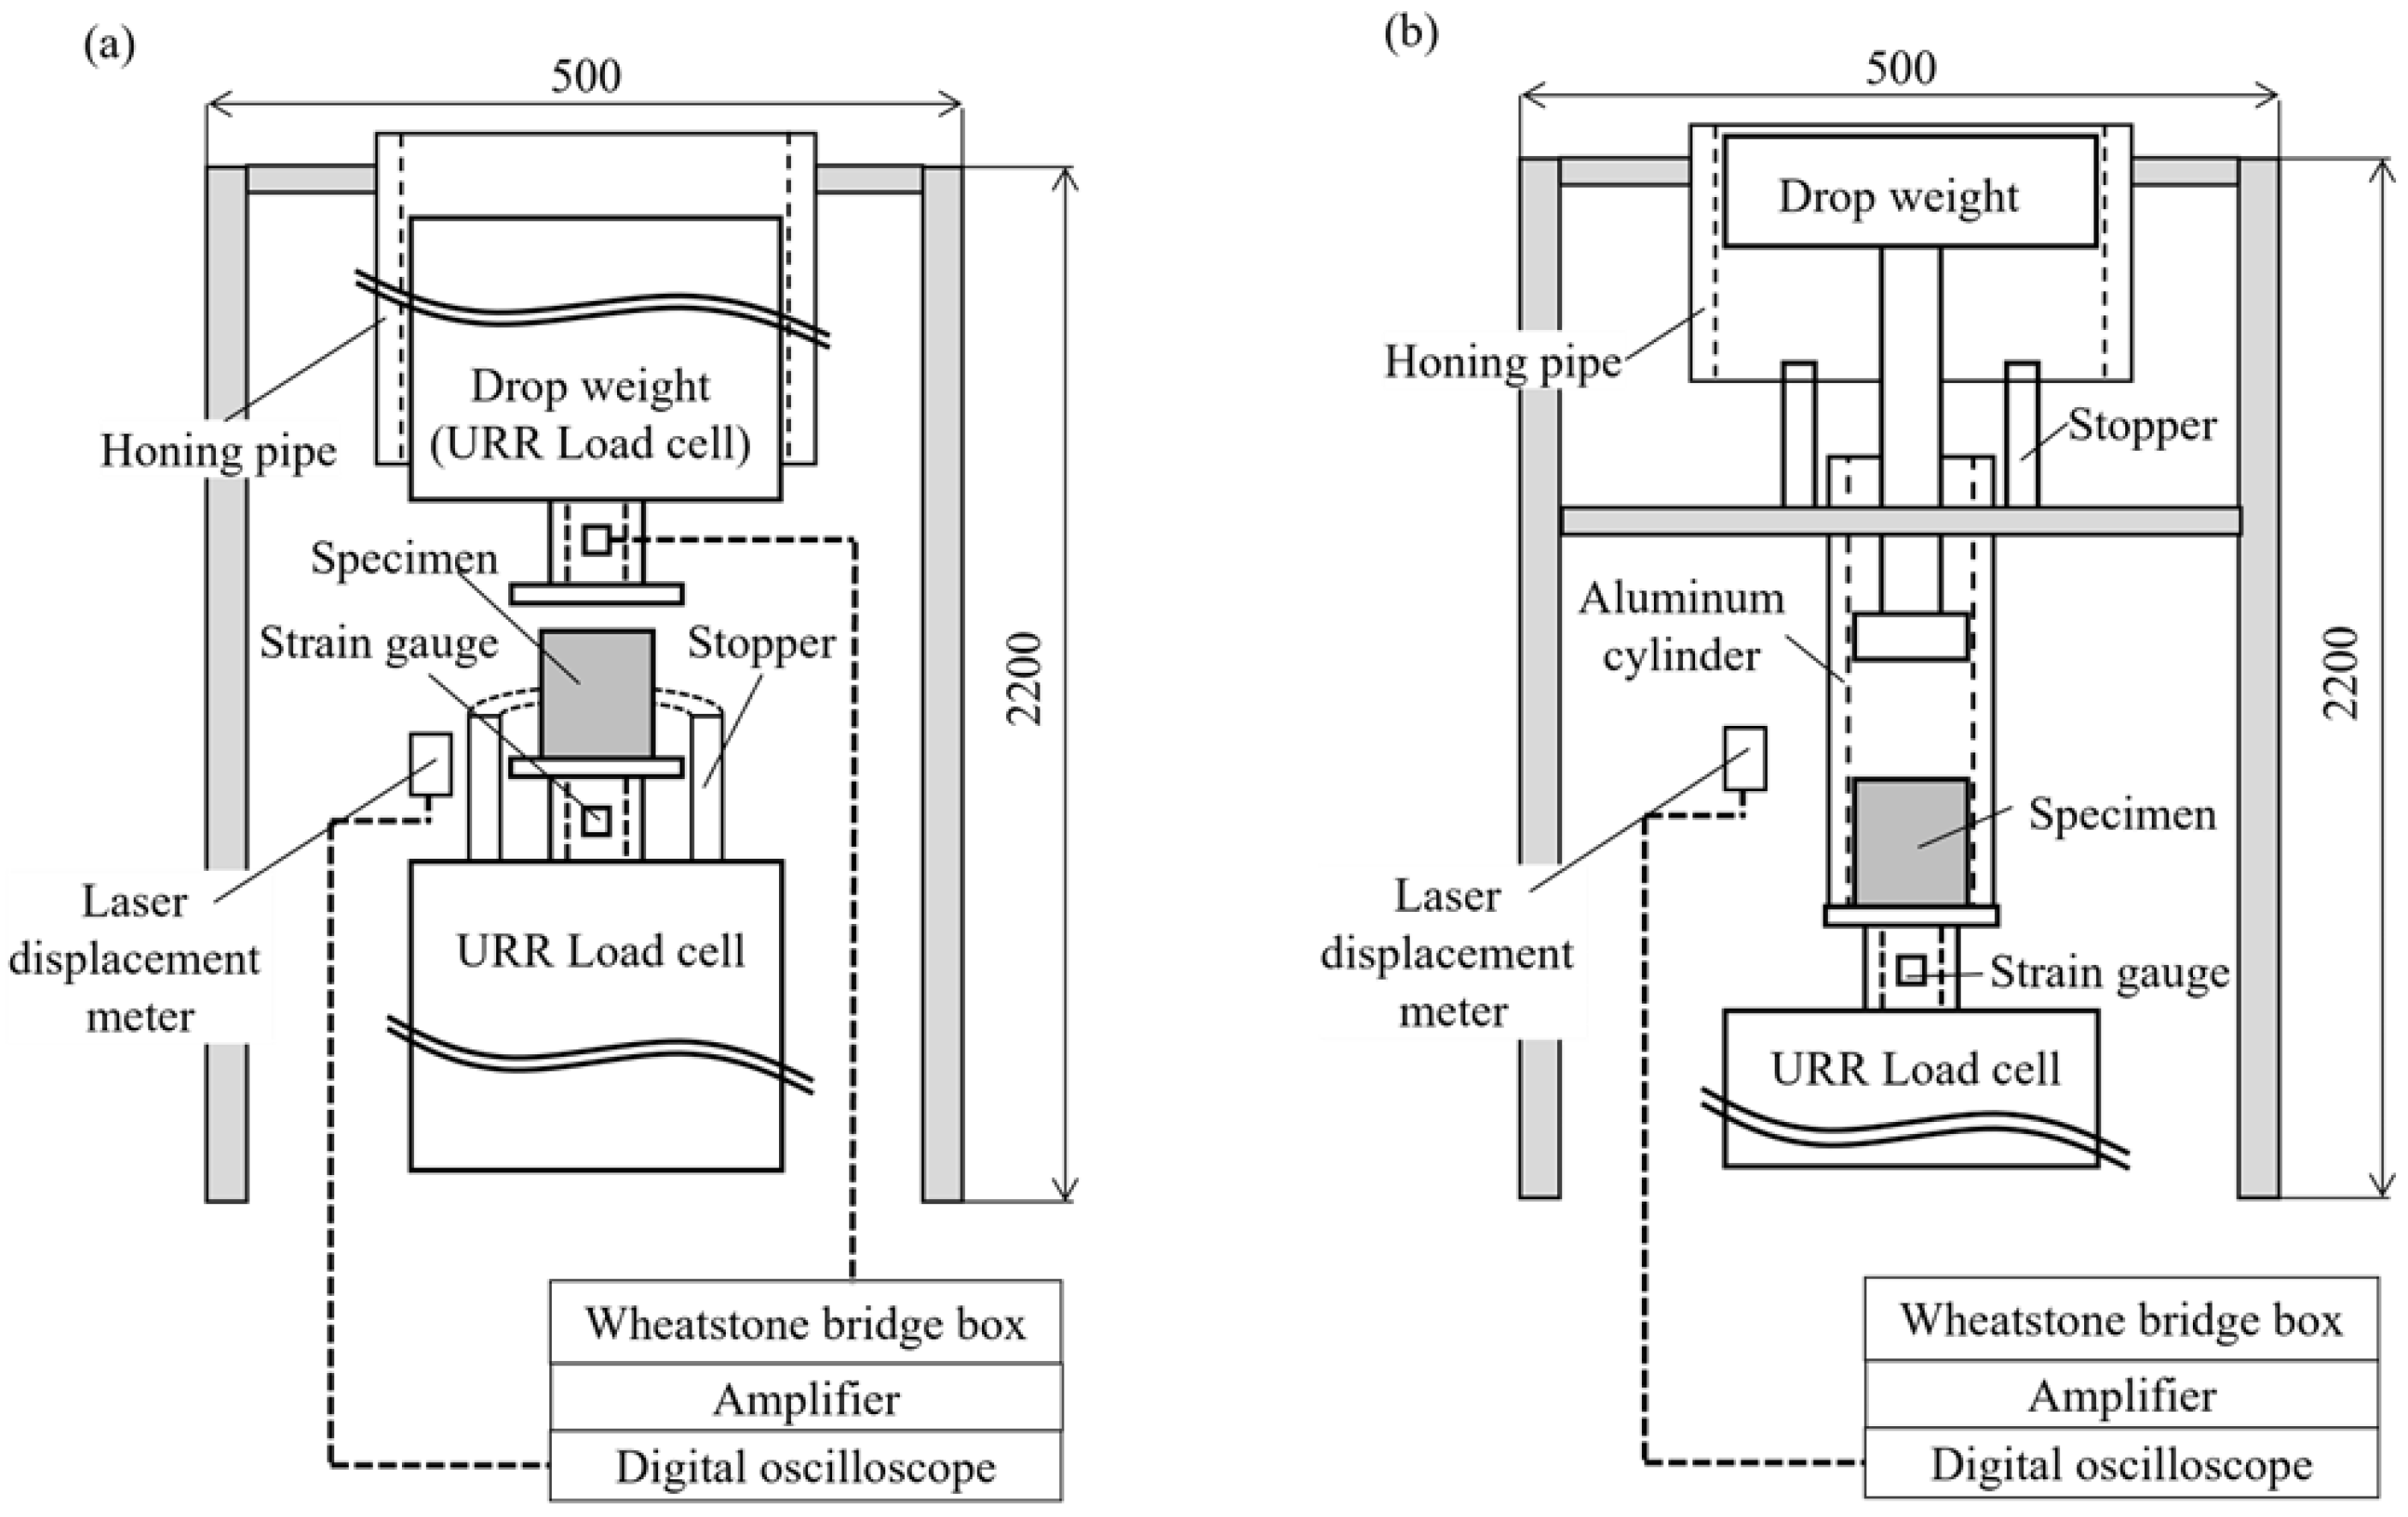
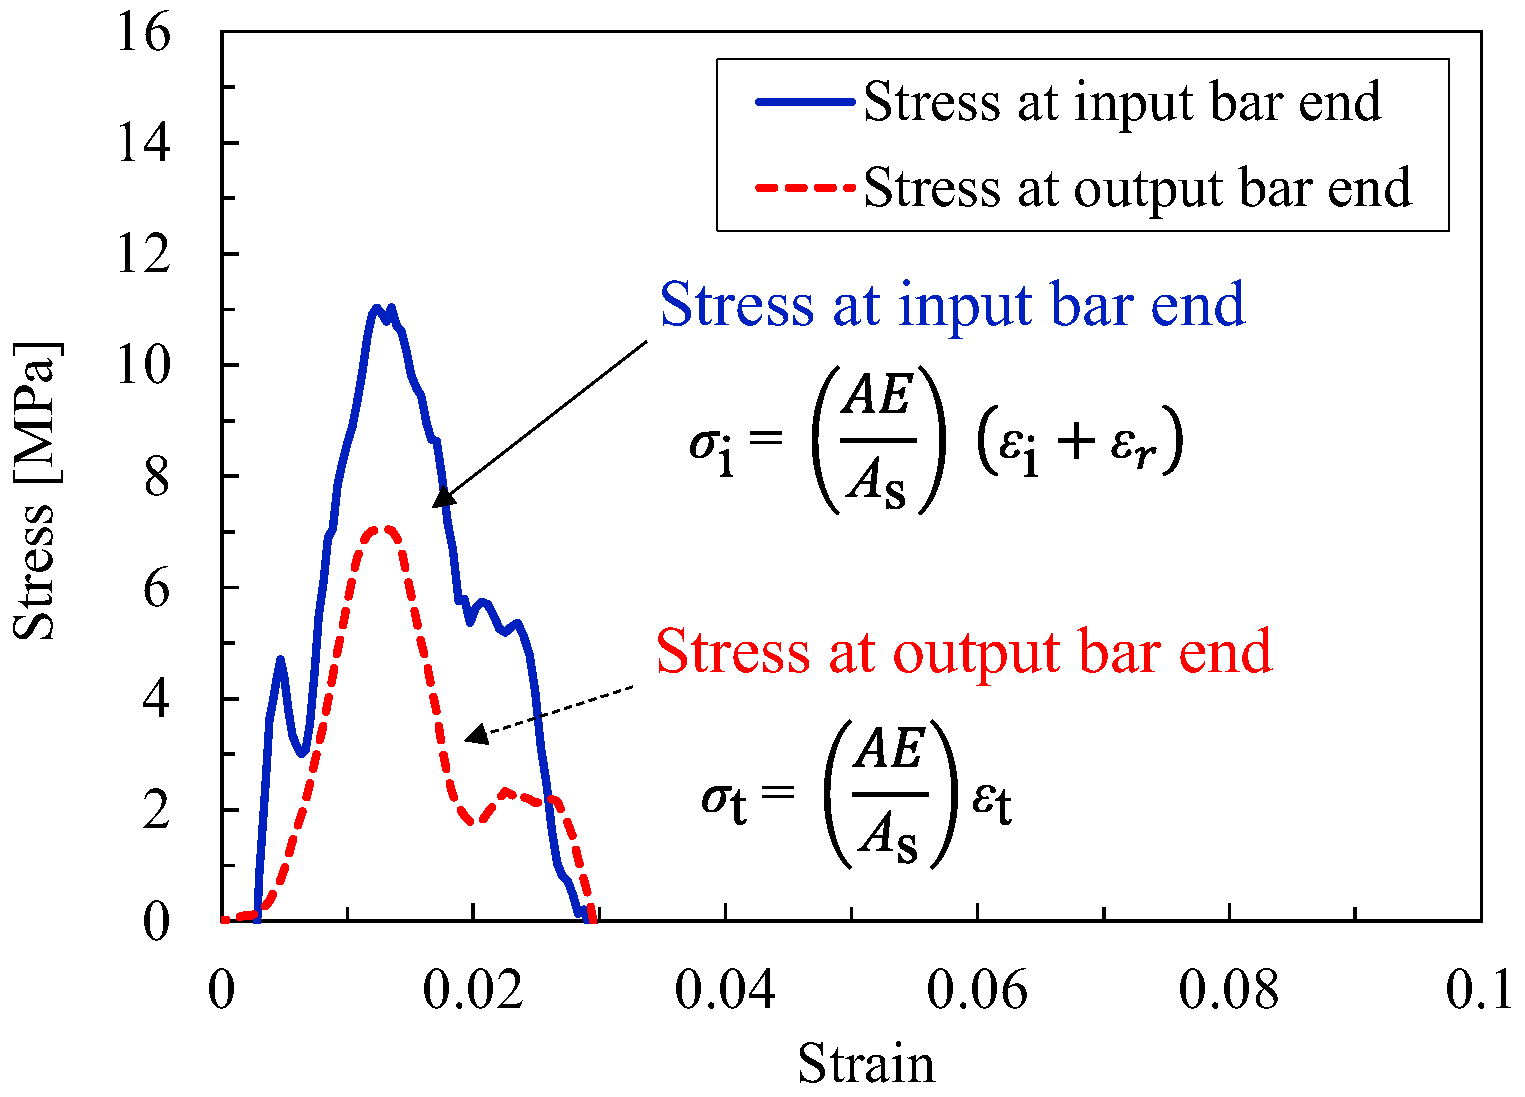
2.3. Dynamic Tests Under Unconfined and Oedometric Conditions

The dynamic compression test was performed at a strain rate of 101 s−1 using a drop-weight testing machine [27]. To minimize the influence of reflected stress waves, a universal rate range (URR) load cell was utilized to measure the specimen load with high sensitivity [27]. The setup of the drop-weight testing machine for the dynamic compression test is shown in Figure 3. In the unconfined condition tests, the load cell was used as the drop weight, enabling the evaluation of stress equilibrium in the specimen by recording the load histories at both the upper and lower ends of the specimen. On the other hand, in the oedometric condition tests, a metal block was used as the drop weight, allowing only the output from the lower load cell to be obtained. The confinement cylinder used was the same aluminum cylinder as in the quasi-static tests. The recording system for this machine consisted of a Wheatstone bridge box, a differential amplifier (5305, NF Corporation, Yokohama, Japan), and a digital oscilloscope (DL950, Yokogawa Test & Measurement Corporation, Tokyo, Japan). The displacement of the drop weight was measured using a laser displacement meter (LK-H025, KEYENCE Co., Ltd., Osaka, Japan) with a sampling rate of 100 kHz, a resolution of up to 0.02 μm, and linearity within ±0.02% of full scale. The dynamic compression test was conducted at an approximate strain rate range of 5.0 × 101~9.0 × 101 s−1. The deformation behavior of the specimen during the test was captured using a high-speed camera (HX-3, nac Image Technology Inc., Tokyo, Japan) at a frame rate of 10,000 fps, a shutter interval of 20.0 µs, and an image size of 960 × 936 pixels.

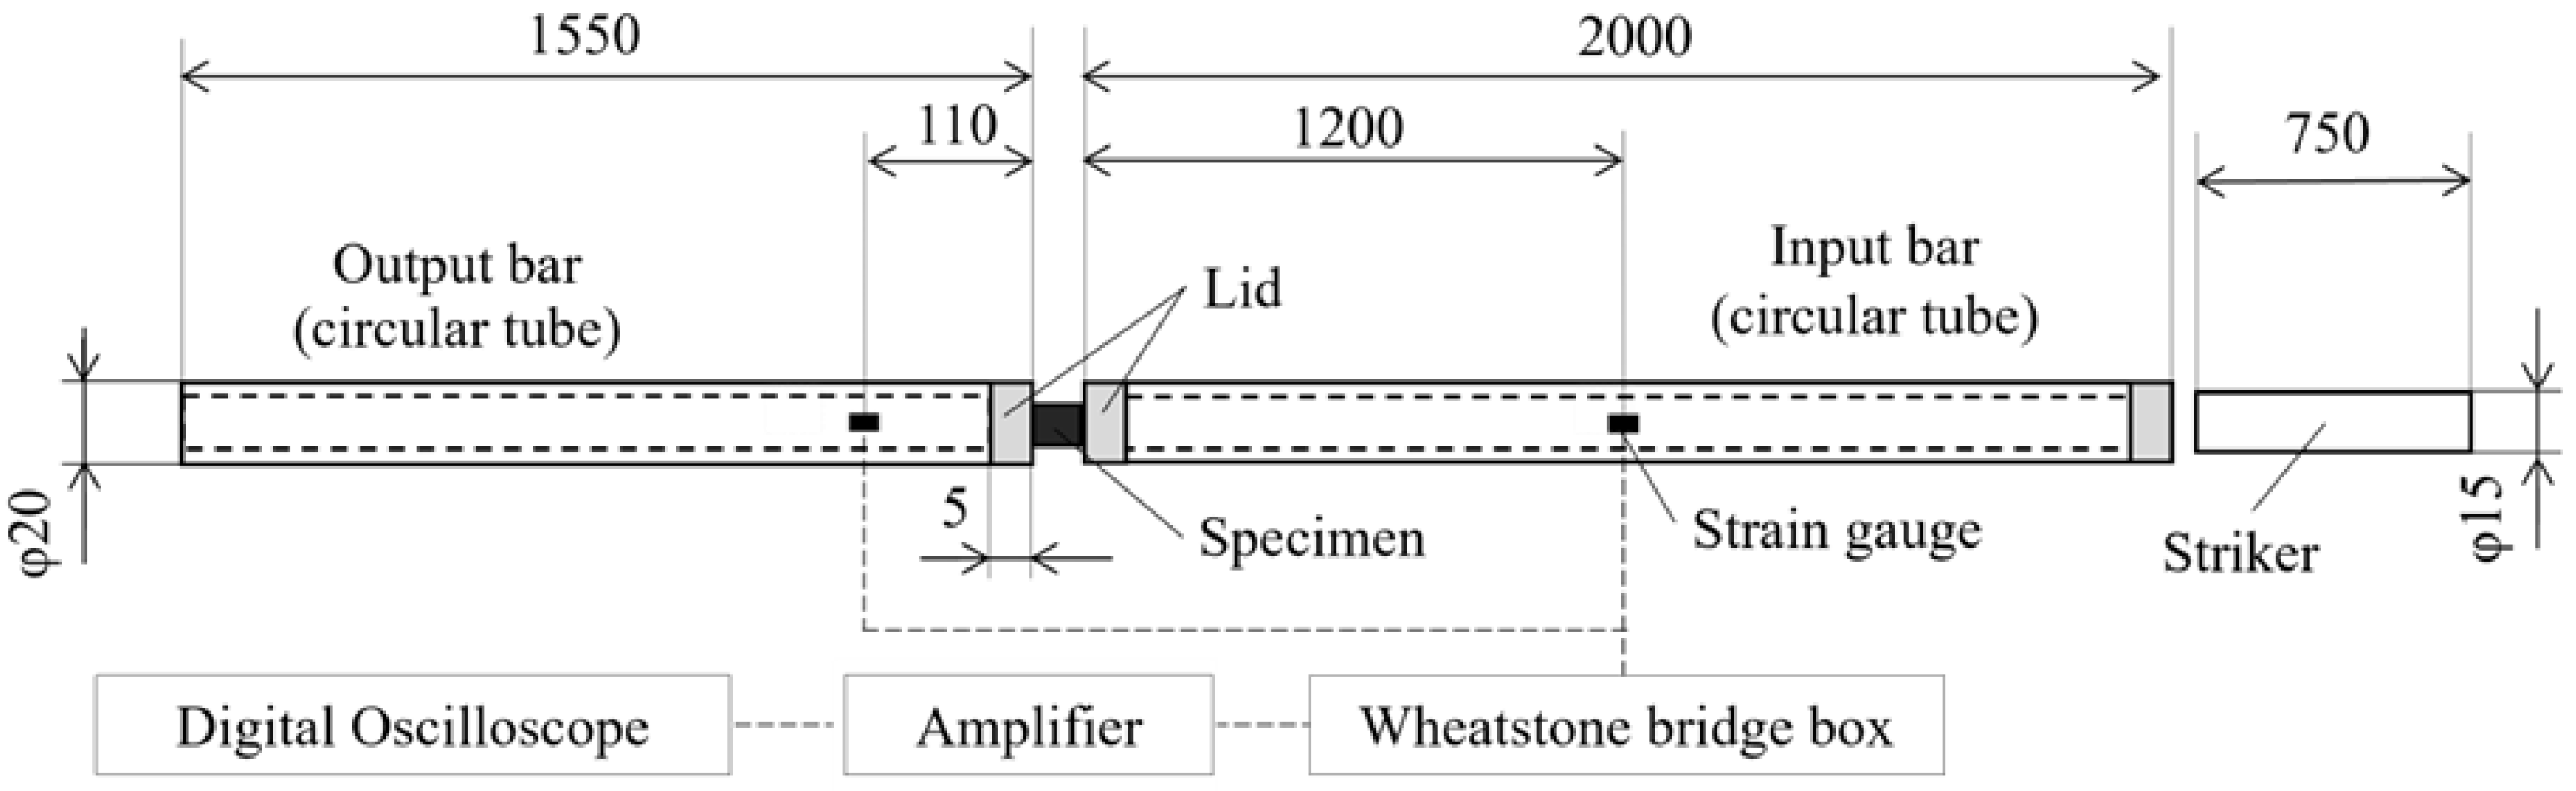
2.4. Impact Test Under Unconfined Conditions

The impact compression test was conducted using the split Hopkinson bar (SHB) method [28,29] at a strain rate greater than 102 s−1. The impact test was conducted only under unconfined conditions. In this study, input and output bars with circular tubes that can detect elastic stress waves with high accuracy were used to evaluate artificial pumice that deforms and fractures at low loads. Figure 4 shows the setup of the SHB apparatus for the impact compression test, consisting of a striker, an input bar, and an output bar. The input and output bars were made of SUS304 stainless steel (ISO 4301-304-00-I) tubes with an outside diameter of 20 mm and an inside diameter of 16 mm. The striker was made of 2024 aluminum alloy with a diameter of 15 mm. A lid, 20 mm in diameter, was attached to both ends of the input bar and to the specimen side of the output bar. The stress wave propagating from the input bar, through the specimen, and to the output bar was measured by semiconductor strain gauges (KSP1-350-E4, gauge factor 164, Kyowa Electronic Instruments Co., Ltd., Tokyo, Japan) attached to the input and output bars. The measurement system was identical to that used in the dynamic tests. By applying the fundamental one-dimensional elastic wave propagation theory, the nominal stress at the input bar end of the specimen σi(t), the nominal stress at the output bar end of the specimen σt(t), the strain rate ε ˙ (t), and the nominal strain ε(t) of the specimen can be determined as follows:
σ i ( t ) = AE A s ε i ( t ) ε r ( t ) ,
σ t ( t ) = AE A s ε t ( t ) ,
ε ˙ ( t ) = 2 C L s ε i ( t ) ε t ( t ) ,
  ε ( t ) = 2 C L s 0 t ε i ( t ) ε t ( t ) ,
where A, E, and C are the cross-sectional area, Young’s modulus, and velocity of the elastic wave in the input and output bars, respectively. εi, εr, and εt denote the strains of THE incident wave, reflected wave, and transmitted wave. As and Ls are the cross-sectional area and the length of the specimen. The cross-sectional area used to calculate stress was defined based on the bulk dimensions of the specimen, without accounting for the individual cell structure. The impact compression test was performed at a typical initial strain rate of approximately 4.0 × 10² s−1. The strain rate ε ˙ is defined as the rate of change in strain with respect to time. In the context of this experiment, it can also be approximated by dividing the deformation velocity by the initial length of the specimen.

3. Results and Discussion

3.1. Compressive Deformation Behavior of Artificial Pumice Under Unconfined Conditions

Figure 5 shows typical stress–strain relationships for artificial pumice in quasi-static tests at strain rates of 1.0 × 10⁻³ and 1.0 × 10⁻¹ s−1 under unconfined conditions. The results shown here represent typical responses confirmed through repeated tests, which exhibited consistent trends despite some variability. Since artificial pumice is a brittle material, a rapid decrease in stress was observed beyond a strain of 0.1 in all tests due to the scattering of the specimen. Therefore, the test results under unconfined conditions were evaluated only up to a strain of 0.1, focusing on the initial deformation behavior. In this study, the initial deformation behavior of artificial pumice is classified into two distinct deformation and fracture phenomena. We define the first as phenomenon A (Figure 5), characterized by a large peak of elastic response in the initial stage, followed by a significant drop in stress. The second, referred to as phenomenon B (Figure 5), exhibits no initial peak and shows a smooth transition to plateau deformation after the elastic region. These phenomena were observed in all quasi-static tests regardless of the strain rate. Furthermore, regarding the incidence of these phenomena, phenomenon A was identified nine times out of 14 tests, and phenomenon B was identified 5 times.
Figure 6 shows two types of deformation and fracture at a strain rate of 1.0 × 10⁻³ s−1, as recorded by the digital video camera. In phenomenon A, the load-bearing structure was fractured by the propagation of numerous large cracks immediately after the onset of compression. This is assumed to cause the decrease in stress after the peak value. However, since the specimen does not collapse completely, the stress does not reach zero, and deformation continues at low stress. On the other hand, in phenomenon B, intermittent localized fracture occurred from one end face of the specimen. This localized fracture did not lead to the complete collapse of the specimen and, thus, did not result in a significant decrease in stress after the elastic response. While this behavior is similar to the energy absorption mechanisms observed in cellular structures made of ductile materials (e.g., sequential buckling of honeycombs), it differs in that the locally fractured parts scatter around the surroundings. The scattering of fractured specimens causes a loss of stress, making it difficult to evaluate the stress–strain relationship up to the densification accurately.
Figure 7 and Figure 8 show the typical stress–strain relationships and deformation behaviors of artificial pumice under unconfined conditions at the dynamic strain rate of 5.0 × 101 s−1, with the results obtained using the drop-weight testing machine. The dashed and solid lines in Figure 7 indicate the stress obtained from the top and bottom ends of the specimen, respectively. Similarly to the quasi-static tests, two deformation and fracture phenomena were observed in the dynamic tests. Unlike the quasi-static test, the stress was almost zero immediately after the peak and hardly increased thereafter in phenomenon A. When the high-speed camera recorded this fracture, it was observed that the entire specimen collapsed quasi-instantaneously, as shown in Figure 8. As a result, it can be concluded that the load-bearing capacity was lost. Hereafter, this phenomenon is defined as phenomenon A’. It was confirmed that the stress equilibrium at both ends of the specimen (upper and lower stress) was almost achieved in phenomenon A’, although there was a slight difference at the peak. In addition, it was found that phenomenon B exhibited the same deformation behavior as in the quasi-static test. It is observed that, in all instances of phenomenon B during dynamic tests, the stress equilibrium at both ends of the specimen is slightly higher at the upper stress during deformation. This is due to the sequential fracture from the upper-end surface, resulting in a gradual decrease in stress on the fracture side. In the dynamic testing, in terms of the incidence of the two phenomena, phenomenon A was identified five times out of 7 tests, and phenomenon B was identified in two out of seven tests.
Figure 9 shows a typical stress–strain relationship for artificial pumice obtained from an impact test conducted using the SHB method under unconfined conditions at a strain rate of approximately 4.0 × 10² s−1. In the impact test, unlike the quasi-static and dynamic tests, phenomenon B was not observed in the eight tests, and only phenomenon A’, where the stress became almost zero immediately after the peak, was observed. Furthermore, using Equations (1) and (2) to compare the stress states at both ends of the specimen, it was found that the stress equilibrium at both ends was not achieved from the early stages of deformation.
Two distinct deformation and fracture behaviors were identified from the compression test results: phenomenon A, characterized by a pronounced elastic peak followed by a significant stress decrease, and phenomenon B, marked by a transition to plateau deformation without a peak. The incidence ratio of phenomenon A was found to be approximately twice as much as phenomenon B. Additionally, when the strain rate exceeded 102 s−1, phenomenon B did not occur, and it became evident that phenomenon A became dominant. In both cases, the scattering of fractured fragments makes it difficult to track the stress–strain relationship of the specimen over a long period of time. Therefore, to track the stress–strain relationship over a longer period of time and to evaluate the densification phenomenon of the specimen, we will focus on the test results under oedometric conditions.

3.2. Compressive Deformation Behavior of Artificial Pumice Under Oedometric Conditions

Figure 10 shows typical stress–strain relationships for artificial pumice in quasi-static and dynamic tests at strain rates of 1.0 × 10⁻³, 1.0 × 10⁻², 1.0 × 10⁻¹, and 9.5 × 101 s−1 under oedometric conditions. Due to the confinement provided by the cylinder, the specimen remains inside the cylinder even after fracture. As a result, a deformation process consisting of three stages—elastic region, plateau region, and densification—was observed. These three deformation processes are commonly observed in the compressive behavior of cellular structures [30]. Additionally, similarly to the test results derived from testing under unconfined conditions, the two phenomena occurring in the early stages of deformation were observed at all strain rates.
Here, e, defined as the absorption energy per unit volume of artificial pumice, was calculated as the integral of the stress–strain curve up to densification, as expressed by the following equation.
    e = 0 ε σ ( ε ) d ε ,
where the interval of integration for strain ε was calculated as the strain until densification. The average absorption energy per unit volume is shown in Table 1. It was observed that the energy absorption per unit volume increased as the strain rate increased. This trend was generally observed similarly across different phenomena.
The relationship between the absorbed energy per unit volume and the strain rate for artificial pumice is shown in Figure 11. It was shown that the absorbed energy per unit volume exhibited a positive strain rate dependence. The variability in the test results is considered to arise from the randomness of the pore structure in artificial pumice. To represent this strain rate dependence as a constitutive relation, the Cowper–Symonds equation [31] shown below was utilized. While the Cowper–Symonds equation is generally used to describe the strain rate dependence of the flow stress σ, it was applied in this study to the absorbed energy per unit volume e.
    e   = e s 1 + ε ˙ γ m ,
where e s indicates the absorbed energy per unit volume as the strain rate approaches infinitesimally close to zero, ε ˙ indicates the strain rate, and m and γ are material constants. The parameters m, and γ were determined through parameter fitting using the least squares method, with the values obtained being m = 0.25, and γ = 17.99. The solid line in Figure 11 shows the relationship between the absorbed energy per unit volume and the strain rate obtained by applying the calculated parameters to Equation 6. Using Equation (6), it became possible to predict the absorbed energy per unit volume during the compression of artificial pumice.

4. Effect of Artificial Pumice Reinforcement on Penetration Resistance of Mountain Hut Roofs

Based on the strain rate dependence of artificial pumice obtained in the previous chapter, we attempt to predict the effect of artificial pumice reinforcement on the penetration resistance of mountain hut roofs.

4.1. Reinforcement Effect of Artificial Pumice Obtained by Full-Scale Penetration Test

Our research group has previously investigated the penetration resistance of mountain hut roofs reinforced with artificial pumice [10,32]. In previous full-scale experiments simulating the impact of ballistic ejecta, we utilized a pneumatic impact test apparatus. In this system, a cylindrical projectile is accelerated by compressed air and directed toward the target. The impact velocity can be controlled by adjusting the air pressure supplied to the launch chamber. This test apparatus can evaluate the penetration resistance of the target by projectiles. In the penetration tests, simulated ballistic ejecta were used as projectiles (vitrified grinding wheel, density: 2400 kg/m3); these ejecta had a diameter of 128 mm and a mass of 2.66 kg. The target was a simulated mountain hut roof reinforced with artificial pumice. The simulated roof structure of the mountain hut is composed of cedar boards with dimensions of 750 mm (width) × 750 mm (length) and a thickness of 18 mm. This cedar board was clamped and fixed between iron frame fixtures with outer dimensions of 750 mm × 750 mm and inner dimensions of 450 mm × 450 mm. Sandbags filled with unprocessed artificial pumice were used to reinforce the simulated roof structure of the mountain hut, as shown in Figure 1a. As mentioned above, the material of the artificial pumice is the same as that used in the compression test. The layer thickness of the artificial pumice was continuously varied within the range of approximately 0 mm to 210 mm.
The relationship between impact energy and layer thickness of artificial pumice obtained from the above penetration test results [32] is shown in Figure 12. The scatter in the test results may be attributed to multiple factors, including slight variations in the impact angle of the projectile, the flatness of the artificial pumice surface, and the inherent randomness in the packing configuration of the pumice particles. The symbol “○” indicates that the specimen was not penetrated, and the symbol “×” indicates that the specimen was penetrated. In addition, the average value of the minimum impact energy under the penetrated condition and the maximum impact energy under the non-penetrated condition was defined as the ballistic limit energy, which is indicated by the red solid line in Figure 12. It is confirmed that increasing the layer thickness of the artificial pumice increases the ballistic limit energy. Since the ballistic limit energy without reinforcement is approximately 1300 J [10], it was observed that the impact absorption capacity of artificial pumice E was found to be approximately 1500 J for a layer thickness of about 100 mm and approximately 3000 J for a layer thickness of about 200 mm.

4.2. Prediction of Impact Absorption Properties of Artificial Pumice

Figure 13 shows a schematic diagram of the impact in a full-scale penetration test. Here, the energy absorption capacity of the artificial pumice filled in the cylinder in Figure 13 is defined as the energy absorption capacity due to reinforcement and is predicted using Equation 6. The strain rate ε ˙ is calculated as follows using the impact velocity v and the layer thickness of the artificial pumice t.
    ε ˙ = v t
Assuming that the pumice is compressed within the projectile diameter rather than scattered due to the high impact velocity of the projectile, resulting in a constrained state, the volume of the artificial pumice filled in the cylinder V is calculated as follows.
    V = 1 4 π d   2 tD ,  
where D is the spatial density constant, which indicates the packing rate of the artificial pumice for an arbitrary volume. To calculate D, artificial pumice was filled in multiple containers with different volumes, and the relationship between the mass of the filled pumice and the density of the artificial pumice was used. Figure 14 shows the relationship between the volume of artificial pumice and the volume of space in the impact area. From Figure 14, D was determined to be 0.458 ± 0.009 for the artificial pumice used in this study.
The energy absorption capacity of the artificial pumice packed in the cylinder in Figure 13 was calculated by multiplying the energy per unit volume e (Equation (6)) and the volume of the pumice V (Equation (8)), as shown in the following equation.
      E = e V = 1 4 π d   2 tD e s 1 + v γ t m ,
In this equation, the strain rate is replaced by Equation (7). The calculated E is defined as the predicted absorbed energy with artificial pumice reinforcement.
The predicted absorbed energy with artificial pumice reinforcement, calculated using the above procedure, is indicated by the blue solid line in Figure 12. It was found that the predicted results were in good agreement with the experimental results for layer thicknesses up to 150 mm. Therefore, it is important to take into account the effect of strain rate when calculating the energy absorption of artificial pumice in the full-scale penetration test.
However, as the layer thickness increased beyond 150 mm, a discrepancy between the predicted and experimental results was observed. This discrepancy is thought to be due to the mass of the projectile remaining constant. As the thickness of the artificial pumice layer increases, the impact energy required for penetration must increase. When the projectile mass is constant, increasing the impact energy (the kinetic energy of the projectile) requires an increase in projectile velocity. Consequently, under the conditions of this experiment, increasing the thickness of the artificial pumice layer results in an increase in projectile velocity. As the projectile velocity increases, stress equilibrium is not achieved at both ends of the artificial pumice layer, resulting in local deformation of the artificial pumice layer starting from the impact end. Since Equation 9 represents the energy derived under the condition where stress equilibrium is achieved, it is assumed that this discrepancy between the predicted and experimental results arose. In future studies, it will be essential to investigate the deformation behavior of pumice under conditions where stress equilibrium is not achieved in order to make more accurate predictions.

5. Conclusions

In this study, the compressive deformation behavior of artificial pumice was evaluated to explore reinforcement methods for existing facilities. Compression tests were conducted under unconfined and oedometric conditions at various strain rates to elucidate the deformation and fracture behavior of artificial pumice, as well as the strain rate dependence of its energy absorption. Additionally, based on the obtained compressive properties and strain rate dependence, the effect of artificial pumice reinforcement on the penetration resistance of mountain hut roofs was predicted. The following results were obtained:
1.
In the compression tests under unconfined conditions, the specimens scattered due to fracture, allowing for evaluation only during the initial deformation stage. On the other hand, the tests under oedometric conditions enabled the observation of a three-stage deformation process—elastic, plateau, and densification—typical of cellular structures.
2.
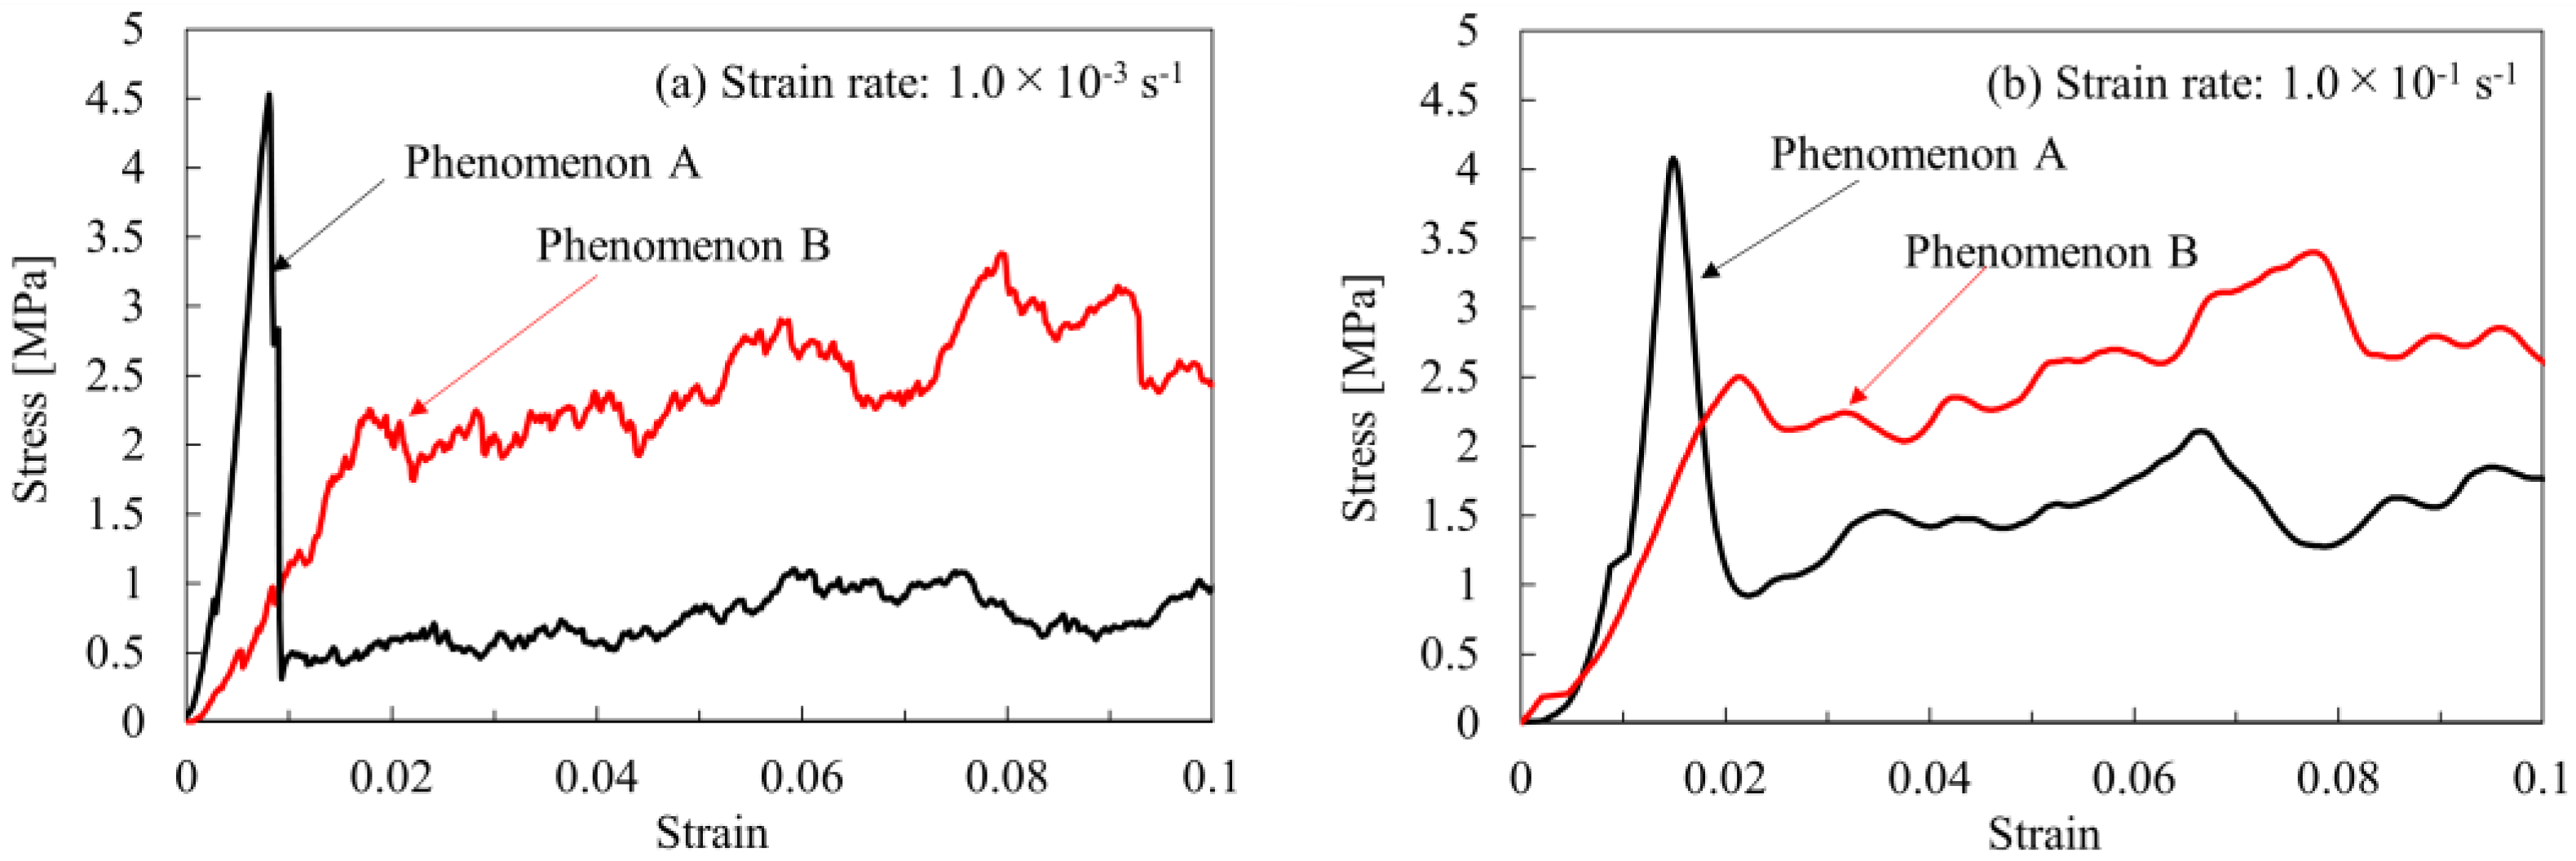
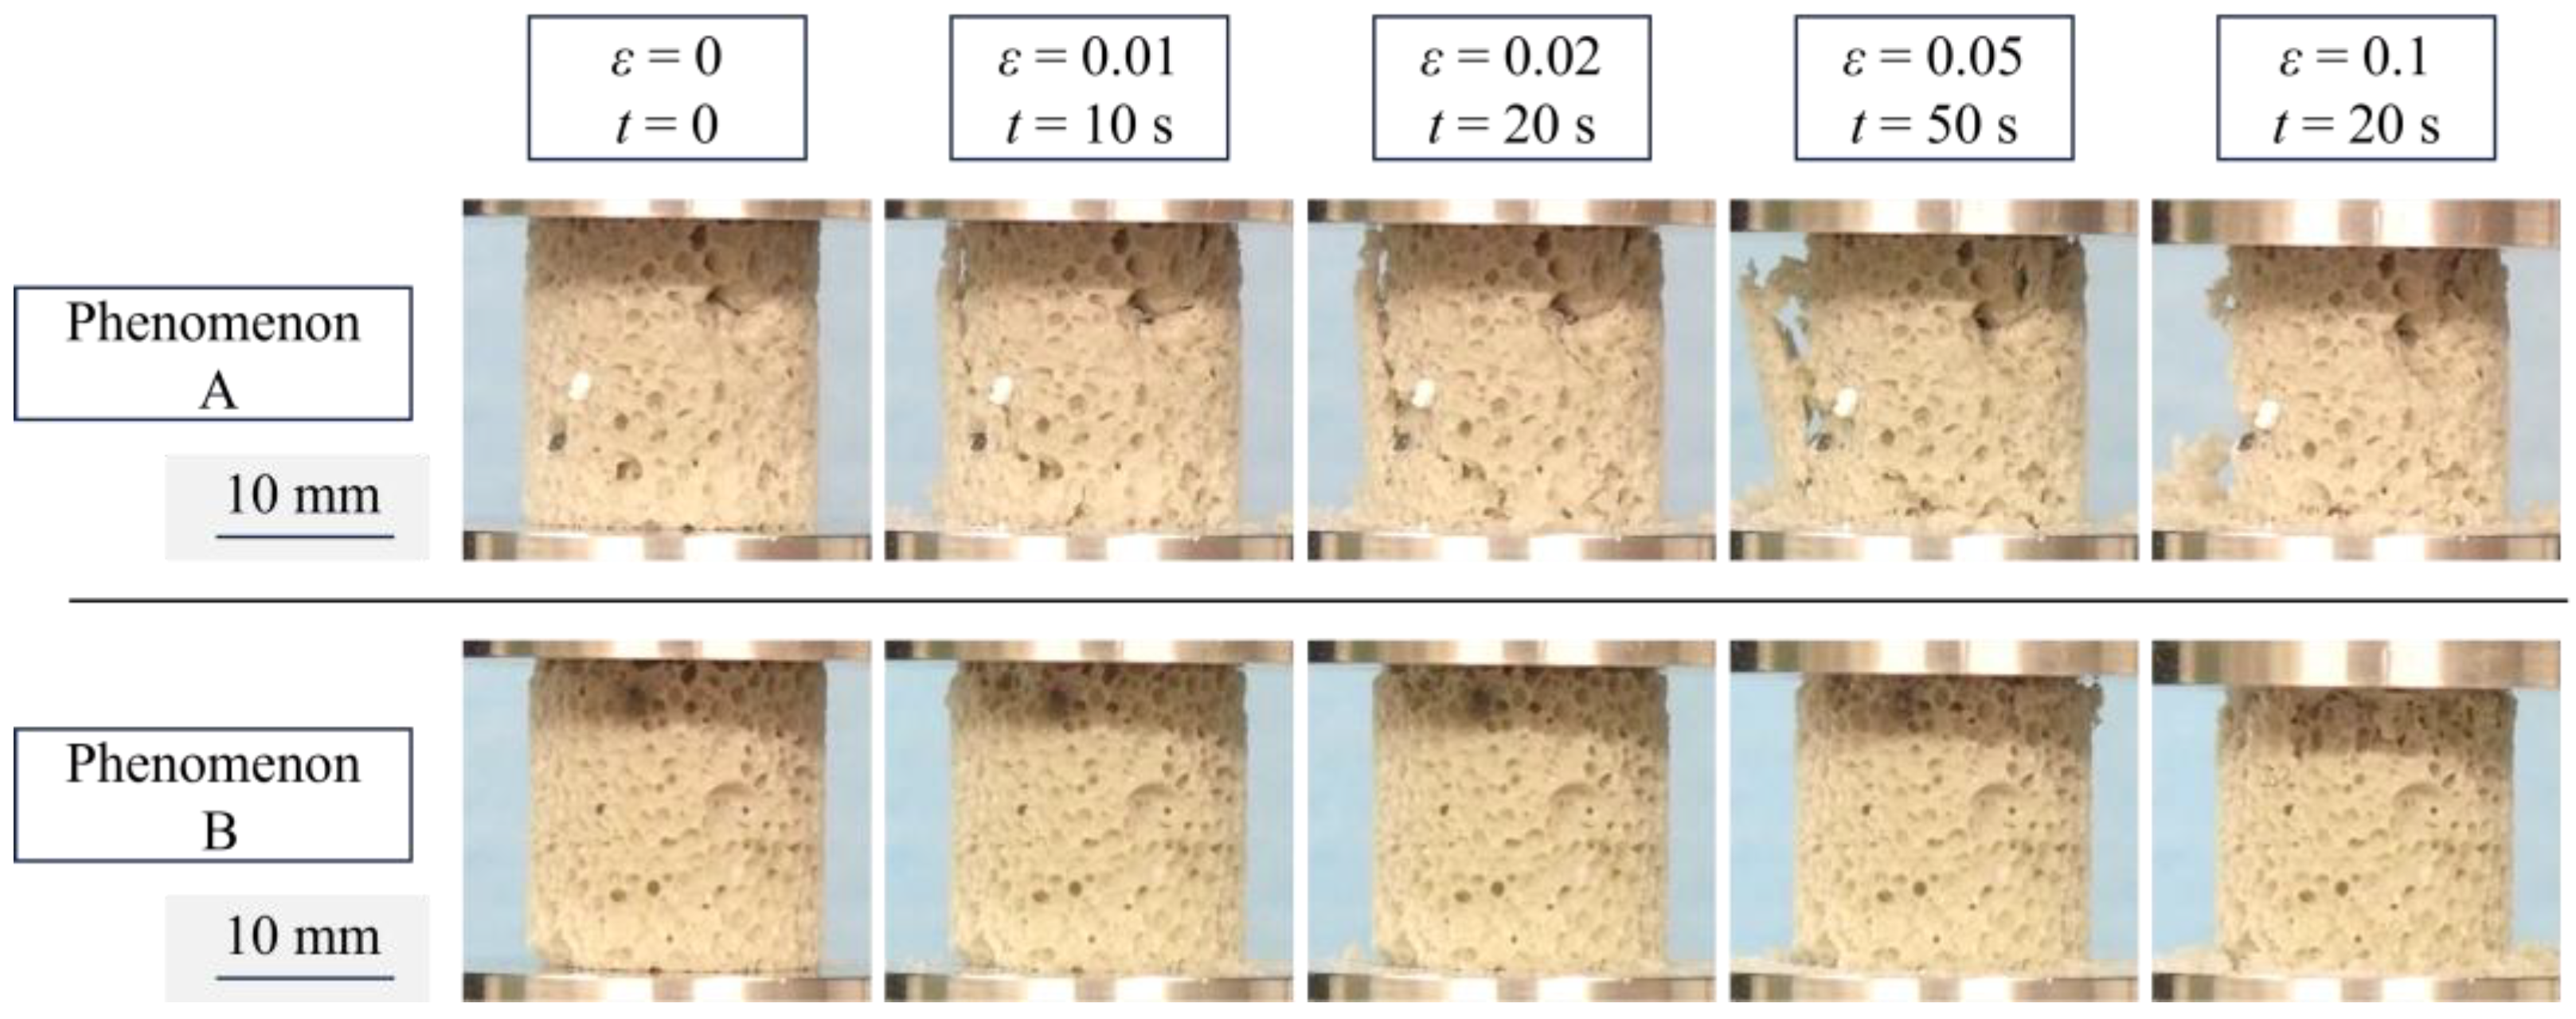
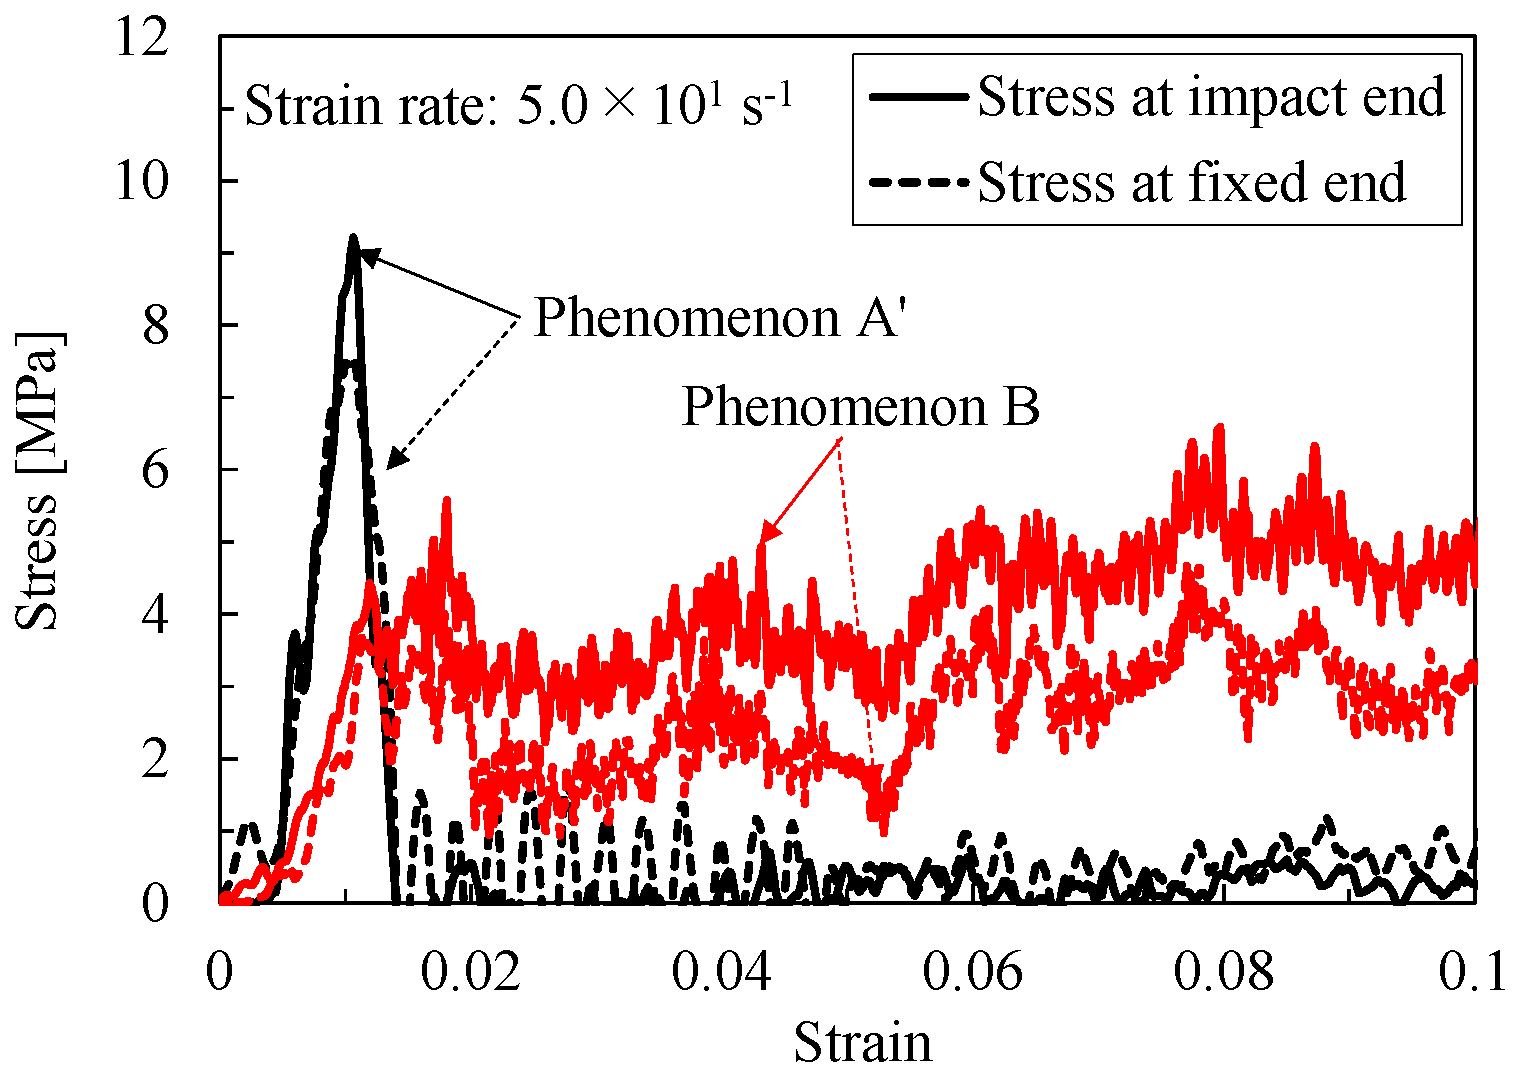
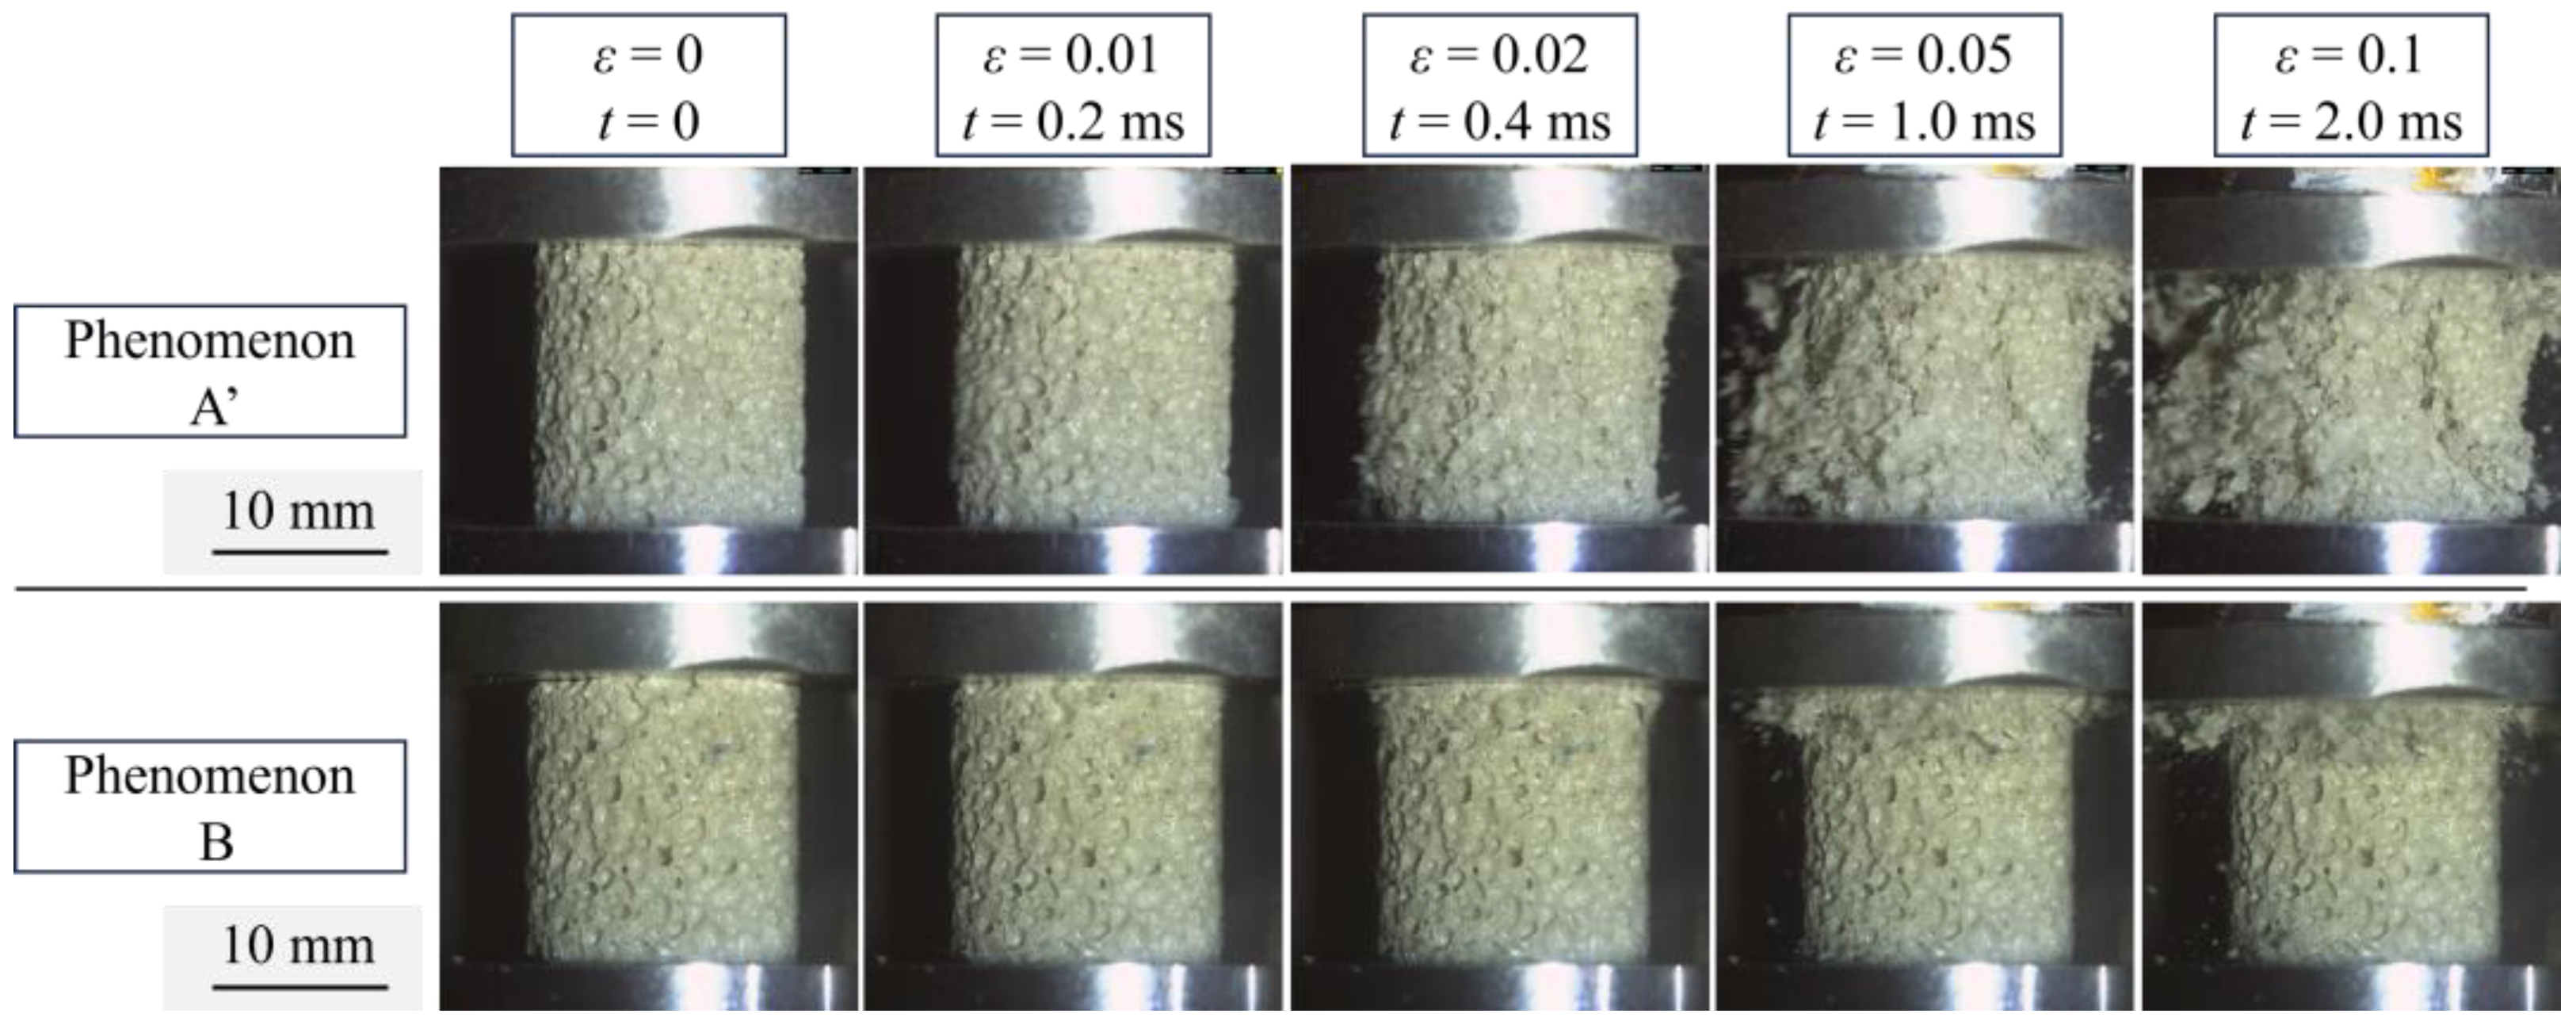
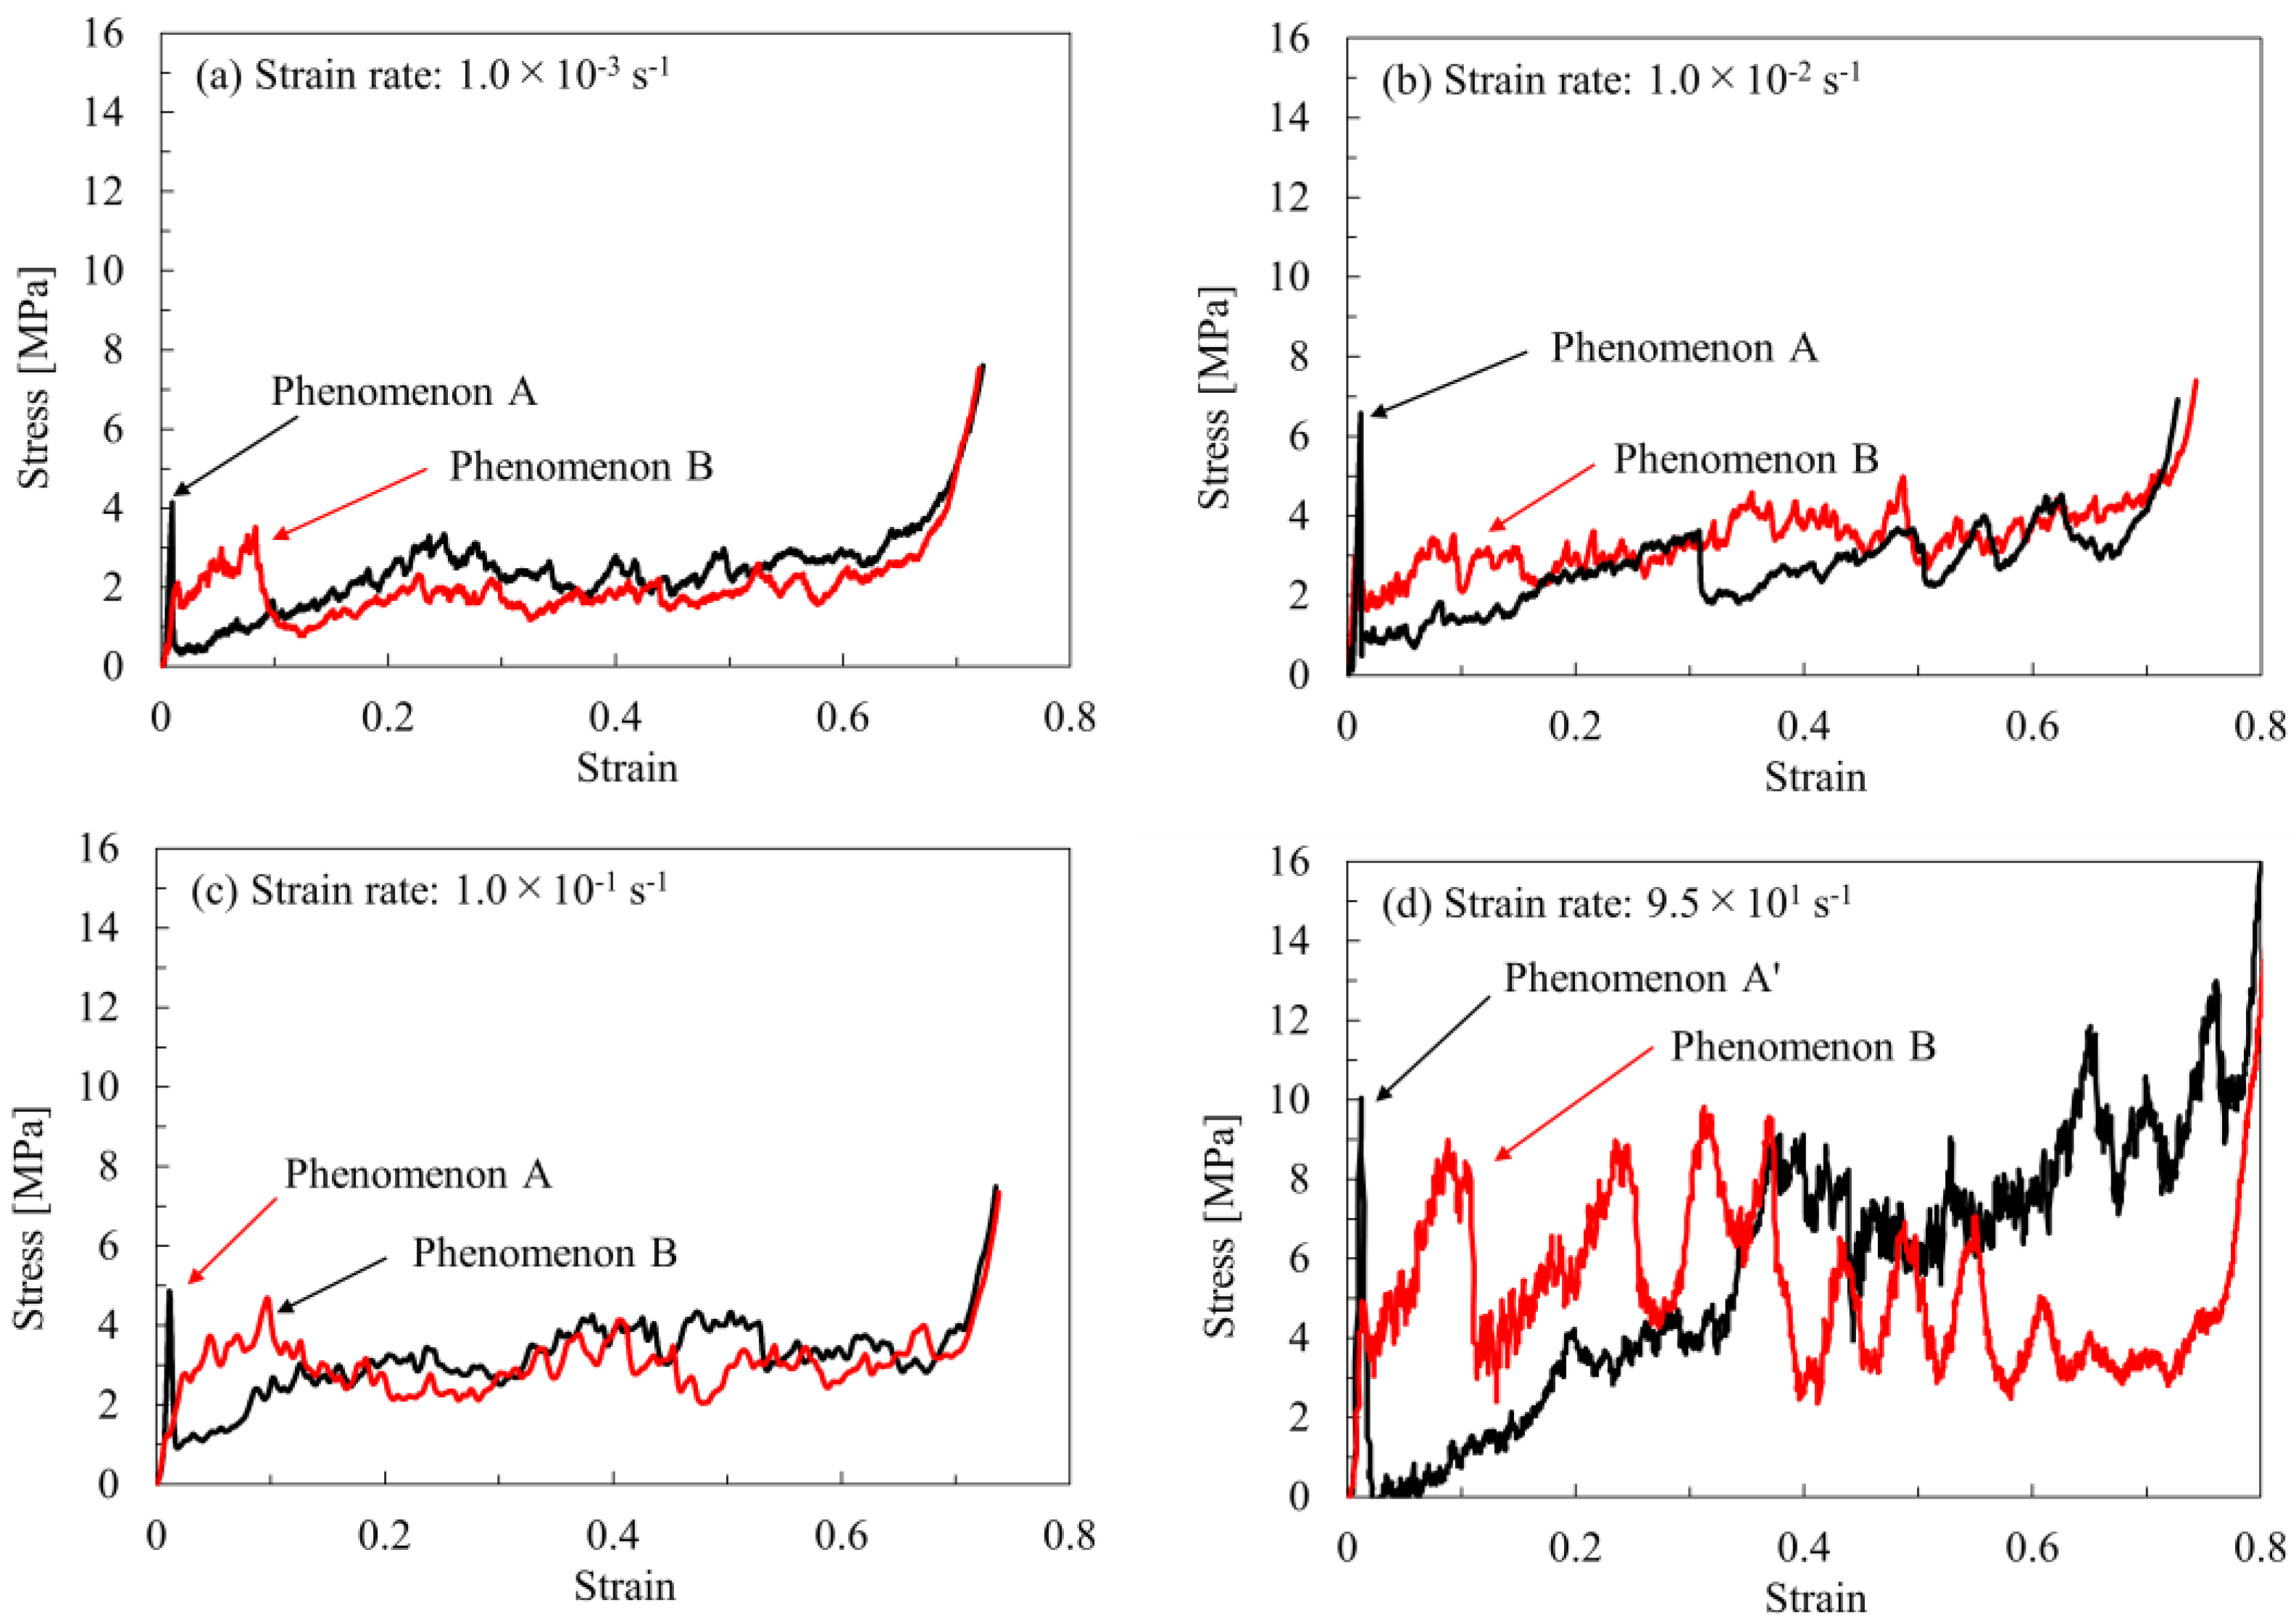
From the results of the compression tests under unconfined conditions, the initial deformation behavior of artificial pumice was classified into two types of deformation and fracture phenomena. The first type exhibited a large peak of elastic response during the initial deformation, followed by a significant decrease in stress. The second type showed no peak during the initial deformation.
3.
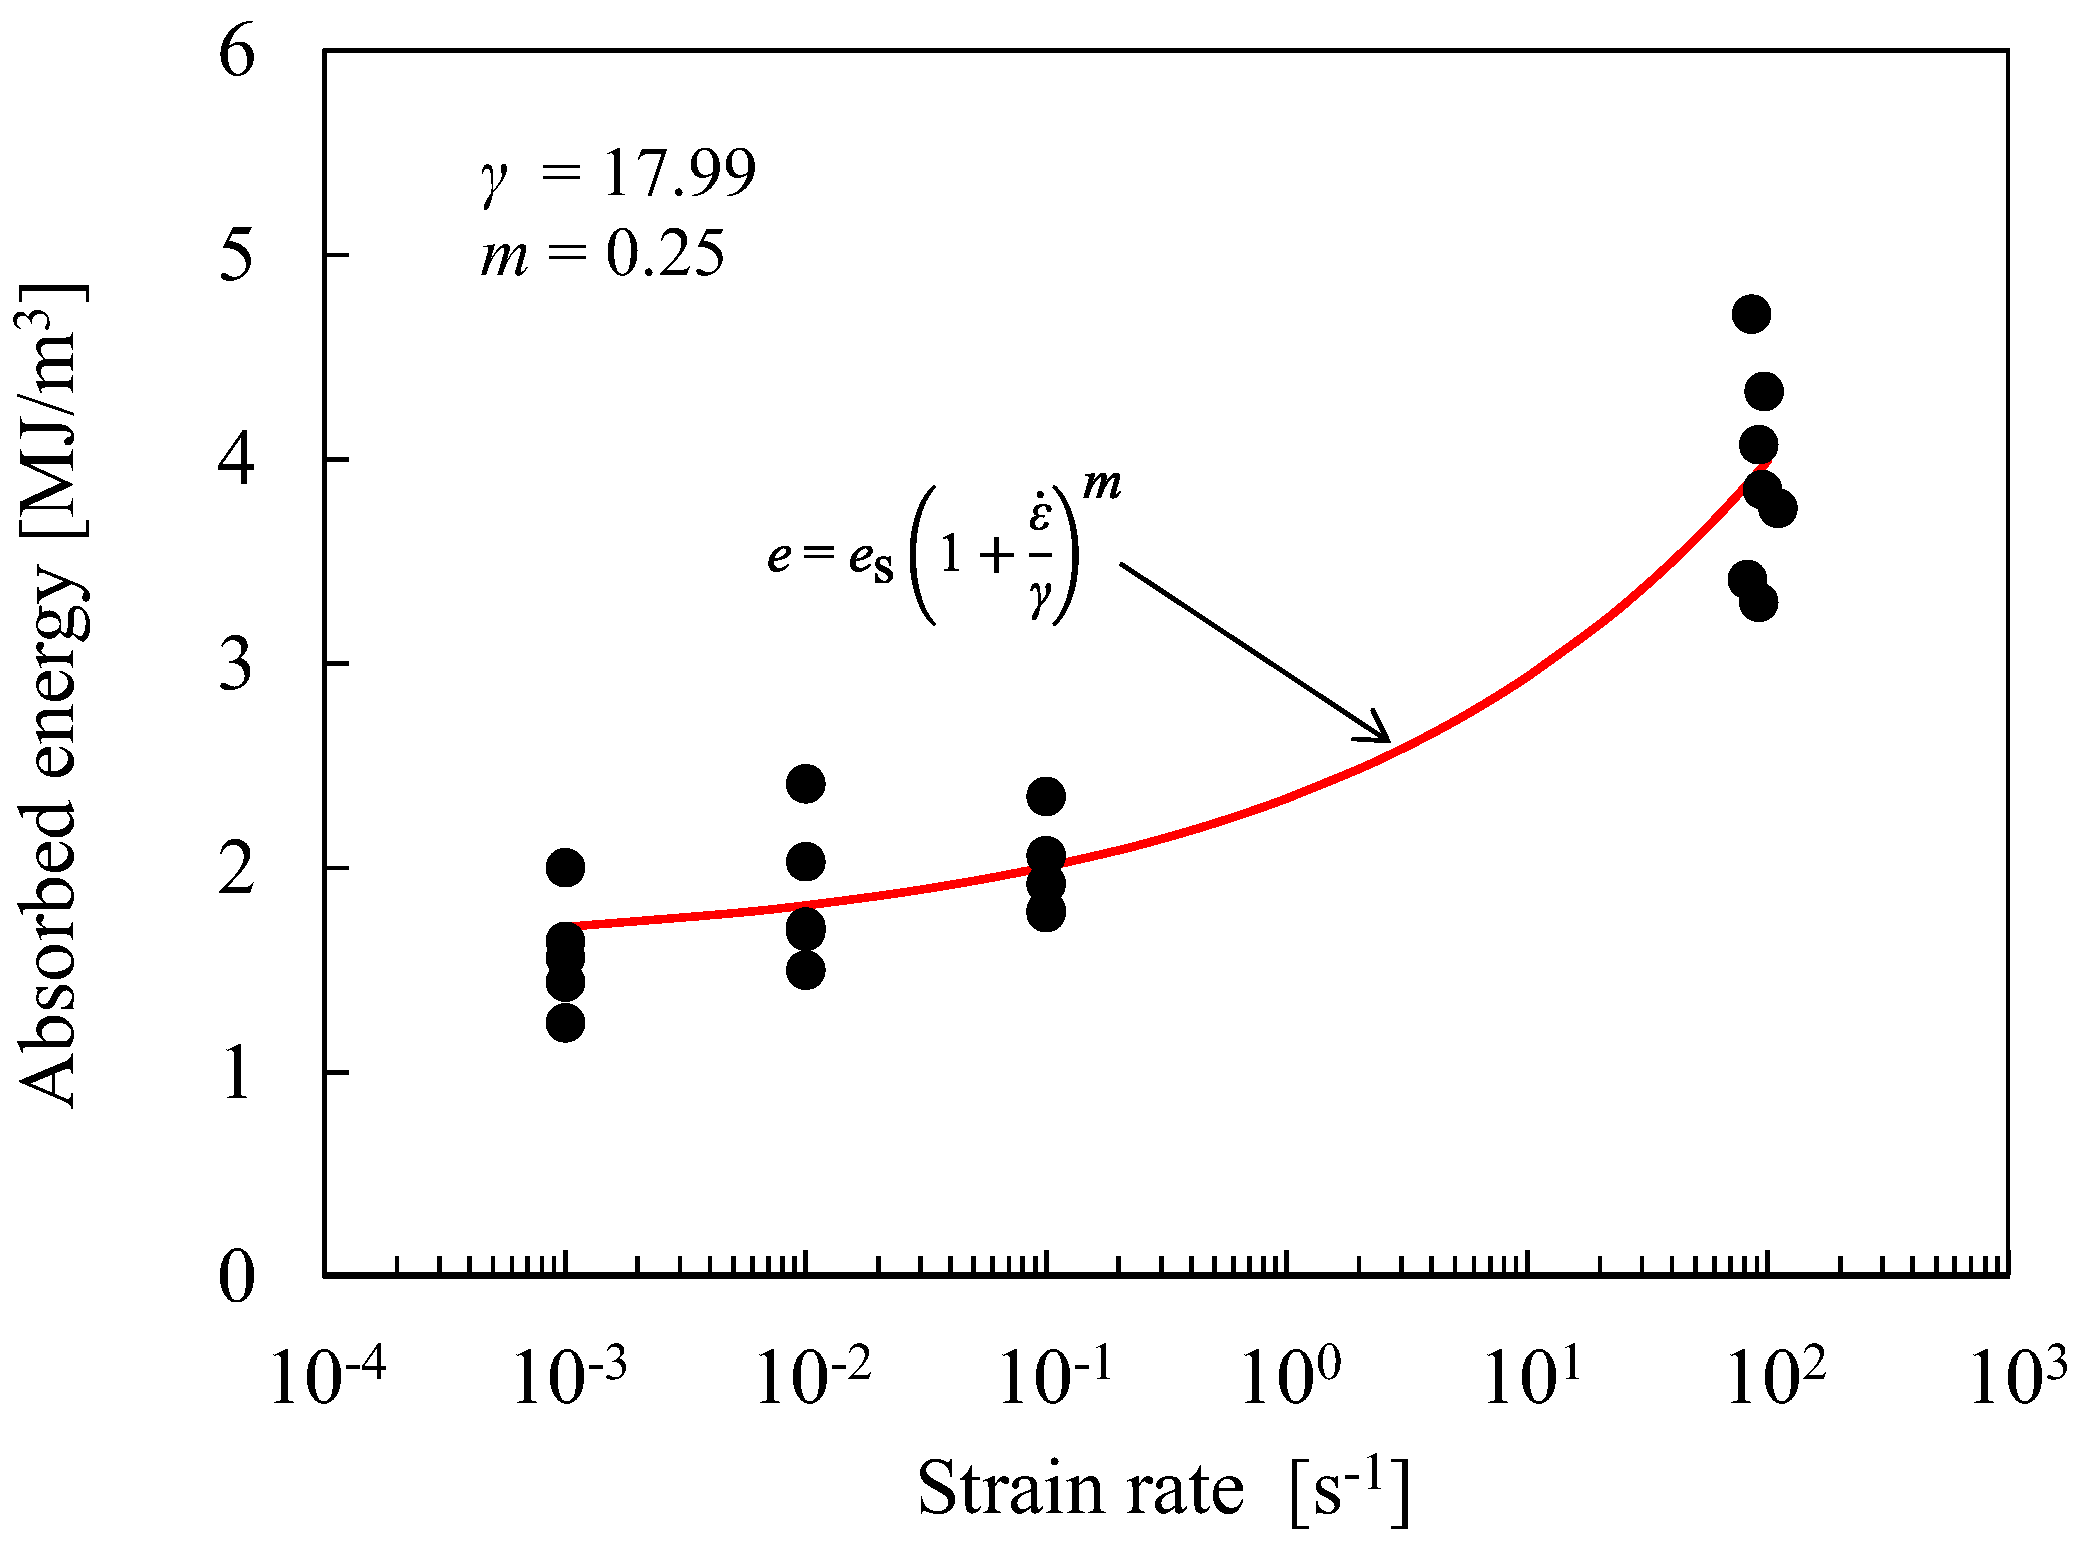
The results of the compression tests under oedometric conditions revealed the absorbed energy of artificial pumice, which showed a positive strain rate dependence.
4.
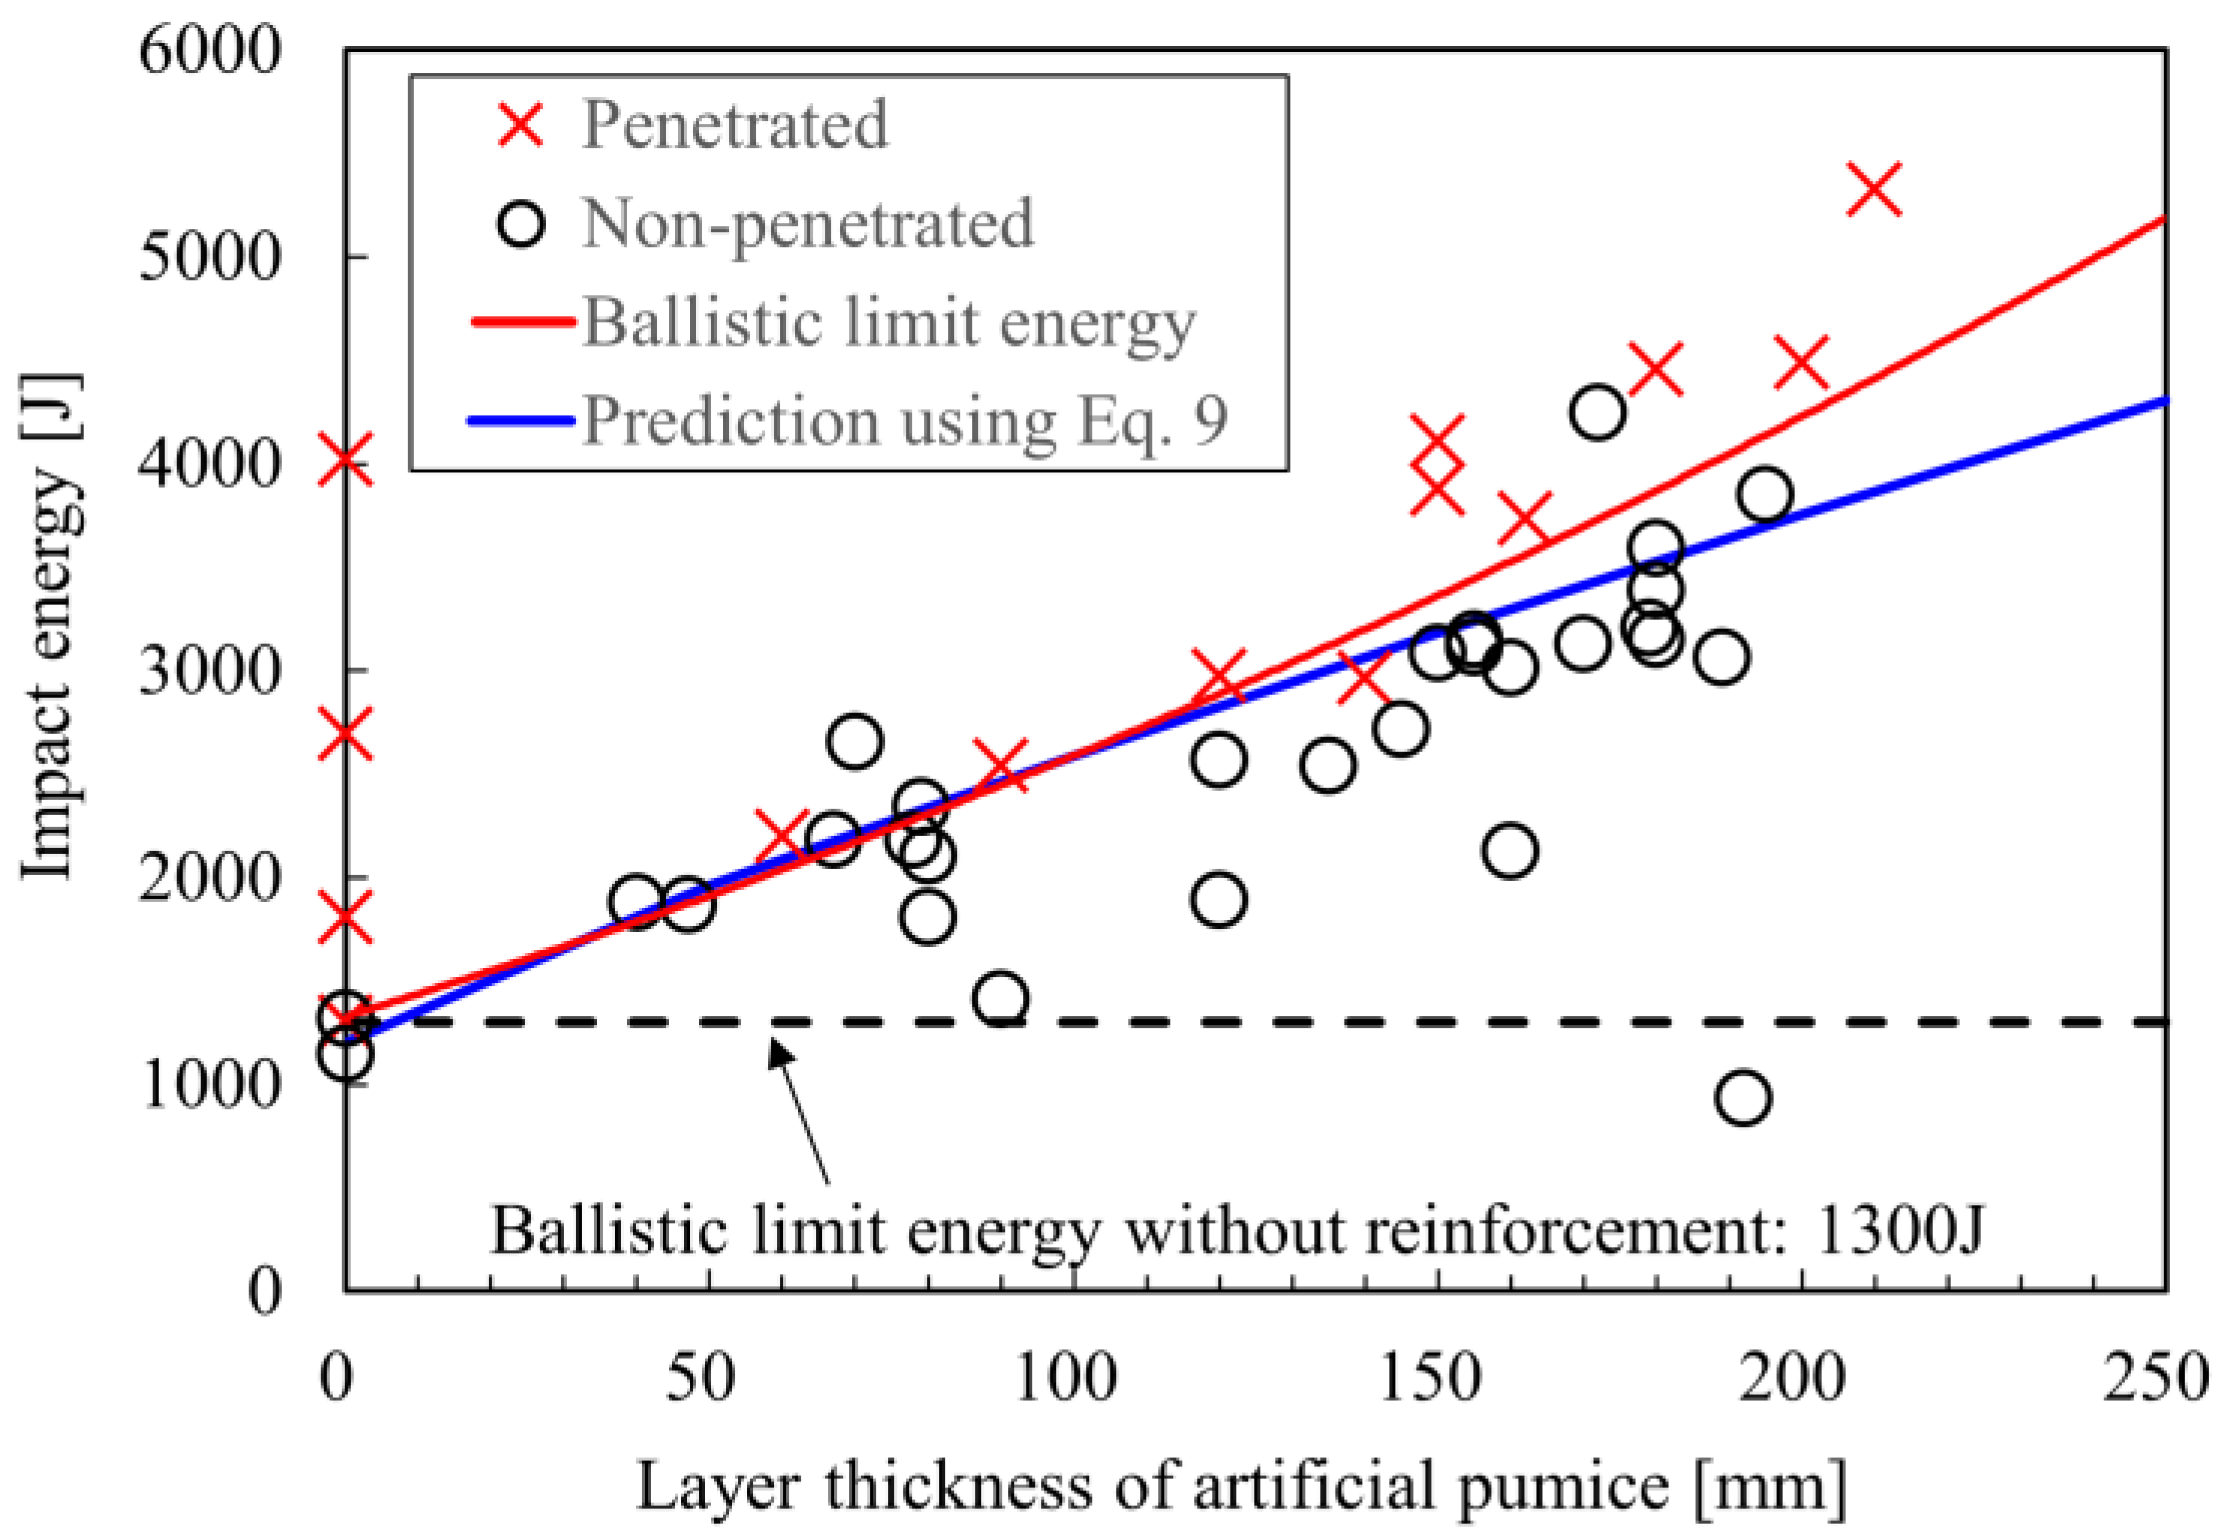
The absorbed energy predicted using the proposed method agreed well with experimental results for pumice layer thicknesses up to 150 mm. The discrepancy observed beyond 150 mm is assumed to be caused by localized deformation resulting from the absence of stress equilibrium.

Author Contributions

Conceptualization, K.T., H.S., and H.Y.; methodology, K.T., H.F., and H.Y.; software, K.T. and K.A.; validation, K.T., K.A., H.F., and H.Y.; formal analysis, K.T. and K.A.; investigation, K.T. and H.S.; resources, K.T.; data curation, K.T., K.A., H.F., and H.Y.; writing—original draft preparation, K.T.; writing—review and editing, K.T. and H.Y.; visualization, K.T. and K.A.; supervision, K.T., H.F., H.S., and H.Y.; project administration, K.T., H.F., H.S., and H.Y.; funding acquisition, K.T and H.S. All authors have read and agreed to the published version of the manuscript.

Funding

This research received no external funding.

Data Availability Statement

The original contributions presented in this study are included in the article. Further inquiries can be directed to the corresponding author.

Acknowledgments

Thanks to Riku Kimura for helping with some experiments.

Conflicts of Interest

The authors declare no conflicts of interest. Hisashi Sasaki is an employee of Asia Air Survey Co., Ltd. The paper reflects the views of the scientists and not the company.

Abbreviations

The following abbreviations are used in this manuscript:
SHBSplit Hopkinson bar

References

  1. Oikawa, T.; Yamaoka, K.; Yoshimoto, M.; Nakada, S.; Takeshita, Y.; Maeno, F.; Ishizuka, Y.; Komori, J.; Nakano, S. The 2014 eruption of Ontake volcano, Central Japan. Bull. Volc. Soc. Jpn. 2015, 60, 411–415. (In Japanese) [Google Scholar]
  2. Kaneko, T.; Maeno, F.; Nakada, S. 2014 Mount Ontake eruption: Characteristics of the phreatic eruption as inferred from aerial observations. Earth Planets Space 2016, 68, 72. [Google Scholar] [CrossRef]
  3. Oikawa, T.; Yoshimoto, M.; Nakada, S.; Maeno, F.; Komori, J.; Shimano, T.; Takeshita, Y.; Ishizuka, Y.; Ishimine, Y. Reconstruction of the 2014 eruption sequence of Ontake volcano from recorded images and interviews. Earth Planets Space 2016, 68, 79. (In Japanese) [Google Scholar] [CrossRef]
  4. Erfurt-Cooper, P. Volcano and Geothermal Tourism in Kyushu, Japan. In Volcano and Geothermal Tourism; Routledge: London, UK, 2010. [Google Scholar] [CrossRef]
  5. Fitzgerald, R.H.; Kennedy, B.M.; Wilson, T.M.; Leonard, G.S.; Tsunematsu, K.; Keys, H. The communication and risk management of volcanic ballistic hazards. In Observing the Volcano World; Fearnley, C.J., Bird, D.K., Haynes, K., McGuire, W.J., Jolly, G., Eds.; Springer: Cham, Switzerland, 2017; pp. 121–147. [Google Scholar]
  6. Arreeras, S.; Arimura, M. An improvement on shelter airport selection model during large-scale volcanic disasters: A case study of Hakoneyama Japan. Asian Transp. Stud. 2022, 8, 100054. [Google Scholar] [CrossRef]
  7. Dolce, M.; Cardone, D.; Marnetto, R. Structural design and analysis of an impact resisting structure for volcanic shelters. Eng. Struct. 2006, 28, 1634–1649. [Google Scholar] [CrossRef]
  8. Dolce, M.; Cardone, D.; Moroni, C.; Nigro, D. Dynamic response of a volcanic shelter subjected to ballistic impacts. Int. J. Impact Eng. 2007, 34, 681–701. [Google Scholar] [CrossRef]
  9. Wilson, T.M.; Stewart, C.; Sword-Daniels, V.; Leonard, G.S.; Johnston, D.M.; Cole, J.W.; Wardman, J.; Wilson, G.; Barnard, S.T. Volcanic ash impacts on critical infrastructure. Phys. Chem. Earth 2012, 45–46, 5–23. [Google Scholar] [CrossRef]
  10. Yamada, H.; Tateyama, K.; Sasaki, H.; Naruke, S.; Kisimoto, H.; Yoshimoto, M. Impact resistance to ballistic ejecta of wooden buildings and a simple reinforcement method using aramid fabric. J. Volcanol. Geotherm. Res. 2018, 359, 37–46. [Google Scholar] [CrossRef]
  11. Yamada, H.; Tateyama, K.; Honda, R.; Yoshimoto, M.; Fujii, T. Simple structural reinforcement of roof of wooden buildings subjected to ballistic ejecta impact. Bull. Volc. Soc. Jpn. 2019, 64, 243–251. [Google Scholar]
  12. Liu, W.; Yu, H.; Ma, H.; Guo, J.; Mei, Q.; Wang, Y.; Zhang, J.; Wang, F. 3D mesomechanical study on the stress failure mechanism of concrete—Taking uniaxial compression as an example. Constr. Build. Mater. 2025, 467, 140381. [Google Scholar] [CrossRef]
  13. Ozoji, T.M.; Zhang, Z.X.; Aladejare, A.E.; Zhang, N.; Paasovaara, N.; Arrieta, M.R. Effect of strain rate on specific fracture energy and micro-fracture surface properties of rock specimen under dynamic uniaxial compression. Eng. Fract. Mech. 2024, 295, 109763. [Google Scholar] [CrossRef]
  14. He, Z.; Wu, G.; Zhu, J. Mechanical properties of rock under uniaxial compression tests of different control modes and loading rates. Sci. Rep. 2024, 14, 2164. [Google Scholar] [CrossRef]
  15. Sun, B.; Liu, S.; Zeng, S.; Wang, S.; Wang, S. Dynamic characteristics and fractal representations of crack propagation of rock with different fissures under multiple impact loadings. Sci. Rep. 2021, 11, 13071. [Google Scholar] [CrossRef]
  16. Parmo; Tavio; Riadi, H.; Suriani, E.; Prianto, K.; Haqi, F.I. The mechanical properties of lightweight concrete made with lightweight aggregate volcanic pumice. In Proceedings of the Built Environment, Science and Technology International Conference (BEST ICON 2018), Surabaya, Indonesia, 18–20 September 2018; SCITEPRESS: Surabaya, Indonesia, 2018; pp. 167–171. [Google Scholar]
  17. Sangeetha, S.P.; Divahar, R.; Mawlong, K.; Lyngkhoi, B.; Kurkalang, A. Mechanical characteristics of pumice stone as light weight aggregate in concrete. Int. J. Sci. Technol. Res. 2020, 9, 3760–3762. [Google Scholar]
  18. Shafiq, M.S.; Khan, F.A.; Badrashi, Y.I.; Khan, F.A.; Fahim, M.; Abbas, A.; Adil, W. Evaluation of mechanical properties of lightweight concrete with pumice aggregate. Adv. Sci. Technol. Res. J. 2021, 15, 30–38. [Google Scholar] [CrossRef] [PubMed]
  19. Bakis, A. The usability of pumice powder as a binding additive in the aspect of selected mechanical parameters for concrete road pavement. Materials 2019, 12, 2743. [Google Scholar] [CrossRef]
  20. Forquin, P.; Francart, C.; Sapay, M.; Rack, A.; Cohen, A.; Levi-Hevroni, D.; Arrigoni, M.; Lukić, B. Analysis of microcracking processes in microconcrete under confined compression utilising synchrotron-based ultra-high speed X-ray phase contrast imaging. Int. J. Impact Eng. 2025, 198, 105167. [Google Scholar] [CrossRef]
  21. Tartière, J.; Arrigoni, M.; Lukic, B.; Rack, A.; Chapman, D.; Reynier, B.; Le Clanche, J.; Pradel, P.; De Resseguier, T.; Forquin, P.; et al. Experimental study and modelling of shock-induced compaction of autoclaved aerated concrete through MHz X-ray radioscopy. Int. J. Impact Eng. 2025, 204, 105376. [Google Scholar] [CrossRef]
  22. Saadatfar, M.; Mukherjee, M.; Madadi, M.; Schröder-Turk, G.E.; Garcia-Moreno, F.; Schaller, F.M.; Hutzler, S.; Sheppard, A.P.; Banhart, J.; Ramamurty, U. Structure and deformation correlation of closed-cell aluminium foam subject to uniaxial compression. Acta Mater. 2012, 60, 3604–3615. [Google Scholar] [CrossRef]
  23. Hu, Y.; Fang, Q.-Z.; Qian, J. Effect of cell structure on the uniaxial compression properties of closed-cell foam materials. Mater. Today Commun. 2021, 26, 102104. [Google Scholar] [CrossRef]
  24. Iqbal, S.; Kamiński, M. Review study on mechanical properties of cellular materials. Materials 2024, 17, 2682. [Google Scholar] [CrossRef] [PubMed]
  25. Hu, Q.; Zhang, X.; Zhang, J.; Lu, G.; Tse, K.M. A review on energy absorption performance of auxetic composites with fillings. Thin-Walled Struct. 2024, 205, 112348. [Google Scholar] [CrossRef]
  26. Nishioka, T.; Shibuya, H. Geotechnical properties of “scoria” around Mt. Fuji. J. Geotech. Geoenviron. Eng. 2014, 9, 397–415. (In Japanese) [Google Scholar]
  27. Tateyama, K.; Kakuno, C.; Ogasawara, N.; Yamada, H. Development of universal rate range load-cell. J. Jpn. Soc. Exp. Mech. 2017, 17, 131–138. (In Japanese) [Google Scholar]
  28. Kolsky, H. An investigation of the mechanical properties of materials at very high rates of loading. Proc. Phys. Soc. B 1949, 62, 676–700. [Google Scholar] [CrossRef]
  29. Hopkinson, B. A method of measuring the pressure in the deformation of high explosives by the impact of bullets. Philos. Trans. R. Soc. A 1914, 213, 437–452. [Google Scholar]
  30. Gibson, L.J.; Ashby, M.F. Cellular Solids, Structure and Properties, 2nd ed.; Cambridge University Press: Cambridge, UK, 1997. [Google Scholar]
  31. Cowper, G.R.; Symonds, P.S. Strain-Hardening and Strain-Rate Effects in the Impact Loading of Cantilever Beams; Division of Applied Mathematics, Brown University: Providence, RI, USA, 1957. [Google Scholar]
  32. Kubo, T.; Yoshimoto, M.; Honda, R.; Nishizawa, T.; Tateyama, K.; Yamada, H. Experimental study on reinforcement method of impact-resistant shelters against ballistic ejecta using artificial pumice. Bull. Volc. Soc. Jpn. 2025, 70, 3–12. (In Japanese) [Google Scholar]
Figure 1. Unprocessed commercially available (a) artificial pumice and (b) specimen prepared by machining.
Applmech 06 00043 g001
Figure 2. Schematic diagram of universal testing machine for (a) unconfined and (b) oedometric conditions.
Applmech 06 00043 g002
Figure 3. Schematic diagram of drop-weight testing machine for (a) unconfined and (b) oedometric conditions.
Applmech 06 00043 g003
Figure 4. Schematic diagram of the SHB apparatus for the impact compression test.
Applmech 06 00043 g004
Figure 5. Typical stress–strain relationships for artificial pumice at strain rates of (a) 1.0 × 10⁻³ and (b) 1.0 × 10⁻¹ s−1.
Applmech 06 00043 g005
Figure 6. Typical deformation behavior at a strain rate of 1.0 × 10⁻³ s−1.
Applmech 06 00043 g006
Figure 7. Typical stress–strain relationships for artificial pumice at a strain rate of 5.0 × 101 s−1. The black line represents phenomenon A, and the red line represents phenomenon B. The dashed and solid lines indicate the stresses obtained from the upper and lower ends of the specimen, respectively.
Applmech 06 00043 g007
Figure 8. Typical deformation behavior at a strain rate of 5.0 × 101 s−1.
Applmech 06 00043 g008
Figure 9. Typical stress–strain relationships for artificial pumice at strain rates of 4.0 × 10² s−1.
Applmech 06 00043 g009
Figure 10. Typical stress–strain relationships for artificial pumice in quasi-static and dynamic tests at strain rates of (a) 1.0 × 10⁻³, (b) 1.0 × 10⁻², (c) 1.0 × 10⁻¹, and (d) 9.5 × 101 s−1 under oedometric conditions.
Applmech 06 00043 g010
Figure 11. The relationship between the absorbed energy per unit volume and the strain rate.
Applmech 06 00043 g011
Figure 12. The relationship between impact energy and layer thickness of artificial pumice. Experimental results were taken from reference [32].
Applmech 06 00043 g012
Figure 13. A schematic representation for defining the energy absorption mechanism of artificial pumice in the full-scale penetration test.
Applmech 06 00043 g013
Figure 14. Relationship between the volume of artificial pumice and the volume of space in the impact area. A linear fit yields a slope of 0.458 ± 0.009, based on least-squares regression.
Applmech 06 00043 g014
Table 1. The average absorption energy per unit volume.
Strain Rate [s−1]PhenomenonAverage Absorption Energy Per Unit Volume [MJ/m3]
1.0 × 10⁻³A1.62
B1.47
1.0 × 10⁻²A1.69
B1.95
1.0 × 10⁻¹A2.06
B1.98
9.5 × 101A4.33
B3.88
Disclaimer/Publisher’s Note: The statements, opinions and data contained in all publications are solely those of the individual author(s) and contributor(s) and not of MDPI and/or the editor(s). MDPI and/or the editor(s) disclaim responsibility for any injury to people or property resulting from any ideas, methods, instructions or products referred to in the content.

