A Predictive Model for the Shear Capacity of Ultra-High-Performance Concrete Deep Beams Reinforced with Fibers Using a Hybrid ANN-ANFIS Algorithm


Abstract
1. Introduction
2. Experimental Dataset
3. Shear Capacity of UHPC Deep Beams Based on ACI 318-19 [25]
4. Predictive Model for Shear Capacity of UHPC Deep Beams
4.1. Artificial Neural Network (ANN)
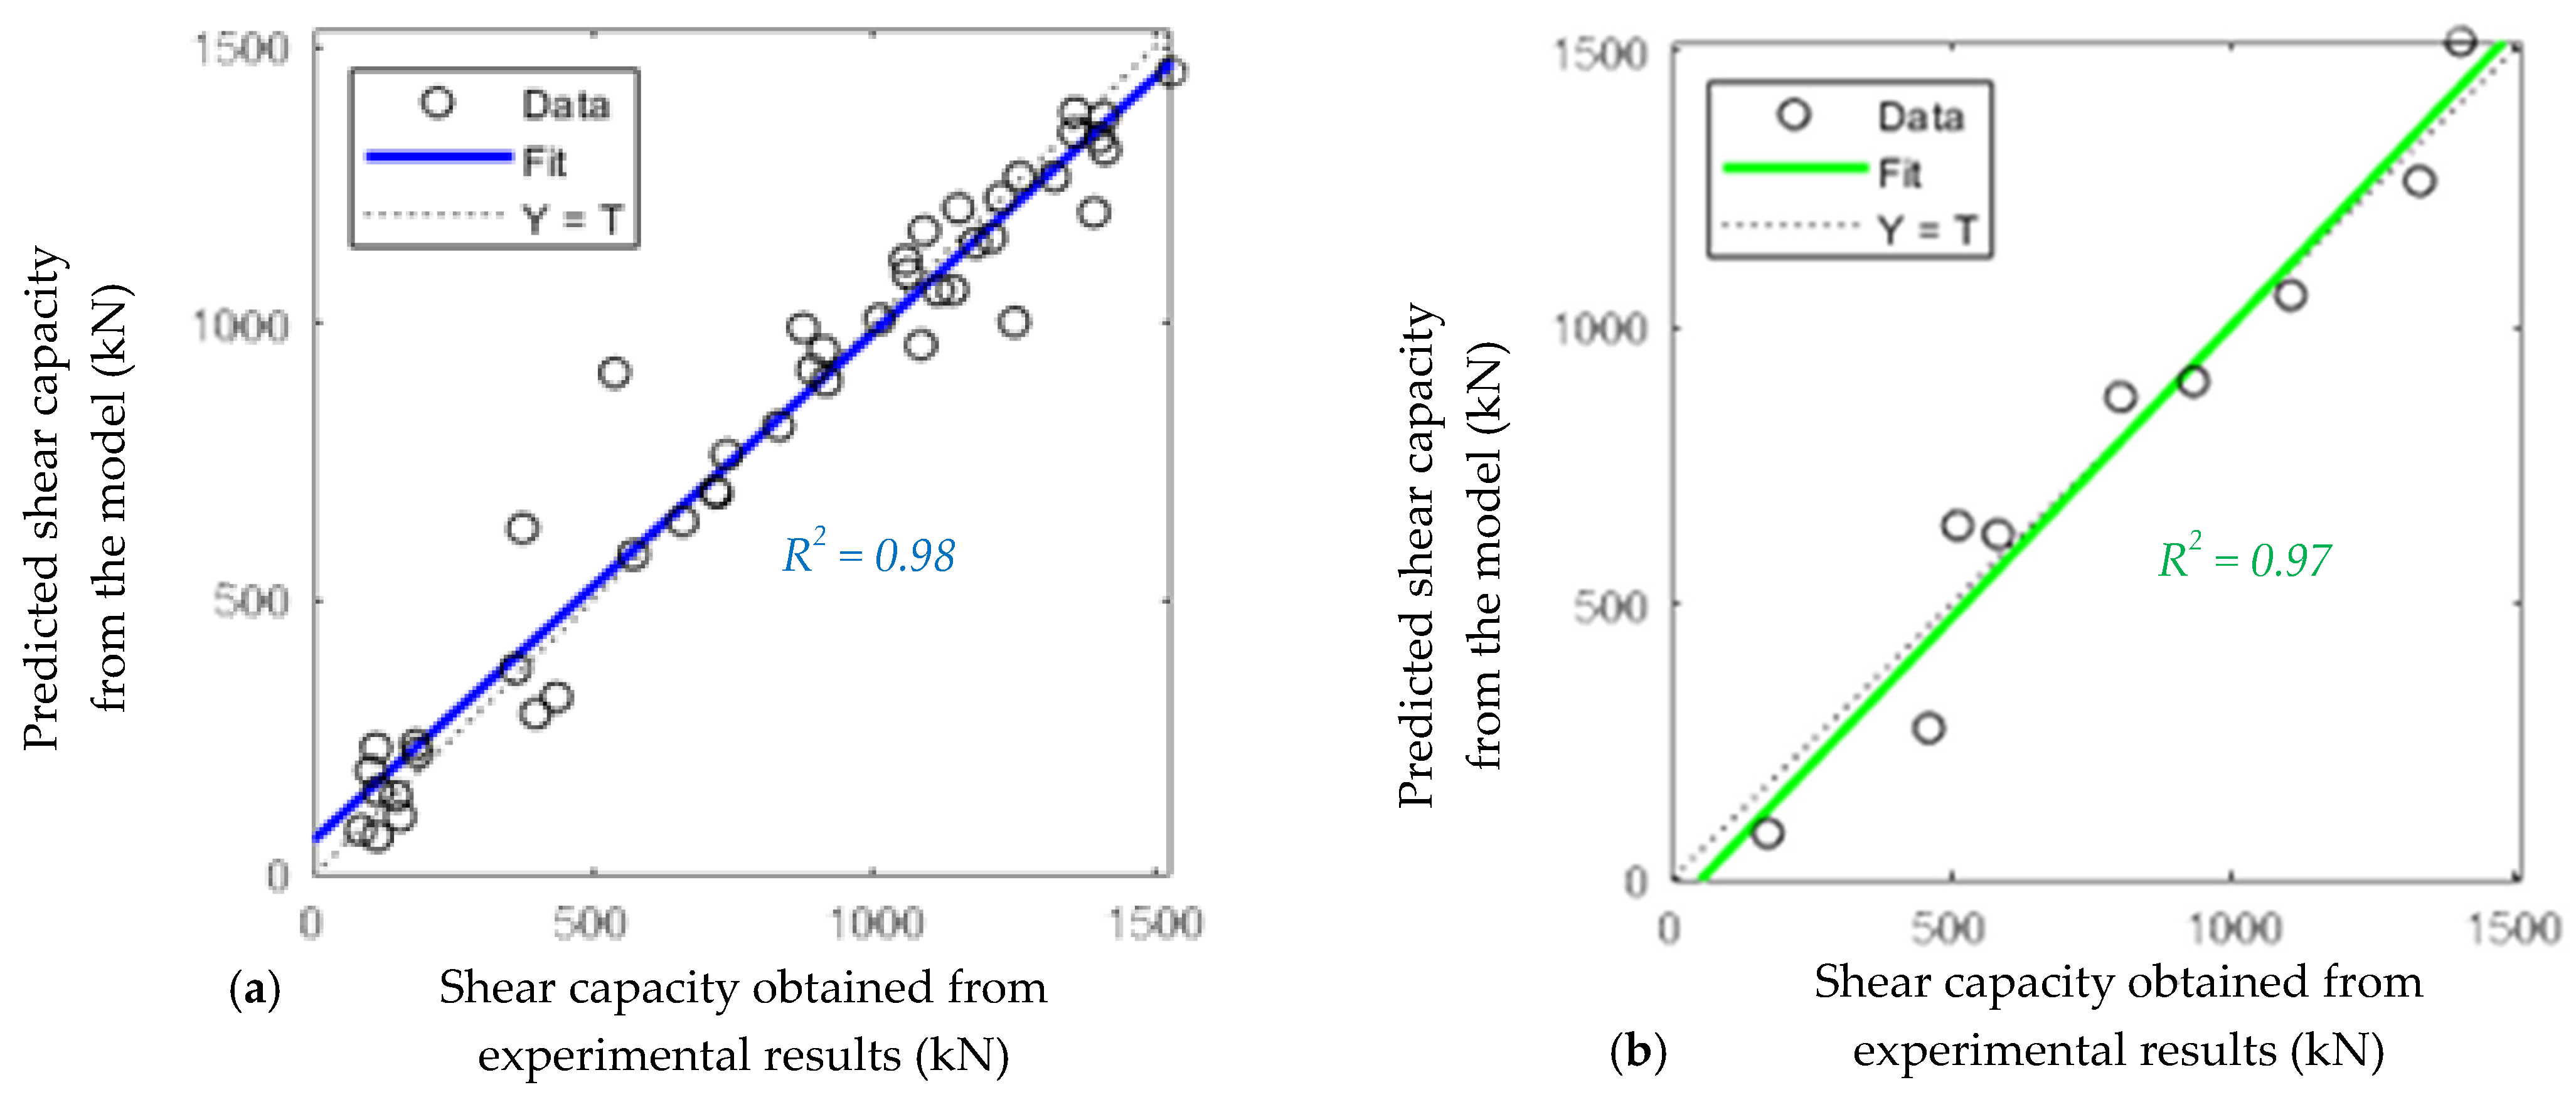
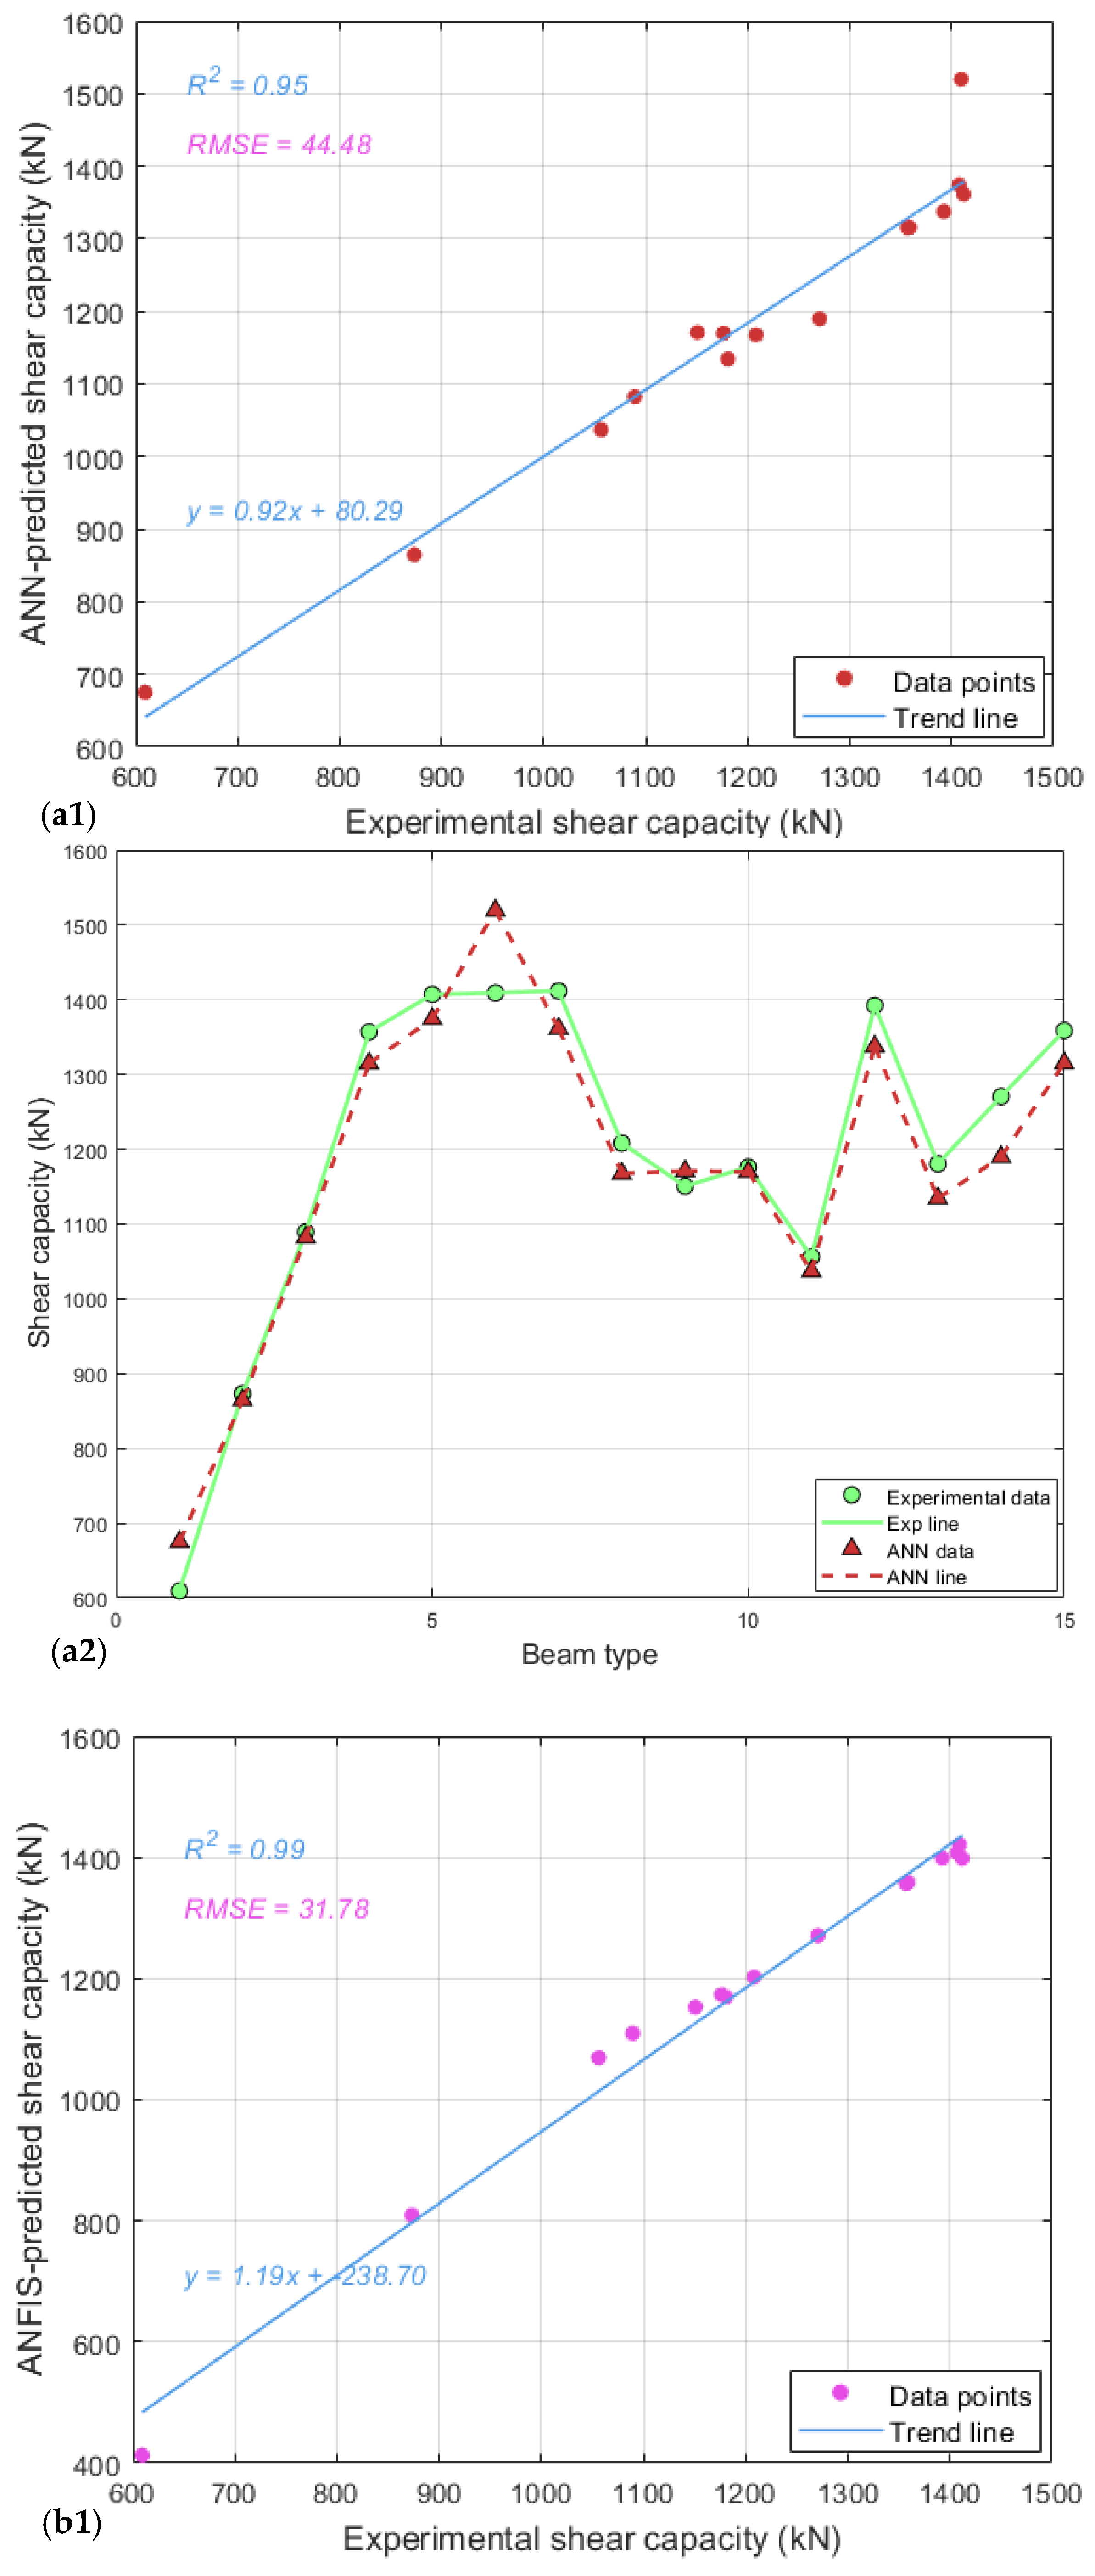
4.2. Performance Metrics
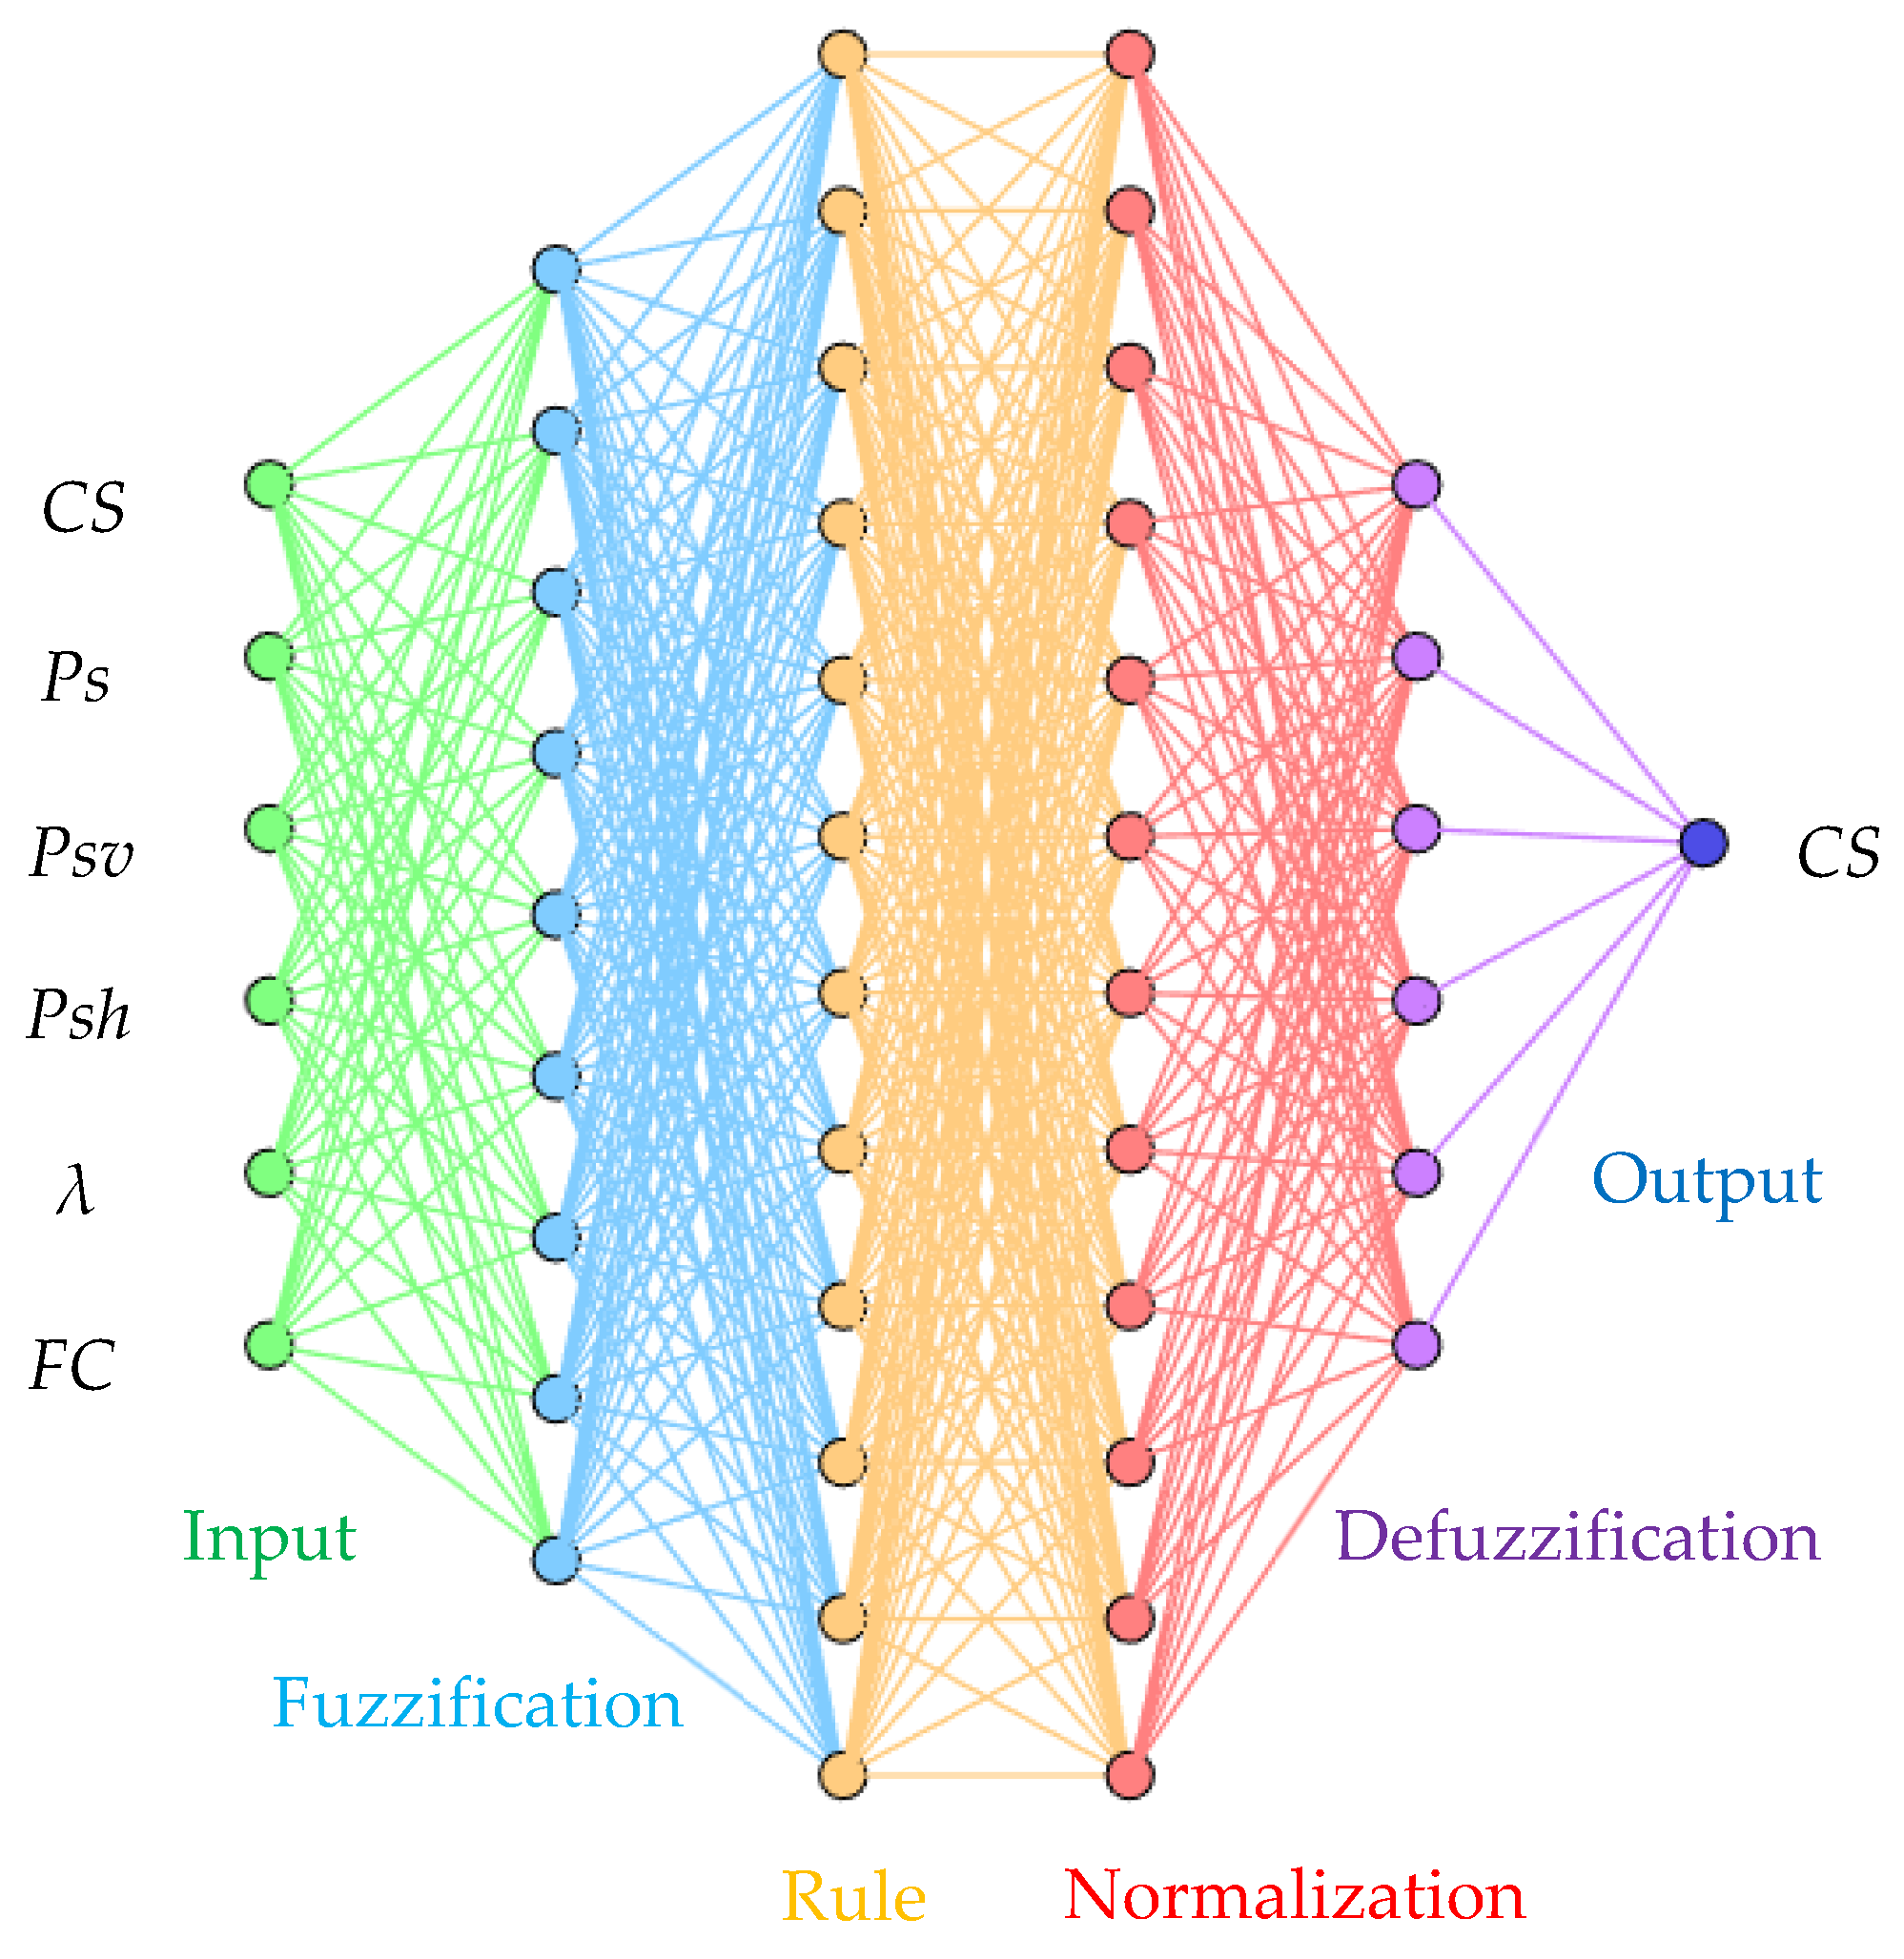
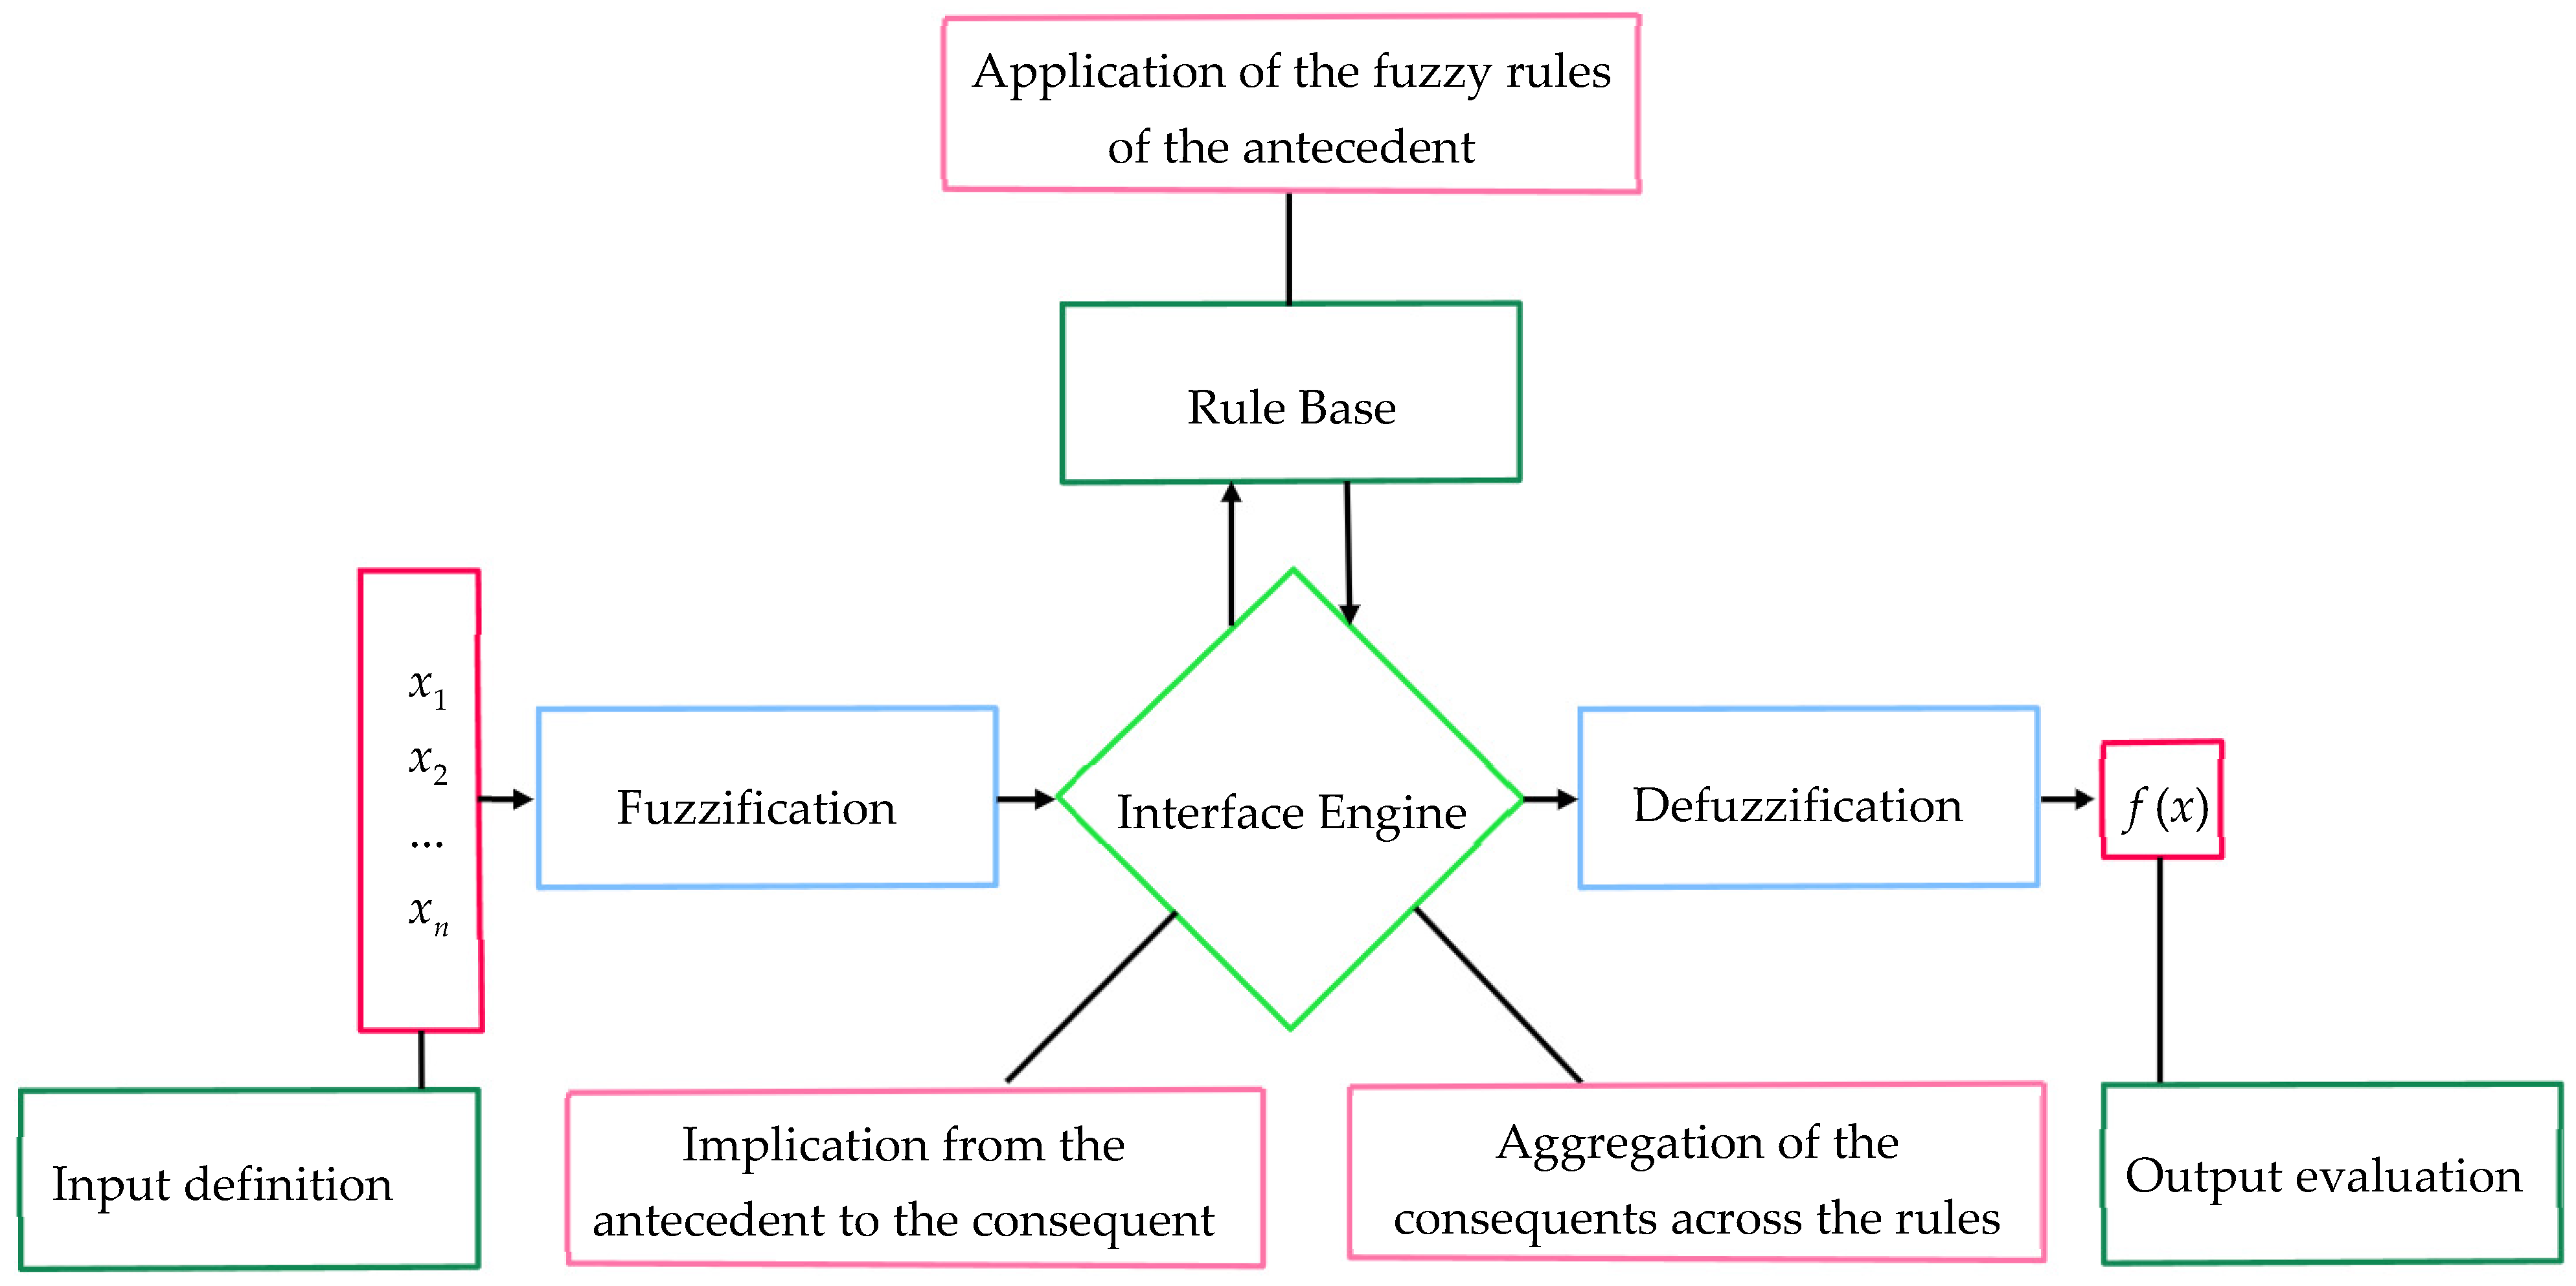
4.3. Adaptive Neuro-Fuzzy Inference System (ANFIS)
4.4. Hybrid Model of ANN-ANFIS Algorithm
5. Results and Discussion
Data Consistency and Reliability of Proposed Model
- Experimental datasets that adhere to international testing standards, such as ACI, and ASTM, were selected to ensure consistency in the test procedures.
- To standardize parameters such as compressive strength, which may be obtained from different sample sizes across various standards, adjustments were made using conversion equations where applicable.
- To ensure clarity and comparability, only experimental results, including detailed material properties and mix designs, were selected.
- The parameter units were converted to the SI system to improve the generalizability of the model.
- To avoid potential bias, a sensitivity analysis was conducted to assess the impact of the effective factors on the shear capacity of UHPC-DBs.
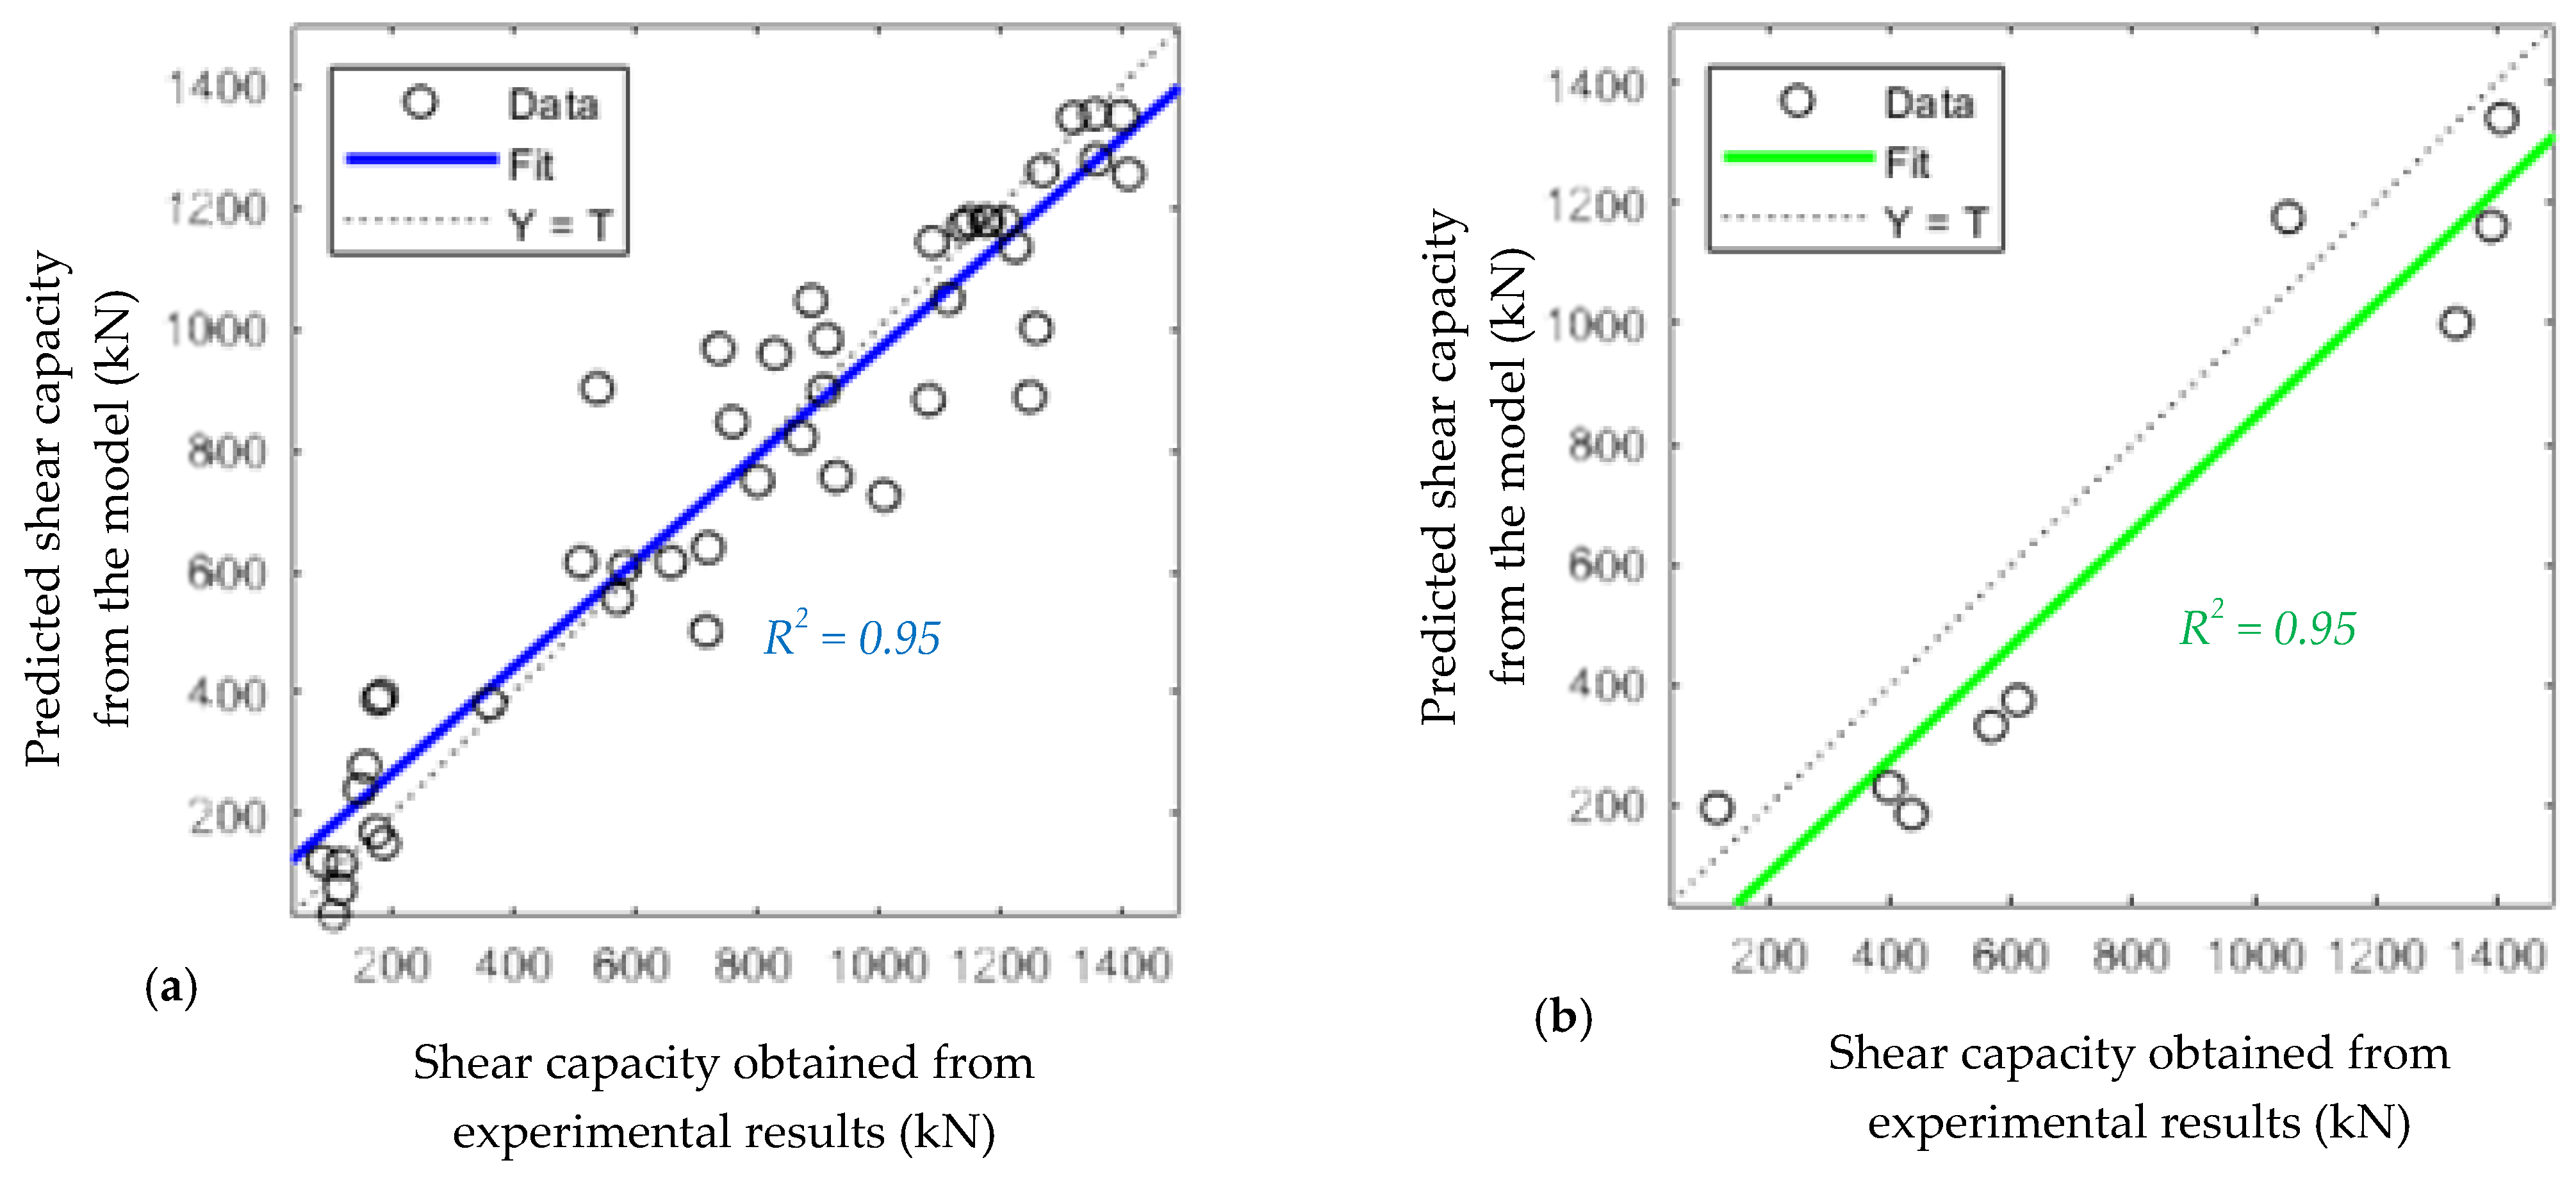
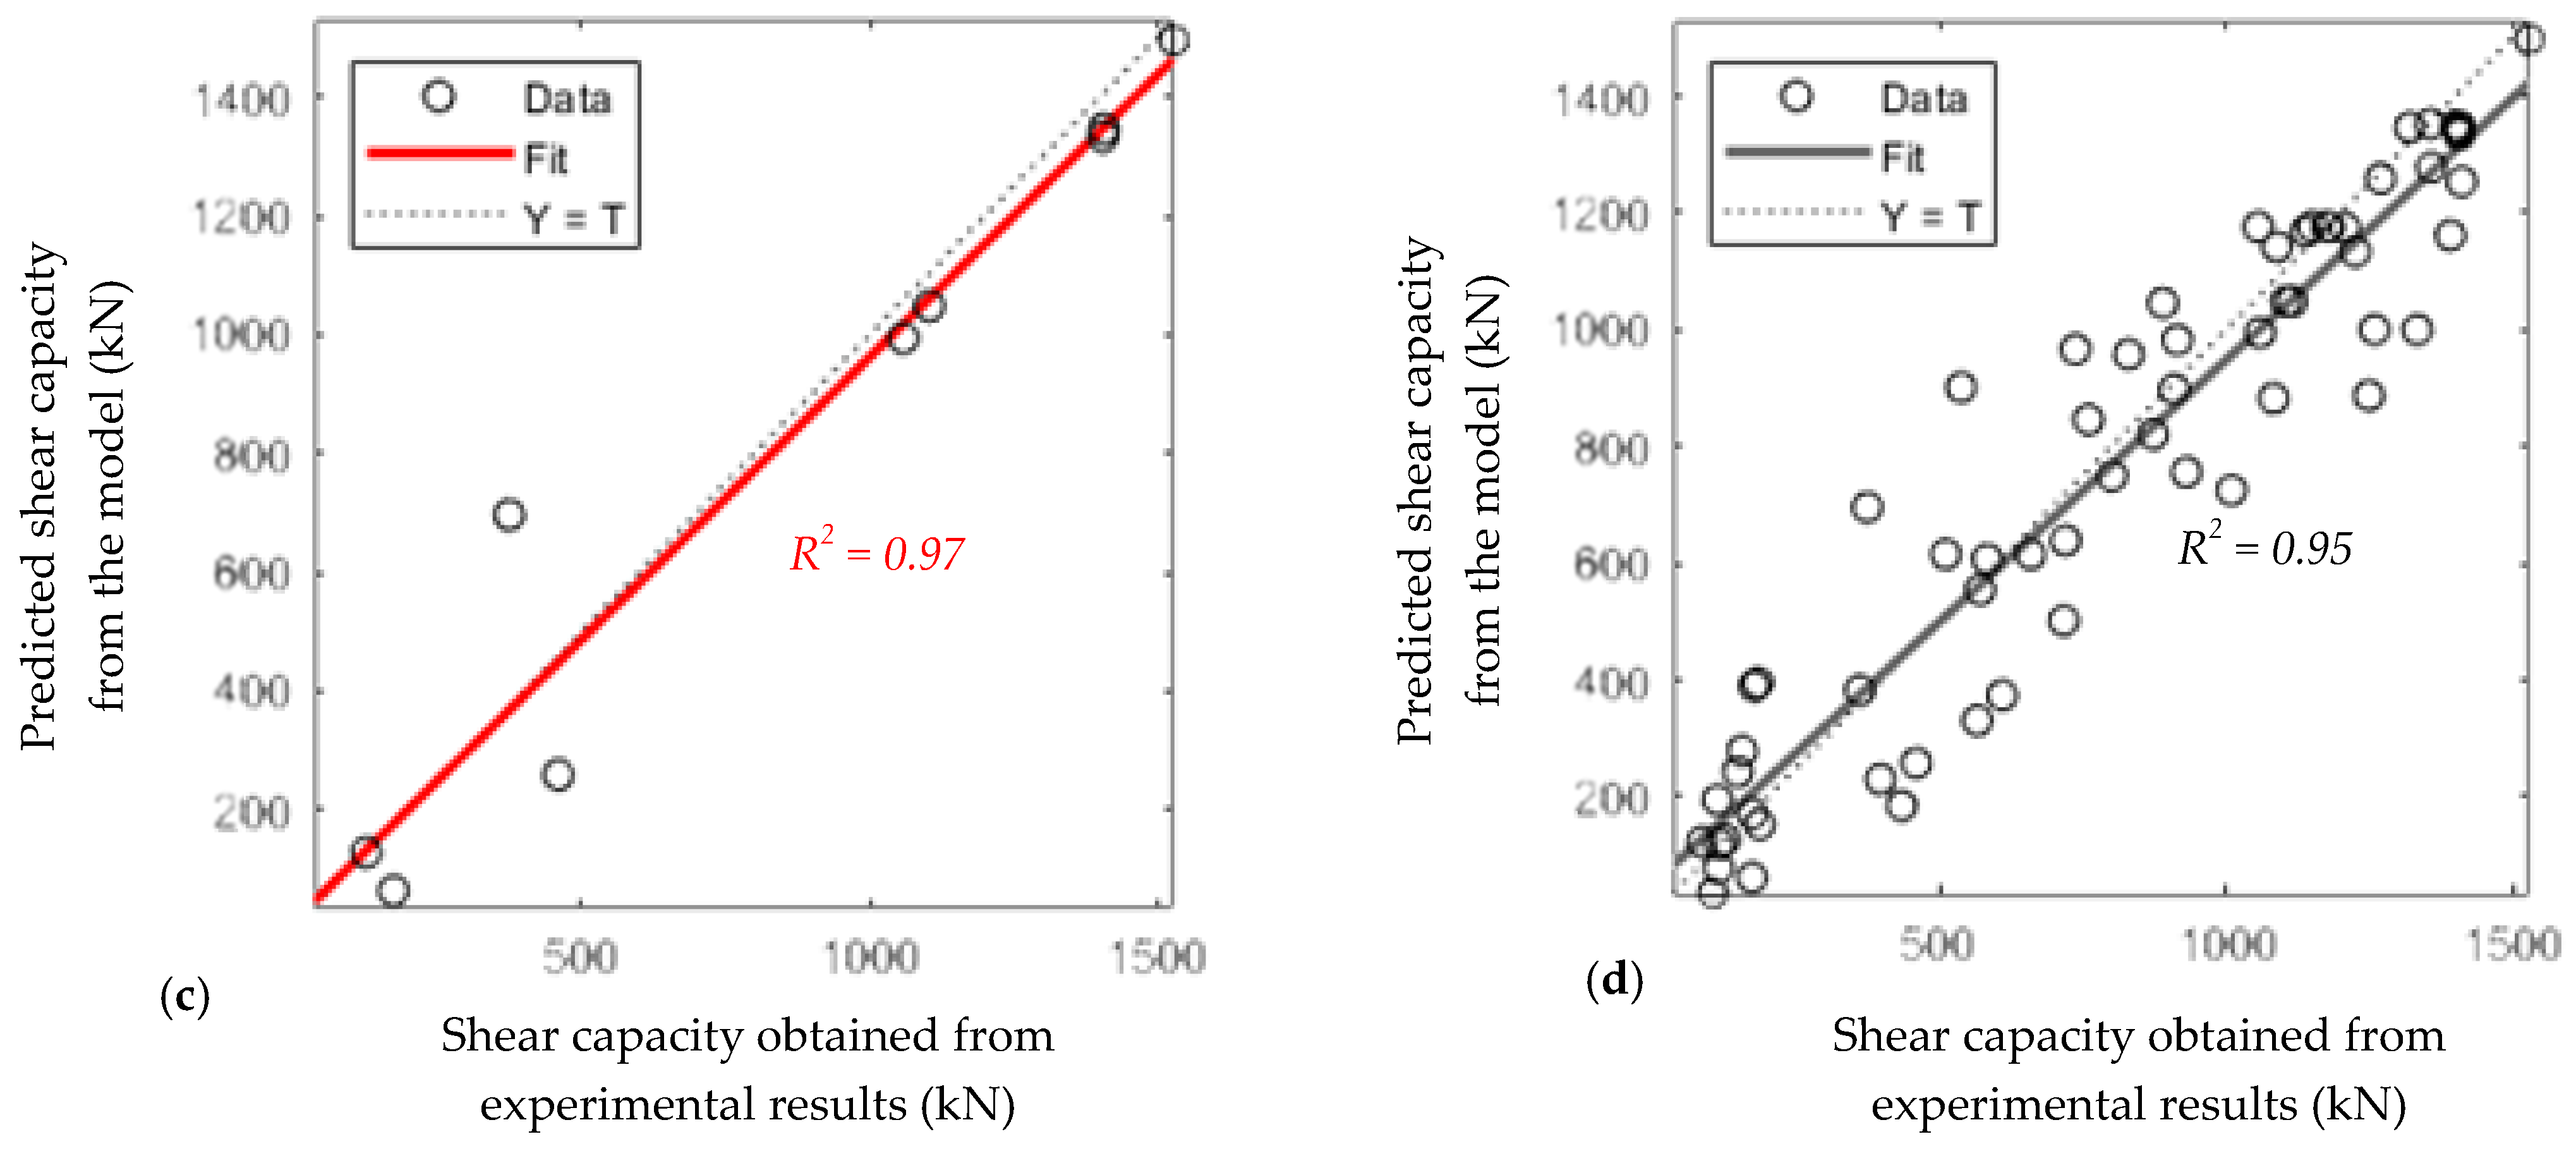
- The performance metrics (R2 and RMSE) of the proposed model were evaluated, indicating that despite dataset heterogeneity, the proposed model remains reliable.
6. Conclusions
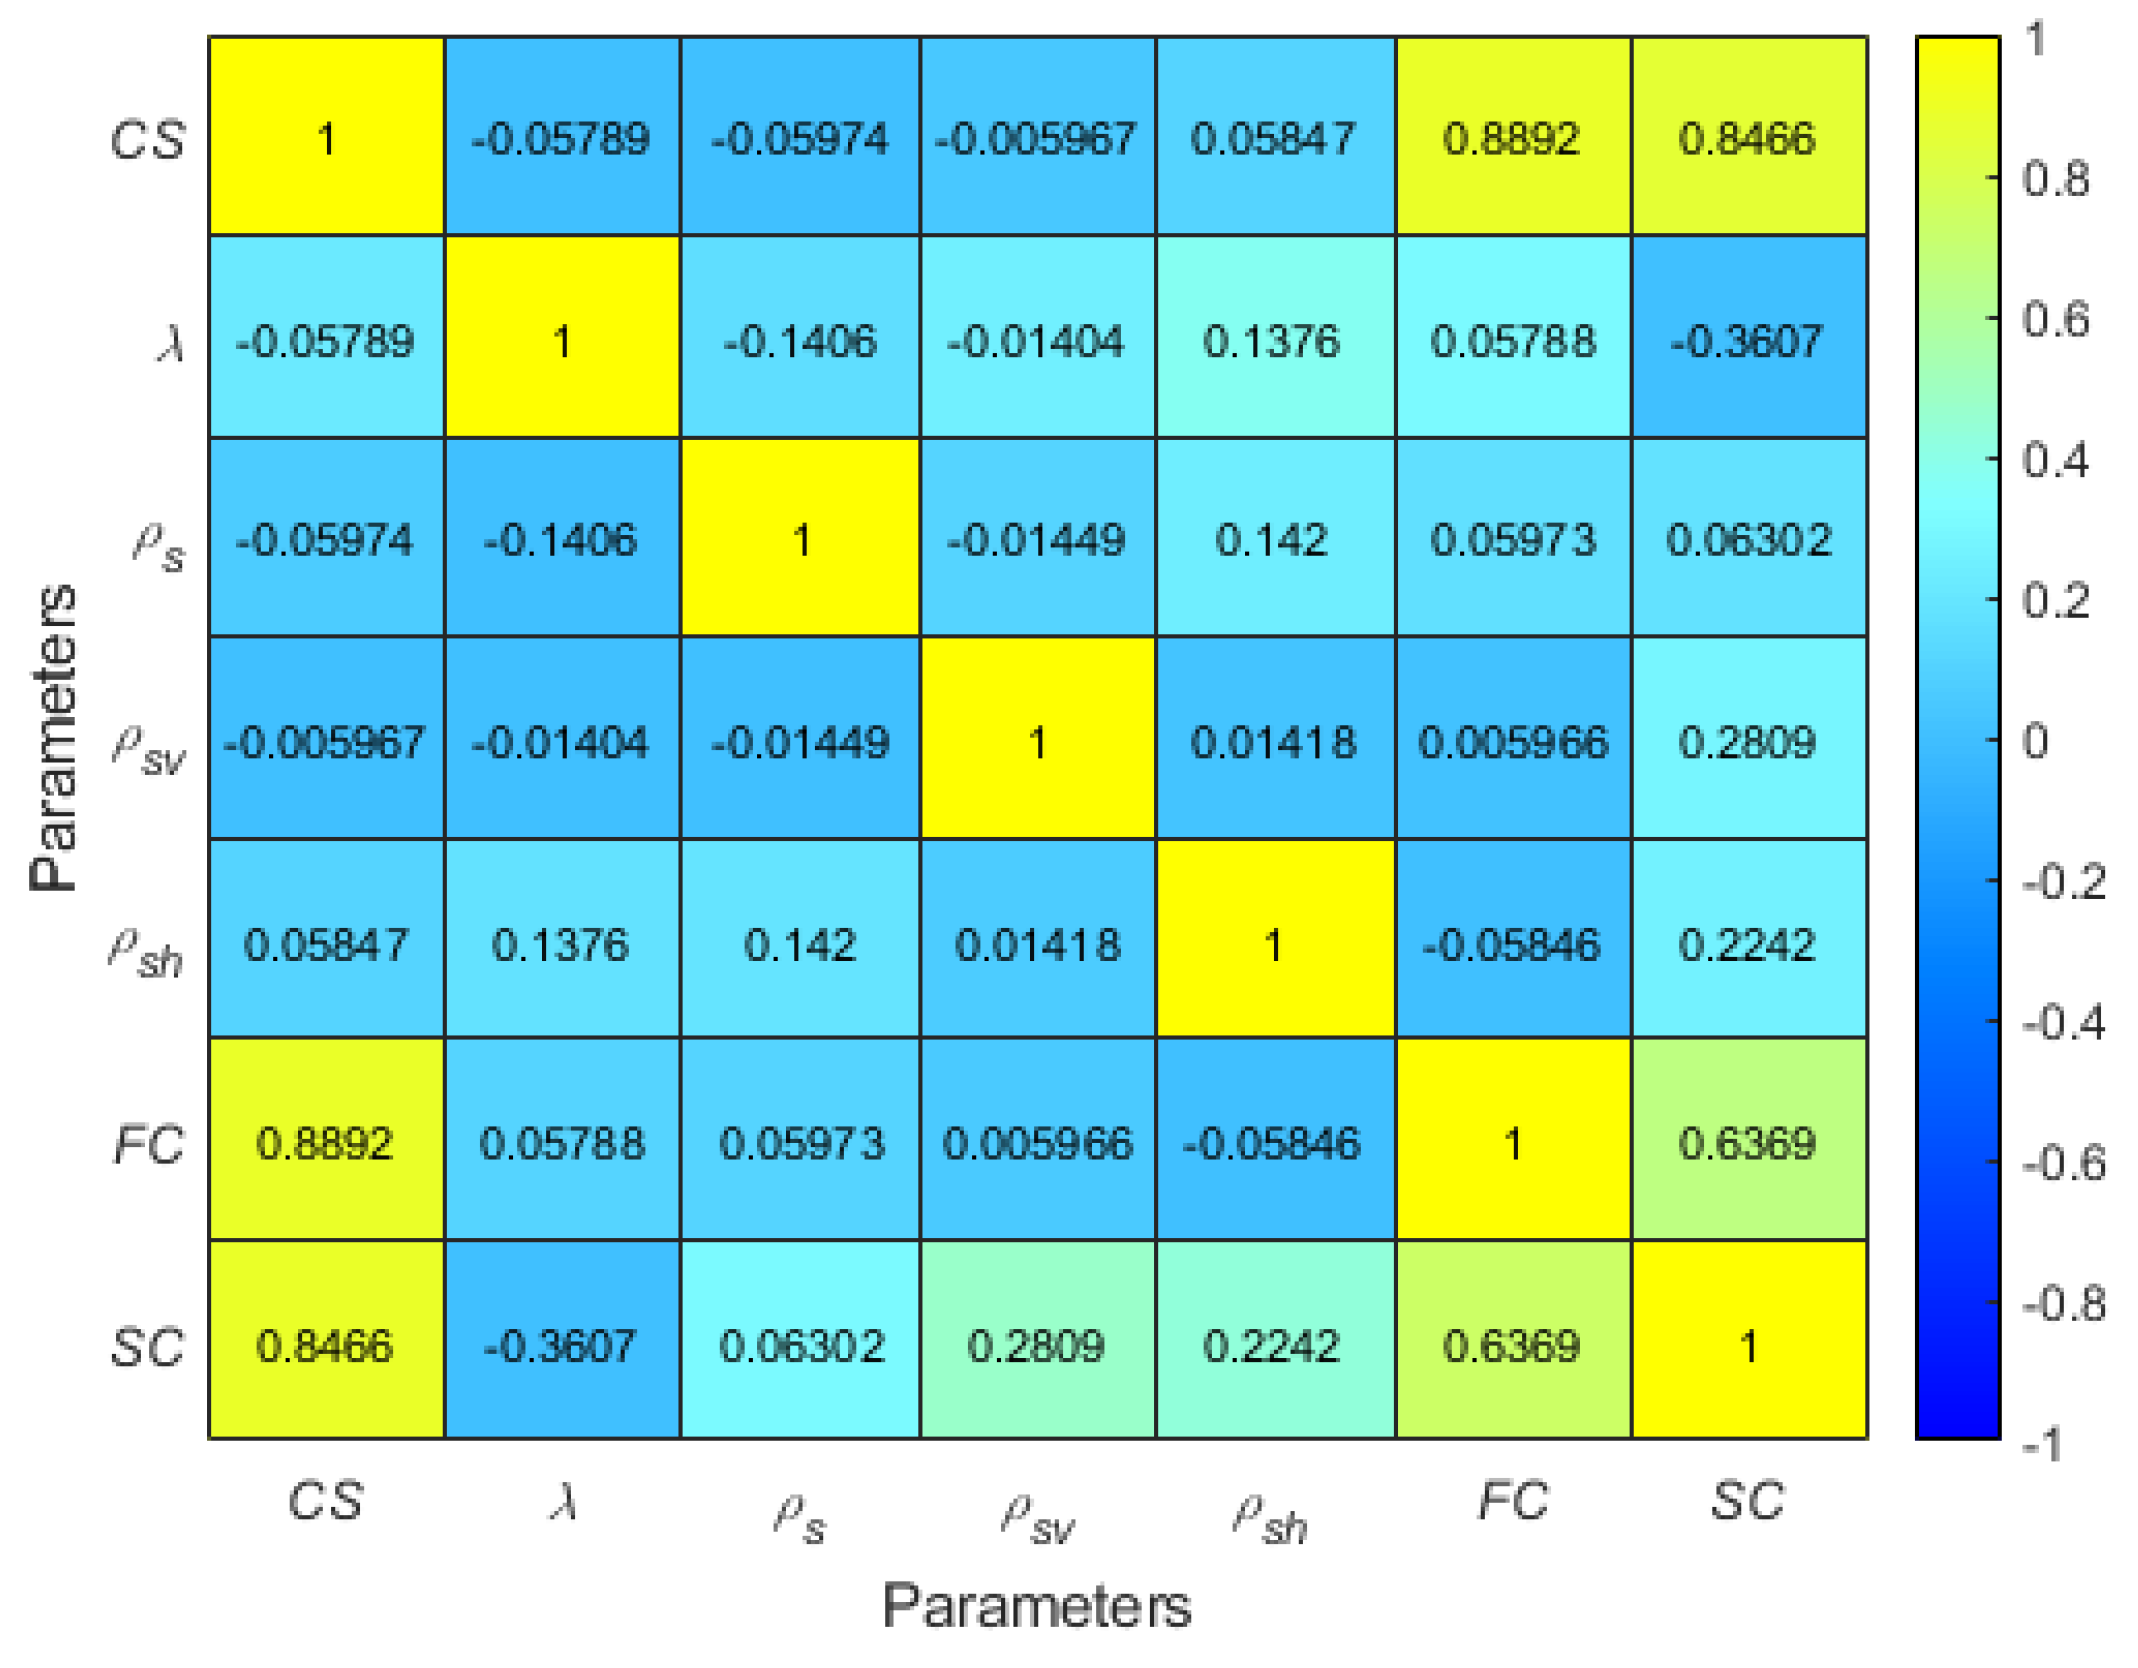
- The most effective factors in predicting the shear capacity of UHPC-DBs across all prediction models were compressive strength, fiber content (FC), and the shear span-to-depth ratio (λ), with correlation coefficients of 0.84, 0.64, and −0.36, respectively.
- The least effective factor in predicting shear capacity was identified as longitudinal reinforcement (ρs), with a correlation coefficient of 0.06.
- The impact of vertical web reinforcement (ρsv) and horizontal web reinforcement (ρsh) in predicting shear capacity was approximately equal, with correlation coefficients of 0.28 and 0.22, respectively.
- Compressive strength and fiber content were found to interact strongly, with a correlation coefficient of 0.89, indicating that incorporating up to 3% fiber significantly increases compressive strength. Notably, both factors were identified as the most influential on the shear capacity of UHPC deep beams (UHPC-DBs) predicted by the proposed models, highlighting their critical role in accurate shear capacity estimation.
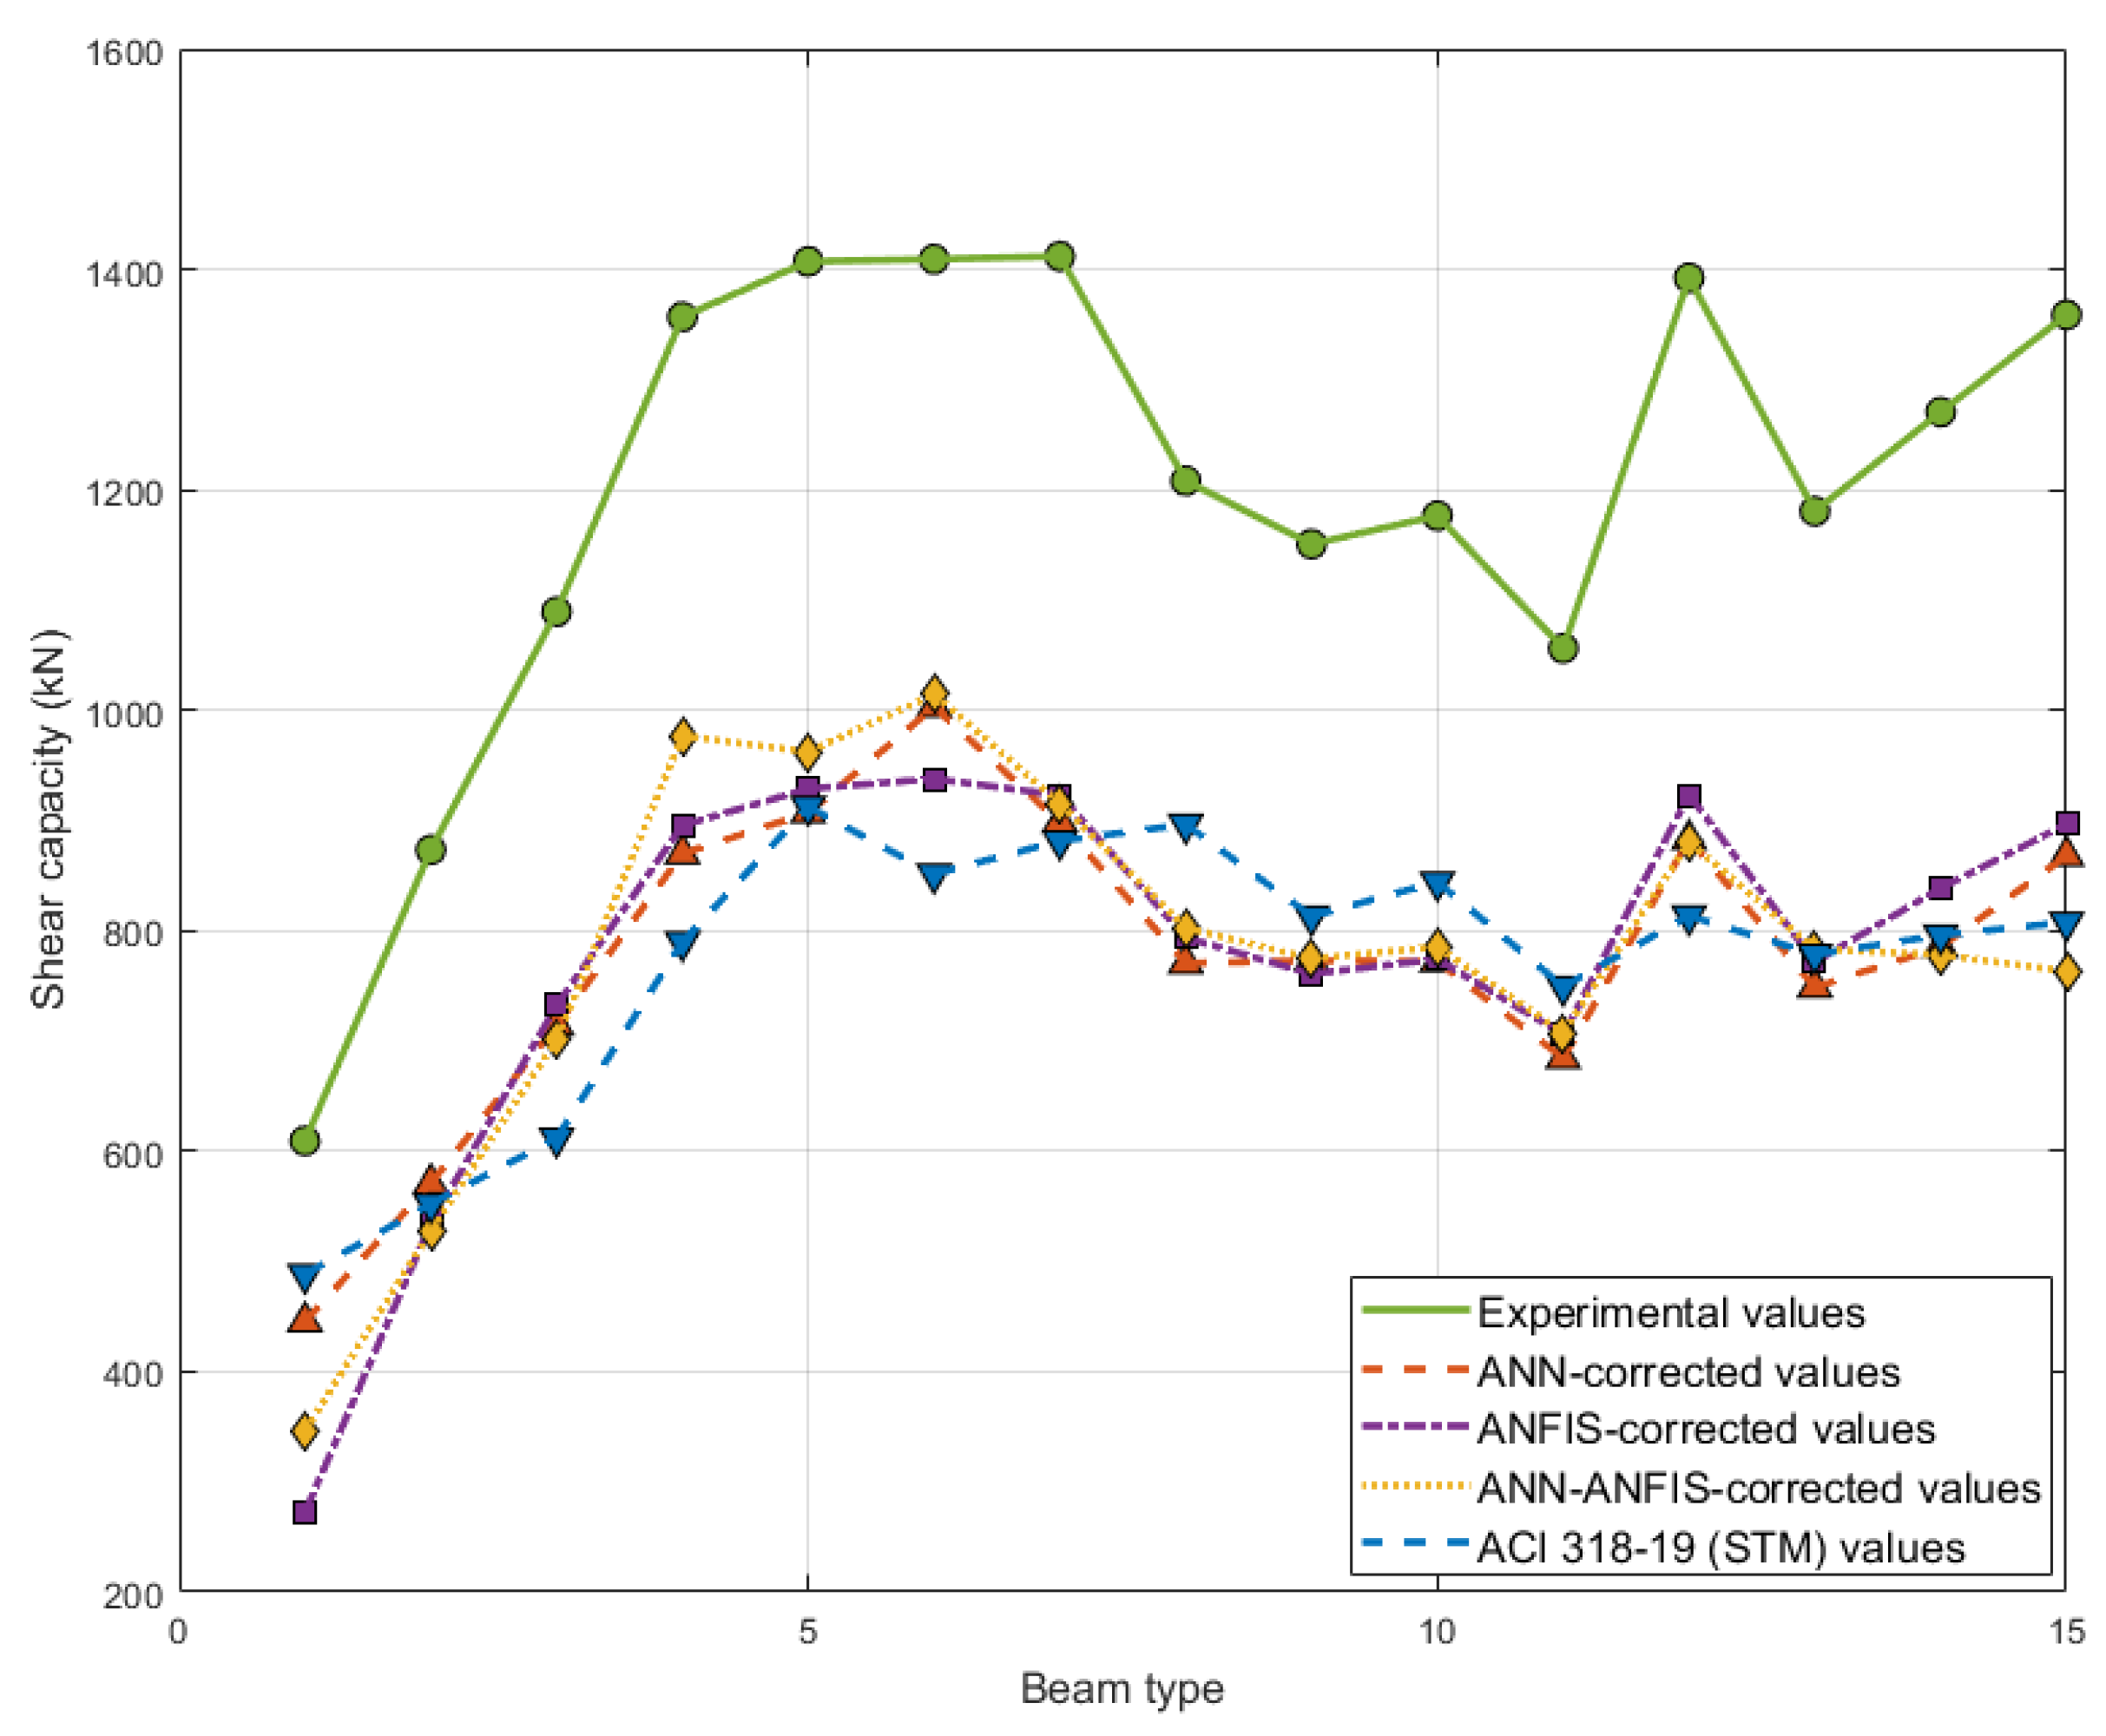
- A novel reliability factor (γ = 1.52) was proposed, allowing the corrected machine learning shear capacity of UHPC-DBs to be calculated. This resulted in a predicted shear capacity with a 0.66 safety margin compared to the experimental values.
- Increasing the fiber content from 0% to 3% enhanced the shear capacity of UHPC-DBs predicted by the ANN, ANFIS, and ANN-ANFIS algorithms by up to 50.89%, 70.65%, and 64.03%, respectively.
- Decreasing the shear span-to-depth ratio (λ) from 0.923 to 0.554 increased the shear capacity of UHPC-DBs, as predicted by the ANN, ANFIS, and ANN-ANFIS algorithms, by up to 23.17%, 15.37%, and 20.87%, respectively.
- Increasing the longitudinal reinforcement (ρs) from 3.19% to 3.62% enhanced the shear capacity of UHPC-DBs, as predicted by the ANFIS and ANN-ANFIS algorithms, by up to 4.15% and 3.43%, respectively.
- An increase in vertical web reinforcement (ρsv) from 0 to 0.38% led to an increase in the predicted shear capacity of UHPC-DBs by up to 22.48%, 23.57%, and 19.65% when predicted by the ANN, ANFIS, and hybrid ANN-ANFIS algorithms, respectively.
- Increasing the horizontal web reinforcement (ρsh) from 0.16% to 0.31% resulted in an increase in the predicted shear capacity of UHPC-DBs by up to 11.23% and 11.48% when estimated by the ANN and ANFIS algorithms, respectively.
Author Contributions
Funding
Institutional Review Board Statement
Informed Consent Statement
Data Availability Statement
Conflicts of Interest
Appendix A
References
- Li, J.; Wu, Z.; Shi, C.; Yuan, Q.; Zhang, Z. Durability of ultra-high performance concrete—A review. Constr. Build. Mater. 2020, 255, 119296. [Google Scholar] [CrossRef]
- Amran, M.; Huang, S.-S.; Onaizi, A.M.; Makul, N.; Abdelgader, H.S.; Ozbakkaloglu, T. Recent trends in ultra-high performance concrete (UHPC): Current status, challenges, and future prospects. Constr. Build. Mater. 2022, 352, 129029. [Google Scholar] [CrossRef]
- Liu, K.; Yu, R.; Shui, Z.; Li, X.; Guo, C.; Yu, B.; Wu, S. Optimization of autogenous shrinkage and microstructure for Ultra-High Performance Concrete (UHPC) based on appropriate application of porous pumice. Constr. Build. Mater. 2019, 214, 369–381. [Google Scholar]
- Abadel, A.A.; Albidah, A.S. Investigation of Shear Reinforcement Schemes for RC Deep Beams. Arab. J. Sci. Eng. 2021, 46, 4747–4763. [Google Scholar] [CrossRef]
- ACI-Committee. Building Code Requirements for Structural Concrete (ACI 318-14) and Commentary (ACI 318R-14); American Concrete Institute: Farmington Hills, MI, USA, 2014. [Google Scholar]
- Mirzaaghabeik, H.; Mashaan, N.S.; Shukla, S.K. Shear Behavior of Ultra-High-Performance Concrete Deep Beams Reinforced with Fibers: A State-of-the-Art Review. Infrastructures 2025, 10, 67. [Google Scholar] [CrossRef]
- Hamzenezhadi, A.; Sharbatdar, M.K.; Kheyroddin, A. Experimental investigation of dimensional ratio effects on shear capacity of high-performance cementitious composites deep beams. J. Build. Eng. 2021, 43, 102862. [Google Scholar] [CrossRef]
- Lateef, A.M.; Ahmed, A.L. Effect of Deep Beam Width on Shear Behavior Produced by Normal and Ultra-High Performance Fiber Reinforced Concrete. Adv. Mech. 2021, 9, 817–827. [Google Scholar]
- Chen, B.; Zhou, J.; Zhang, D.; Su, J.; Nuti, C.; Sennah, K. Experimental study on shear performances of ultra-high performance concrete deep beams. Structures 2022, 39, 310–322. [Google Scholar]
- Smarzewski, P. Analysis of failure mechanics in hybrid fiber-reinforced high-performance concrete deep beams with and without openings. Materials 2018, 12, 101. [Google Scholar]
- Abadel, A.A.; Abbas, H.; Alshaikh, I.M.; Tuladhar, R.; Altheeb, A.; Alamri, M. Experimental study on the effects of external strengthening and elevated temperature on the shear behavior of ultra-high-performance fiber-reinforced concrete deep beams. Structures 2023, 49, 943–957. [Google Scholar]
- Erfan, A.M.; Hafez, R.; Badawy, M.M. Behavior of High Strength Concrete Deep Beams Reinforced with Basalt Fiber Reinforced Polymer Bars with and without Openings. Structures 2024, 69, 107397. [Google Scholar] [CrossRef]
- Abadel, A.; Abbas, H.; Almusallam, T.; Alshaikh, I.M.H.; Khawaji, M.; Alghamdi, H.; Salah, A.A. Experimental study of shear behavior of CFRP strengthened ultra-high-performance fiber-reinforced concrete deep beams. Case Stud. Constr. Mater. 2022, 16, e01103. [Google Scholar] [CrossRef]
- Si, X.-Y.; Zhang, G.-Y.; Zheng, C.; Xu, C.-Y.; Xu, H.; Wang, Y.-L. Experimental study on shear behavior of reinforced concrete deep beams with high-strength bars under uniform load. Structures 2022, 41, 553–567. [Google Scholar] [CrossRef]
- Yousef, A.M.; Tahwia, A.M.; Marami, N.A. Minimum shear reinforcement for ultra-high performance fiber reinforced concrete deep beams. Constr. Build. Mater. 2018, 184, 177–185. [Google Scholar] [CrossRef]
- Deng, B.; Zhang, L.; Wu, S.; Jiang, H.; Tian, Y.; Fang, J.; Zhou, C. Shear Behavior of Non-Stirrup Ultra-High-Performance Concrete Beams: Contribution of Steel Fibers and UHPC. Buildings 2024, 14, 2705. [Google Scholar] [CrossRef]
- Ahmad, S.; Bahij, S.; Al-Osta, M.; Adekunle, S.; Al-Dulaijan, S. Shear behavior of ultra-high-performance concrete beams reinforced with high-strength steel bars. ACI Struct. J. 2019, 116, 3–14. [Google Scholar]
- Abellán-García, J. Artificial neural network model for strength prediction of ultra-high-performance concre. ACI Mater. J. 2021, 118, 3–14. [Google Scholar] [CrossRef]
- Abbas, Y.M.; Fares, G.; Khan, M.I. Strength and sensitivity analysis of shear-deficient ultrahigh performance fiber reinforced concrete beams using hybrid neuro-fuzzy approach. J. Build. Eng. 2023, 72, 106624. [Google Scholar] [CrossRef]
- Nguyen, T.-A.; Ly, H.-B.; Mai, H.-V.T.; Tran, V.Q. On the training algorithms for artificial neural network in predicting the shear strength of deep beams. Complexity 2021, 2021, 5548988. [Google Scholar]
- Jayasinghe, T.; Gunawardena, T.; Mendis, P. Assessment of shear strength of reinforced concrete beams without shear reinforcement: A comparative study between codes of practice and artificial neural network. Case Stud. Constr. Mater. 2022, 16, e01102. [Google Scholar] [CrossRef]
- Le Nguyen, K.; Thi Trinh, H.; Nguyen, T.T.; Nguyen, H.D. Comparative study on the performance of different machine learning techniques to predict the shear strength of RC deep beams: Model selection and industry implications. Expert Syst. Appl. 2023, 230, 120649. [Google Scholar] [CrossRef]
- Li, J.; Yan, G.; Abbud, L.H.; Alkhalifah, T.; Alturise, F.; Khadimallah, M.A.; Marzouki, R. Predicting the shear strength of concrete beam through ANFIS-GA–PSO hybrid modeling. Adv. Eng. Softw. 2023, 181, 103475. [Google Scholar] [CrossRef]
- ACI 318-19; Building Code Requirements for Structural Concrete. ACI: Farmington Hills, MI, USA, 2019.
- Hamoda, A.; Ghalla, M.; Yehia, S.A.; Ahmed, M.; Abadel, A.A.; Baktheer, A.; Shahin, R.I. Experimental and numerical investigations of the shear performance of reinforced concrete deep beams strengthened with hybrid SHCC-mesh. Case Stud. Constr. Mater. 2024, 21, e03495. [Google Scholar] [CrossRef]
- Yousef, A.M.; Tahwia, A.M.; Al-Enezi, M.S. Experimental and Numerical Study of UHPFRC Continuous Deep Beams with Openings. Buildings 2023, 13, 1723. [Google Scholar] [CrossRef]
- He, J.; Chao, L. Numerical analysis on shear resistance of ultra-high performance concrete-normal strength concrete composite beam. Struct. Concr. 2021, 22, 1128–1146. [Google Scholar] [CrossRef]
- Mohammed, M.Y.; Ali, A.Y.; Kadhim, M.M.; Jawdhari, A. RC Deep Beams with Vertical Openings: Behavior and Proposed Mitigation Techniques. Pract. Period. Struct. Des. Constr. 2024, 29, 04023060. [Google Scholar] [CrossRef]
- Al-Enezi, M.S.; Yousef, A.M.; Tahwia, A.M. Shear capacity of UHPFRC deep beams with web openings. Case Stud. Constr. Mater. 2023, 18, e02105. [Google Scholar] [CrossRef]
- Ismail, K.S. Shear Behavior of Reinforced Concrete Deep Beams. Ph.D. Thesis, The University of Sheffield, Faculty of Engineering, Department of Civil and Structural Engineering, Sheffield, UK, 2016. [Google Scholar]
- Ni, X.; Duan, K. Machine Learning-Based Models for Shear Strength Prediction of UHPFRC Beams. Mathematics 2022, 10, 2918. [Google Scholar] [CrossRef]


| References | Beam Dimensions (l × w × d) (mm) | Compressive Strength (MPa) | ρs (%) | ρsv (%) | ρsh (%) | λ | a (mm) | Fiber Content (kg/m3) | Ultimate Shear Capacity (kN) | |
|---|---|---|---|---|---|---|---|---|---|---|
| Steel | Synthetic | |||||||||
| [9] | 1200 × 150 × 600 | 86.5 | 3.62 | 0.19 | 0.16 | 0.923 | 500 | 0 | 0 | 609.42 |
| 113.4 | 0.5 | 873.31 | ||||||||
| 125.6 | 1 | 1089.40 | ||||||||
| 151.4 | 2 | 1356.96 | ||||||||
| 173.6 | 3 | 1407.18 | ||||||||
| 138.5 | 0.554 | 300 | 1 | 1409.21 | ||||||
| 0.739 | 400 | 1411.80 | ||||||||
| 0.923 | 500 | 1208.20 | ||||||||
| 3.19 | 1150.70 | |||||||||
| 3.35 | 1176.40 | |||||||||
| 3.62 | 0 | 1056.30 | ||||||||
| 0.38 | 1392.24 | |||||||||
| 0.15 | 1180.60 | |||||||||
| 0.19 | 0.24 | 1270.6 | ||||||||
| 0.31 | 1358.70 | |||||||||
| [10] | 1000 × 100 × 500 | 114.2 | 3.49 | 0.6 | 0.33 | 0.8 | 400 | 0 | 0 | 915 |
| 88.1 | 0 | 0 | 1 | 0.25 | 566 | |||||
| 84.7 | 2 | 0.5 | 571 | |||||||
| [11] | 1000 × 150 × 300 | 139 | 2.01 | 0 | 0 | 0.961 | 250 | 1.5 | 0 | 1115 |
| 0.78 | 1260 | |||||||||
| [12] | 1500 × 150 × 500 | 60 | 0.42 | 0.6 | 0.349 | 0.87 | 400 | 0 | 0 | 583 |
| 0.51 | 659 | |||||||||
| 0.81 | 720 | |||||||||
| 0.51 | 511 | |||||||||
| [13] | 1000 × 150 × 300 | 139 | 2.01 | 0 | 0 | 0.961 | 250 | 1.5 | 0 | 1104.9 |
| 0.78 | 1334.0 | |||||||||
| [14] | 1600 × 200 × 600 | 73.16 | 0.67 | 0.33 | 0.33 | 0.13 | 75 | 0 | 0 | 1321 |
| 1.05 | 1401 | |||||||||
| 1.27 | 1409 | |||||||||
| 1.05 | 0.25 | 1226 | ||||||||
| 0.5 | 1531 | |||||||||
| [15] | 1000 × 80 × 400 | 172.9 | 3.67 | 0.47 | 0 | 0.79 | 276.5 | 1.5 | 0 | 890 |
| 0.84 | 1060 | |||||||||
| 0.47 | 0.94 | 329 | 830 | |||||||
| 0.84 | 910 | |||||||||
| 1.68 | 1010 | |||||||||
| [16] | 800 × 150 × 300 | 158.8 | 7.05 | 0 | 0 | 1.2 | 293.4 | 2 | 0 | 737.5 |
| 1100 × 150 × 300 | 1.8 | 440.1 | 538 | |||||||
| 1700 × 150 × 300 | 3.1 | 758.0 | 374 | |||||||
| 800 × 150 × 300 | 126.1 | 1.2 | 293.4 | 0 | 434 | |||||
| 1100 × 150 × 300 | 126.1 | 1.8 | 440.1 | 112.5 | ||||||
| 1700 × 150 × 300 | 126.1 | 3.1 | 758 | 173 | ||||||
| 1800 × 200 × 350 | 160.3 | 7.62 | 2 | 582 | 2 | 1250 | ||||
| 155 | 1.5 | 931 | ||||||||
| 113.8 | 0 | 459.5 | ||||||||
| 1800 × 200 × 400 | 160.3 | 6.67 | 2 | 682 | 2 | 1083.5 | ||||
| 155 | 1.5 | 801.5 | ||||||||
| 113.8 | 0 | 397 | ||||||||
| [17] | 2000 × 150 × 225 | 140 | 2.62 | 2.33 | 0 | 1.8 | 328.5 | 1 | 0 | 172.5 |
| 150 | 2 | 186 | ||||||||
| 140 | 1.40 | 1 | 147.5 | |||||||
| 150 | 2 | 176 | ||||||||
| 140 | 3.67 | 1 | 155.5 | |||||||
| 150 | 2 | 182.8 | ||||||||
| 140 | 2.62 | 2.6 | 474.5 | 1 | 104.0 | |||||
| 3.67 | 114.5 | |||||||||
| 150 | 2.62 | 2 | 116 | |||||||
| 3.67 | 125.05 | |||||||||
| [25] | 750 × 150 × 400 | 67 | 1.38% | 0.419 | 0 | 0.75 | 300 | 0 | 1 | 85.32 |
| [26] | 1900 × 80 × 400 | 132.5 | 9.5 | 0.708 | 0.236 | 0.875 | 350 | 1.5 | 0 | 1140 |
| [27] | 2700 × 200 × 500 | 150 | 3.44 | 0.5 | 0 | 2.7 | 1350 | 2.5 | 0 | 717 |
| [28] | 1200 × 150 × 400 | 84.63 | 1.05 | 0 | 0 | 1 | 400 | 1.5 | 0 | 361 |
| [29] | 1000 × 80 × 400 | 132.10 | 5.46 | 0.35 | 0 | 0.79 | 276.5 | 1.5 | 0 | 760 |
| CS | ρs | ρsv | ρsh | λ | FC | SC | |
|---|---|---|---|---|---|---|---|
| Mean | 128.2211 | 3.7175 | 0.4946 | 0.1005 | 1.2632 | 1.0794 | 825.2937 |
| SD | 33.478 | 2.1392 | 0.5822 | 0.1357 | 0.7332 | 0.7891 | 421.2709 |
| Minimum | 60 | 0.42 | 0 | 0 | 0.13 | 0 | 134.30 |
| Maximum | 173.60 | 9.5 | 2.33 | 0.5 | 3.10 | 3 | 1536.80 |
| Type | Input | Input | Input | Input | Input | Input | Output |
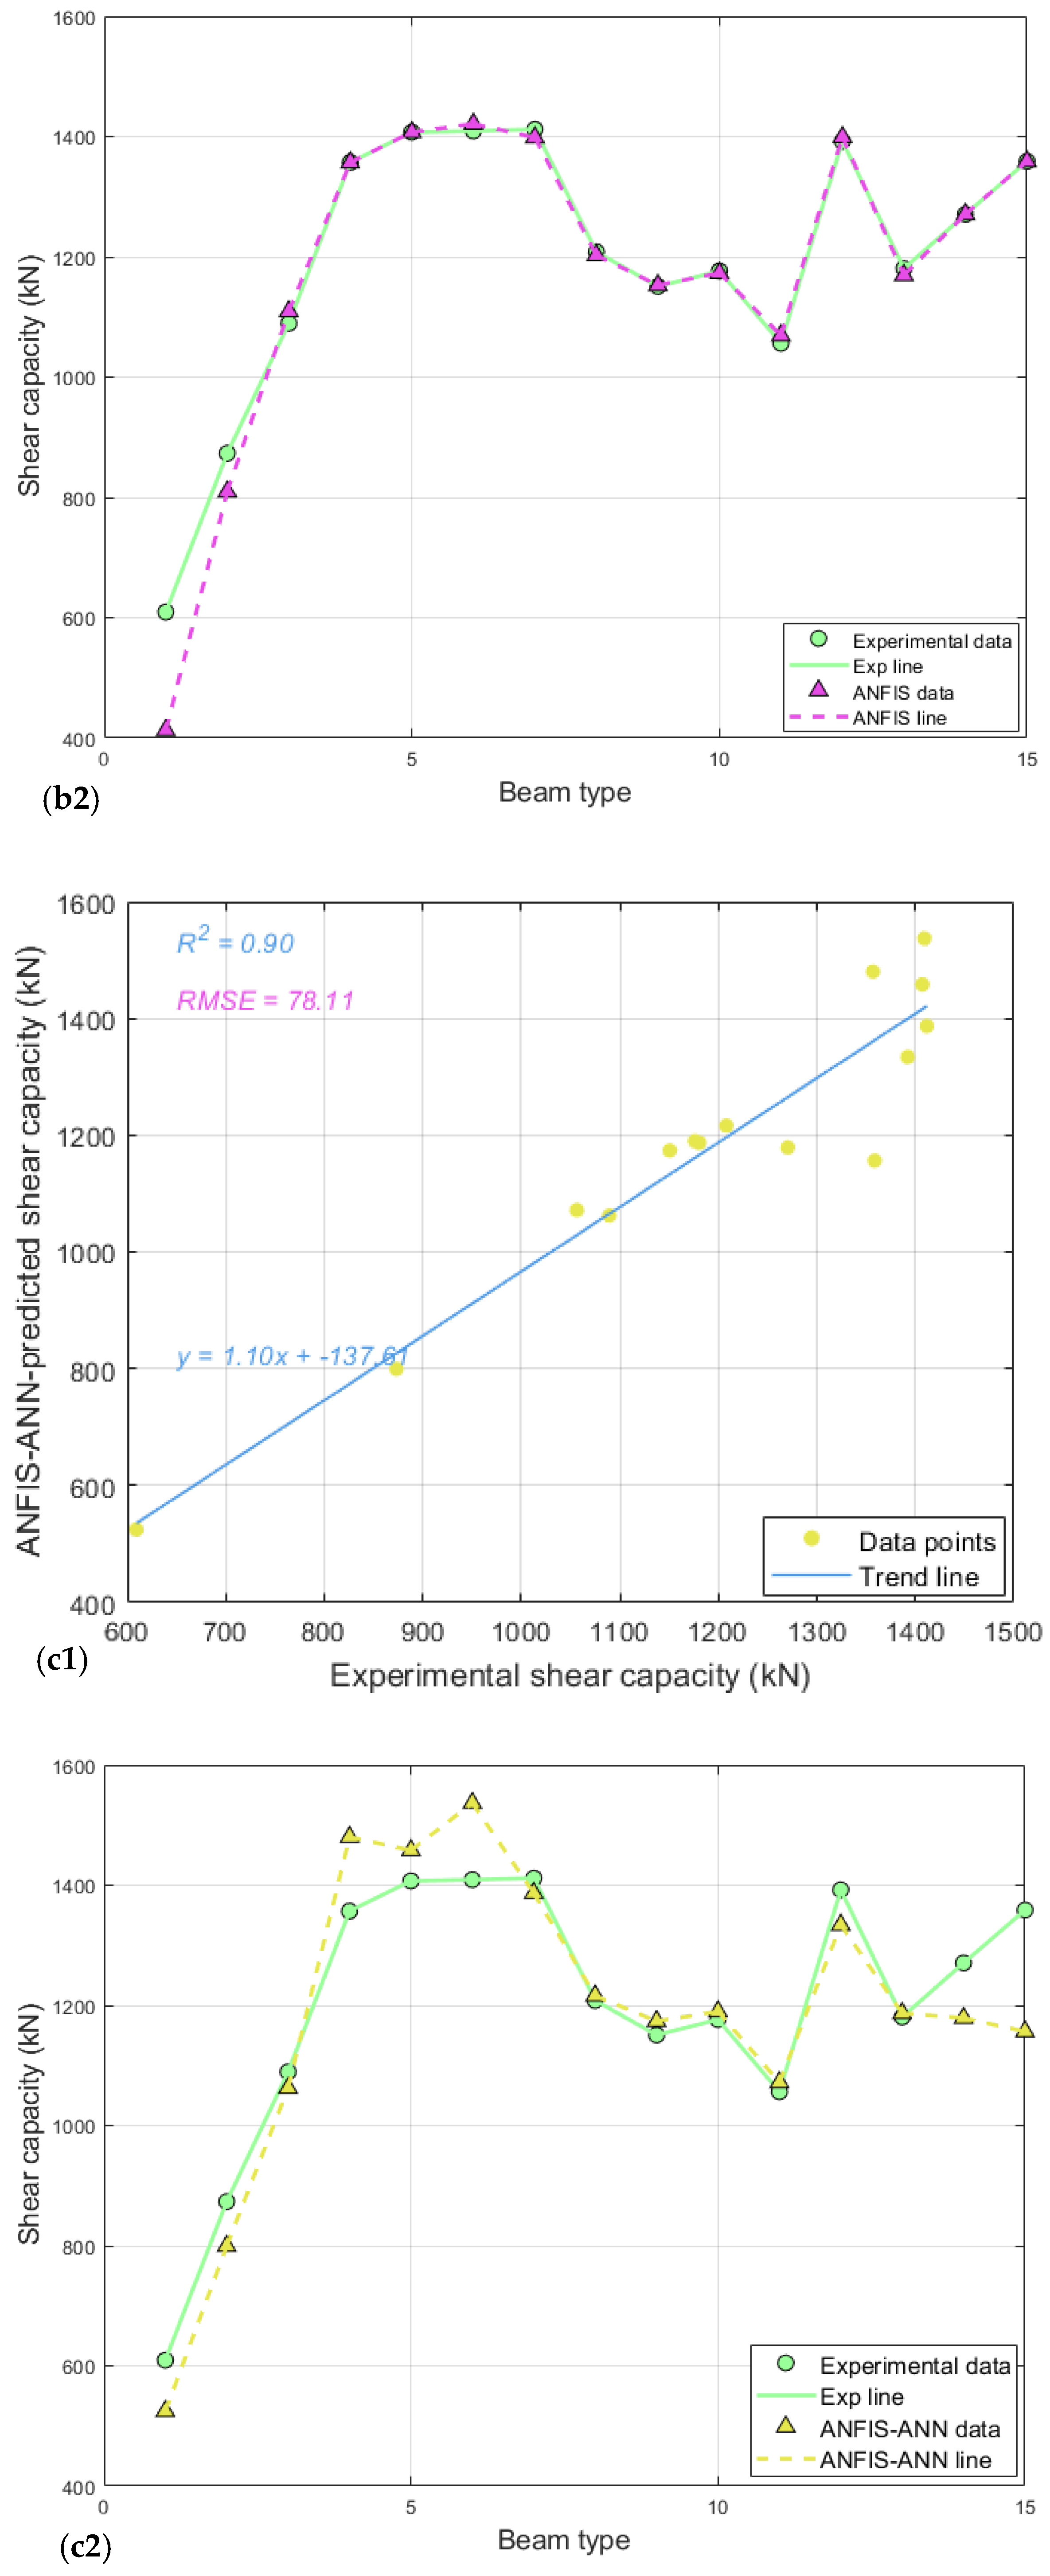
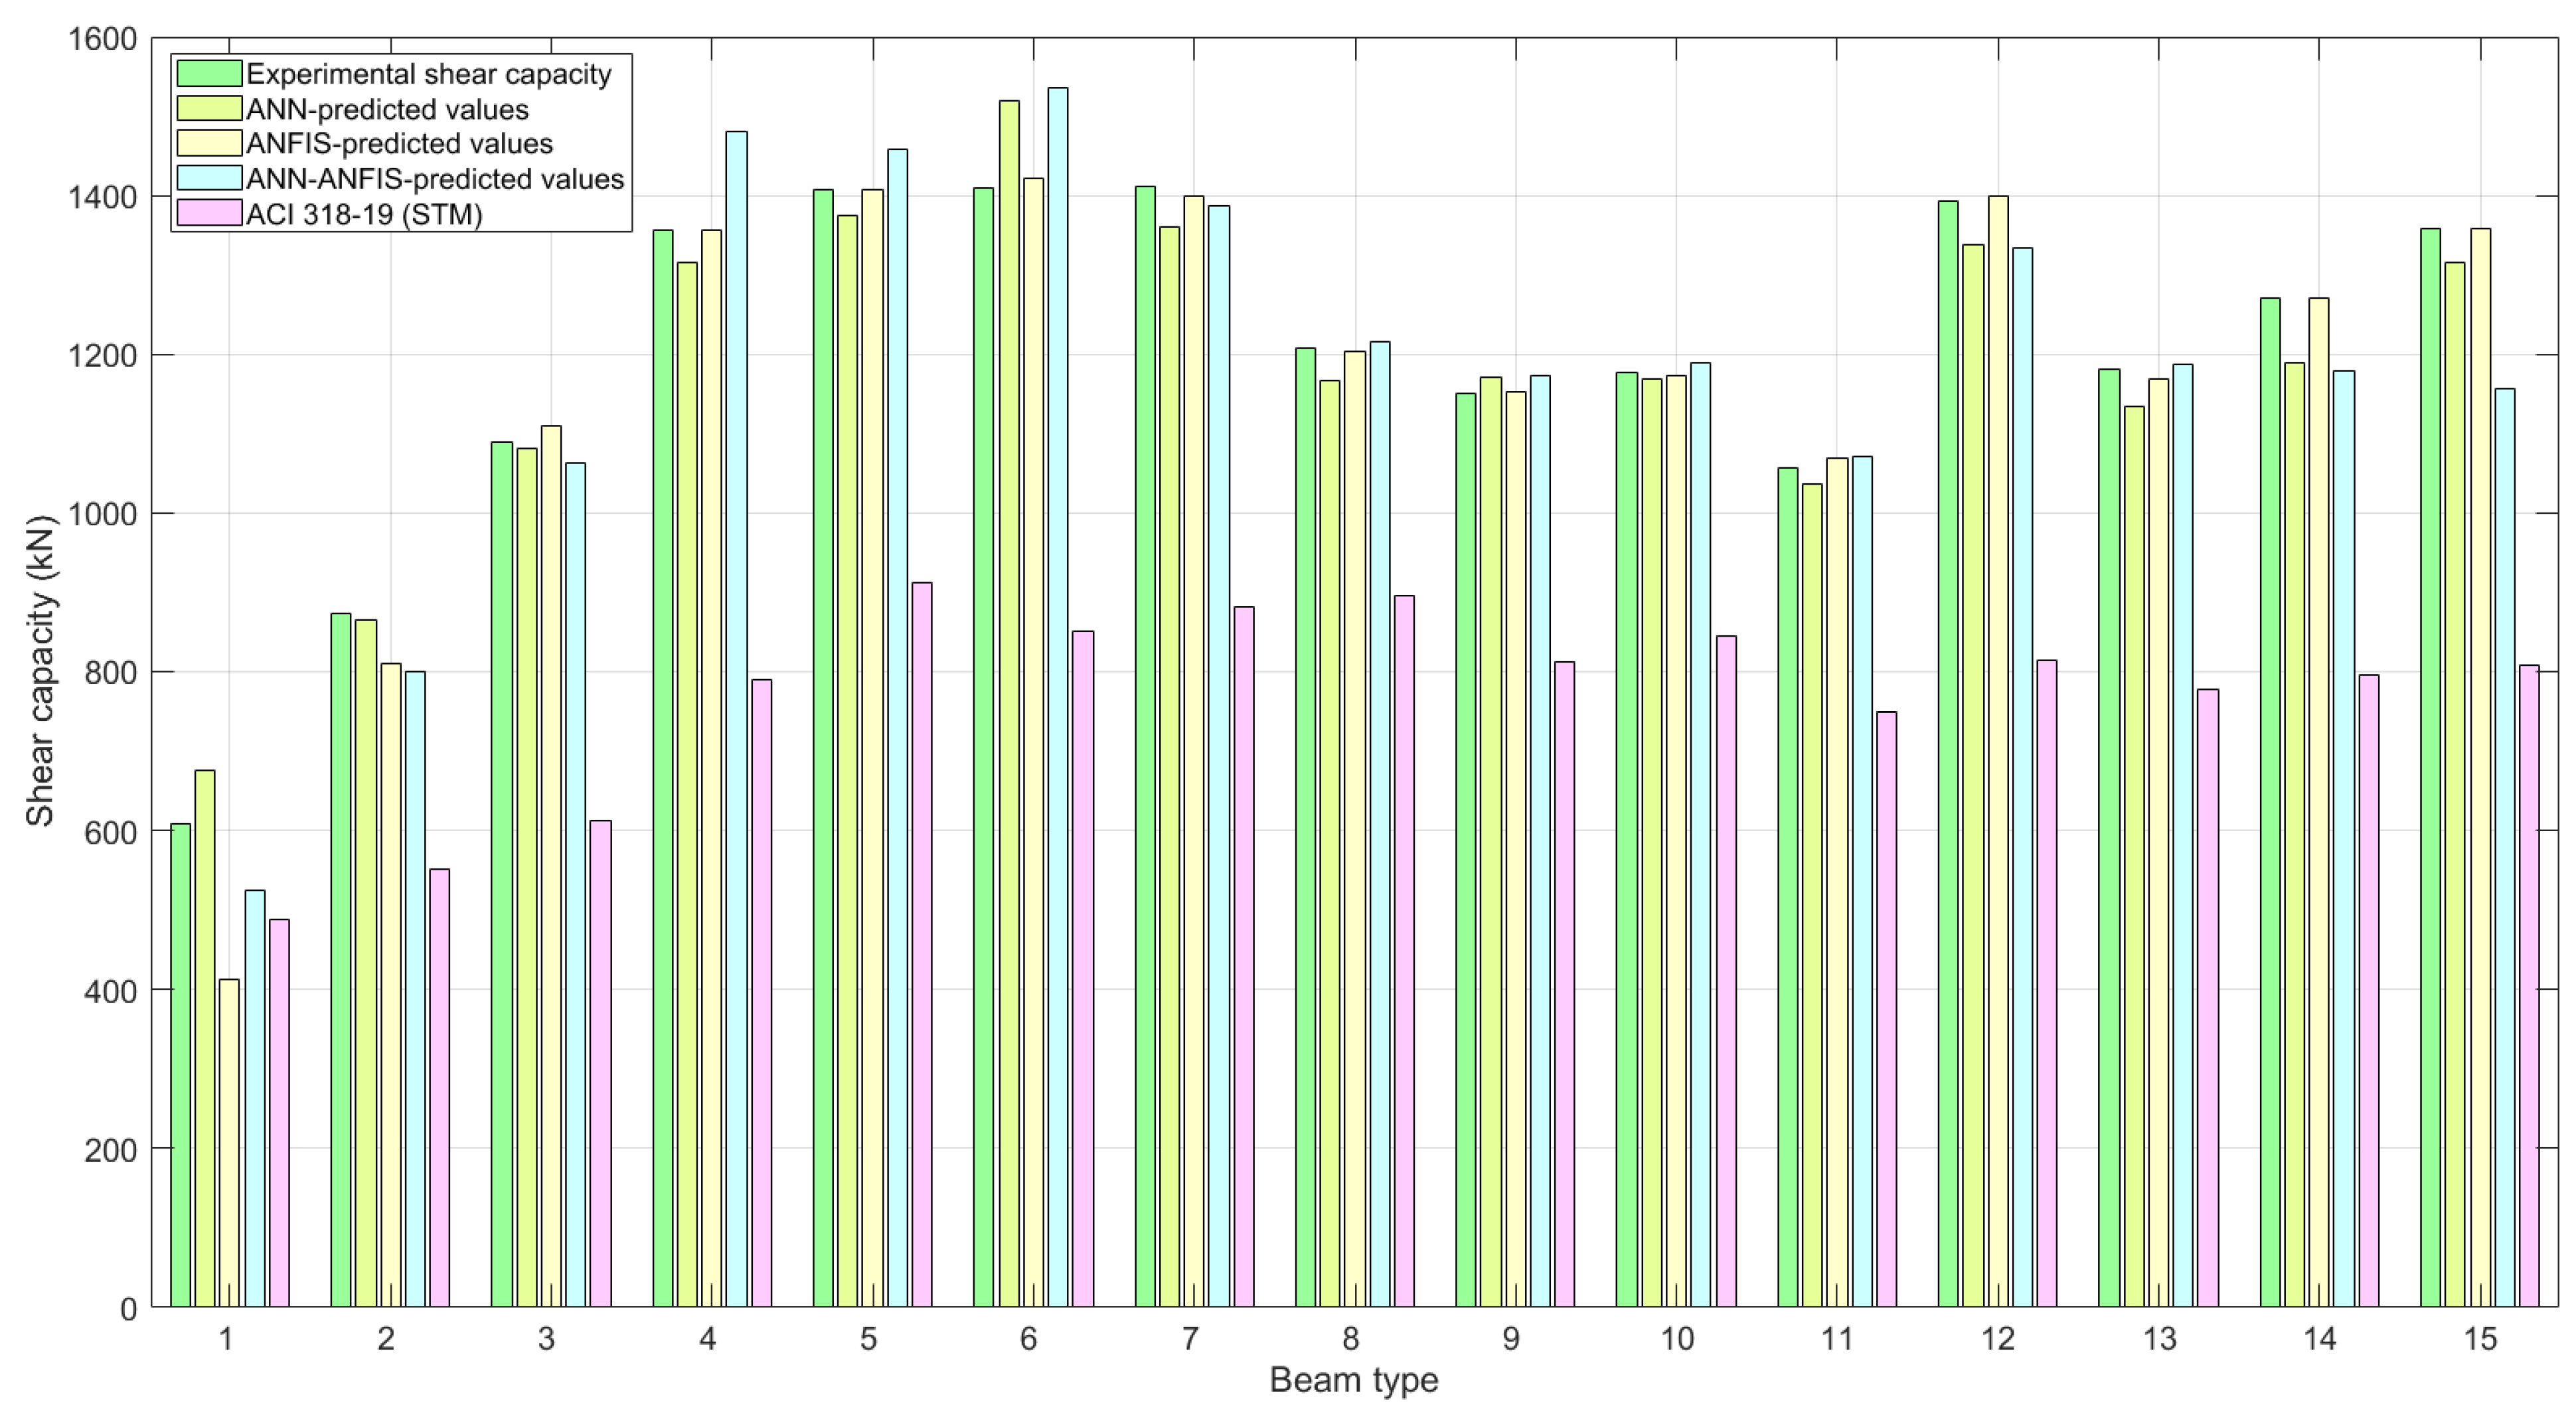
| Beam Type [9] | Compressive Strength (MPa) | ρs (%) | ρsv (%) | ρsh (%) | λ | Fiber Content (kg/m3) | Experimental Shear Capacity (kN) [9] | ANN-Predicted Values (kN) | ANFIS-Predicted Values (kN) | ANN-ANFIS-Predicted Values (kN) | ACI 318-19 (STM) Values (kN) |
|---|---|---|---|---|---|---|---|---|---|---|---|
| 1 | 86.5 | 3.62 | 0.19 | 0.16 | 0.923 | 0 | 609.42 | 674.9 | 413 | 524.4 | 488.23 |
| 2 | 113.4 | 0.5 | 873.31 | 864.7 | 809.5 | 799.4 | 552.19 | ||||
| 3 | 125.6 | 1 | 1089.40 | 1082.2 | 1109.4 | 1062.4 | 611.84 | ||||
| 4 | 151.4 | 2 | 1356.96 | 1315 | 1356.9 | 1480.1 | 789.77 | ||||
| 5 | 173.6 | 3 | 1407.18 | 1374.3 | 1407.2 | 1458 | 912.64 | ||||
| 6 | 138.5 | 0.554 | 1 | 1409.21 | 1519.7 | 1421 | 1536.8 | 851.31 | |||
| 7 | 0.739 | 1411.80 | 1361.4 | 1398.3 | 1386.8 | 881.54 | |||||
| 8 | 0.923 | 1208.20 | 1167.6 | 1202.6 | 1216.1 | 896.42 | |||||
| 9 | 3.19 | 1150.70 | 1171 | 1152.7 | 1173.8 | 813.12 | |||||
| 10 | 3.35 | 1176.40 | 1169.9 | 1173.1 | 1189.9 | 844.22 | |||||
| 11 | 3.62 | 0 | 1056.30 | 1036.9 | 1069.2 | 1071.8 | 749.38 | ||||
| 12 | 0.38 | 1392.24 | 1337.6 | 1398.9 | 1333.9 | 813.52 | |||||
| 13 | 0.15 | 1180.60 | 1134.4 | 1169.3 | 1187 | 778.53 | |||||
| 14 | 0.19 | 0.24 | 1270.6 | 1189.9 | 1270.8 | 1179 | 796.02 | ||||
| 15 | 0.31 | 1358.70 | 1315.3 | 1358.6 | 1156.5 | 807.69 |
| Beam Type [9] | Compressive Strength (MPa) | ρs (%) | ρsv (%) | ρsh (%) | λ | Fiber Content (kg/m3) | Exp/ACI | ANN/ACI | ANFIS/ACI | (ANN-ANFIS)/ACI |
|---|---|---|---|---|---|---|---|---|---|---|
| 1 | 86.5 | 3.62 | 0.19 | 0.16 | 0.923 | 0 | 1.25 | 1.38 | 0.85 | 1.07 |
| 2 | 113.4 | 0.5 | 1.58 | 1.57 | 1.46 | 1.45 | ||||
| 3 | 125.6 | 1 | 1.78 | 1.77 | 1.81 | 1.74 | ||||
| 4 | 151.4 | 2 | 1.72 | 1.66 | 1.72 | 1.87 | ||||
| 5 | 173.6 | 3 | 1.54 | 1.51 | 1.54 | 1.60 | ||||
| 6 | 138.5 | 0.554 | 1 | 1.65 | 1.78 | 1.67 | 1.80 | |||
| 7 | 0.739 | 1.60 | 1.54 | 1.59 | 1.57 | |||||
| 8 | 0.923 | 1.35 | 1.30 | 1.34 | 1.36 | |||||
| 9 | 3.19 | 1.41 | 1.44 | 1.42 | 1.44 | |||||
| 10 | 3.35 | 1.39 | 1.38 | 1.39 | 1.41 | |||||
| 11 | 3.62 | 0 | 1.41 | 1.38 | 1.43 | 1.43 | ||||
| 12 | 0.38 | 1.71 | 1.64 | 1.72 | 1.64 | |||||
| 13 | 0.15 | 1.52 | 1.45 | 1.51 | 1.52 | |||||
| 14 | 0.19 | 0.24 | 1.60 | 1.49 | 1.60 | 1.48 | ||||
| 15 | 0.31 | 1.68 | 1.63 | 1.68 | 1.43 | |||||
| Average | 1.546 | 1.528 | 1.515 | 1.52 | ||||||
| Beam Type [9] | Compressive Strength (MPa) | ρs (%) | ρsv (%) | ρsh (%) | λ | Fiber Content (kg/m3) | Experimental Shear Capacity (kN) [9] | ANN-Corrected Predicted Values (kN) | ANFIS-Corrected Predicted Values (kN) | ANN-ANFIS-Corrected Predicted Values (kN) | ACI 318-19 (STM) Values (kN) |
|---|---|---|---|---|---|---|---|---|---|---|---|
| 1 | 86.5 | 3.62 | 0.19 | 0.16 | 0.923 | 0 | 609.42 | 445.434 | 272.58 | 346.104 | 488.23 |
| 2 | 113.4 | 0.5 | 873.31 | 570.702 | 534.27 | 527.604 | 552.19 | ||||
| 3 | 125.6 | 1 | 1089.40 | 714.252 | 732.204 | 701.184 | 611.84 | ||||
| 4 | 151.4 | 2 | 1356.96 | 869.9 | 895.554 | 976.866 | 789.77 | ||||
| 5 | 173.6 | 3 | 1407.18 | 907.038 | 928.752 | 962.28 | 912.64 | ||||
| 6 | 138.5 | 0.554 | 1 | 1409.21 | 1003.002 | 937.86 | 1014.288 | 851.31 | |||
| 7 | 0.739 | 1411.80 | 898.524 | 922.878 | 915.288 | 881.54 | |||||
| 8 | 0.923 | 1208.20 | 770.616 | 793.716 | 802.626 | 896.42 | |||||
| 9 | 3.19 | 1150.70 | 772.86 | 760.782 | 774.708 | 813.12 | |||||
| 10 | 3.35 | 1176.40 | 772.134 | 774.246 | 785.334 | 844.22 | |||||
| 11 | 3.62 | 0 | 1056.30 | 684.354 | 705.672 | 707.388 | 749.38 | ||||
| 12 | 0.38 | 1392.24 | 882.816 | 923.274 | 880.374 | 813.52 | |||||
| 13 | 0.15 | 1180.60 | 748.704 | 771.738 | 783.42 | 778.53 | |||||
| 14 | 0.19 | 0.24 | 1270.6 | 785.334 | 838.728 | 778.14 | 796.02 | ||||
| 15 | 0.31 | 1358.70 | 868.098 | 896.676 | 763.29 | 807.69 |
Disclaimer/Publisher’s Note: The statements, opinions and data contained in all publications are solely those of the individual author(s) and contributor(s) and not of MDPI and/or the editor(s). MDPI and/or the editor(s) disclaim responsibility for any injury to people or property resulting from any ideas, methods, instructions or products referred to in the content. |
© 2025 by the authors. Licensee MDPI, Basel, Switzerland. This article is an open access article distributed under the terms and conditions of the Creative Commons Attribution (CC BY) license (https://creativecommons.org/licenses/by/4.0/).
Share and Cite
Mirzaaghabeik, H.; Mashaan, N.S.; Shukla, S.K. A Predictive Model for the Shear Capacity of Ultra-High-Performance Concrete Deep Beams Reinforced with Fibers Using a Hybrid ANN-ANFIS Algorithm. Appl. Mech. 2025, 6, 27. https://doi.org/10.3390/applmech6020027
Mirzaaghabeik H, Mashaan NS, Shukla SK. A Predictive Model for the Shear Capacity of Ultra-High-Performance Concrete Deep Beams Reinforced with Fibers Using a Hybrid ANN-ANFIS Algorithm. Applied Mechanics. 2025; 6(2):27. https://doi.org/10.3390/applmech6020027
Chicago/Turabian StyleMirzaaghabeik, Hossein, Nuha S. Mashaan, and Sanjay Kumar Shukla. 2025. "A Predictive Model for the Shear Capacity of Ultra-High-Performance Concrete Deep Beams Reinforced with Fibers Using a Hybrid ANN-ANFIS Algorithm" Applied Mechanics 6, no. 2: 27. https://doi.org/10.3390/applmech6020027
APA StyleMirzaaghabeik, H., Mashaan, N. S., & Shukla, S. K. (2025). A Predictive Model for the Shear Capacity of Ultra-High-Performance Concrete Deep Beams Reinforced with Fibers Using a Hybrid ANN-ANFIS Algorithm. Applied Mechanics, 6(2), 27. https://doi.org/10.3390/applmech6020027