Mechanical Properties of AM Polymer Specimens Under Bending Stress


Abstract
1. Introduction
2. Materials and Methods
2.1. Parameters
2.1.1. Temperature
2.1.2. Speed
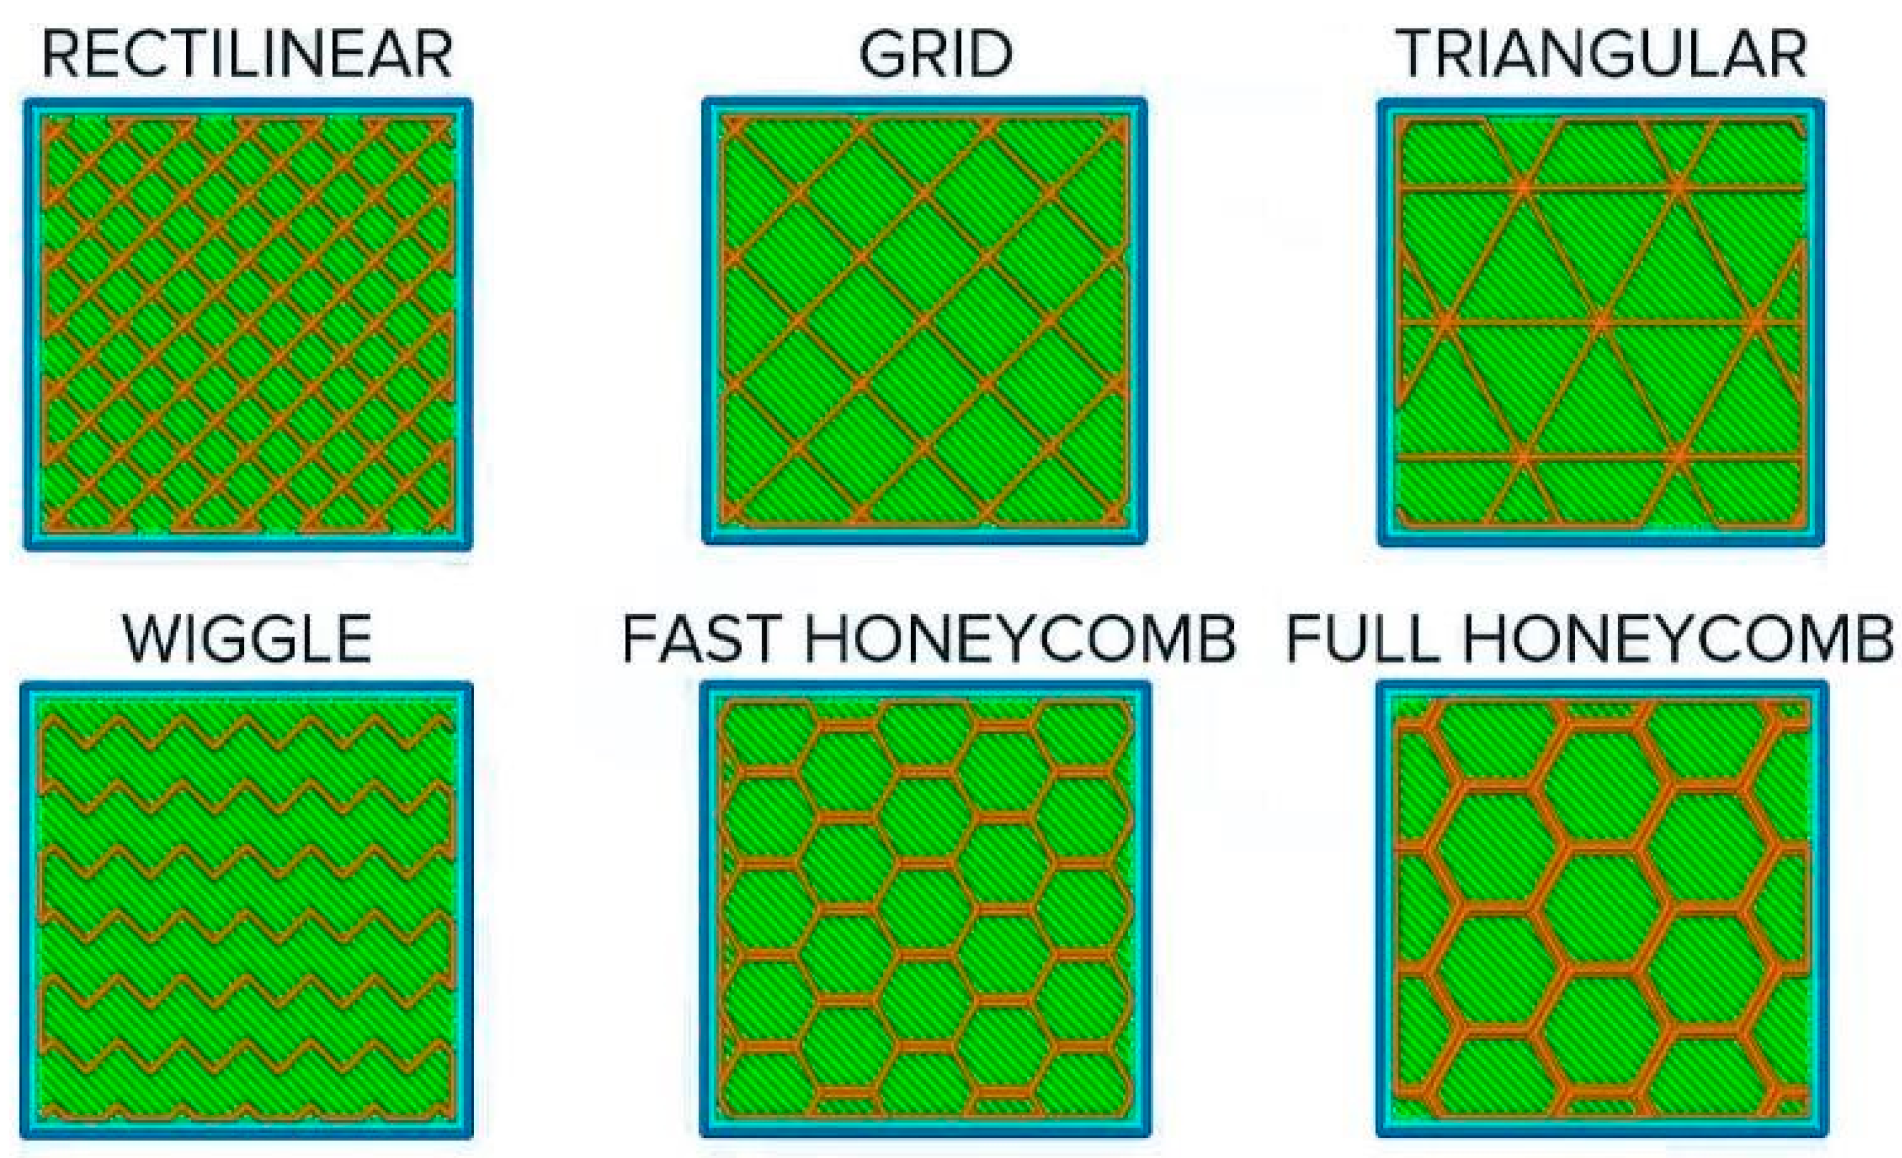
2.1.3. Infill Pattern
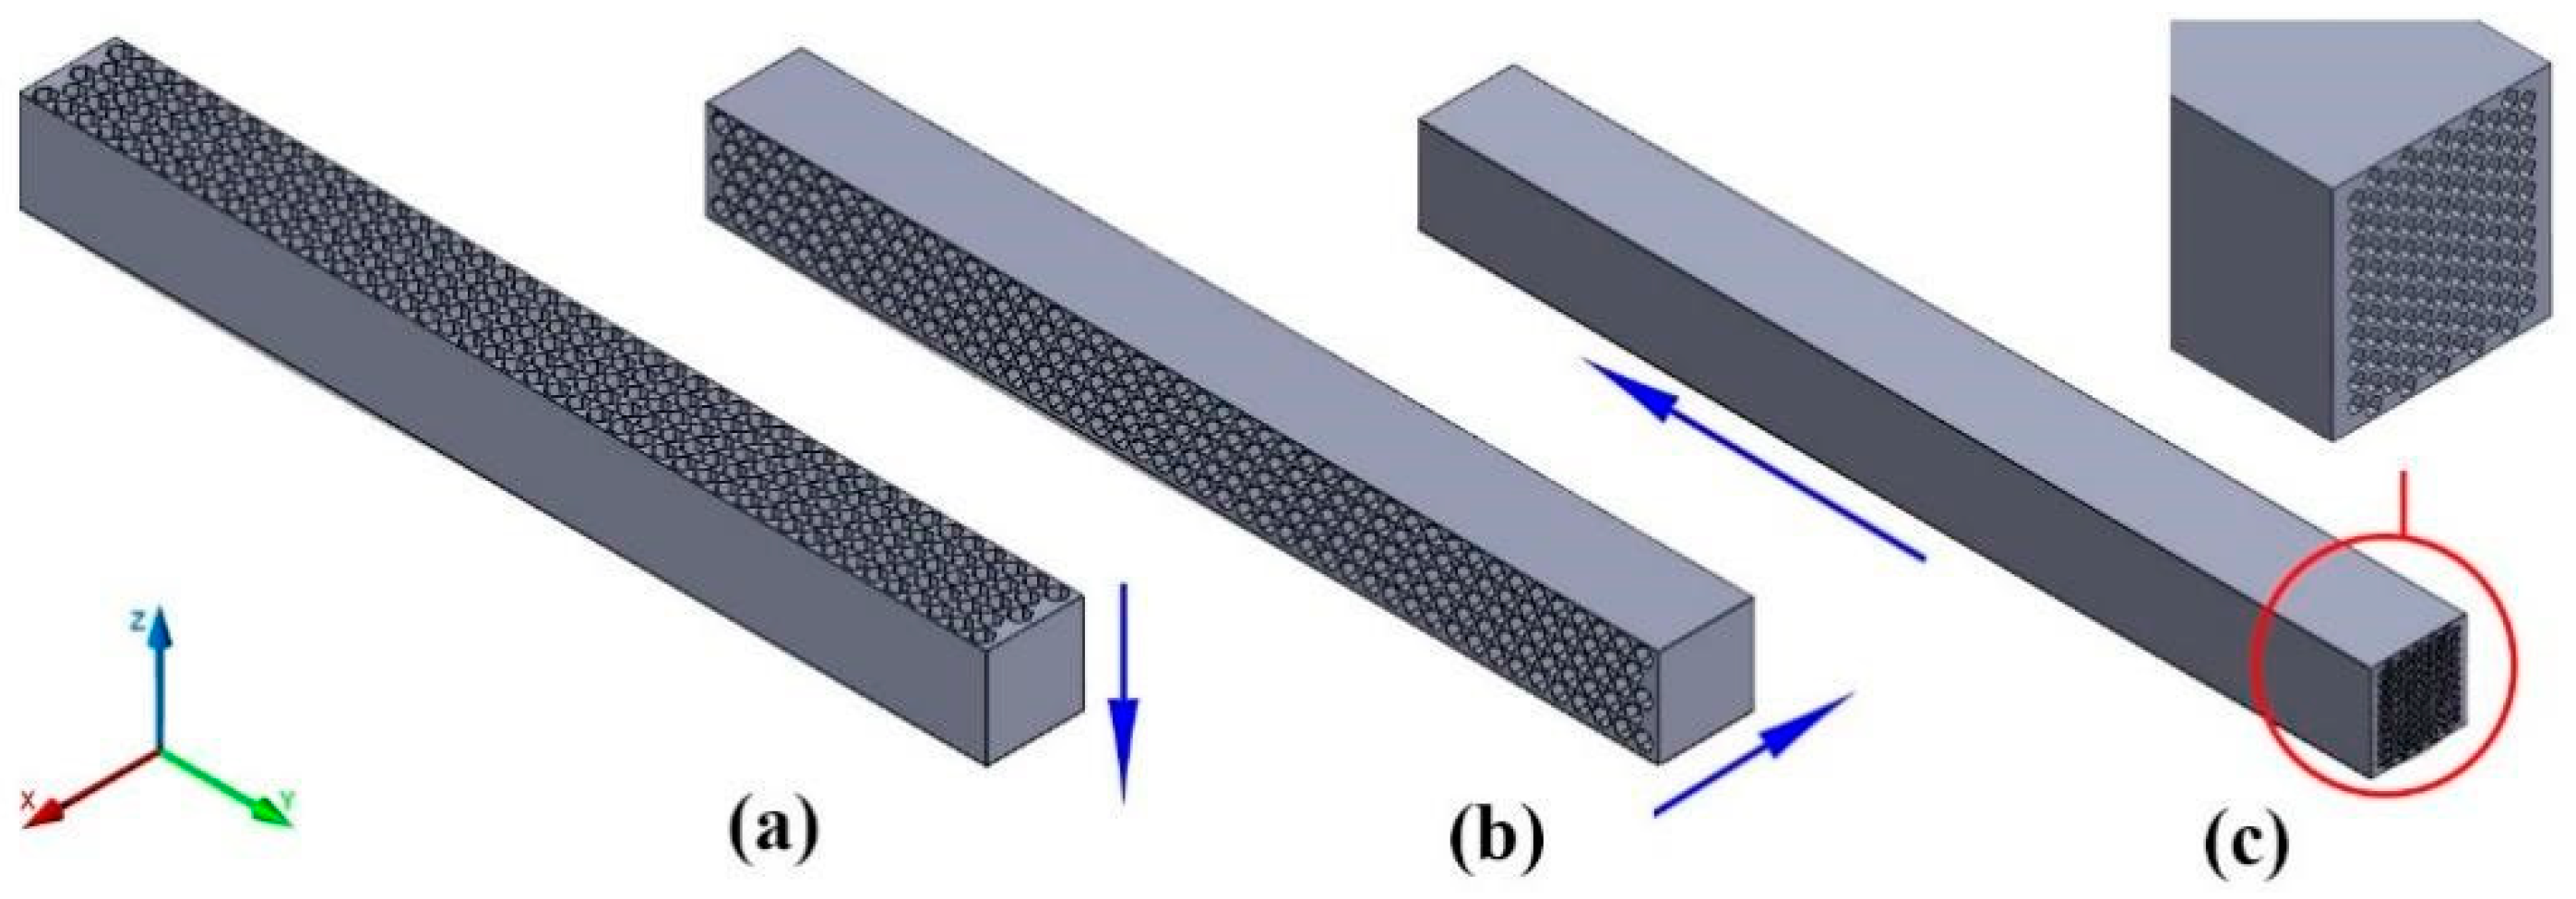
2.1.4. Print Orientation
2.2. AM Model Settings
2.3. Three-Point Bending Experiments
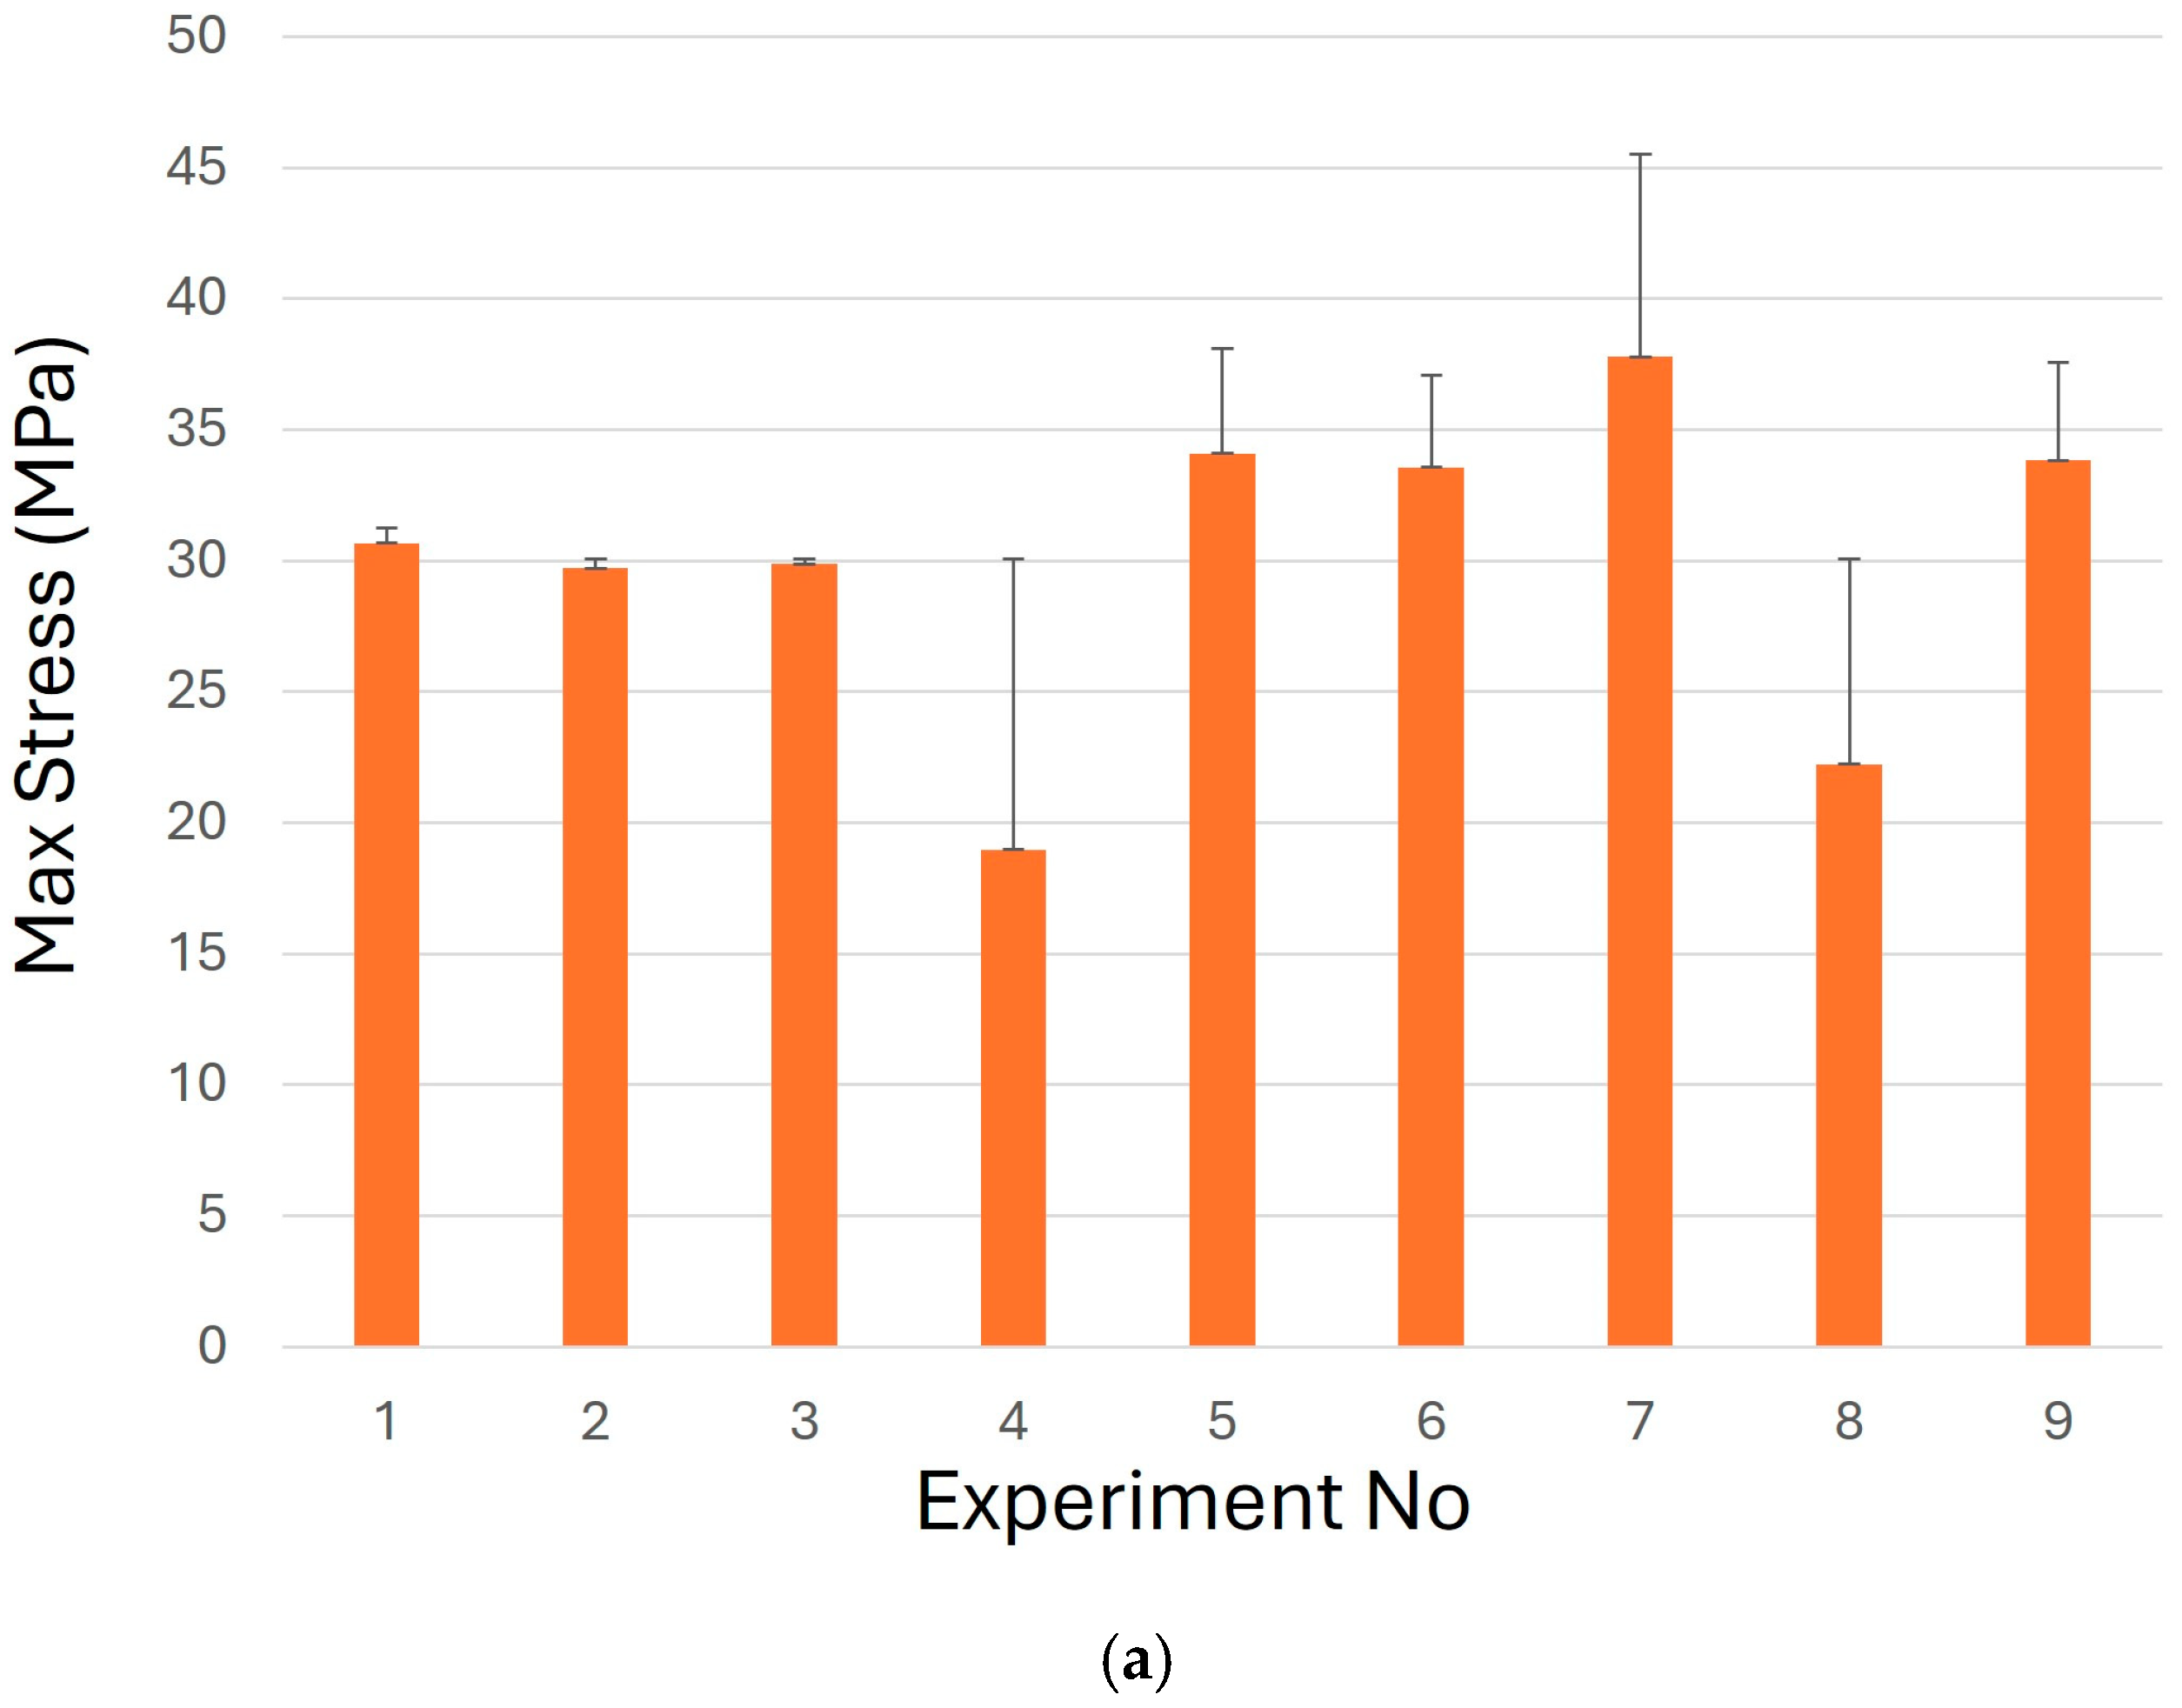
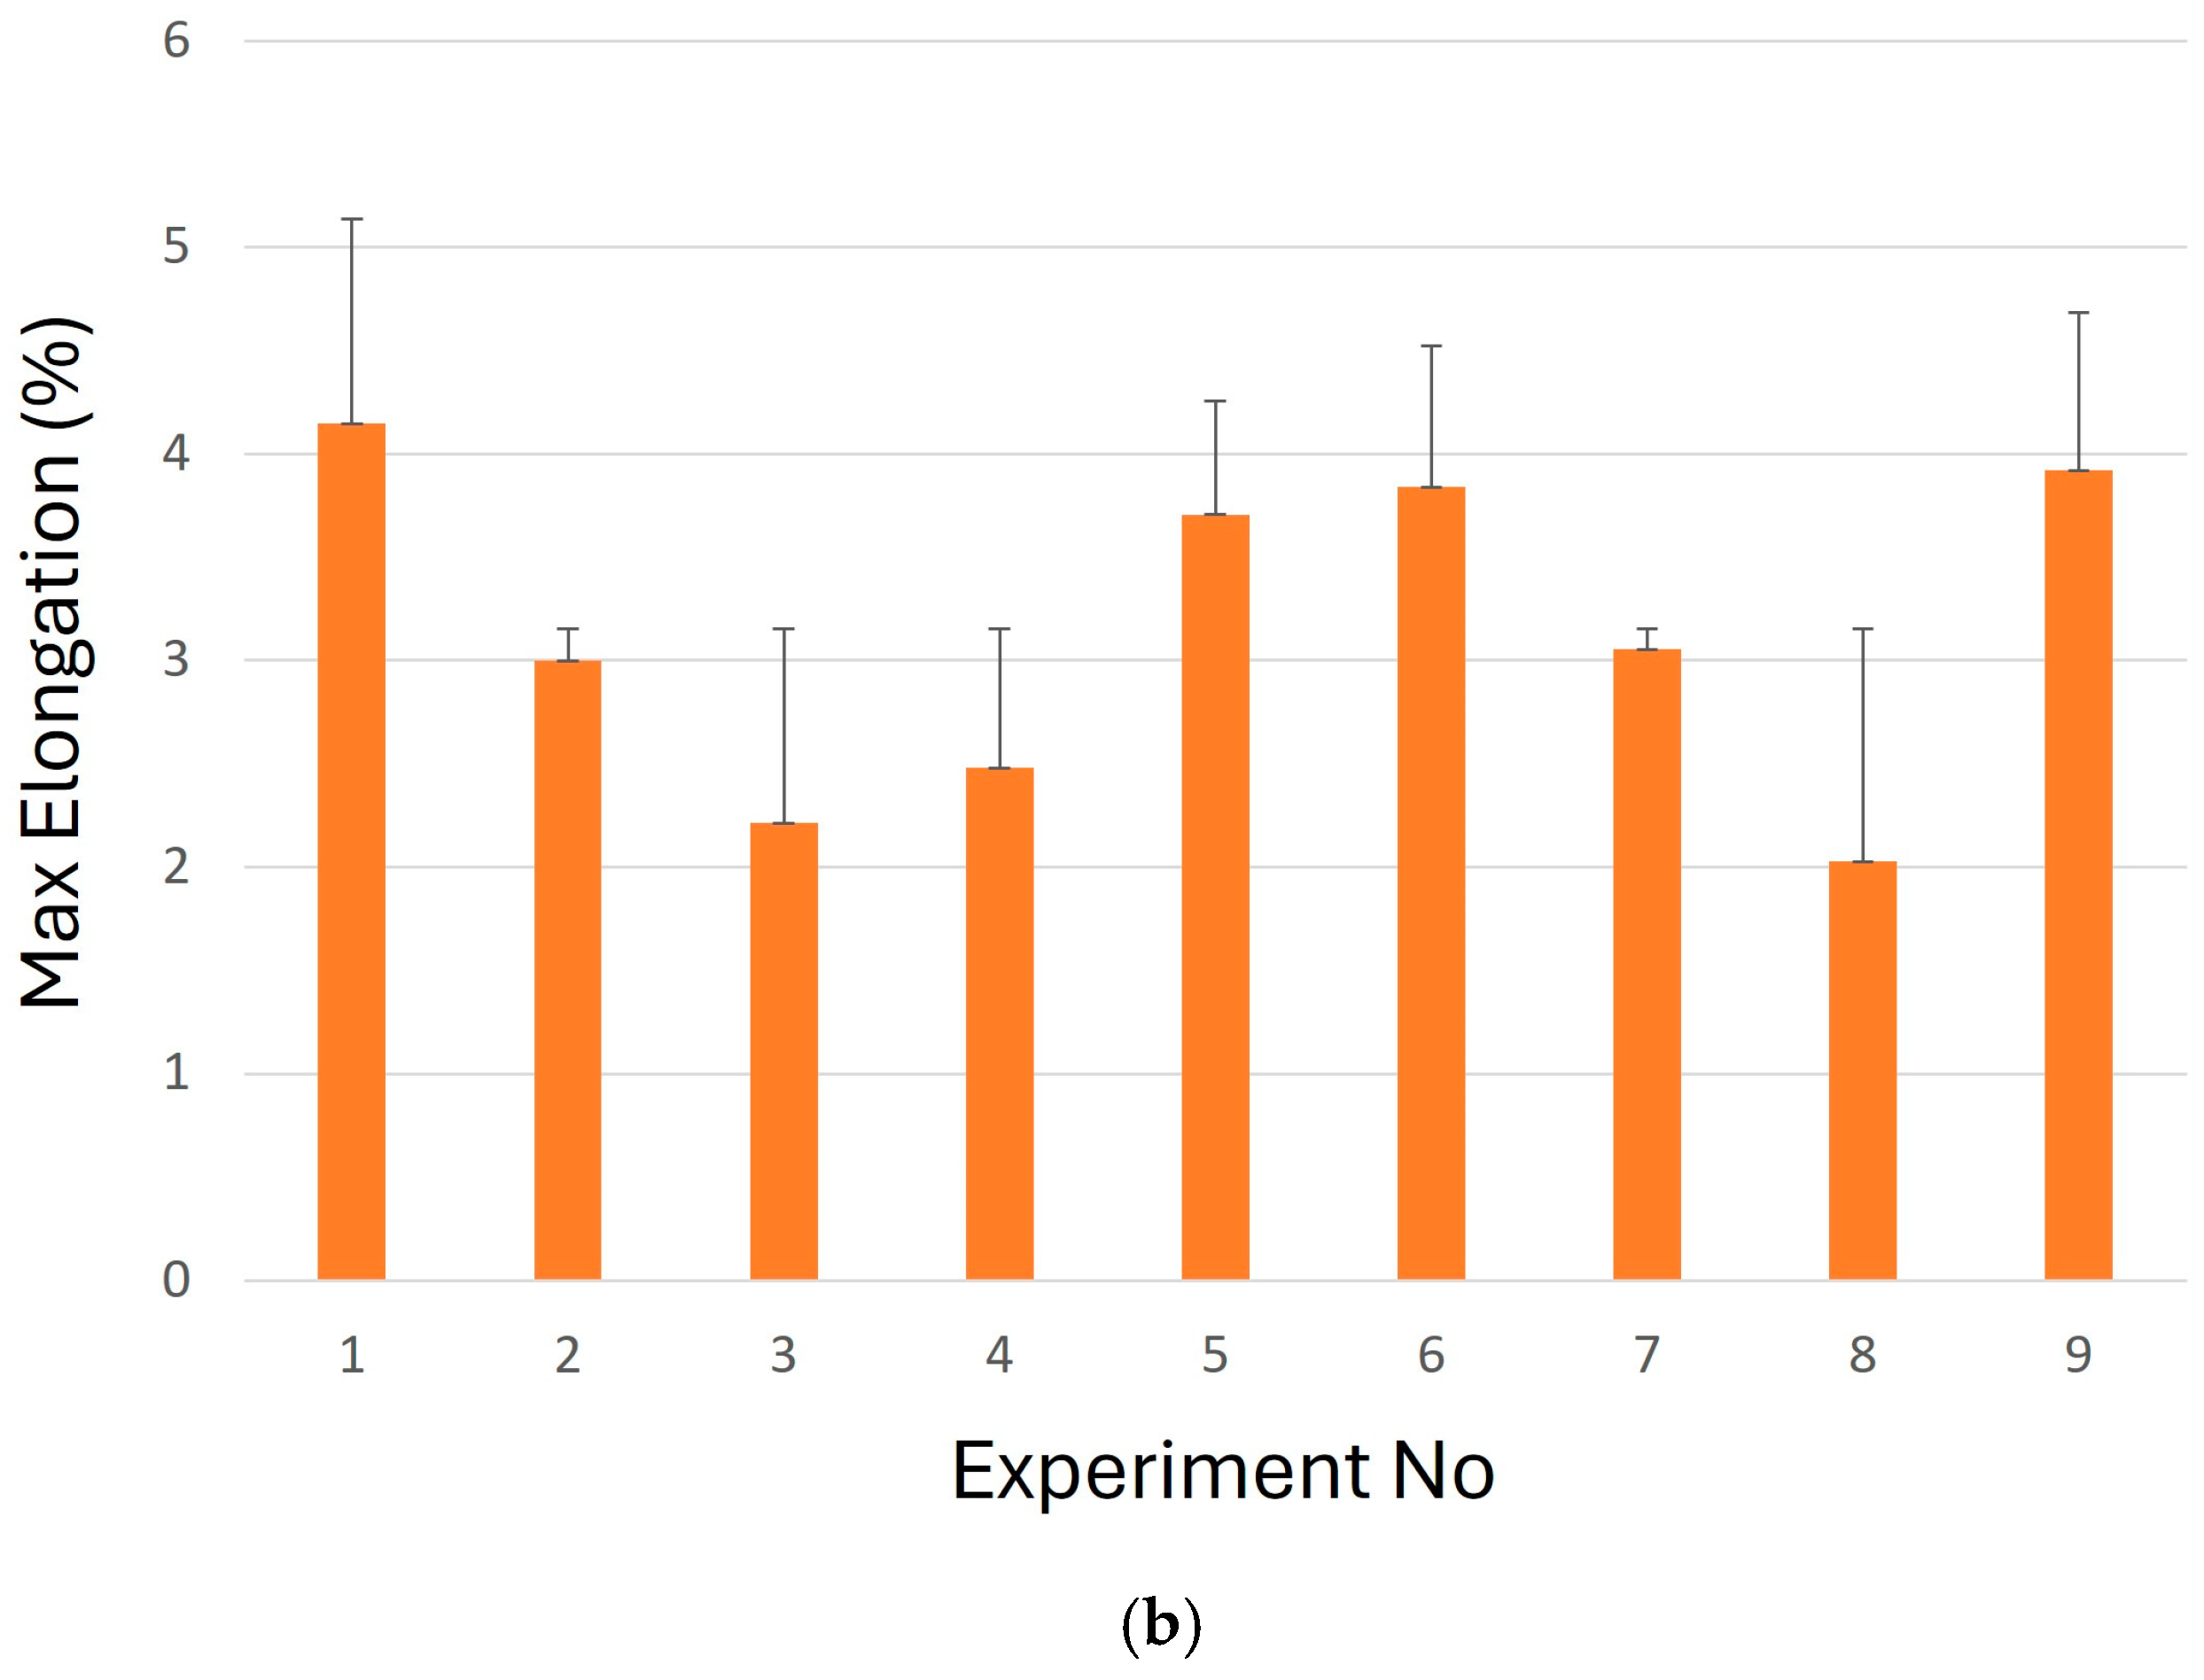
3. Results
DOE Analysis
4. Discussion
Author Contributions
Funding
Institutional Review Board Statement
Informed Consent Statement
Data Availability Statement
Conflicts of Interest
References
- Dizon, J.R.C.; Espera, A.J.H.; Chena, Q.; Advincula, R.C. Mechanical characterization of 3D-printed polymers. Addit. Manuf. 2018, 20, 44–67. [Google Scholar] [CrossRef]
- Dan, B.T.; Robert, D.; Khairallah, O.; Ramlal, R.; Budhoo, Y. The Effect of the 3-D Printing Process on the Mechanical Properties. Mech. Addit. Adv. Manuf. 2017, 9, 91–99. [Google Scholar]
- Domínguez-Rodríguez, G.; Ku-Herrera, J.J.; Hernández, A. An assessment of the effect of printing orientation, density, and filler pattern on the compressive performance of 3D printed ABS structures by fuse deposition. Int. J. Adv. Manuf. Technol. 2018, 95, 1685–1695. [Google Scholar]
- Miao, X.; Hu, J.; Xu, Y.; Su, J.; Jiang, Y. Review on mechanical properties of metal lattice structures. Compos. Struct. 2024, 342, 118267. [Google Scholar] [CrossRef]
- Wang, C.; He, Y.; Lin, Z.; Zhao, X.; Sun, C.; Guo, R.; Wang, X.; Zhou, F. Mechanical and tribological properties of FDM-printed polyamide. Tribol. Int. 2024, 191, 109198. [Google Scholar]
- Nagaraju, D.S.; Krupakaran, R.L.; Sripadh, C.; Nitin, G.; Emmanuel, G.J.J. Mechanical properties of 3D printed specimen using FDM (Fused deposition modelling) and SLA (Stereolithography) technologies. Mater. Today Proc. 2024; in press. [Google Scholar]
- Razaviye, M.K.; Tafti, R.A.; Khajehmohammadi, M. An investigation on mechanical properties of PA12 parts produced by a SLS 3D printer: An experimental approach. CIRP J. Manuf. Sci. Technol. 2022, 38, 760–768. [Google Scholar] [CrossRef]
- Zhang, J.; Zhao, P.; Xu, Q. Influence of print orientation on the bending properties of PLA in additive manufacturing: A comprehensive study. Polymers 2022, 14, 1021. [Google Scholar] [CrossRef]
- Zhou, Y.; Li, X.; Wang, L. Effect of 3D printing parameters on the mechanical properties of PLA: A systematic review. Mater. Sci. Eng. R Rep. 2021, 144, 100624. [Google Scholar] [CrossRef]
- Lee, H.; Zhang, S.; Yoon, S. Infill density and layer thickness effects on the mechanical properties of PLA: A comparative study. Addit. Manuf. 2021, 41, 101904. [Google Scholar]
- Martínez, L.; Sánchez, P.; Gómez, J. Impact of infill density and printing speed on the bending and tensile properties of PLA. Mater. Sci. Eng. 2023, 831, 142283. [Google Scholar]
- Singh, R.; Sharma, S.; Kaur, S. Experimental study of printing parameters and their effect on the bending behavior of PLA in 3D printing. Mater. Des. 2022, 215, 110507. [Google Scholar] [CrossRef]
- Sánchez, R.; Pérez, S.; Ruiz, A. Comparative analysis of mechanical properties in 3D printed PLA parts using different testing geometries. J. Appl. Polym. Sci. 2022, 139, 51807. [Google Scholar] [CrossRef]
- Gao, X.; Zhang, Y.; Wang, T. Experimental investigation on the flexural properties of PLA printed parts under various printing parameters. Int. J. Adv. Manuf. Technol. 2021, 114, 2345–2358. [Google Scholar]
- Montgomery, D.C. Introduction to Statistical Quality Control, 6th ed.; Wiley: Washington, DC, USA, 2008. [Google Scholar]
- Ning, F.; Cong, W.; Hu, Y.; Wang, H. Additive Manufacturing of Carbon Fiber-Reinforced Plastic Composites Using Fused Deposition Modeling: Effects of Process Parameters on Tensile Properties. J. Compos. Mater. 2016, 1, 1–12. [Google Scholar] [CrossRef]
- Rangisetty, S.; Peel, L.D. The Effect of Infill Patterns and Annealing on Mechanical Properties of Additively Manufactured Thermoplastic Composites. In Proceedings of the ASME 2017 Conference on Smart Materials, Adaptive Structures and Intelligent Systems, Snowbird, UT, USA, 18–20 September 2017. [Google Scholar]
- Fernandez-Vicente, M.; Calle, W.; Santiago, F. Effect of Infill Parameters on Tensile Mechanical Behavior in Desktop 3D Printing. 3D Print. Addit. Manuf. 2016, 3, 183–192. [Google Scholar] [CrossRef]
- Chacón, J.M.; Caminero, M.A.; García-Plaza, E.; Núñez, P.J. Additive Manufacturing of Structures Using Fused Deposition Modelling: Effect of Process Parameters on Mechanical Properties and Their Optimal Selection. Mater. Des. 2017, 124, 143–157. [Google Scholar]
- Casavola, C.; Cazzato, A.; Maramarco, V.; Pappalettera, G. Residual stress measurement in Fused Deposition Modelling parts. Polym. Test. 2017, 58, 249–255. [Google Scholar] [CrossRef]
- Ullu, E.; Korkmaz, E.; Yay, K.; Ozdoganlar, O.B.; Kara, L.B. Enhancing the structural performance of additively manufactured objects through build orientation optimization. J. Mech. Des. 2015, 137, 111410–111419. [Google Scholar] [CrossRef]
- Wang, Y.; Zhang, L.; Guo, C. Investigating the fracture toughness and failure modes of PLA in bending: A comprehensive analysis. Eng. Fract. Mech. 2023, 264, 108194. [Google Scholar]
- Yang, J.; Zhao, H.; Li, K. Failure modes of PLA parts under bending stress: A study of delamination and brittle fracture. J. Mater. Sci. 2021, 56, 3178–3187. [Google Scholar]


| Factor | Level 1 | Level 2 | Level 3 |
|---|---|---|---|
| Pattern | Rectilinear | Full Honeycomb | Triangle |
| Orientation | 45°/−45° | 0°/120°/−120° | 0°/60°/−60° |
| Level 1 | Level 2 | Level 3 |
|---|---|---|
| Along X-axis (a) | Along Y-axis (b) | Along Z-axis (c) |
| Experiment (S/N) | Temperature (°C) | Speed (mm/s) | Infill Patterns | Orientation |
|---|---|---|---|---|
| 1 | 180 | 25 | Rectilinear | X |
| 2 | 180 | 37.5 | Honeycomb | Y |
| 3 | 180 | 50 | Triangle | Z |
| 4 | 195 | 25 | Honeycomb | Z |
| 5 | 195 | 37.5 | Triangle | X |
| 6 | 195 | 50 | Rectilinear | Y |
| 7 | 210 | 25 | Triangle | Y |
| 8 | 210 | 37.5 | Rectilinear | Z |
| 9 | 210 | 50 | Honeycomb | X |
| Experiment (S/N) | Temperature (°C) | Speed (mm/s) | Infill Pattern | Orientation | Max Load (N) | Max Deflection (mm) |
|---|---|---|---|---|---|---|
| 1 | 180 | 25 | Rectilinear | X | 174.5 | 3.50 |
| 2 | 180 | 37.5 | Honeycomb | Y | 169.0 | 2.50 |
| 3 | 180 | 50 | Triangle | Z | 170.0 | 1.76 |
| 4 | 195 | 25 | Honeycomb | Z | 108.0 | 1.38 |
| 5 | 195 | 37.5 | Triangle | X | 194.0 | 3.50 |
| 6 | 195 | 50 | Rectilinear | Y | 191.0 | 3.25 |
| 7 | 210 | 25 | Triangle | Y | 215.0 | 2.42 |
| 8 | 210 | 37.5 | Rectilinear | Z | 126.5 | 1.73 |
| 9 | 210 | 50 | Honeycomb | X | 192.5 | 3.50 |
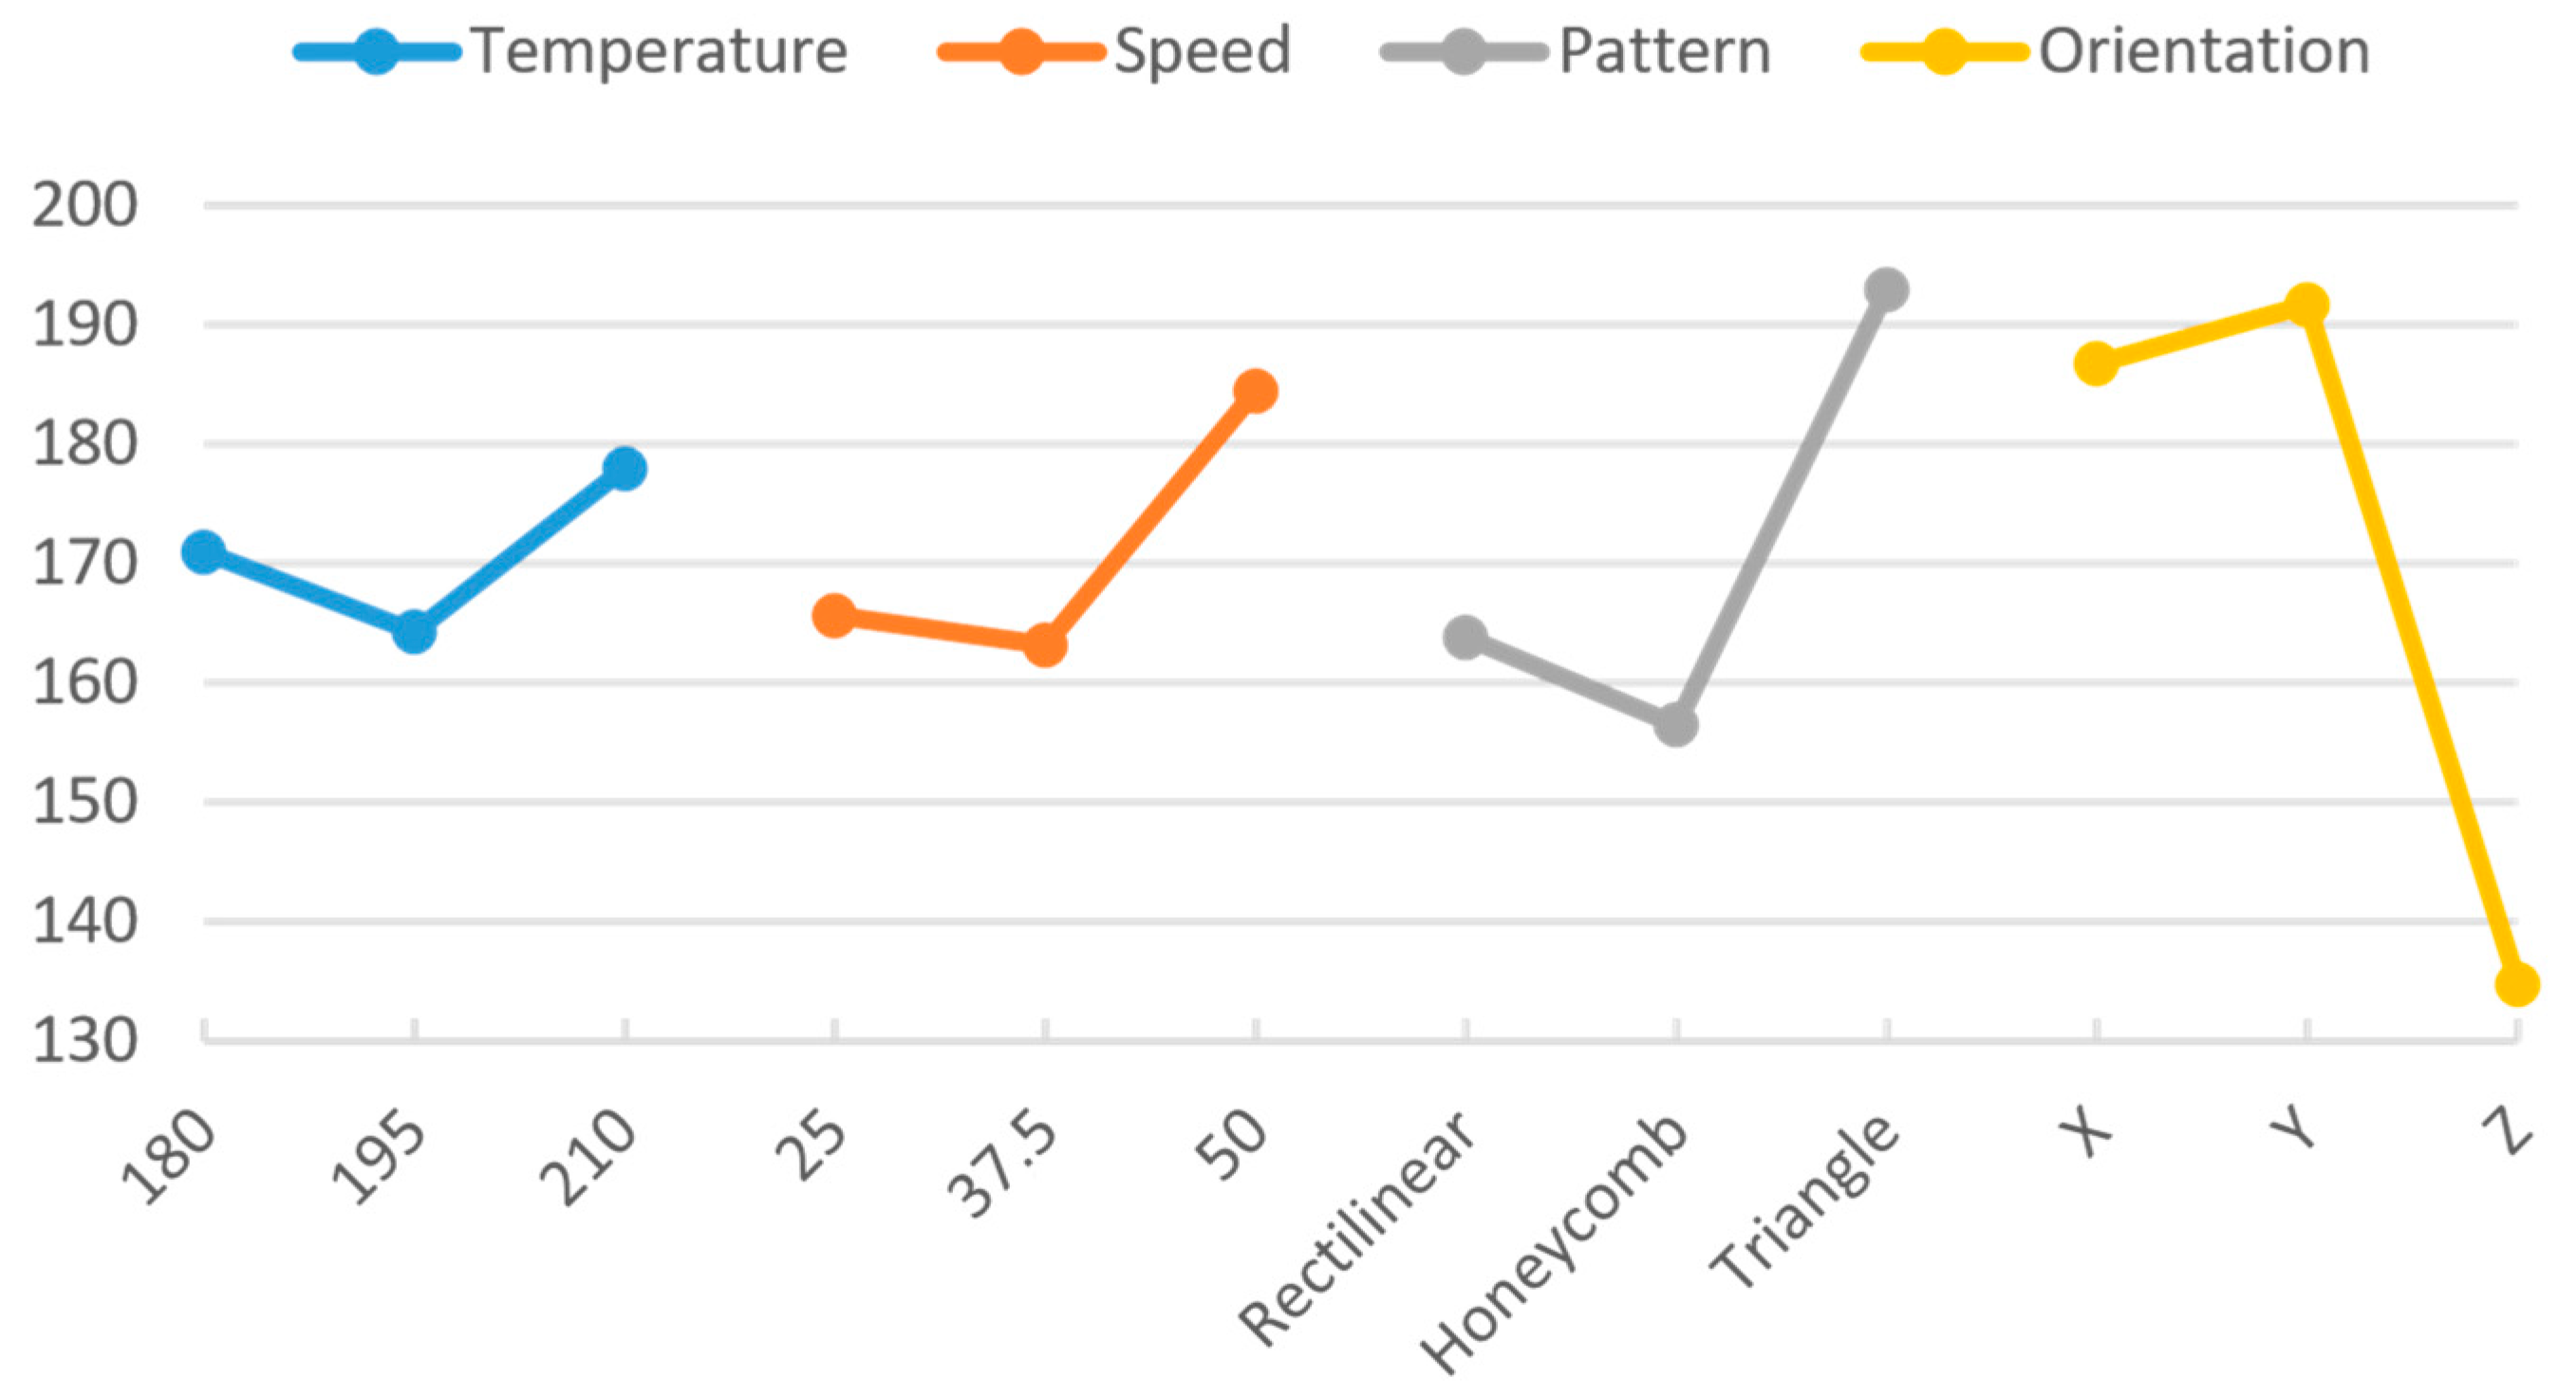
| Level (S/N) | Temperature (°C) | Speed (mm/s) | Infill Pattern | Orientation |
|---|---|---|---|---|
| 1 | 171 | 165.7 | 163.8 | 186.8 |
| 2 | 164.3 | 163.2 | 156.5 | 191.7 |
| 3 | 178 | 184.5 | 193 | 134.8 |
| Delta | 13.7 | 21.3 | 36.5 | 56.8 |
| Impact | 10.7% | 16.6% | 28.4% | 44.3% |
| Rank | 4 | 3 | 2 | 1 |
| Temperature (°C) | Speed (mm/s) | Infill Pattern | Orientation | Predicted Load (N) |
|---|---|---|---|---|
| 210 | 50 | Triangle | Along Y | 233.7 |
| Level (S/N) | Temperature (°C) | Speed (mm/s) | Infill Pattern | Orientation |
|---|---|---|---|---|
| 1 | 2.587 | 2.433 | 2.827 | 3.5 |
| 2 | 2.71 | 2.577 | 2.46 | 2.723 |
| 3 | 2.55 | 2.837 | 2.56 | 1.623 |
| Delta | 0.16 | 0.403 | 0.367 | 1.877 |
| Impact | 5.7% | 14.4% | 13.1% | 66.9% |
| Rank | 4 | 2 | 3 | 1 |
| Temperature (°C) | Speed (mm/s) | Infill Pattern | Orientation | Predicted Deflection (N) |
|---|---|---|---|---|
| 195 | 50 | Rectilinear | Along X | 4.03 |
| Optimal Predicted Force | Optimal Predicted Deflection | ||
|---|---|---|---|
| Force (N) | Deflection (mm) | Force (N) | Deflection (mm) |
| 330 | 3.6 | 279.5 | 4.78 |
Disclaimer/Publisher’s Note: The statements, opinions and data contained in all publications are solely those of the individual author(s) and contributor(s) and not of MDPI and/or the editor(s). MDPI and/or the editor(s) disclaim responsibility for any injury to people or property resulting from any ideas, methods, instructions or products referred to in the content. |
© 2025 by the authors. Licensee MDPI, Basel, Switzerland. This article is an open access article distributed under the terms and conditions of the Creative Commons Attribution (CC BY) license (https://creativecommons.org/licenses/by/4.0/).
Share and Cite
Sagias, V.D.; Papageorgiou, D.G.; Pappas, A.; Stergiou, C.I. Mechanical Properties of AM Polymer Specimens Under Bending Stress. Appl. Mech. 2025, 6, 25. https://doi.org/10.3390/applmech6020025
Sagias VD, Papageorgiou DG, Pappas A, Stergiou CI. Mechanical Properties of AM Polymer Specimens Under Bending Stress. Applied Mechanics. 2025; 6(2):25. https://doi.org/10.3390/applmech6020025
Chicago/Turabian StyleSagias, Vasileios D., Dimitrios G. Papageorgiou, Achilleas Pappas, and Constantinos I. Stergiou. 2025. "Mechanical Properties of AM Polymer Specimens Under Bending Stress" Applied Mechanics 6, no. 2: 25. https://doi.org/10.3390/applmech6020025
APA StyleSagias, V. D., Papageorgiou, D. G., Pappas, A., & Stergiou, C. I. (2025). Mechanical Properties of AM Polymer Specimens Under Bending Stress. Applied Mechanics, 6(2), 25. https://doi.org/10.3390/applmech6020025