Article

Analytical, Experimental, and Finite Element Study of Stress Concentration for Samples Printed on Masked Stereolithography Devices

by
Carla Carvalho Pinto
*,
Fernando de Azevedo Silva
and
Erick Siqueira Guidi
Faculdade de Engenharia e Ciências, Campus Guaratinguetá, Av, Universidade Estadual Paulista “Julio de Mesquita Fillho”, Ariberto Pereira da Cunha, 333—Portal das Colinas—Guaratinguetá, São Paulo 12516-410, Brazil
*
Author to whom correspondence should be addressed.
Appl. Mech. 2025, 6(1), 21; https://doi.org/10.3390/applmech6010021
Submission received: 31 January 2025 / Revised: 8 March 2025 / Accepted: 9 March 2025 / Published: 12 March 2025

Abstract

:
Masked Stereolithography (mSLA) is an additive manufacturing technique that has been recently explored. Currently, studies in the literature addressing the investigation of stress concentrators in photosensitive resin parts printed on mSLA devices using the Whitney–Nuismer analytical method combined with Finite Element Analysis (FEA) and Digital Image Correlation (DIC) are rare. This work utilizes the combination of these techniques to analyze stress concentrators in specimens subjected to axial and eccentric loads, considering the effects imposed by the clamp restraint and a complementary study considering the free loading condition. For axial loading, the results are consistent, with variations in the stress concentration factor ranging from 0.42% to 5.25%. For the eccentric loading studies, the results indicate that the most suitable method for the test was the analysis considering the restraint imposed by the clamp, as the deformation results show a maximum error of 6.9% compared to 24.7% when the restraints were disregarded. The consistency of the results reinforces the quality of the employed technique, demonstrating that this study not only achieved its objectives but also provided a foundation for future investigations in the field.

1. Introduction

Additive manufacturing has gradually transformed industries through design flexibility, material savings, and cost-effective manufacturing, even in low volumes [1]. 3D printing technology is fully automated and does not use tooling, which leads to cost reduction in manufacturing, time reduction, and the ability to create complex geometries and production flexibility [2,3].
Among additive manufacturing techniques, Masked Stereolithography (mSLA) is used to print a range of parts for different niches. The method involves using UV light irradiation to solidify liquid resins. This UV light source is the LED, and it is emitted through a liquid crystal display (LCD), which allows for a complete layer to be cured [4]. This process occurs layer by layer as the platform moves the resin in the tank. This reaction mainly depends on the UV light intensity and the exposure time of the layer. These factors define the amount of light energy absorbed and the degree of monomer conversion, and they are directly related to the final mechanical properties of the printed material [5]. After this printing process, the part is removed from the platform and must be washed. After washing, the part must be dried and ideally cured in a UV light chamber [4,6]. These post-printing steps directly influence the properties of the manufactured product [7,8].
mSLA has a wide range of applications and has been used to print biomaterials [9,10], metamaterials for mechanical applications [11], and elements for microelectromechanical systems [12]. Since it is a technique that has been recently explored, there is a constant change in the processing of new materials to meet the demands of new applications [2]. Thus, there are issues in the quality control of parts when it comes to simple parameters like roughness, toughness, and mechanical strength [13]. These variations occur for several reasons, such as holes or openings that can be used to reduce weight, facilitate access, or optimize maintenance services. In areas with discontinuities, such as notches or grooves, local stress increases significantly, allowing for crack formation and growth. The stress concentration factor is a criterion that measures how the impact of geometric discontinuity in a material amplifies the nominal stress applied to it. It is understood that the hole size effect is a key factor for such analysis since the smaller the hole size, the lower the probability of failure [14]. There are three widely used methods to determine stress concentration factors: analytical, Digital Image Correlation (DIC), and Finite Element Analysis (FEA). Among the analytical methods that aim to predict the resistance of notches, some deserve special mention: fracture mechanics, progressive damage, and point stress. Fracture mechanics models analyze the stresses around the hole, analyzing cracks to predict failures; progressive damage models analyze the changes in stress distributions during the loading process; the point stress model analyzes the average stresses over a characteristic distance [15].
Due to its simplicity, the point stress criterion is a widely used technique and will be adopted in this work. The Whitney and Nuismer method is based on point stress and mean stress criteria. It was developed to estimate the strength of a brittle laminate with a central hole. The method considers the distribution of stresses along the load direction and considers two characteristic dimensions as material properties [16].
Considering an infinite isotropic plate, the nominal stress concentration factor, called K t , is equal to 3 [17]. Equation (1) compares the finite and infinite resistance models. K t g is the gross stress concentration factor, d is the hole diameter, and w is the plate width [16].
K t K t g = 3 1 d w 2 + 1 d w 3  
Next, it is possible to obtain the net stress concentration factor ( K t n ) given by Equation (2):
K t n = K t g 1 d w  
This method will be used in this work to analytically validate the mechanical behavior of photosensitive resin samples printed on mSLA devices containing centrally located holes in a flat plate. In addition to the analytical study, an experimental investigation will also be conducted to complement and validate the results obtained through Digital Image Correlation (DIC).
DIC is a technique developed in the 1980s that relies on capturing at least two images, one taken before and another after the deformation of a sample. The technique consists of obtaining the strain fields on the surface plane of the samples by comparing the images, as long as they have an adequate granular pattern and resolution [18,19]. There are several open source platforms available for using the method, such as py2DIC [20] and Matlab Ncorr (ncorr v1.2) [21]. For this work, the Matlab Ncorr software (ncorr v1.2) will be used.
Several studies have used DIC to investigate the effect of notches/holes on the mechanical properties of materials. Saleh et al. studied the effect of circular notches in three different architectures of epoxy resin/carbon fiber/fabric composites. The authors showed that DIC strain contours clearly indicated regions of stress/strain concentration around the perimeter of the hole. Despite this, due to the material’s ductility, the samples with holes exhibited minimal (less than 10%) reduction in strength compared to the strength of the hole-free samples [22]. Wu et al. used DIC to compare the variation in stress/strain concentrations in hole samples made of self-reinforced polyethylene terephthalate (srPET) and polymethyl methacrylate (PMMA). The results demonstrated the ductility of the first material compared to the second [18]. Aidi et al. evaluated the residual properties and corresponding damage states in carbon fiber/epoxy composites with a central notch subjected to fatigue loading using DIC, radiography, and a contactless vibration measurement technique. The results showed that DIC, combined with vibration response, provides a powerful non-destructive tool for monitoring the development of fatigue damage [23]. Makki et al. assessed the stress concentration factors for composite and steel materials with different hole diameters. The results showed that the presence of geometric discontinuity has significant effects on the stress concentration factor (SCF) for both composite materials and steel. The study also showed that the results obtained by the DIC method were very close to those obtained by FEA for isotropic materials. The authors also pointed out that the DIC method proved to be efficient for real-time monitoring of SCF in composite materials and steel [17].
The use of DIC for determining the mechanical properties in samples fabricated by additive manufacturing has also been found in the literature. Luo et al. claims to be the first to use DIC to determine the thermal deformation of polylactic acid (PLA) samples printed by Fused Deposition Modeling (FDM). The authors demonstrated that, when the temperature decreases to −40 °C, there is a significant localization of the deformation, which could lead to premature failures in the test specimens [24]. Hosseinabadi et al. used DIC to compare two additive manufacturing techniques, FDM and PolyJet™, to study the plastic strain in polymer honeycombs. The studies showed that the DIC technique was efficient in studying the localization of deformation in 3D-printed honeycomb rods and that the samples printed with the PolyJet™ technique had more homogeneous deformation distributions compared to the FDM technique [25]. Tanabi used DIC to compare the properties of two types of FDM-printed materials, a composite (PET/carbon fiber) and a polymer (ABS). The results revealed that the use of carbon fiber-reinforced PET results in superior elastic modulus, tensile strength, and shear strength compared to ABS [26]. Tang et al. worked with DIC to study the effects of process parameters on the mechanical properties of lattice structures printed by FDM using PLA. The results showed that, as the printing temperature increases, the tensile strength and elastic modulus tend to increase initially and then decrease [27].
There are few studies in the literature that focus on using DIC to study the mechanical properties of parts with holes fabricated by additive manufacturing, especially those printed through mSLA, a very recent 3D printing technique. Volgin et al. used a PLA sample with a central hole printed by FDM to validate a constitutive modeling study of Three Networks and compared the results with predictions from Finite Element Analysis (FEA) [28]. The work of Falta et al. uses DIC to evaluate the mechanical properties of objects printed by mSLA. The aim of the study was to analyze mechanical properties under different types of loading and study the sensitivity to the strain rate in the compression response of solid samples and inverted honeycomb lattice structures [29]. Oliveira et al. [30] used cylinders fabricated in mSLA devices to conduct a stress field study, comparing results provided by FEA and DIC. Their study demonstrates that investigating stress fields using photopolymer resin in mSLA devices yields consistent results, as the variation in the analyzed stresses was between 0.6% and 8.2% [30].
Given that there are few studies in the literature focusing on the study of stress concentrators in photopolymer resin samples printed on mSLA devices, and considering that the mechanical behavior of polymers printed by additive manufacturing is significantly different from those produced by traditional technologies, the objective of this work was to investigate the effect of stress concentration in specimens printed on mSLA devices using the analytical methods of Whitney–Nuismer, DIC, and FEA. This study analyzed specimens subjected to axial and eccentric loads.

2. Materials and Methods

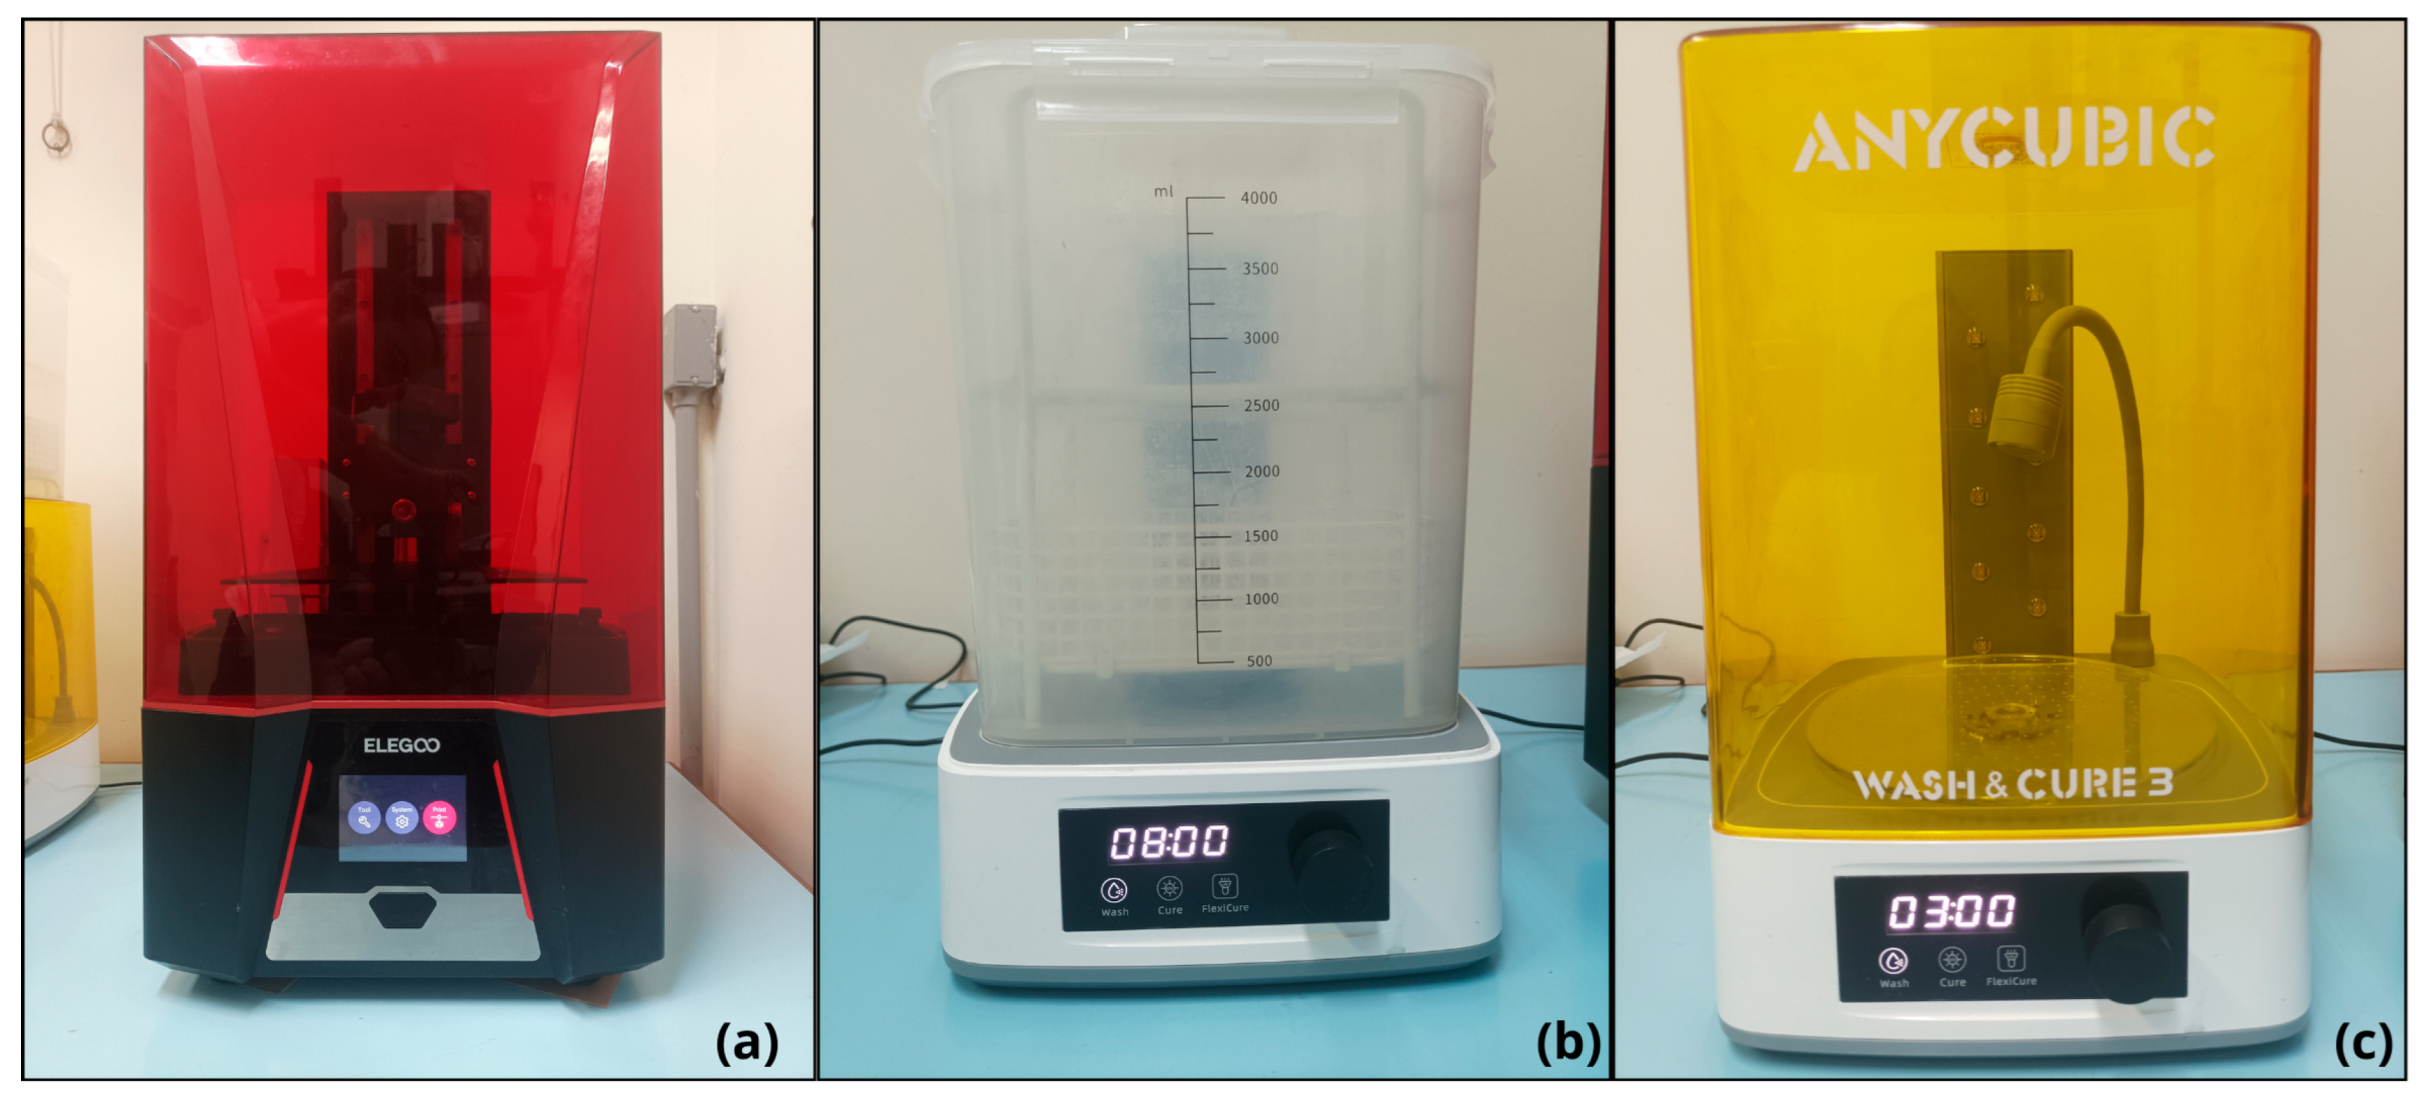
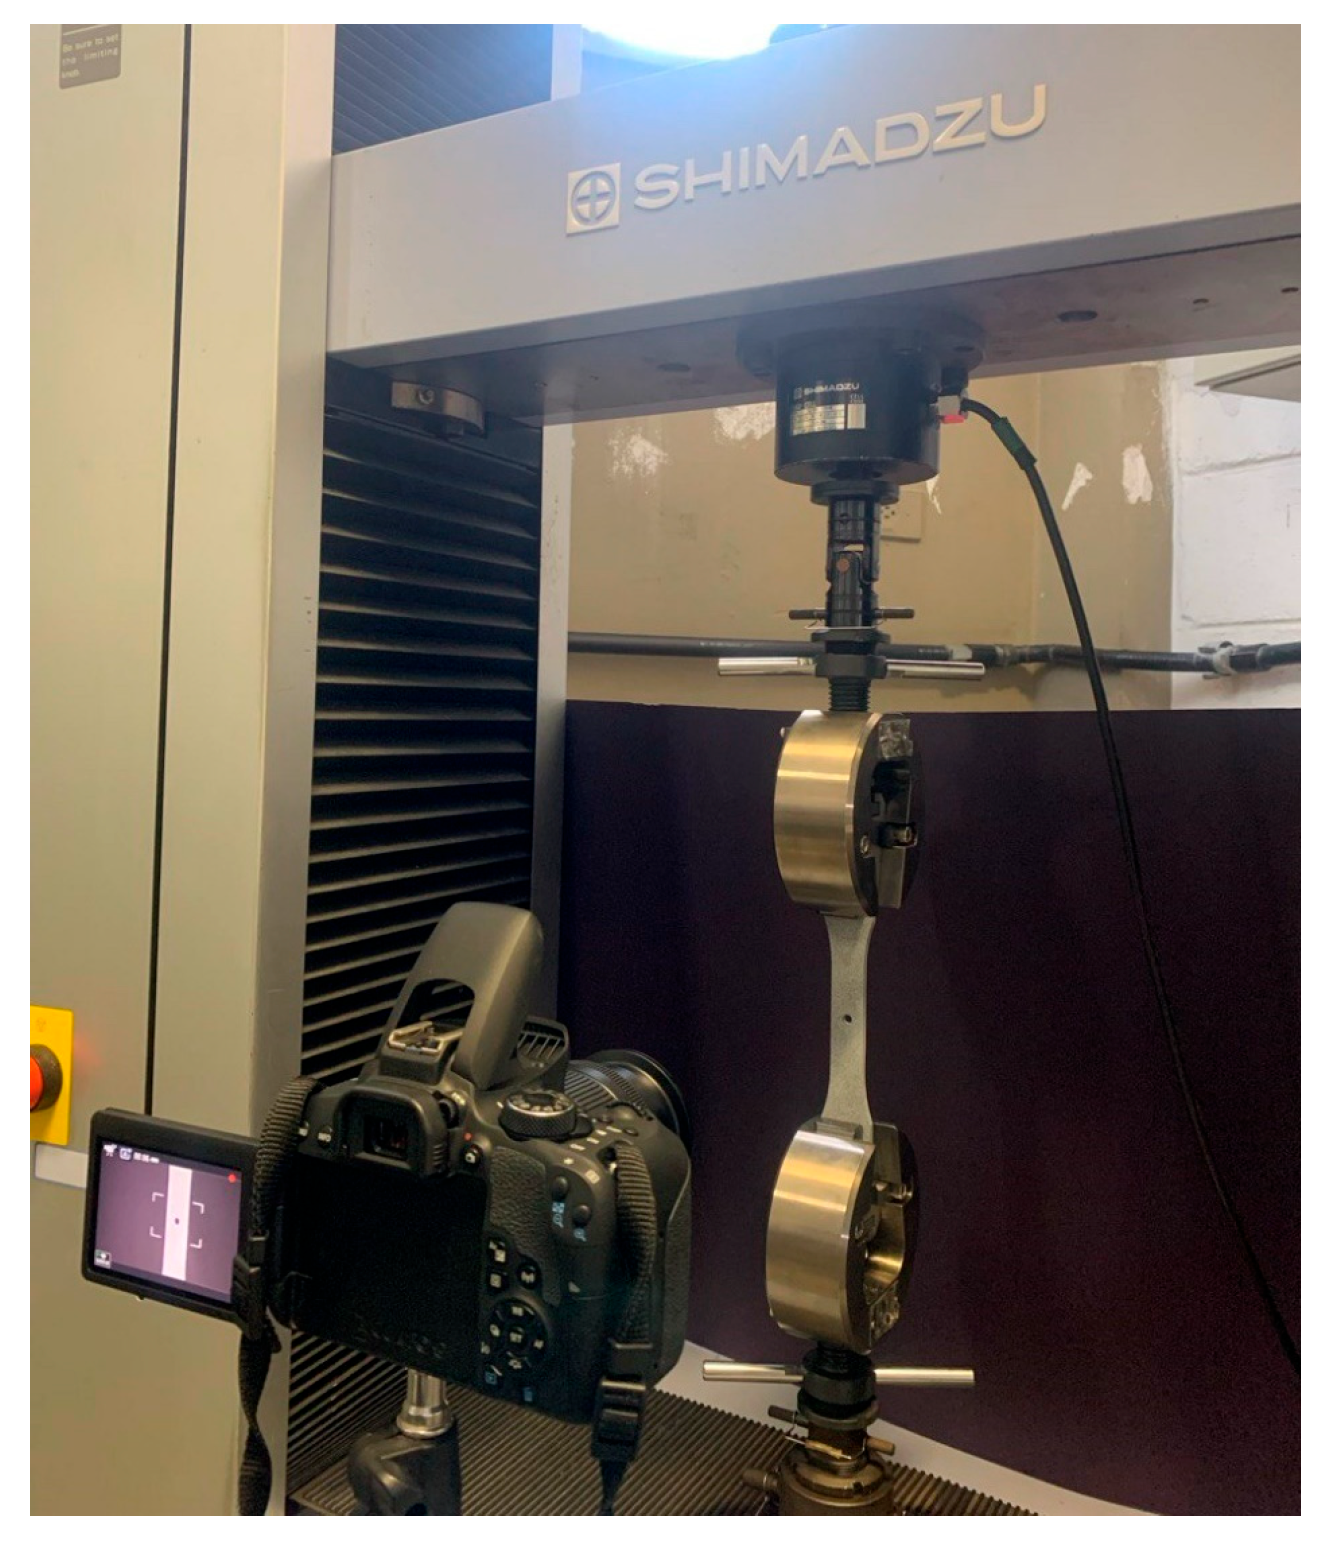
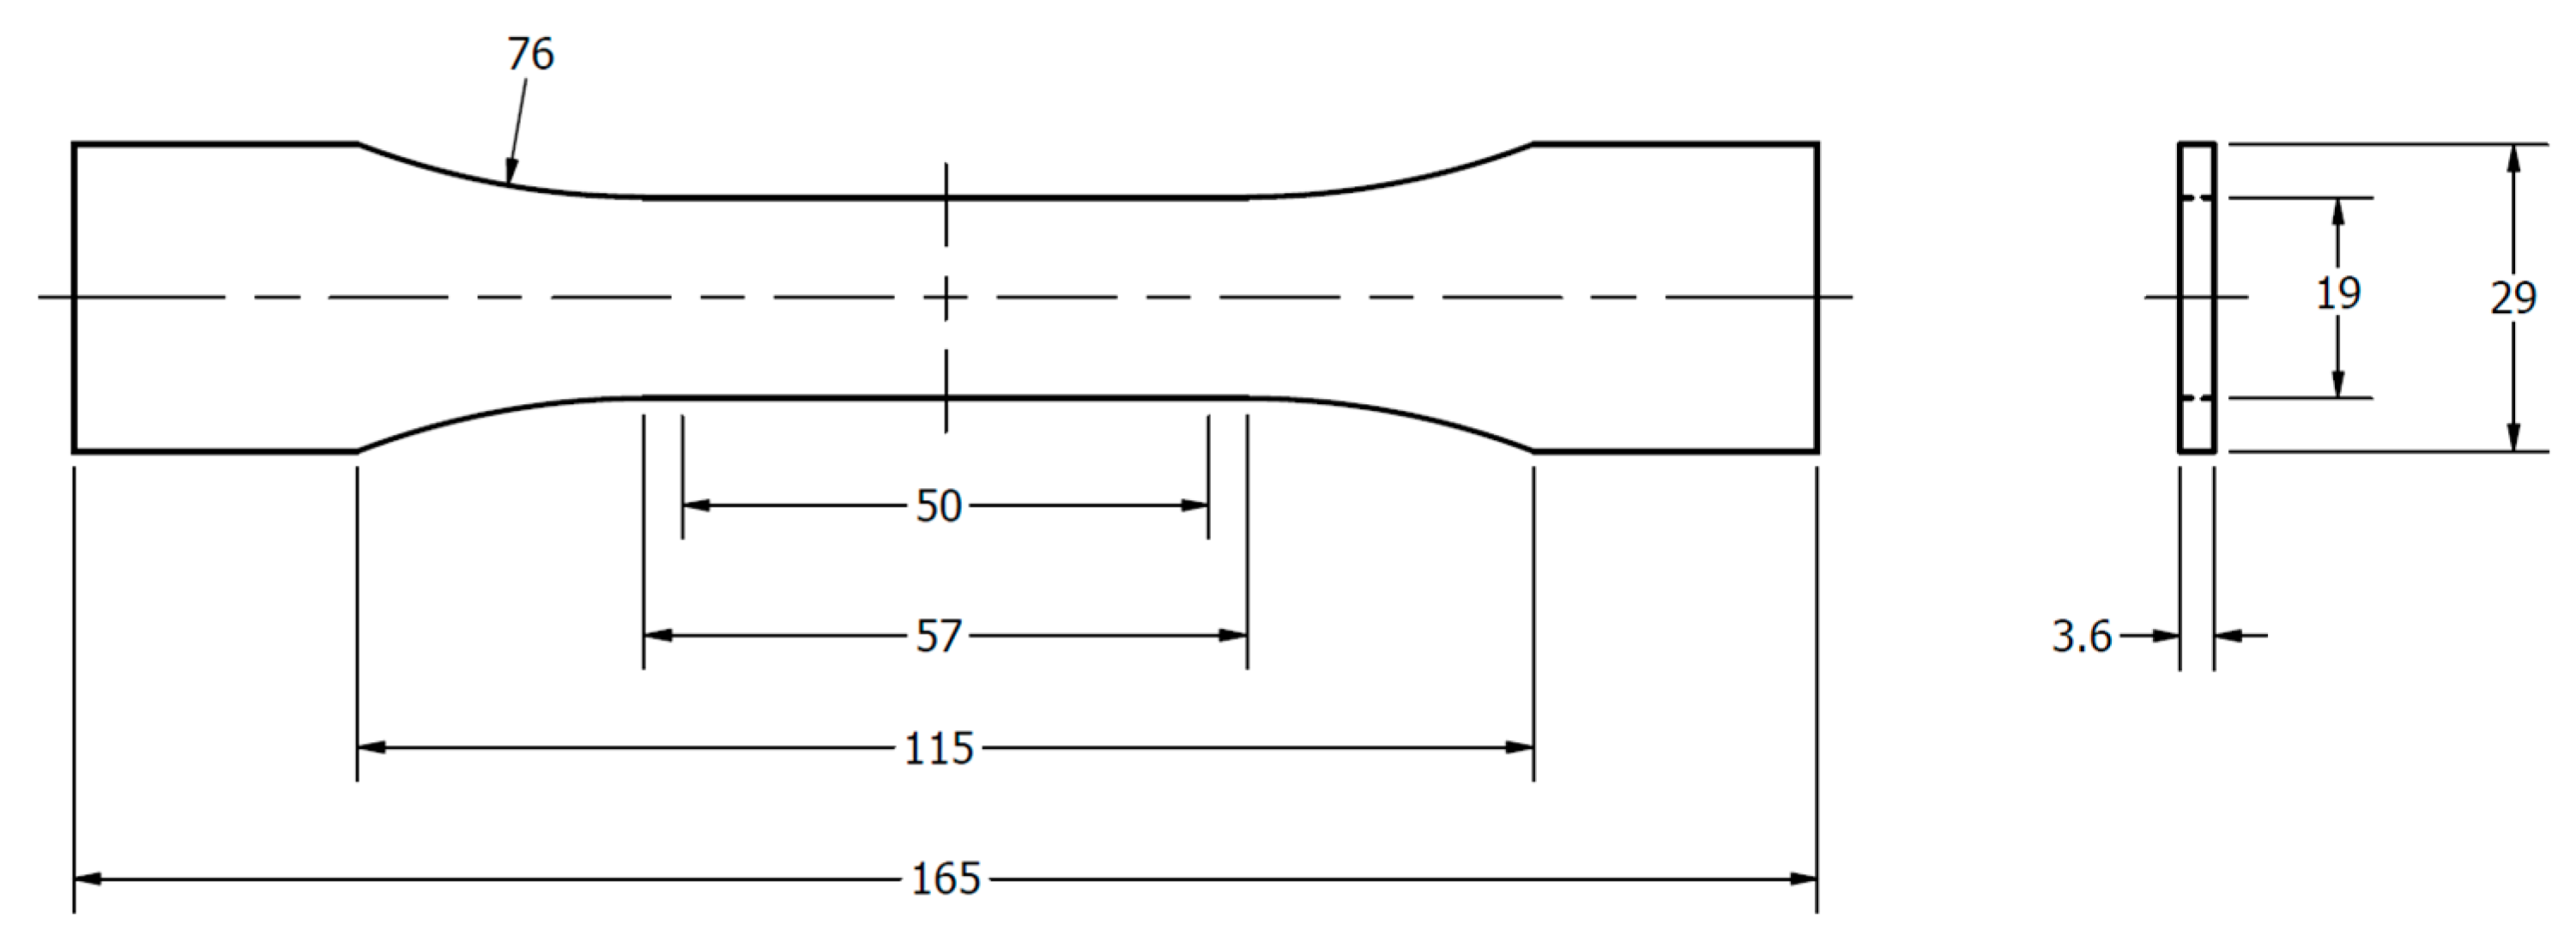
2.1. Testing Methodology: Test Specimen and Equipment

The samples printed on the device were modeled using the Computer-Aided Design (CAD) software Inventor 2024 and then converted to the Stereolithography (STL) format to be inserted into the CHITUBOX version 1.9.4 slicing software.
For the development of the work, an mSLA printer (ELEGOO, Shenzhen, China), model Saturn 2, was used. After printing, the test specimens undergo post-processing stages, being washed in tap water for 8 min. Then, they are subjected to a UV light chamber for 1 h. Figure 1 shows the printer, washing chamber, and UV light chamber. The resin used is water-washable and gray in color. It is manufactured by ANYCUBIC (Shenzhen, China). The resin parameters from the supplier are shown in Table 1 and the selected parameters in 3D printing are shown in Table 2.
For the study of stress concentrators, circular holes were introduced into the specimens, varying the diameter-to-width ratio, with the specimen without holes serving as a comparison standard, as shown in Table 3.
The test environment is presented in Figure 2, highlighting the CANON T7i camera (Taipei, Taiwan), and the SHIMADZU testing machine (Kyoto, Japan). An external lighting source was also used in the tests, as well as 5 kN load cells, and the testing speed was 5 mm/min according to the adapted ASTM D638 standard.
Five test specimens were printed for each configuration using the adapted ASTM D638 Type 3 standard, and the two-dimensional diagram of the test specimen with the dimensions in mm can be seen in Figure 3.

2.2. Testing

The specimens were subjected to tests under axial loads, where the fixation region of the specimen was fully clamped in the grip during the application of the load. Additionally, tests with eccentric loads were performed, where the fixation region of the specimen was partially clamped during the load application.
To determine the Young’s modulus of the resin studied, the extensometer from the machine was inserted into specimens subjected to axial load. Thus, a value of 1.76 GPa was found for the Young’s modulus. The Poisson’s ratio of 0.34 was determined by Oliveira’s work [30]. In Figure 4, the average stress–strain curve from the tests performed on the five specimens without a hole subjected to axial loads can be observed. Table 4 presents the experimental data of the five test specimens, including the strain–stress values along with their mean and standard deviation.
Analysis was conducted using the DIC method for the specimens subjected to axial and eccentric loads. During the tests, the specimens were filmed with the CANON T7i camera. The videos were split into frames, and later, these frames were processed in the Matlab Ncorr software (version 1.2) for strain analysis. For the analysis, it is necessary to define a region of interest (ROI), as shown in Figure 5.
Next, the subset to be analyzed in the image is defined. Since the strains around the central hole are the focus of the study, the subset is defined in that region. For this work, a subset with a radius of 50 pixels was defined for the specimens subjected to axial load and 12 pixels for the specimens subjected to eccentric load. This difference occurs due to the grain size of the tested specimens. As pointed out by Beleza [31], the grain size and the quality of the analyzed image are directly related to the subset radius. Beleza’s results show that, for samples with smaller grain patterns, larger radii result in smaller relative errors, while for samples with larger grain patterns, medium radii yield the best results. However, the quality of the images also influences this analysis [31].

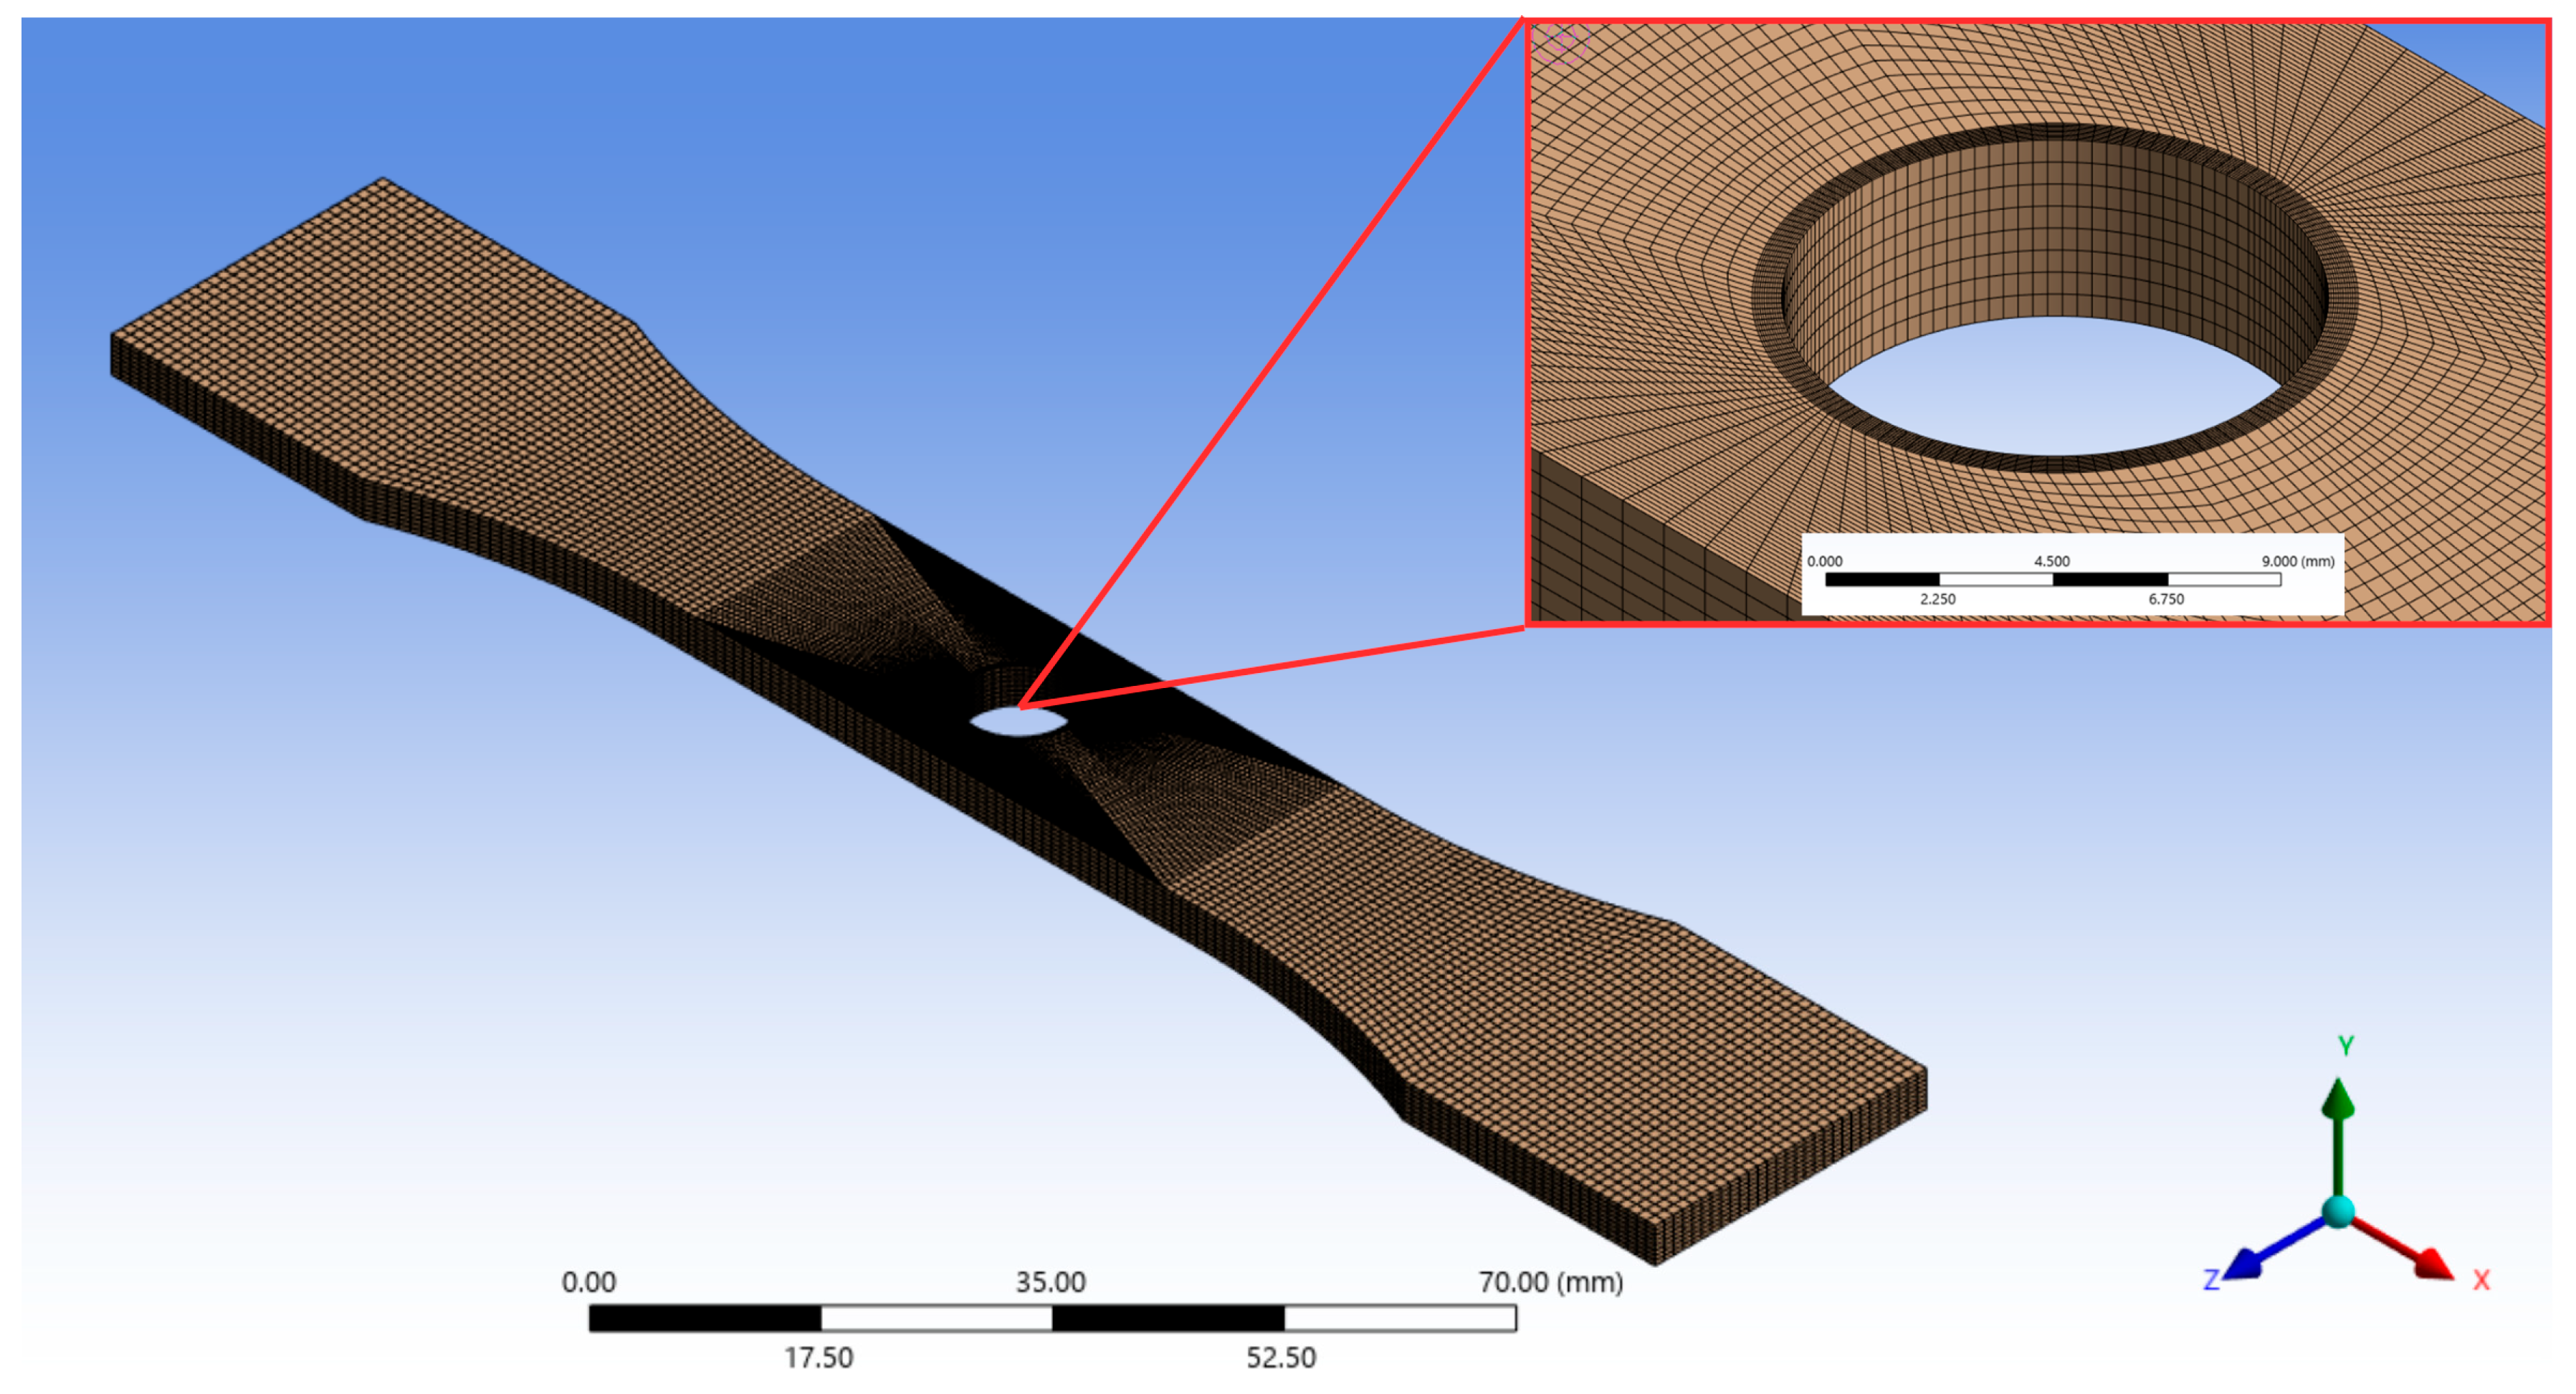
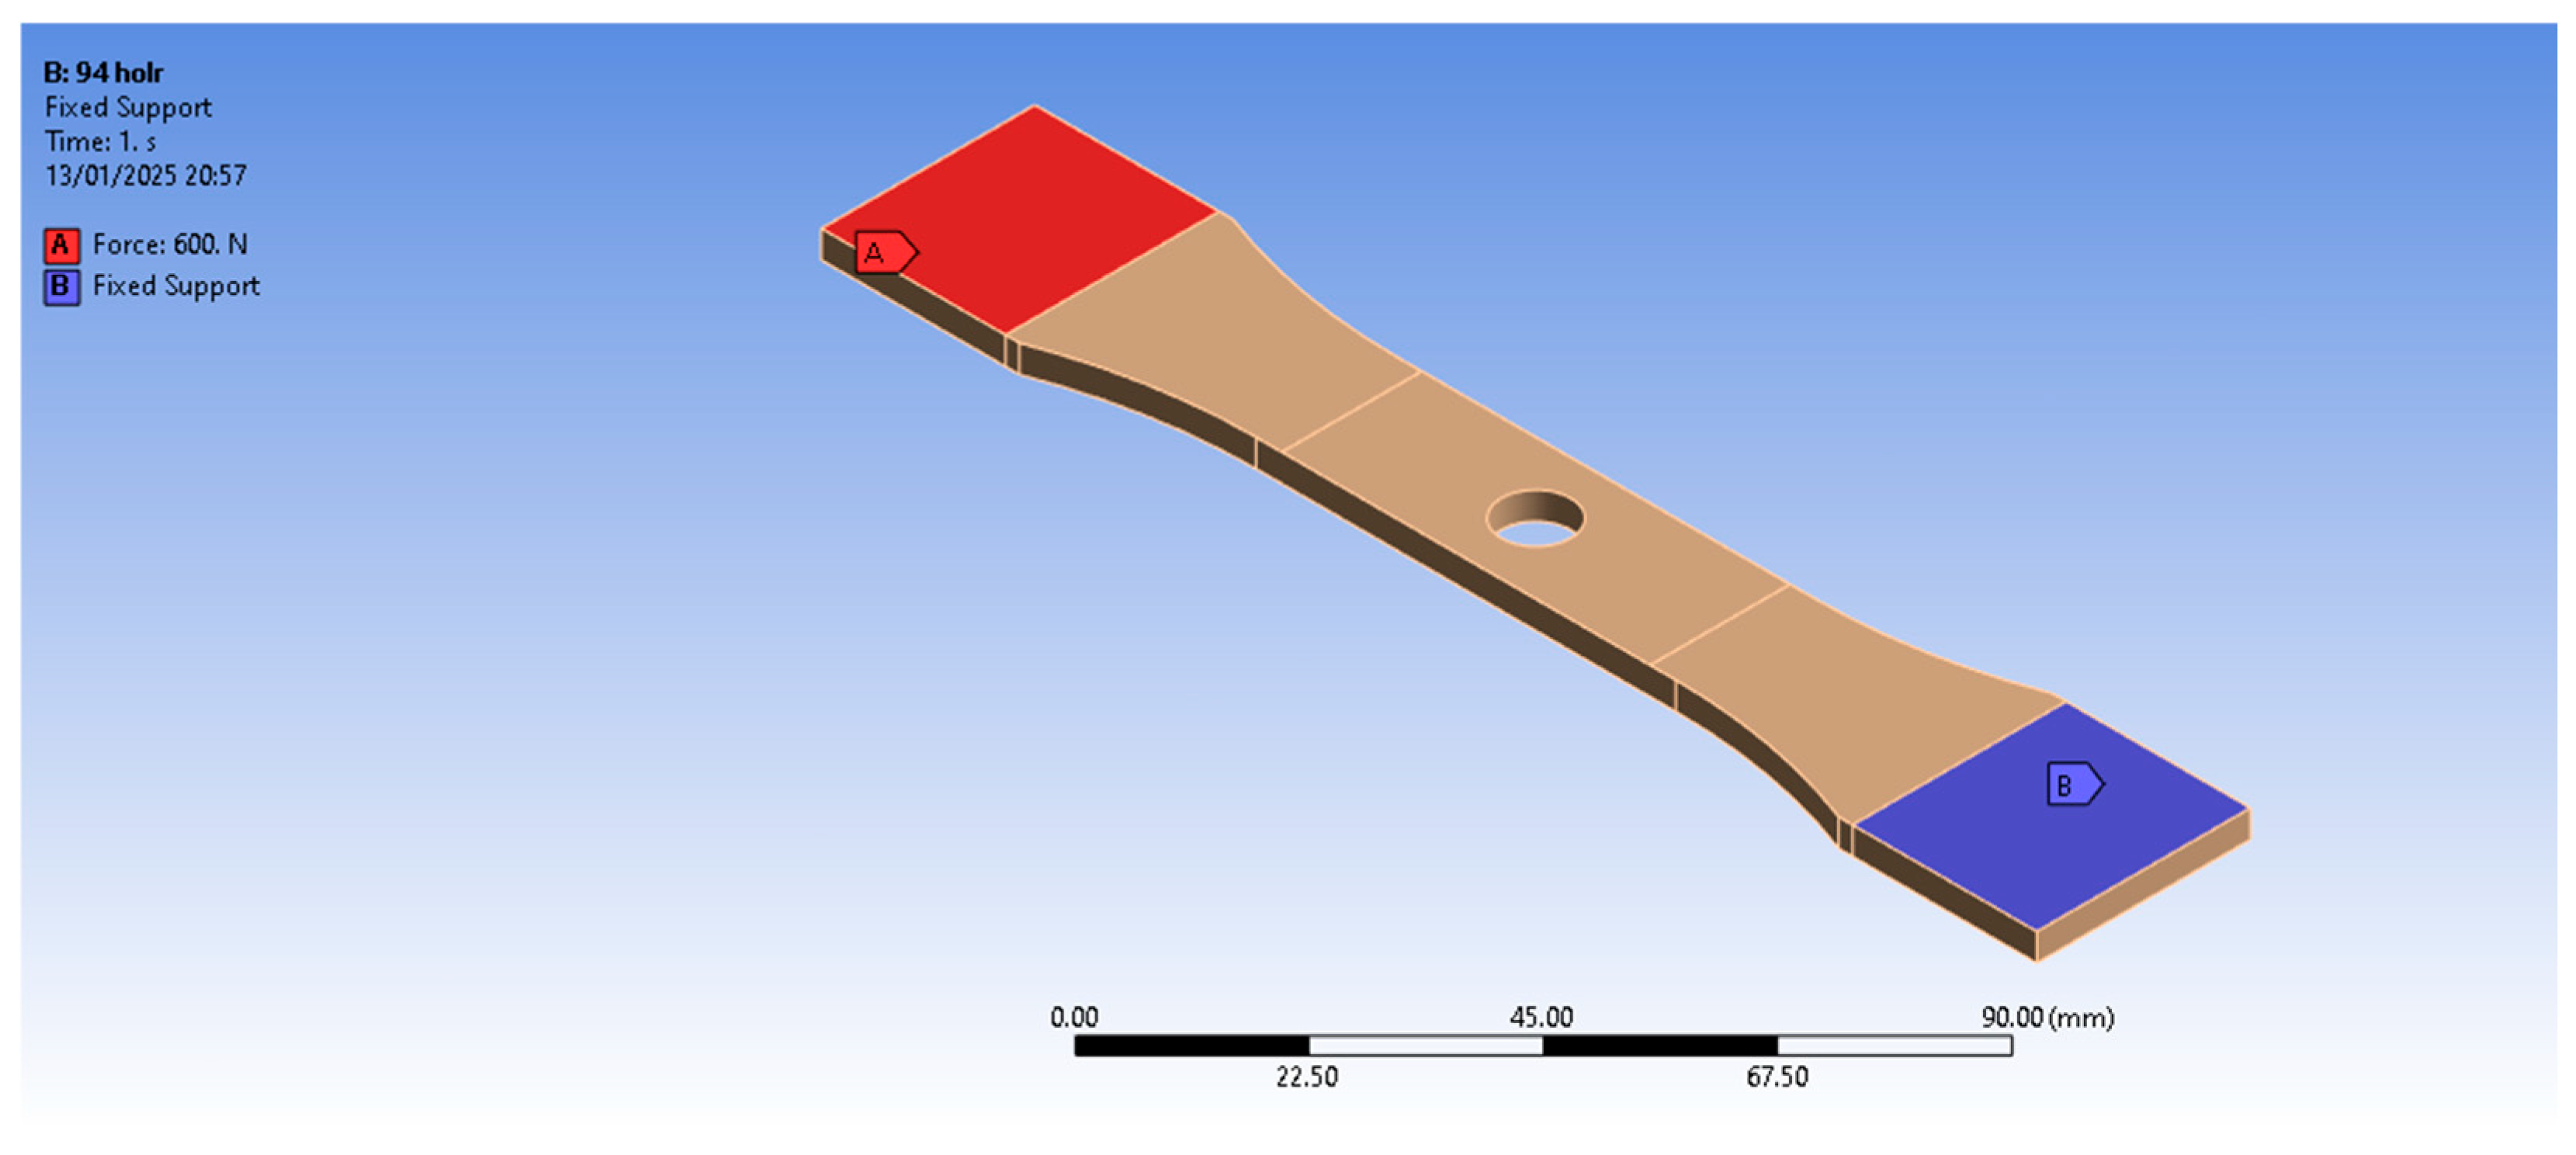
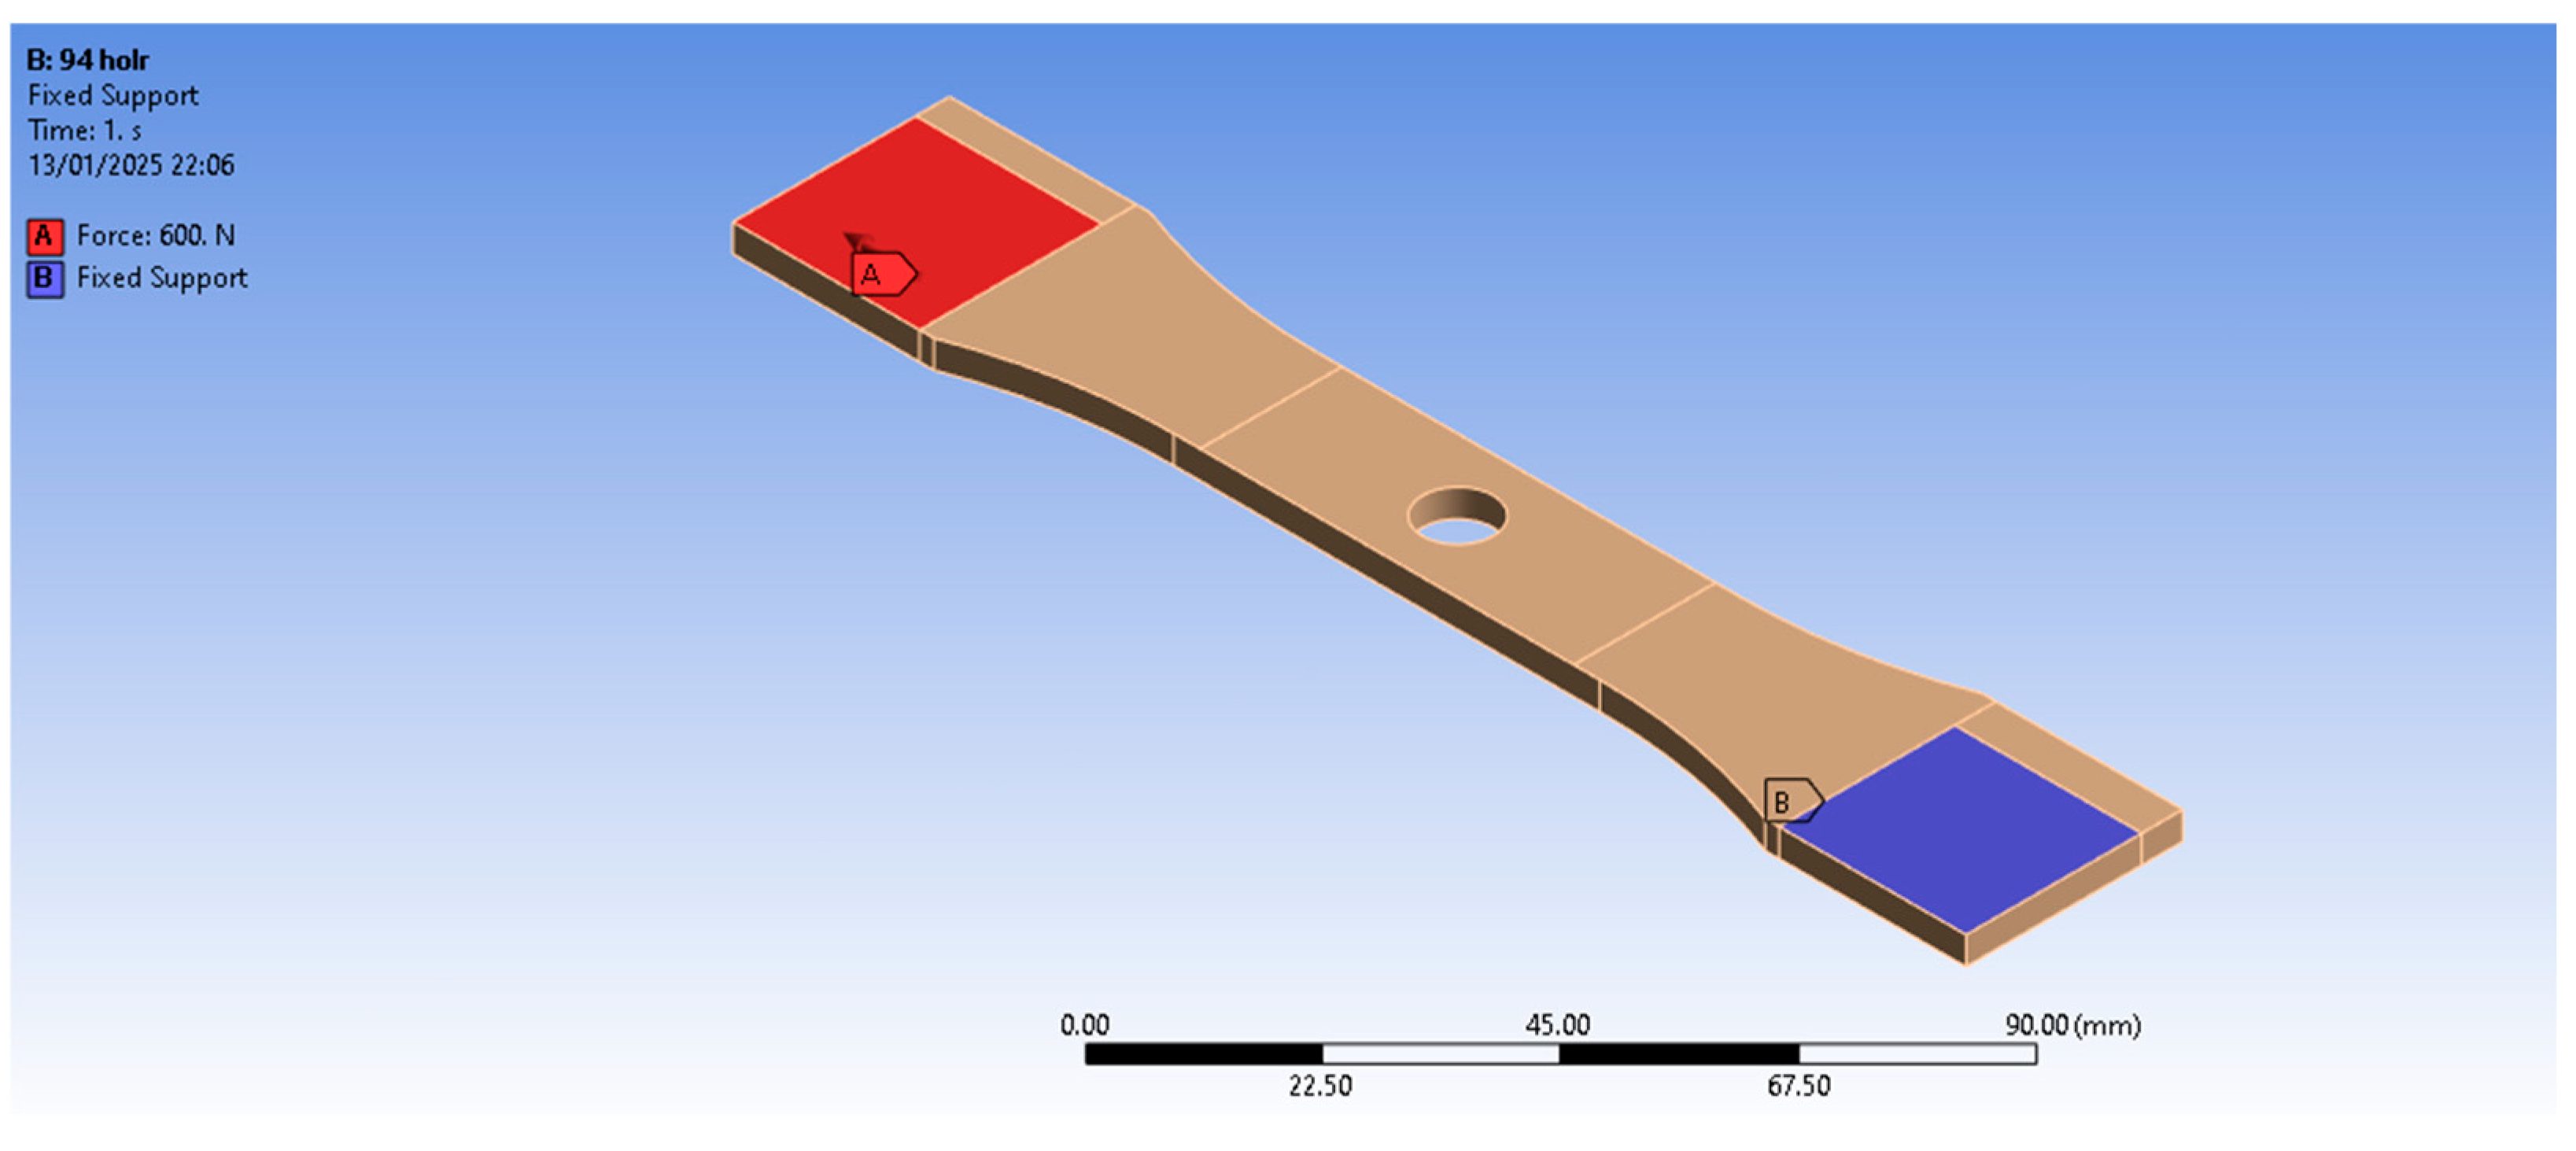
2.3. Finite Element Analysis

This work used simulation in the software Ansys 2024 R1. The input parameters for the simulation included a Young’s modulus of 1.76 GPa, a Poisson’s ratio of 0.34, and the type of isotropic structure. Geometries with hole diameters of 9.5 mm, 7.6 mm, 5.7 mm, 3.8 mm, 1.9 mm, as well as a fully filled geometry, were modeled.
A structured mesh was developed for the studied models. For the geometries containing holes, refinement was performed around the hole (Figure 6) with the goal of ensuring greater accuracy of the results, as significant variations in the stress field occur in this region.
The elements used by the software to find the solution for axial and eccentric loads were SOLID185 and SURF154. The SOLID185 is typically used for 3D structures for deformation, deflection, and other applications. The SURF154 can be used for various loads and surface effect applications for 3D analyses [32] (ANSYS, 2009).
Table 5 shows the number of elements and nodes used for each analyzed structure.
For the boundary conditions, the conditions of the test specimen in a tensile test under axial load were reproduced, where the base is fixed in the grip, and the upper part is subjected to loading. In Figure 7, the boundary conditions used in FEA can be seen, with the region where the load is applied (A) and the region that is fixed (B). For the analysis, a force of 600 N was chosen for all the test specimens.
A simulation was also performed reproducing the boundary conditions of the tensile test with the eccentric load, where the test specimen’s fixation zone, 23.5 mm, was fixed in the grip, considering the restriction caused by the grip effect, as shown in Figure 8.
In addition, a simulation was conducted reproducing the boundary conditions of the traction test with the eccentric load, disregarding the effect of the grip at the upper part of the test specimen, as shown in Figure 9.

2.4. Analytical Method

Whitney–Nuismer’s analytical method can only be applied to flat plates with central holes subjected to axial loads. In the development of the equations, the infinite plate model for isotropic materials was considered, and analyses were conducted for each d/w ratio.

3. Results and Discussions

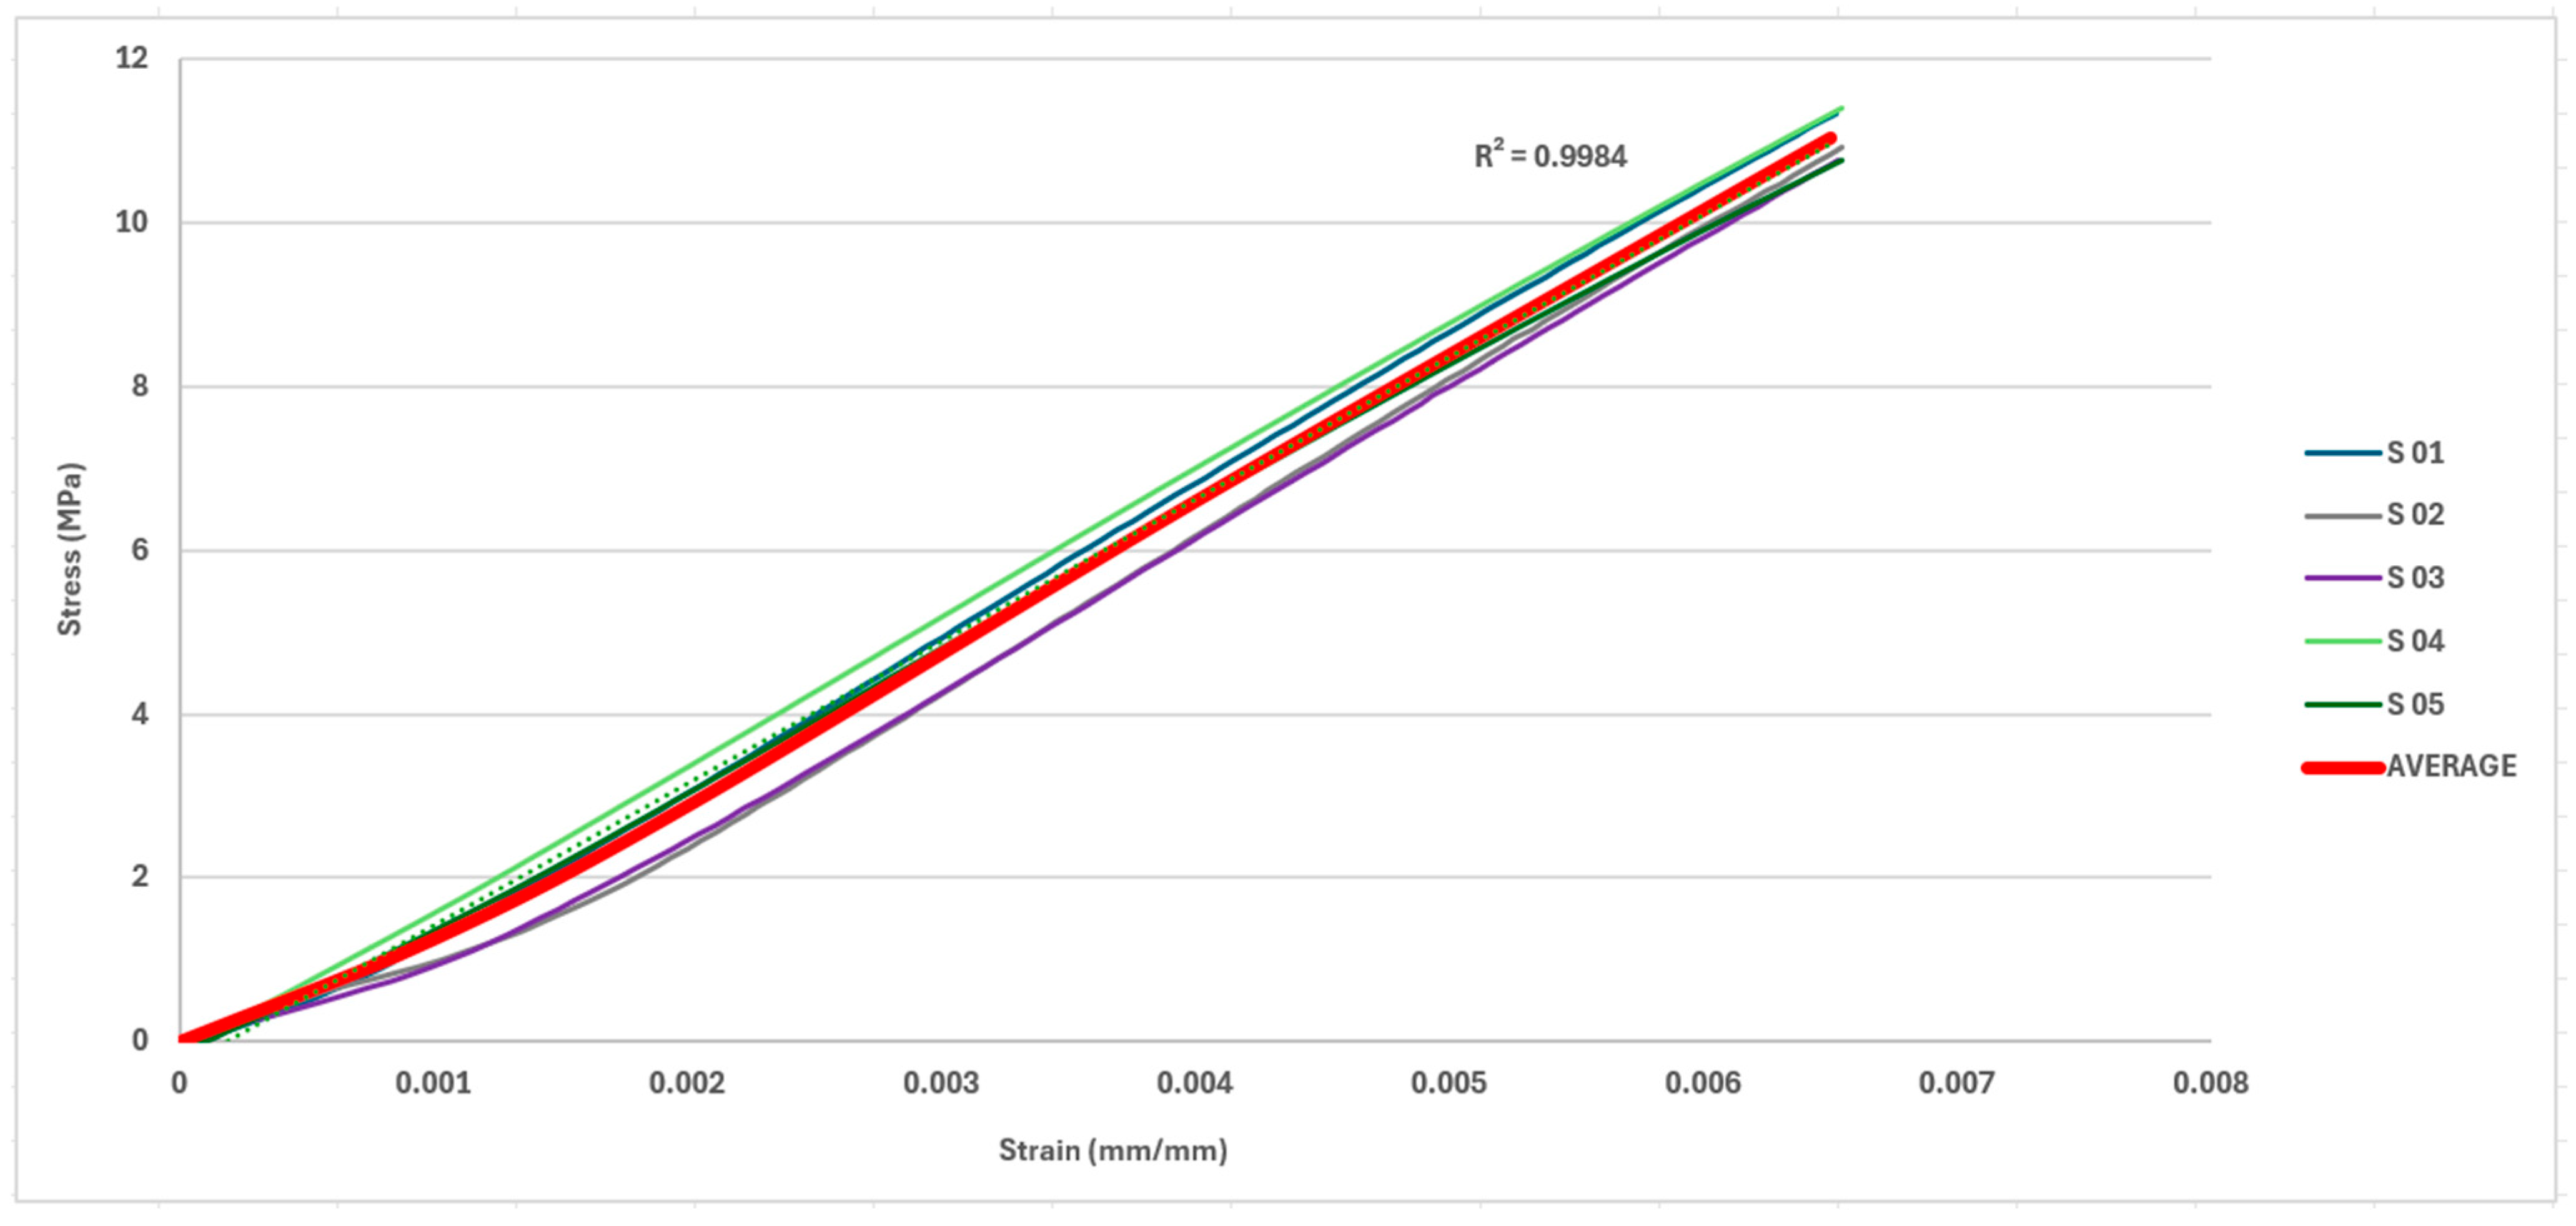
3.1. Test Specimen Subjected to Axial Load

The test specimens subjected to axial loads were analyzed using the digital image correlation method. The strain results for the application of a 600 N load for the d/w ratios of 0.3, 0.4, and 0.5 can be observed in Figure 10, Figure 11 and Figure 12, respectively.
Once the strain values are obtained using the DIC method and knowing the value of the Young’s modulus, it is possible to calculate the stress using Equation (3):
σ = E · ε
Table 6 presents the nominal stress results for each d/w ratio analyzed through the DIC method.
It is possible to compare the data found in the DIC analysis and the simulation using FEA. In Figure 13, the strain values found around the holes with d/w ratios of 0.3, 0.4, and 0.5 can be seen. The maximum strain of the test specimens is found within the hole cavity. However, to perform the comparative analysis, it is necessary to rely on the data around the hole in the simulation, since the DIC analysis is performed in the two-dimensional plane.
In Table 7, the average strain data obtained through the points selected around the hole and the maximum strain values obtained by FEA (Figure 13) are available. Additionally, the Table presents the strain values obtained by the DIC method. Thus, a comparison was made between the maximum value and the DIC method, and a region on the edge of the hole was also selected for comparative analysis. The error values presented in Table 7 were calculated according to Equation (4).
P e r c e n t a g e   E r r o r = E x a c t   V a l u e A p p r o x i m a t e   V a l u e E x a c t   V a l u e × 100 %
The results of the strain simulation, as well as the stress for a 600 N load, can be found in Table 8. The data presented in Table 8 for the notched specimens refer to the maximum values found, which coincide with the values around the hole. For the analysis of the specimen without a hole, the results in Table 8 refer to the values found in the middle of the specimen, thus maintaining the same reference for all specimens.
A simulation showed that the strain field behavior was as expected, as the strain field increases and concentrates on the inner wall of the hole as the d/w ratio increases. Also, it is possible to see the axial load effect in the specimen without a hole in Figure 14.
In addition to the strain field, the stress field was also analyzed. As expected, the maximum stress concentrated at the inner cavity of the hole. In Figure 15, the stress field for each d/w ratio studied can be identified.
In Table 9, the results of the stress concentration factor (Kt) by the analytical method, simulation, and DIC are shown. The percentage error (Equation (4)) calculation for FEA and DIC methods compared to the analytical method of Whitney–Nuismer was carried out. It can be observed that, in all cases, the error was below 6%, indicating that the study presents consistent results. Moreover, in all the cases analyzed, the greater the d/w ratio, the lower the Kt found. This occurs because, when the diameter increases, the area where the load is distributed is larger, thus smoothing the stress distribution.
In Figure 16, the graphical difference between the theoretical, simulated, and experimental models can be observed.

3.2. Test Specimen Subjected to Eccentric Load Considering the Restriction of the Clamp

The test specimens subjected to eccentric loads are under the action of combined forces, generating a traction effect combined with the bending caused by the action of the bending moment on the specimens. In the case of the tests performed, the bending effect was minimized due to the clamp action on the upper region of the specimen. This phenomenon was analyzed using the Digital Image Correlation (DIC) method. Figure 17, Figure 18 and Figure 19 show the strain results for the d/w ratios of 0.3, 0.4, and 0.5, respectively, for a 600 N load application, highlighting the strain fields that are more pronounced on the left side compared to the right. Strain values with Cartesian positions were indicated. It can be observed that the values were taken from the same y-coordinate, changing only the x-coordinate to demonstrate that the left side has higher values than the right side due to the applied eccentric load.
Just as the stress calculation was performed through the strain obtained by the DIC method for each d/w ratio for the specimens subjected to axial loads, the same calculation was executed for the specimens subjected to eccentric loading using Equation (3). The results can be viewed in Table 10.
Since the specimen was subjected to an eccentric load, analyses using the Whitney–Nuismer method are compromised, as the criterion covers situations where the analyzed part is subjected to symmetrically applied loads. In the case of a specimen subjected to eccentric loading, there is an asymmetry in the stress field, which is why the FEA analysis was performed to make comparisons with DIC. Figure 20 shows the strain fields obtained by FEA, containing strain data around the holes for each d/w ratio analyzed. It is possible to notice that the values found in the region around the hole on the left side are greater than on the right side.
In Table 11, the average strain data obtained through the points selected around the hole on the left side and the maximum strain values obtained by FEA (Figure 20) are available. Additionally, the table includes the maximum values found by the DIC method. Thus, a comparison was made between the maximum value obtained by FEA and the strain value obtained by DIC. Furthermore, a region on the left edge of the hole was selected for a comparative analysis.
In Table 12, the strain data obtained by FEA and the strain data obtained by the DIC method are available, both for the right side. The maximum value data obtained by FEA were not compared to the DIC method for the right side, since, in the case of an eccentric load, the asymmetry generated results in a less significant strain value for this side. The asymmetry found in the results occurs because the grip was fixed on the left side and partially free on the right side (Figure 8). Thus, the region most affected by the applied load was the left side.
The error values found in the tables were calculated according to Equation (4) and demonstrate consistent results, since the highest error found for the left side (Table 11) was 6.9% and for the right side 0.3% (Table 12).
The strain results, as well as the stress for 600 N with eccentric loading obtained by FEA, can be found in Table 13. The data presented in the table for the specimens with hole refer to the maximum values found, which are equal with the values around the hole. For the specimen without a hole, the results refer to the values found in the middle of the piece, thus maintaining the same reference for all specimens.
Through simulation, it is possible to analyze the behavior of the strain fields when subjected to eccentric loads. Due to the effect of the increase in the d/w ratio size, it is noticeable that the strain field increases in the left region (Figure 21), which is subjected to the more intense load.
In addition to the strain field, the stress field was also analyzed, as can be seen in Figure 22.

3.3. Test Specimen Subjected to Eccentric Load Disregarding the Clamp Restriction

In this section, the test specimens subjected to eccentric loads were analyzed, disregarding the effect of the grip. In this case, the combined load acting on the part will not have any restriction effect on the upper region of the test specimen, thus allowing the free action of the bending moment. This phenomenon was analyzed using FEA. Figure 23 shows the strain results for all the d/w ratios analyzed under a 600 N load application. It can be seen that the maximum strain zone, presented in red on the scale, is much more significant on the left side compared to the right side. The simulation also showed that the behavior of the stress fields was as expected, since as the d/w ratio increases, the strain field also increases and concentrates on the inner wall of the hole. This behavior can be seen in Figure 24. This significant effect on the left side compared to the right is due to the fact that, in this analysis, the bending moment is free to act without restriction, causing an evident bending in the specimen.
Strain values were placed around the hole (Figure 25) to demonstrate the difference, with the left side having higher values than the right due to the eccentric load applied, disregarding the clamp.
In Table 14, the stress and strain values found in the simulation are shown, and for the specimens with a hole, the maximum values coincide with those around the hole. For those without a hole, the values presented in the table are in the middle of the piece, maintaining the same reference.
In Table 15 and Table 16, the strain values for the left and right sides are presented. As expected, the left side has higher strain values compared to the right side, since the load is applied in the fixed zone on the left side and is partially free on the right side (Figure 9). Table 15 shows the average strain data for the left side obtained by FEA, as well as the maximum value found. This table provides a comparative analysis between FEA data and the DIC method. In Table 16, the strain data for the right side obtained by FEA and the DIC method are available. The maximum values obtained by FEA were not compared to the DIC method for the right side, since, in the case of an eccentric load, the generated asymmetry results in a less significant strain value for this side. The calculated error values (Equation (4)) show significant discrepancies between the FEA and DIC results for both analyzed sides, evidencing that the simulation of the eccentric load without considering the effect of the clamp fixation does not represent what occurred in the experimental tests.

4. Conclusions

From the results presented, the following conclusions can be obtained:
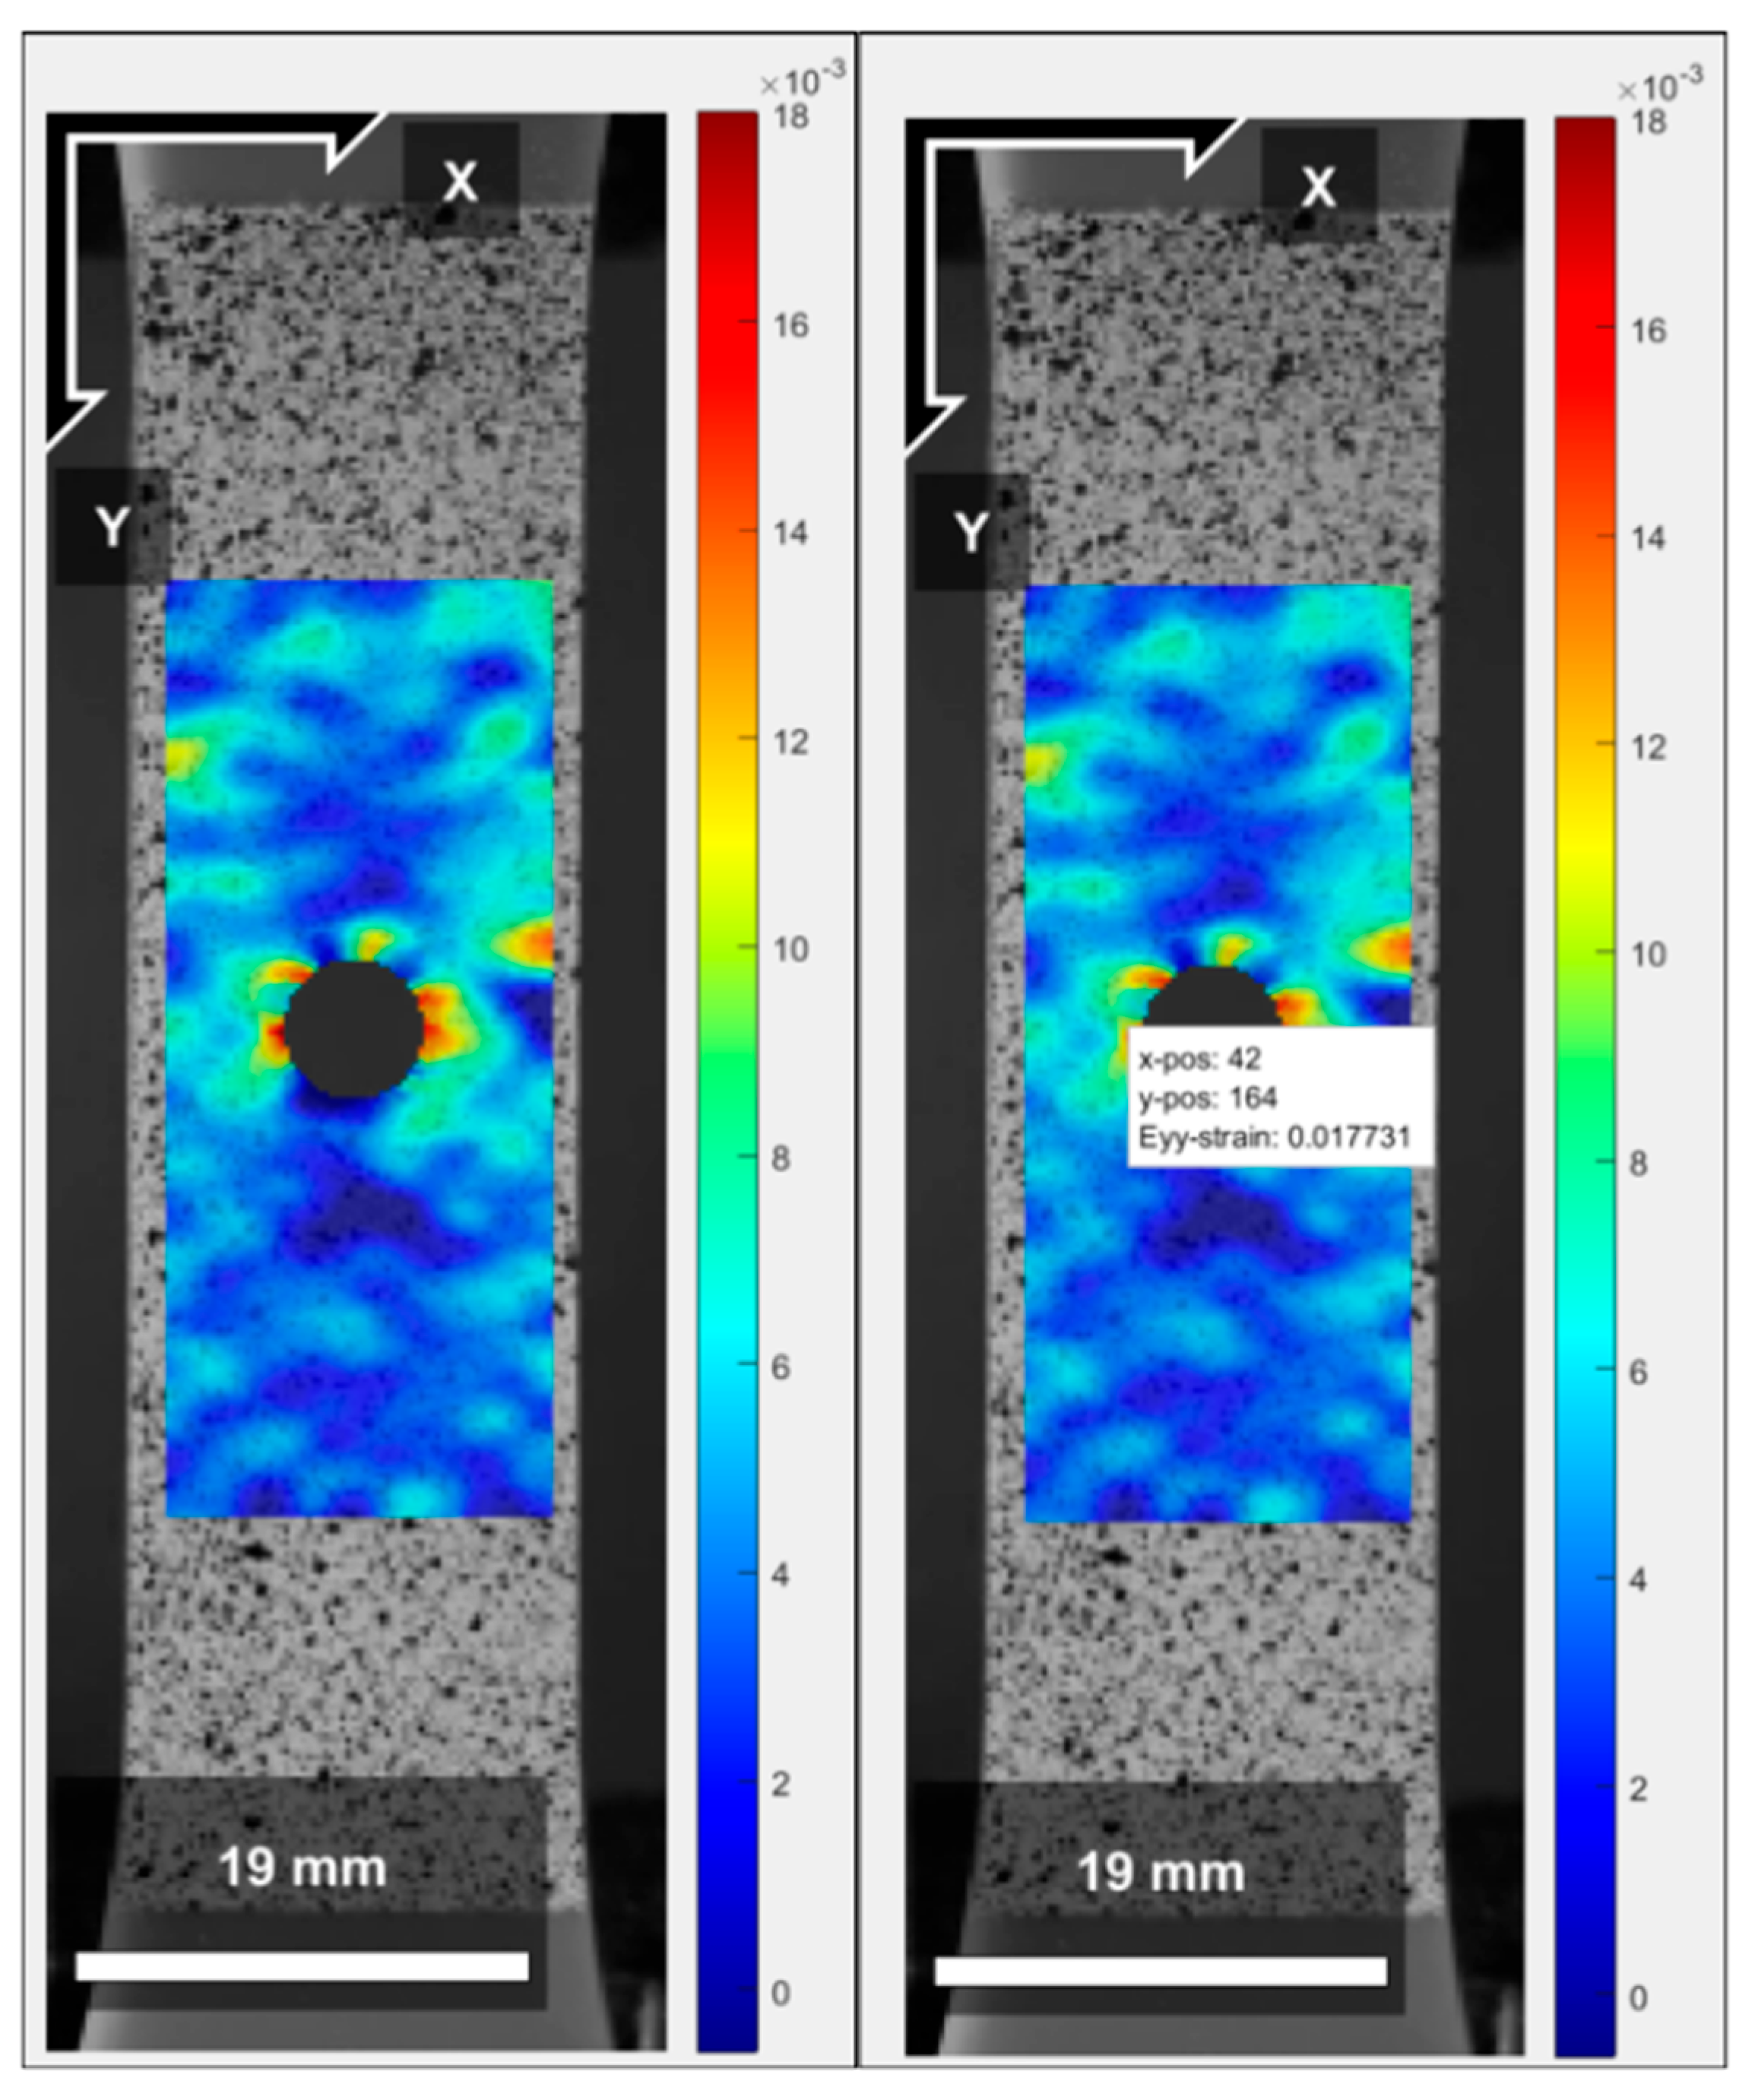
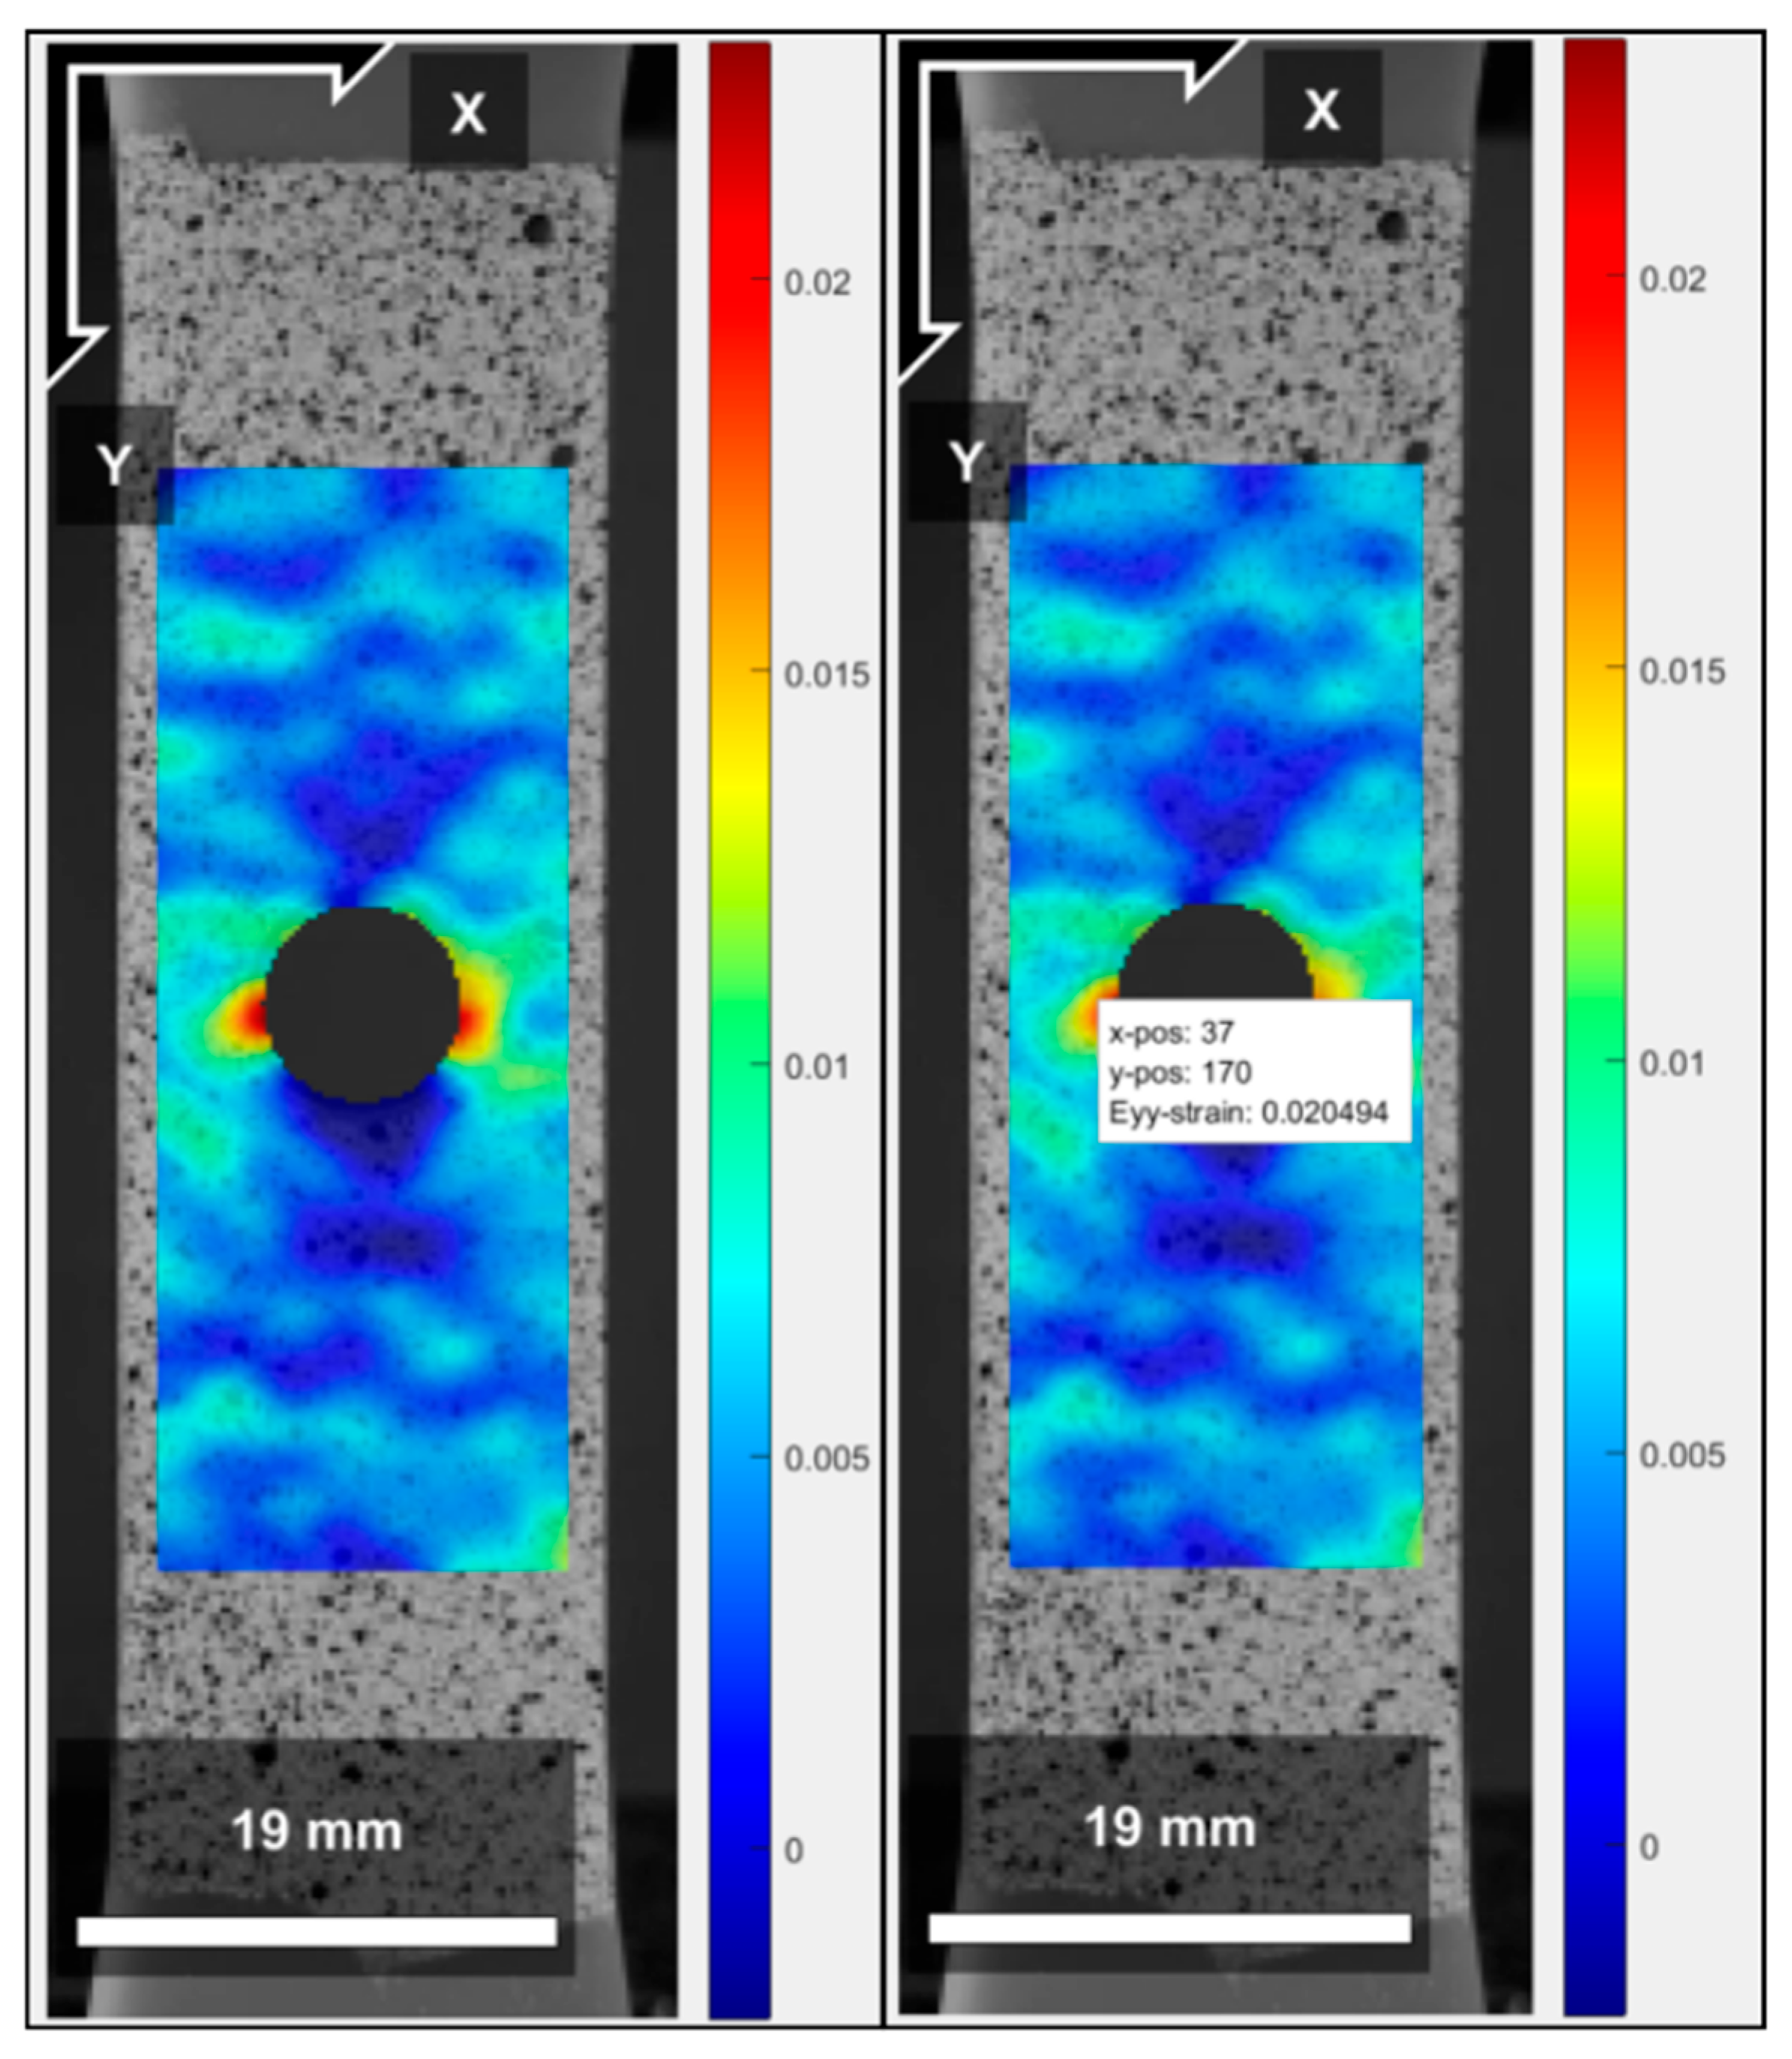
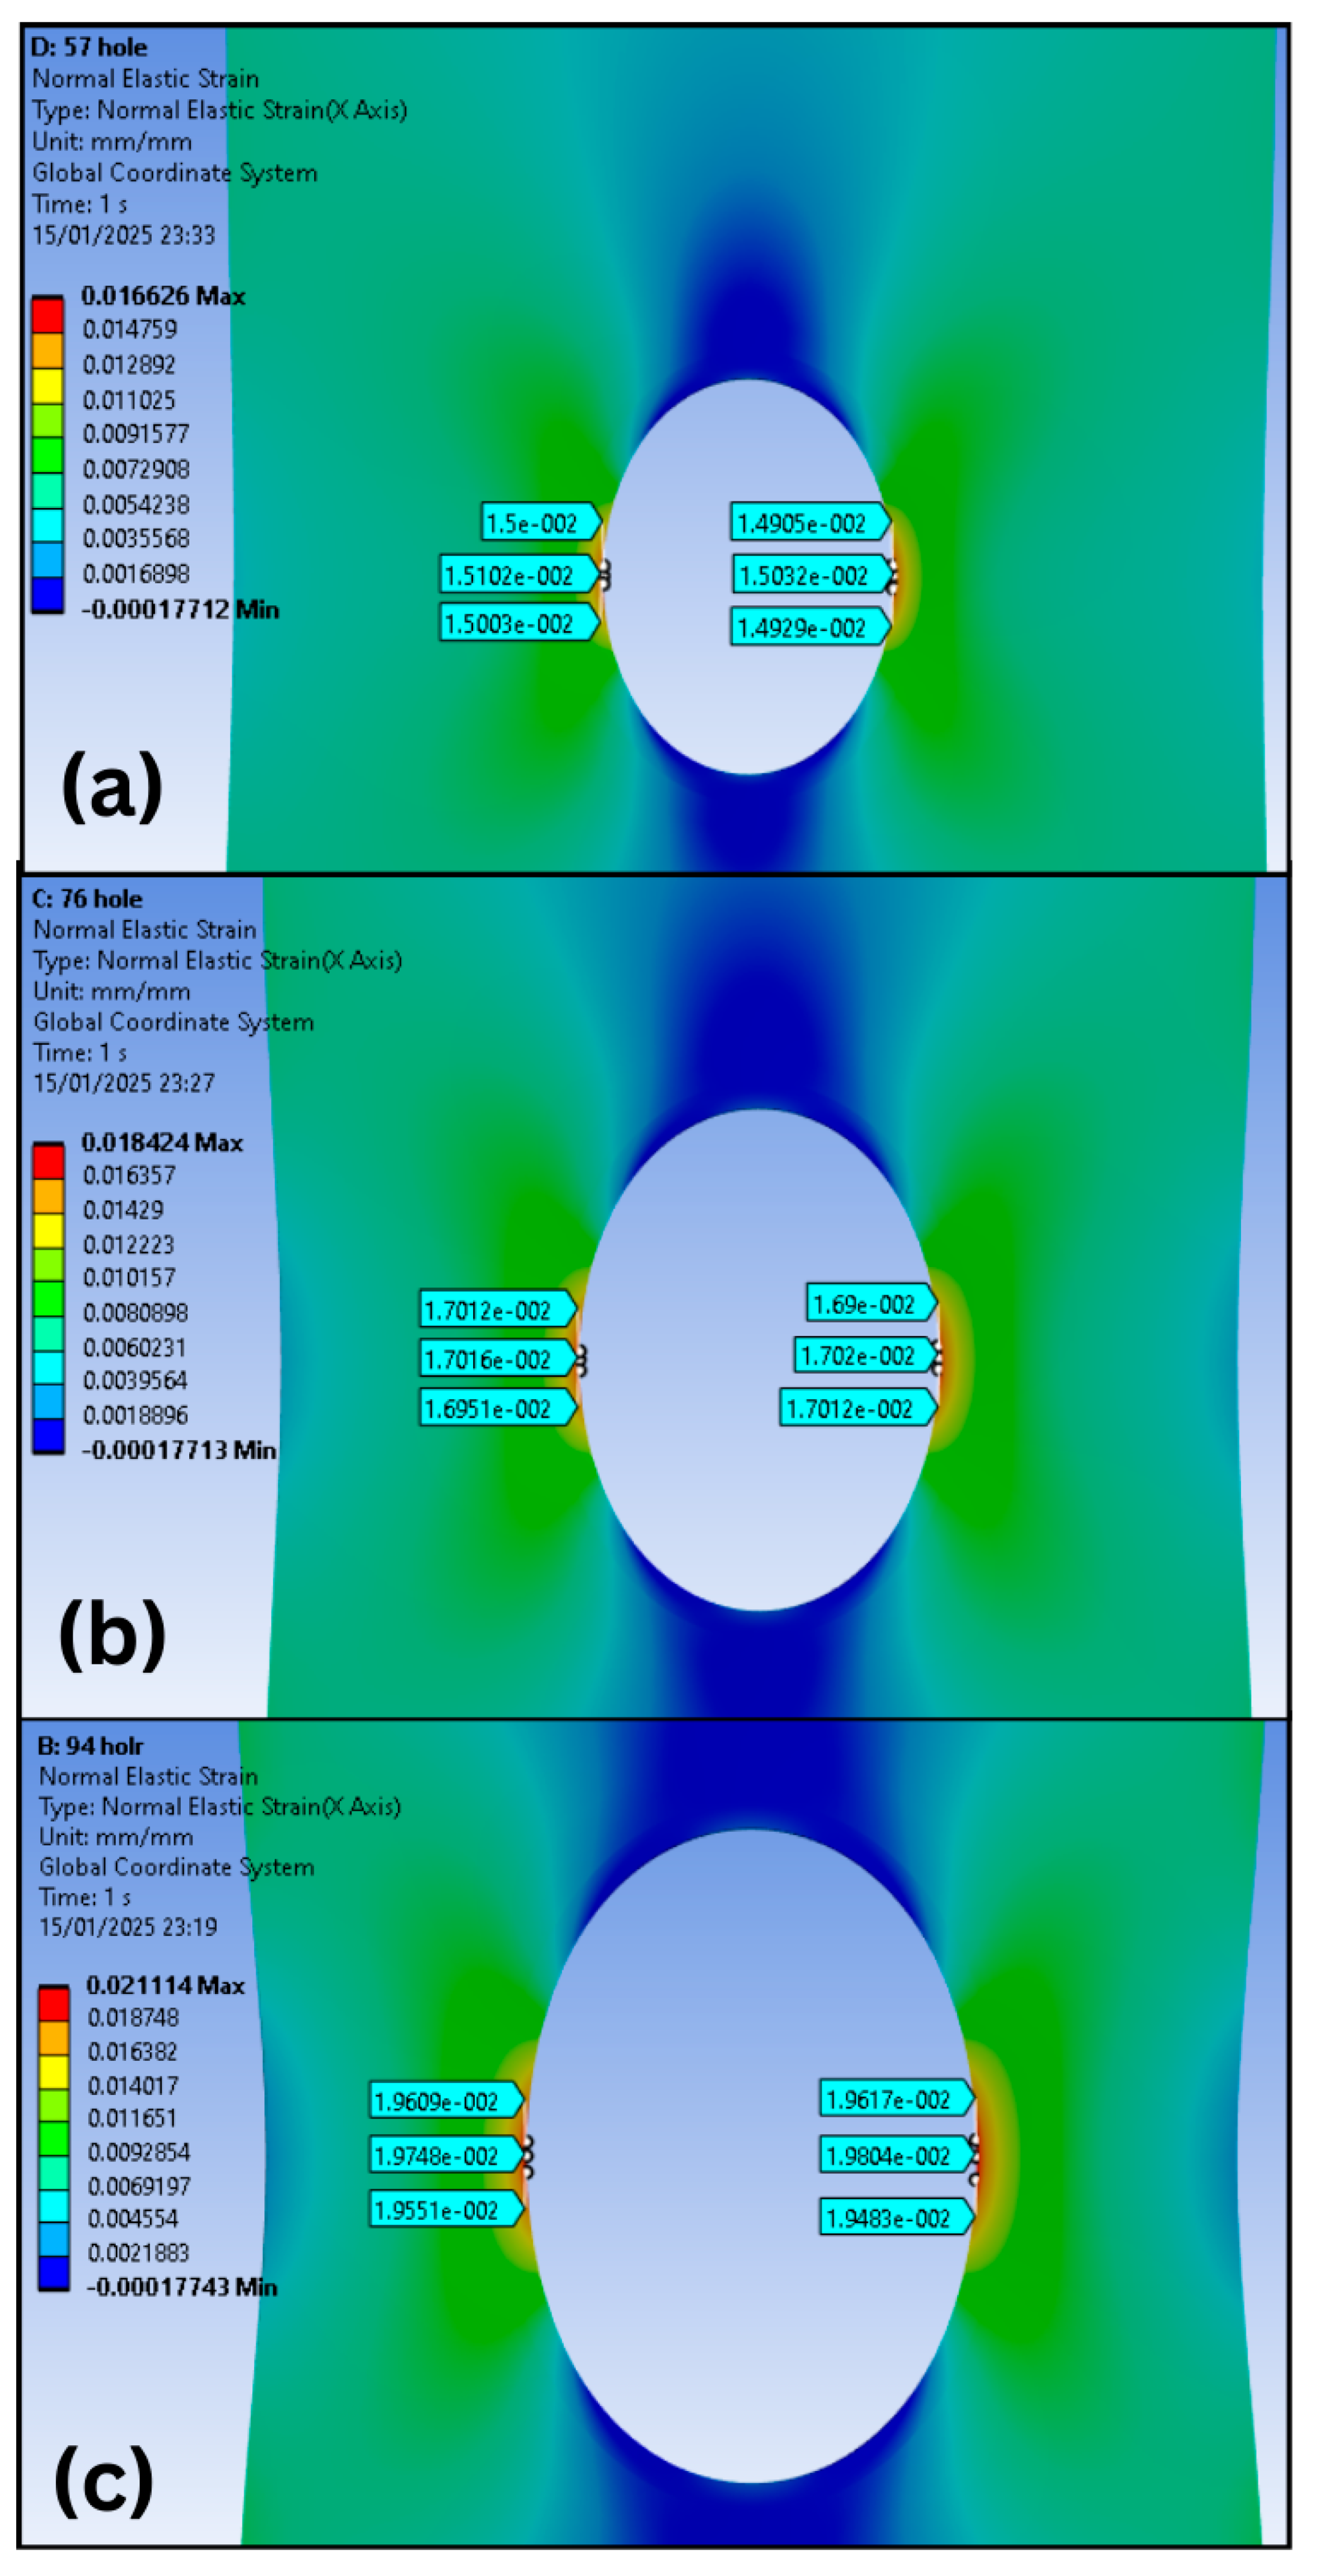
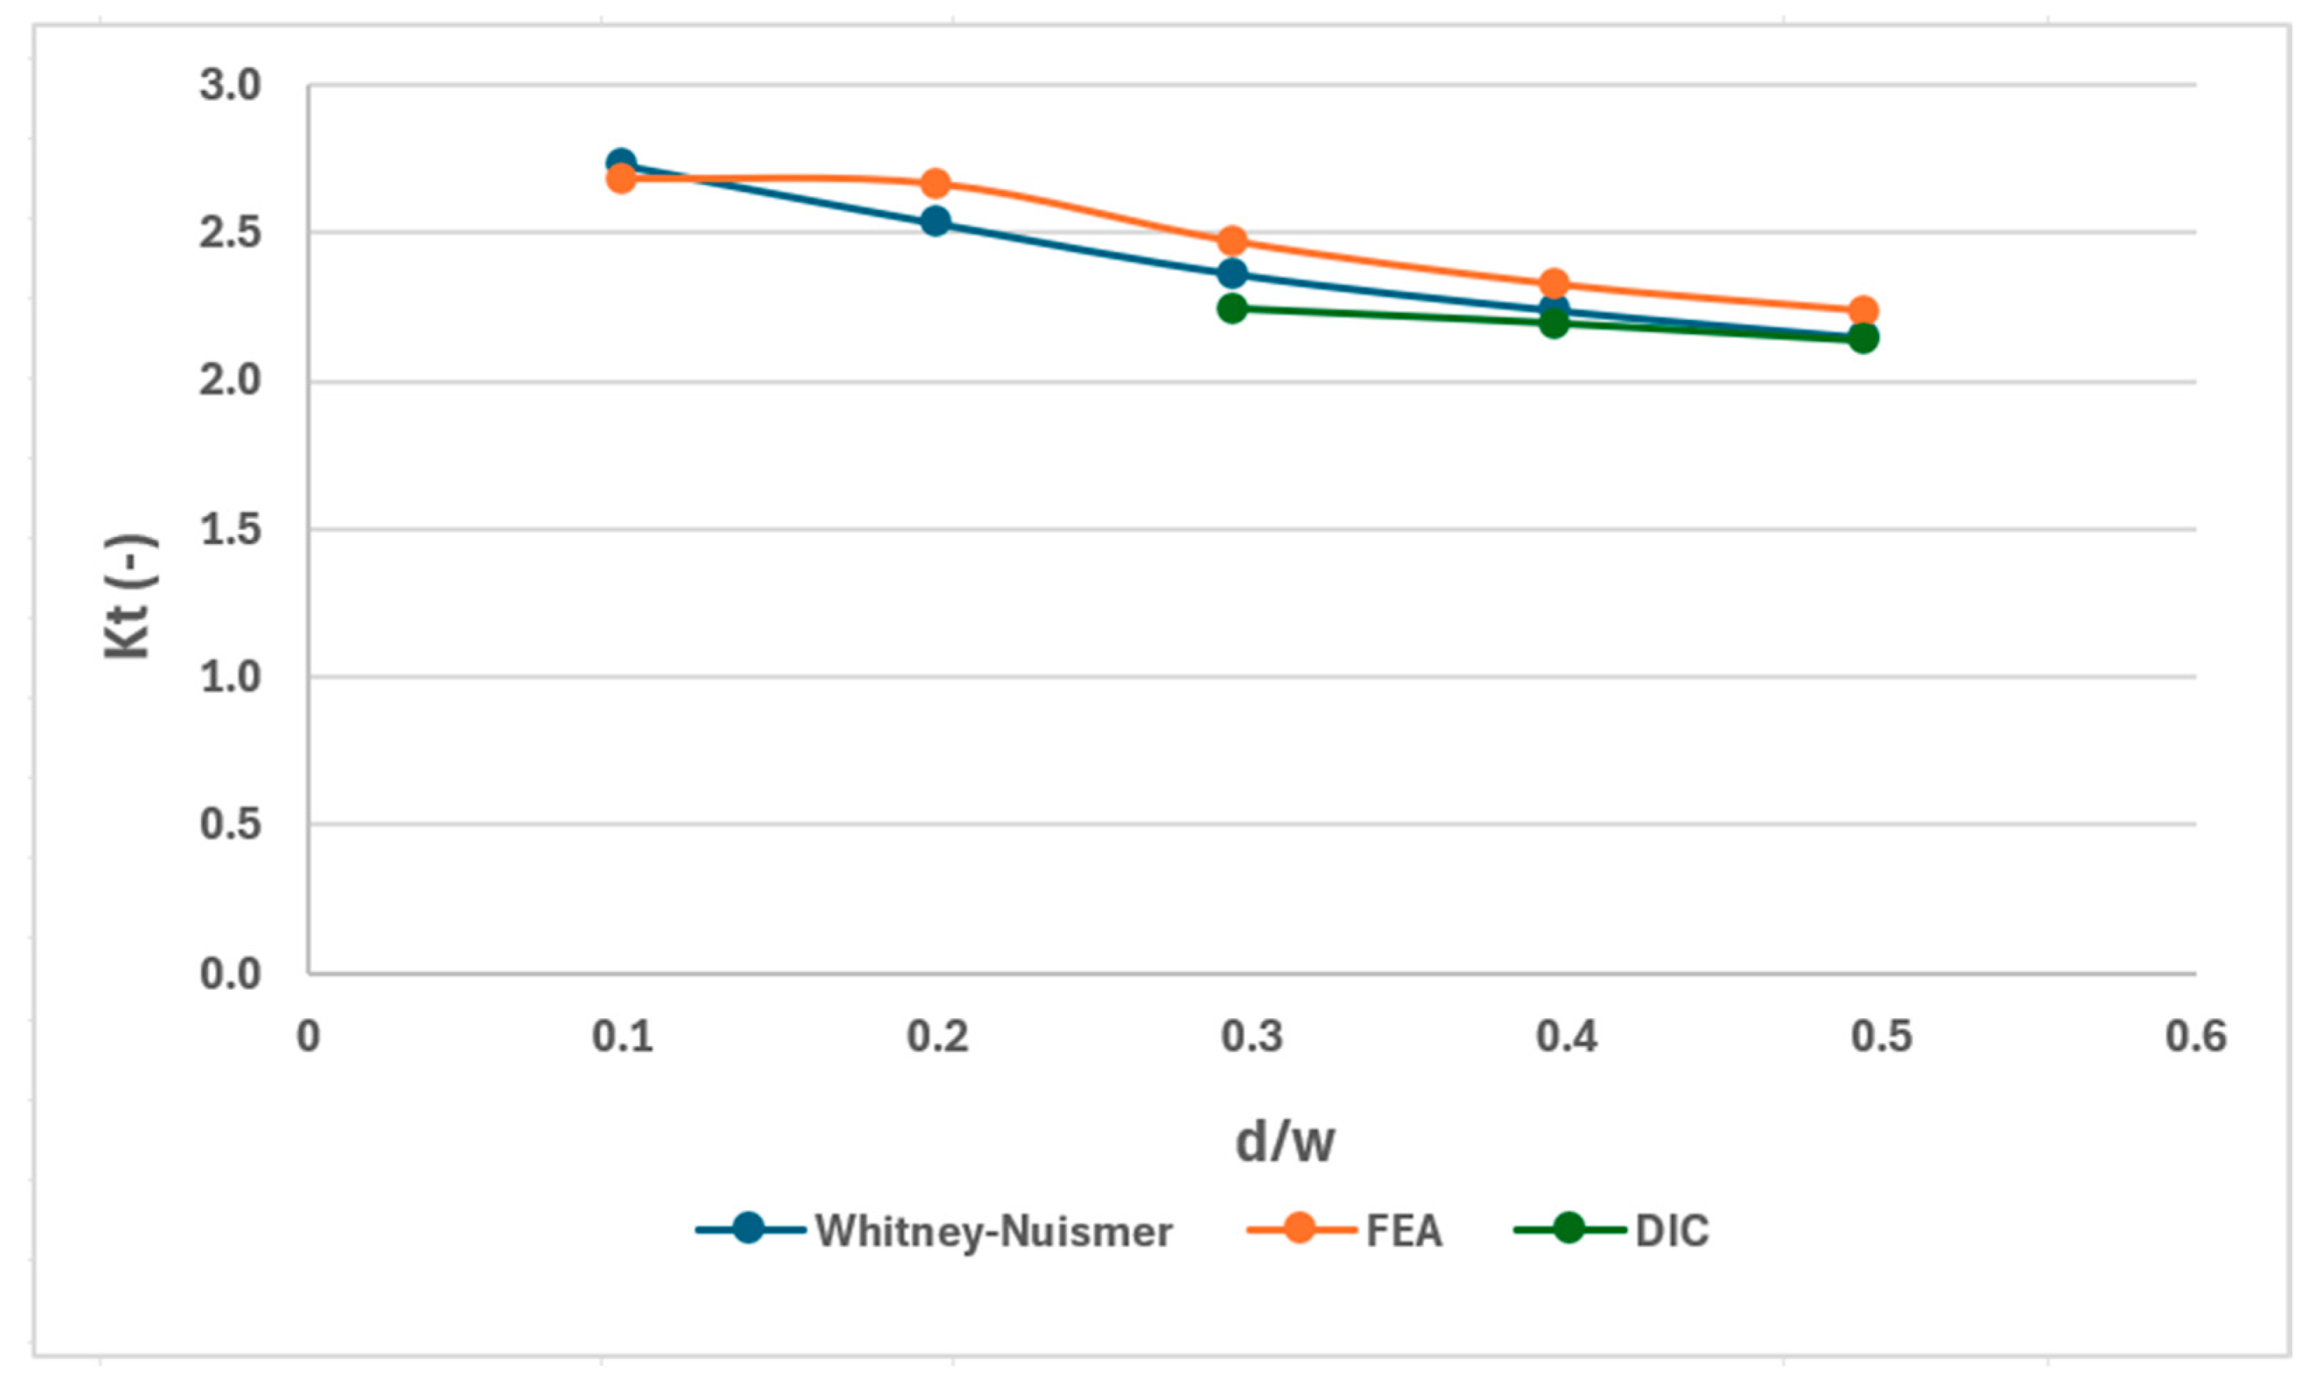
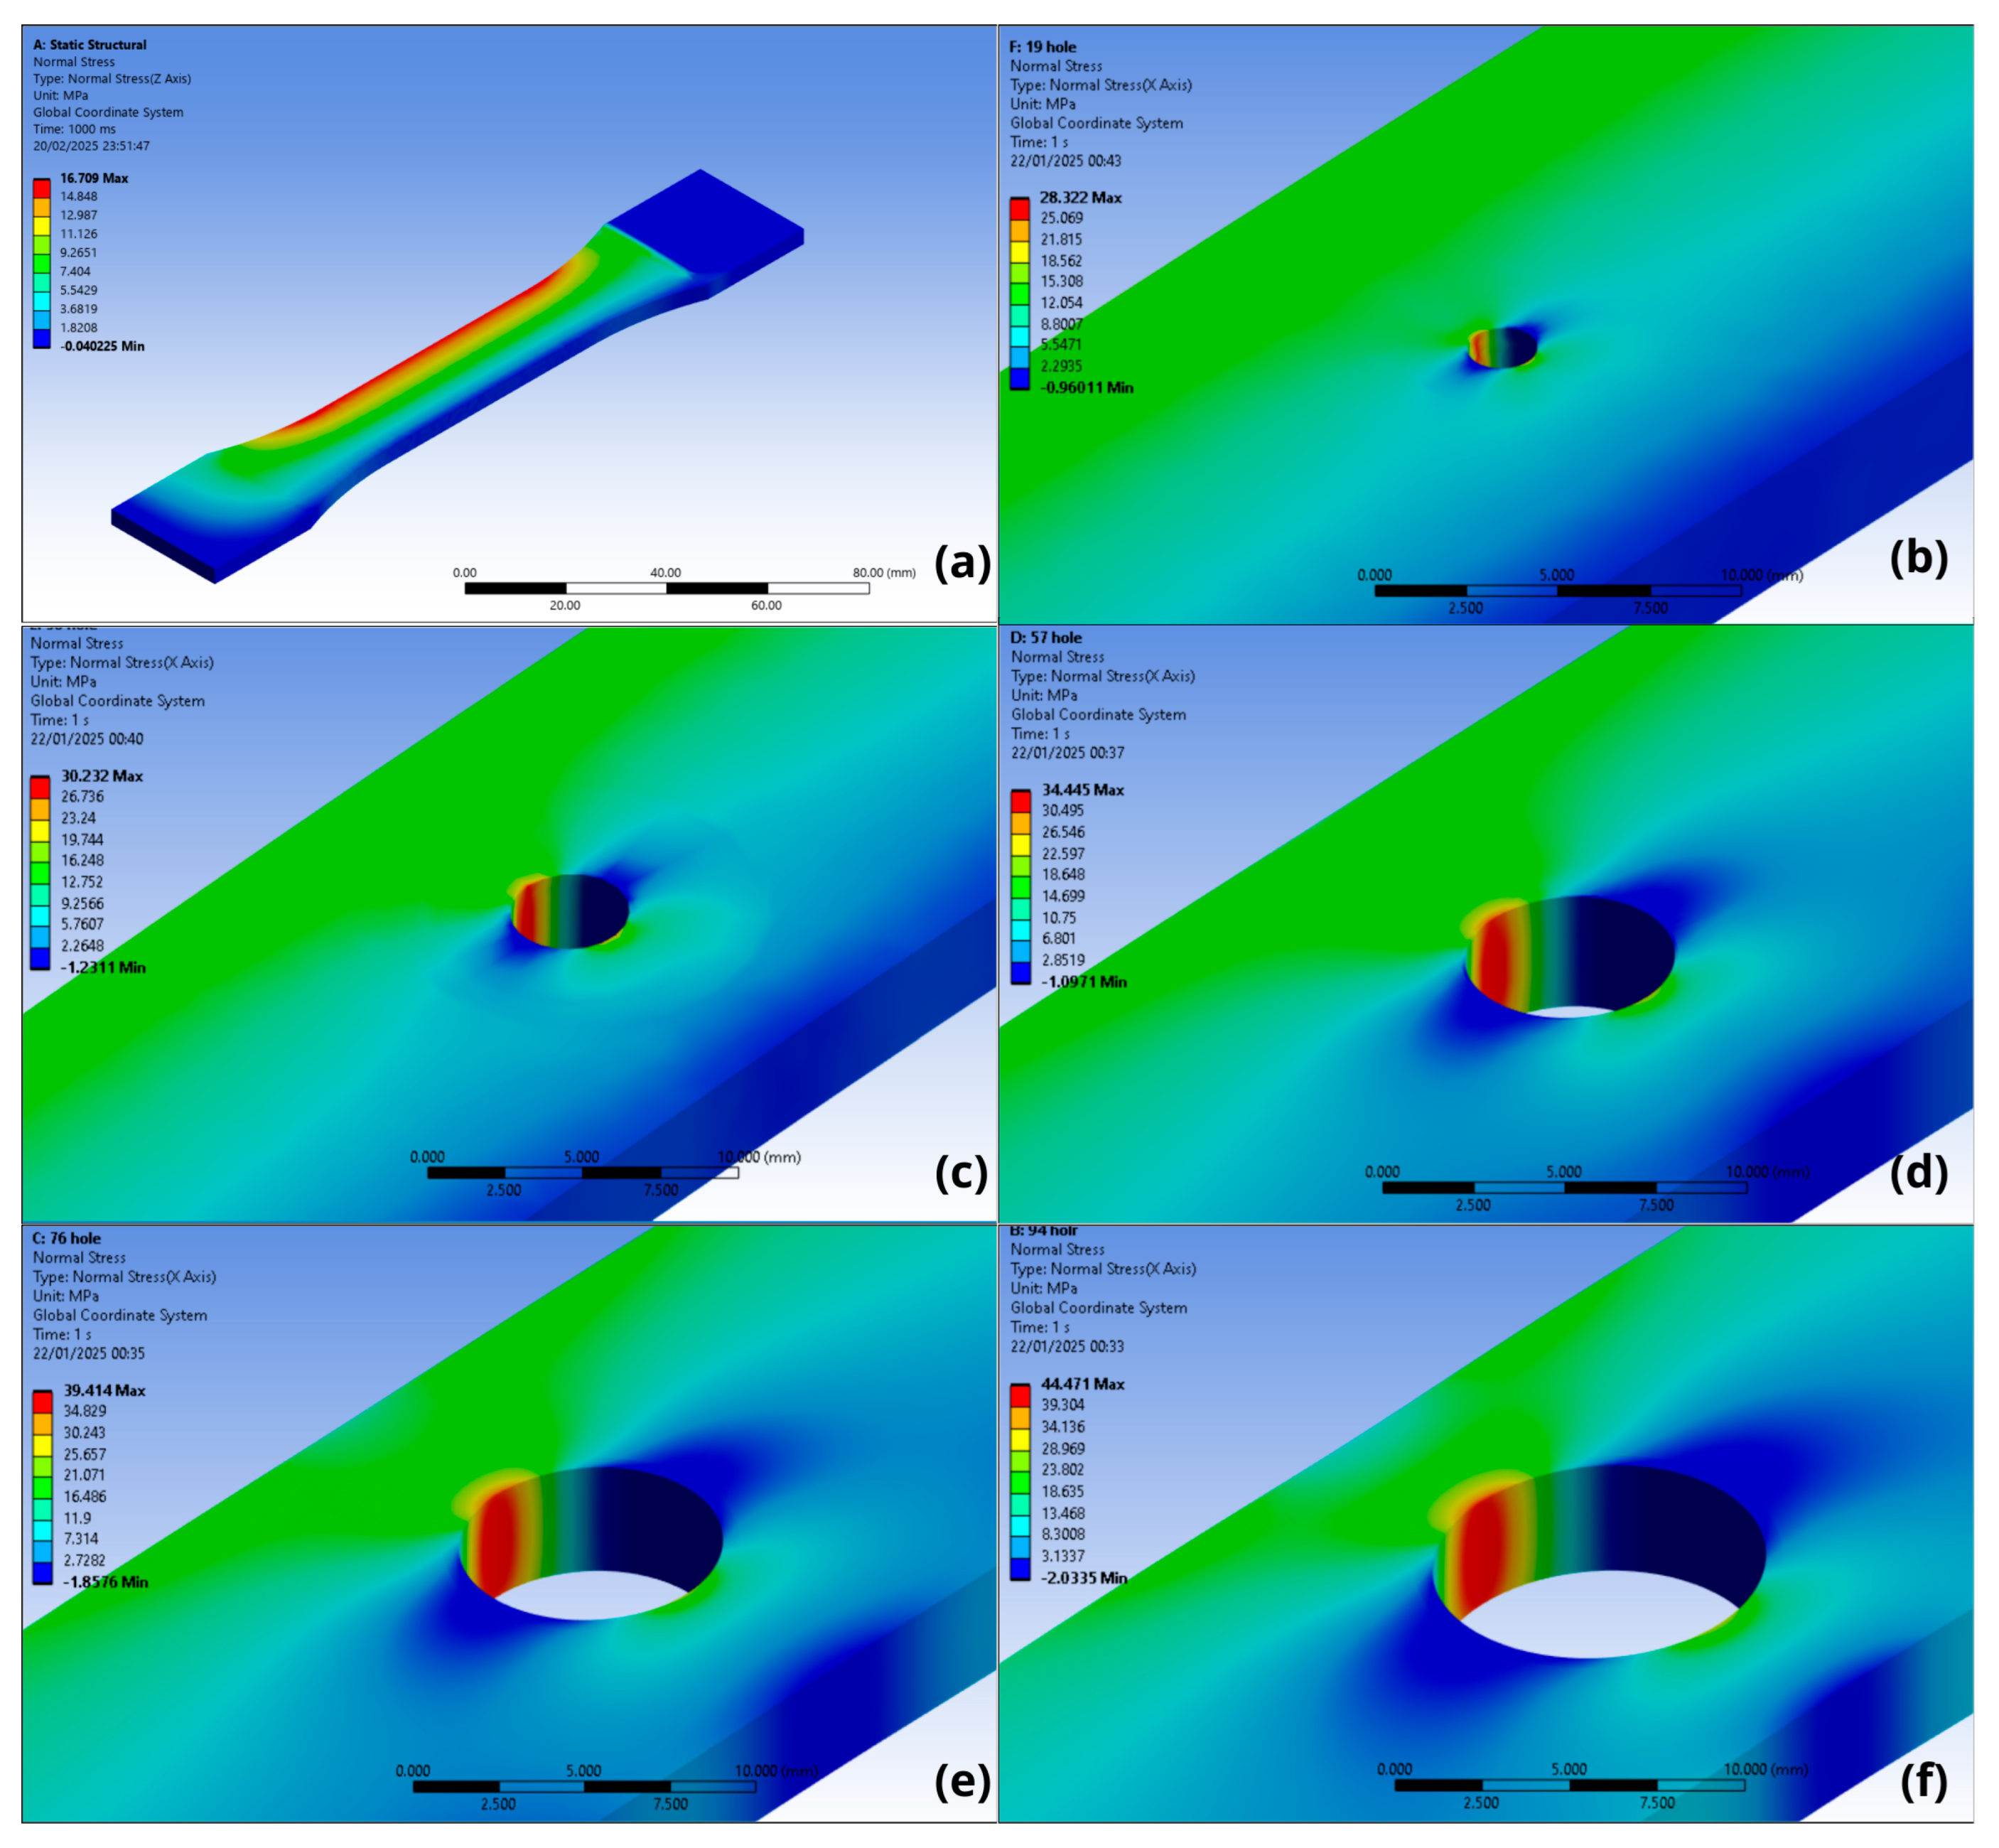
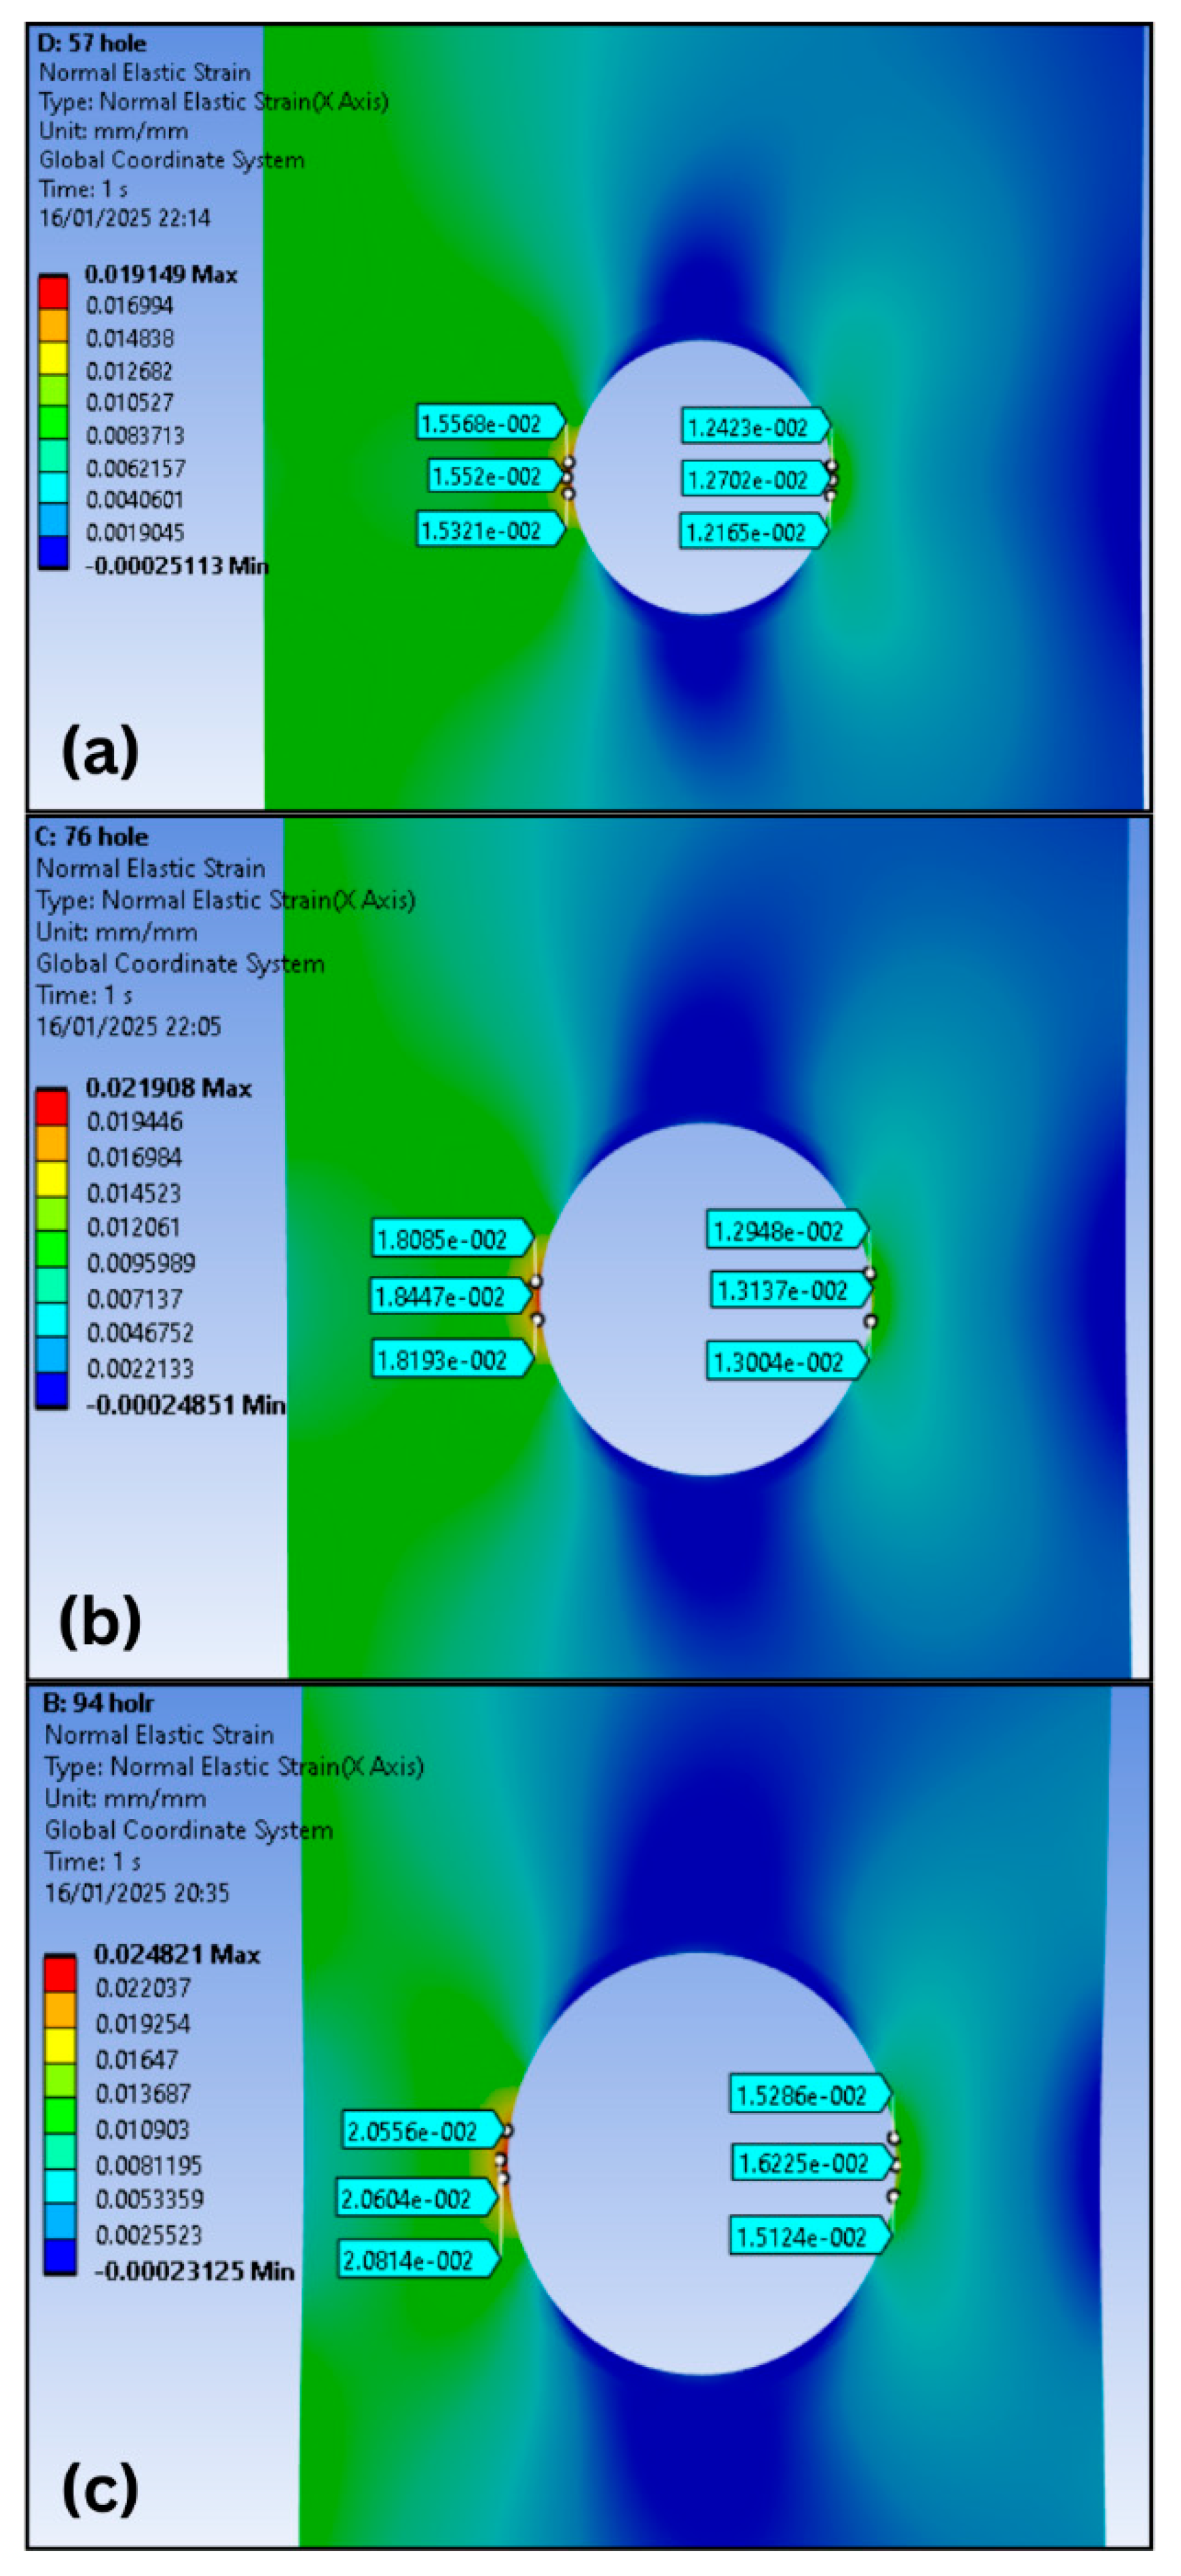
  • It was possible to understand that, for axial load conditions, the stress concentration factor was consistent, as the results from the DIC, FEA, and Whitney–Nuismer methods showed very close values, with errors ranging from 0.42% to 5.25% (Table 9). Furthermore, by analyzing the strain fields generated by DIC (Figure 10, Figure 11 and Figure 12) and FEA (Figure 13), it is possible to see that they are very similar, generating symmetrical strain fields.
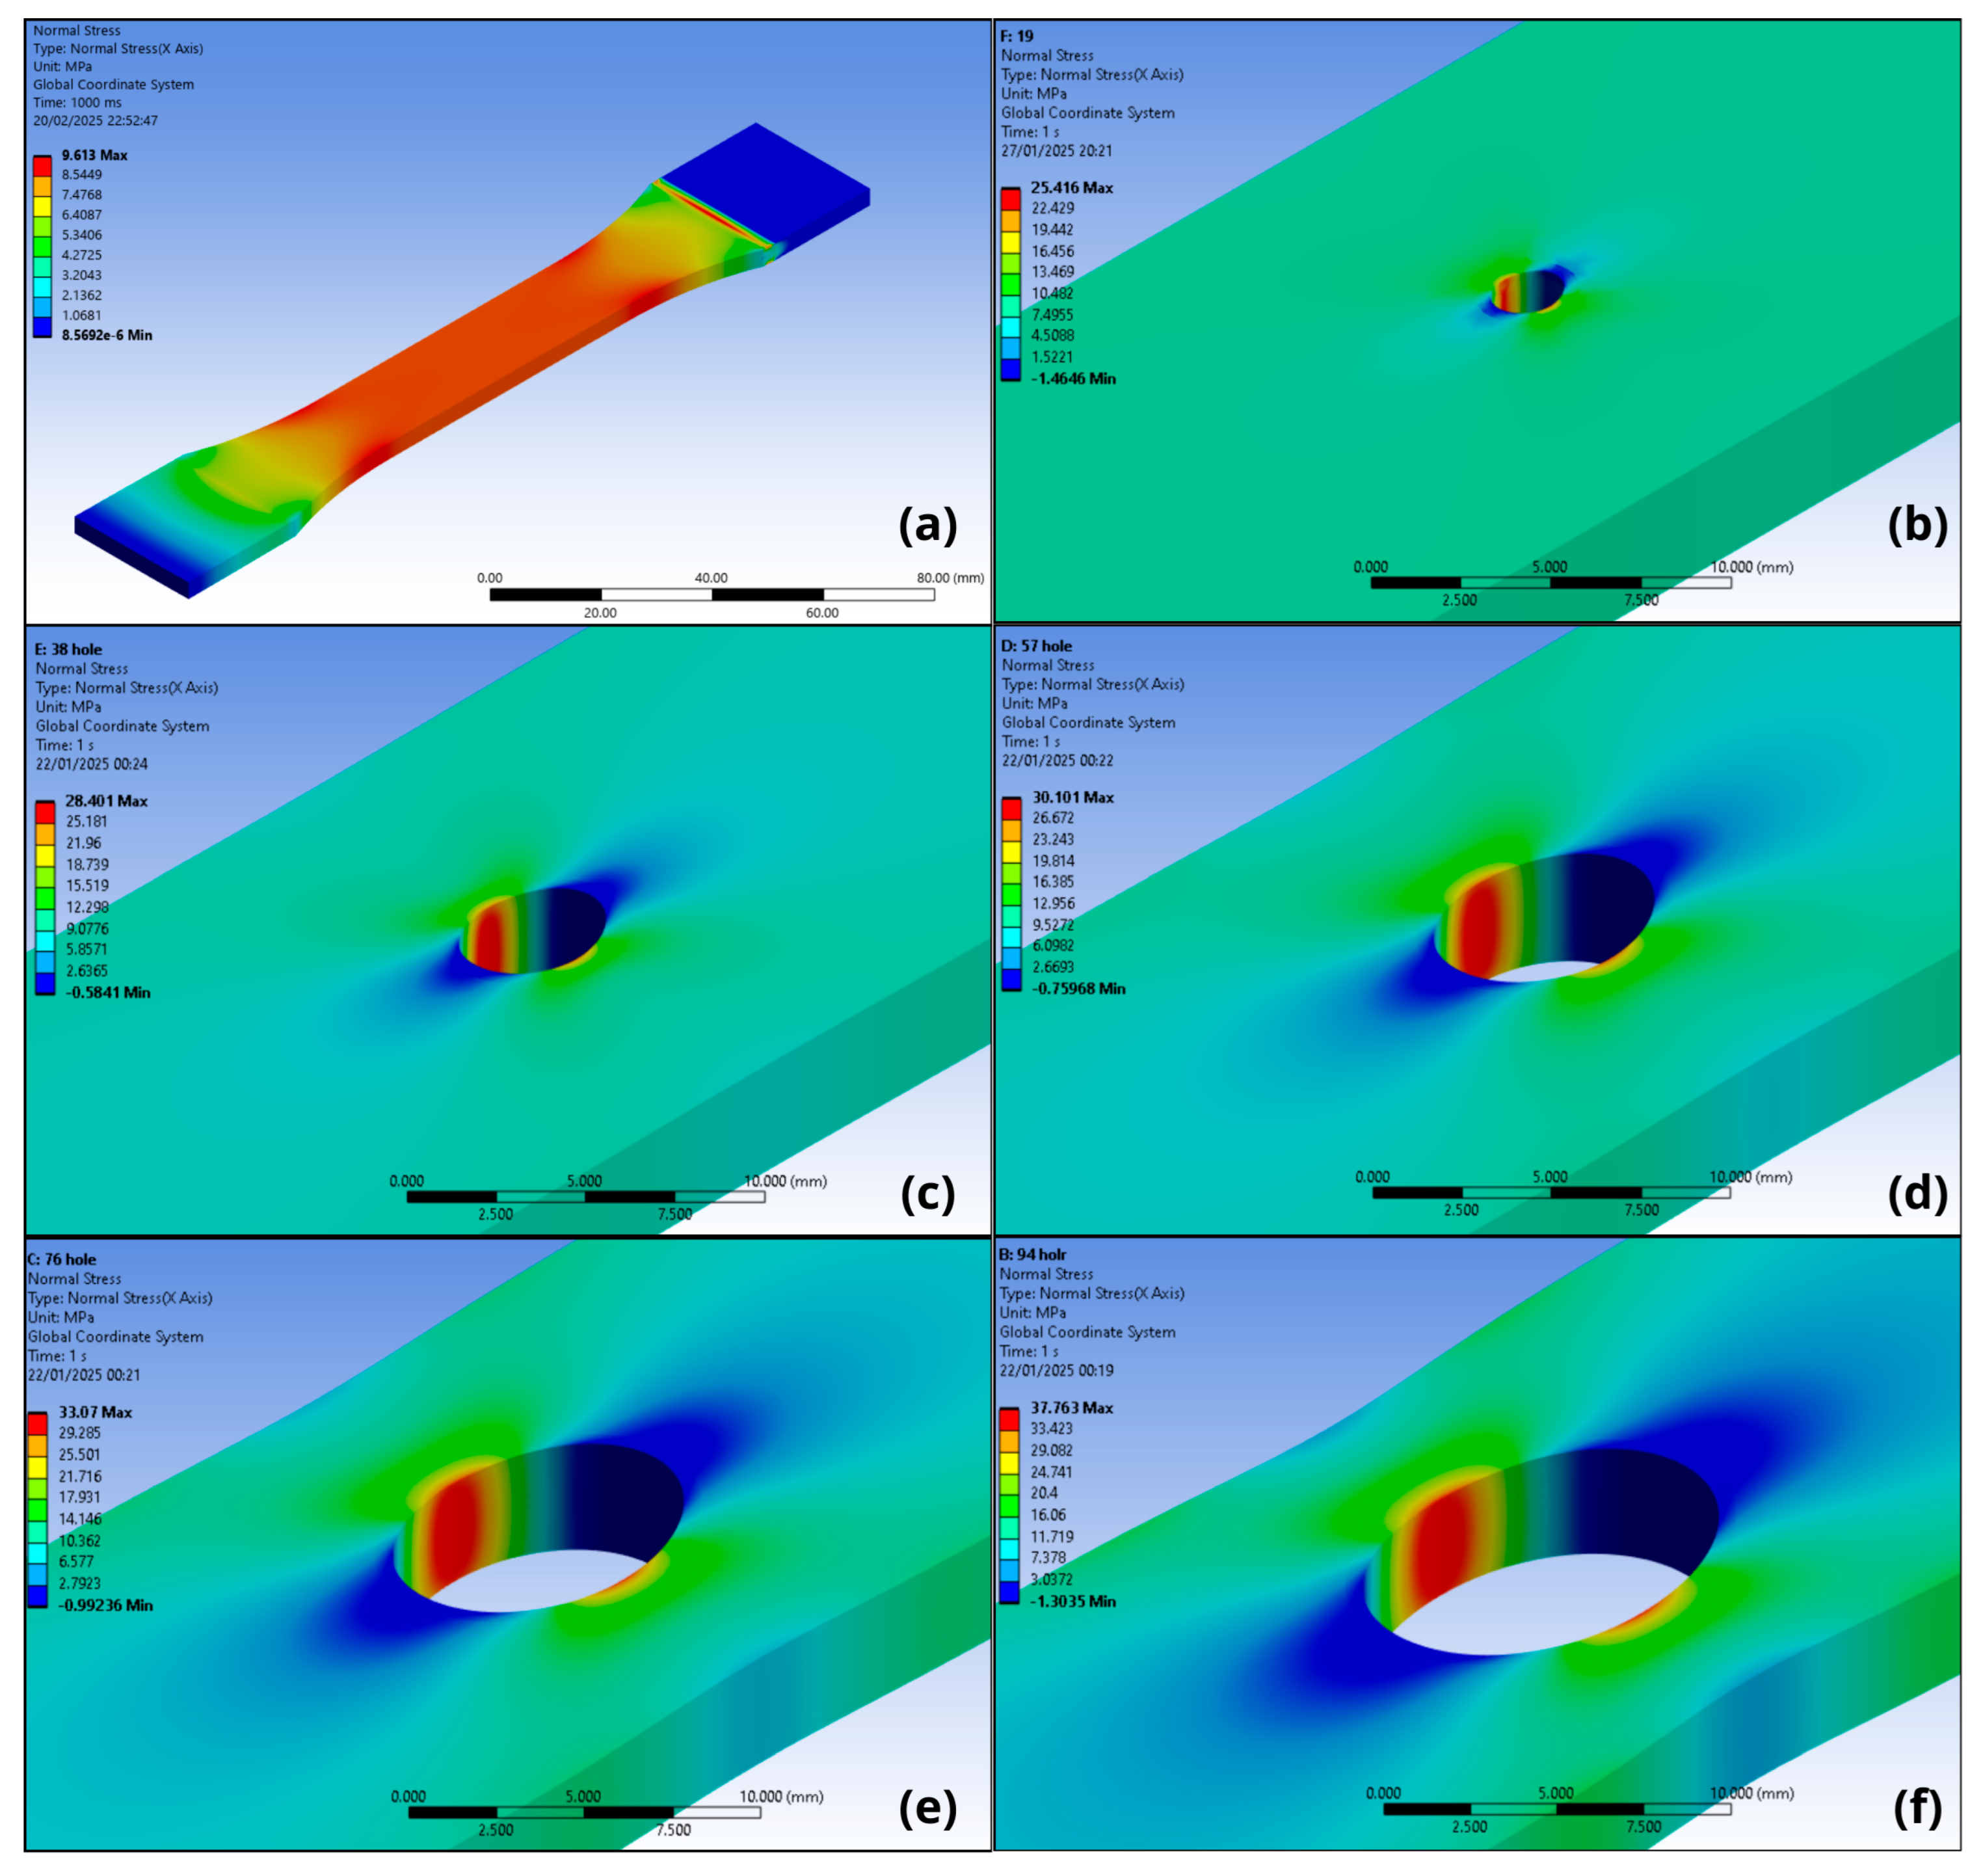
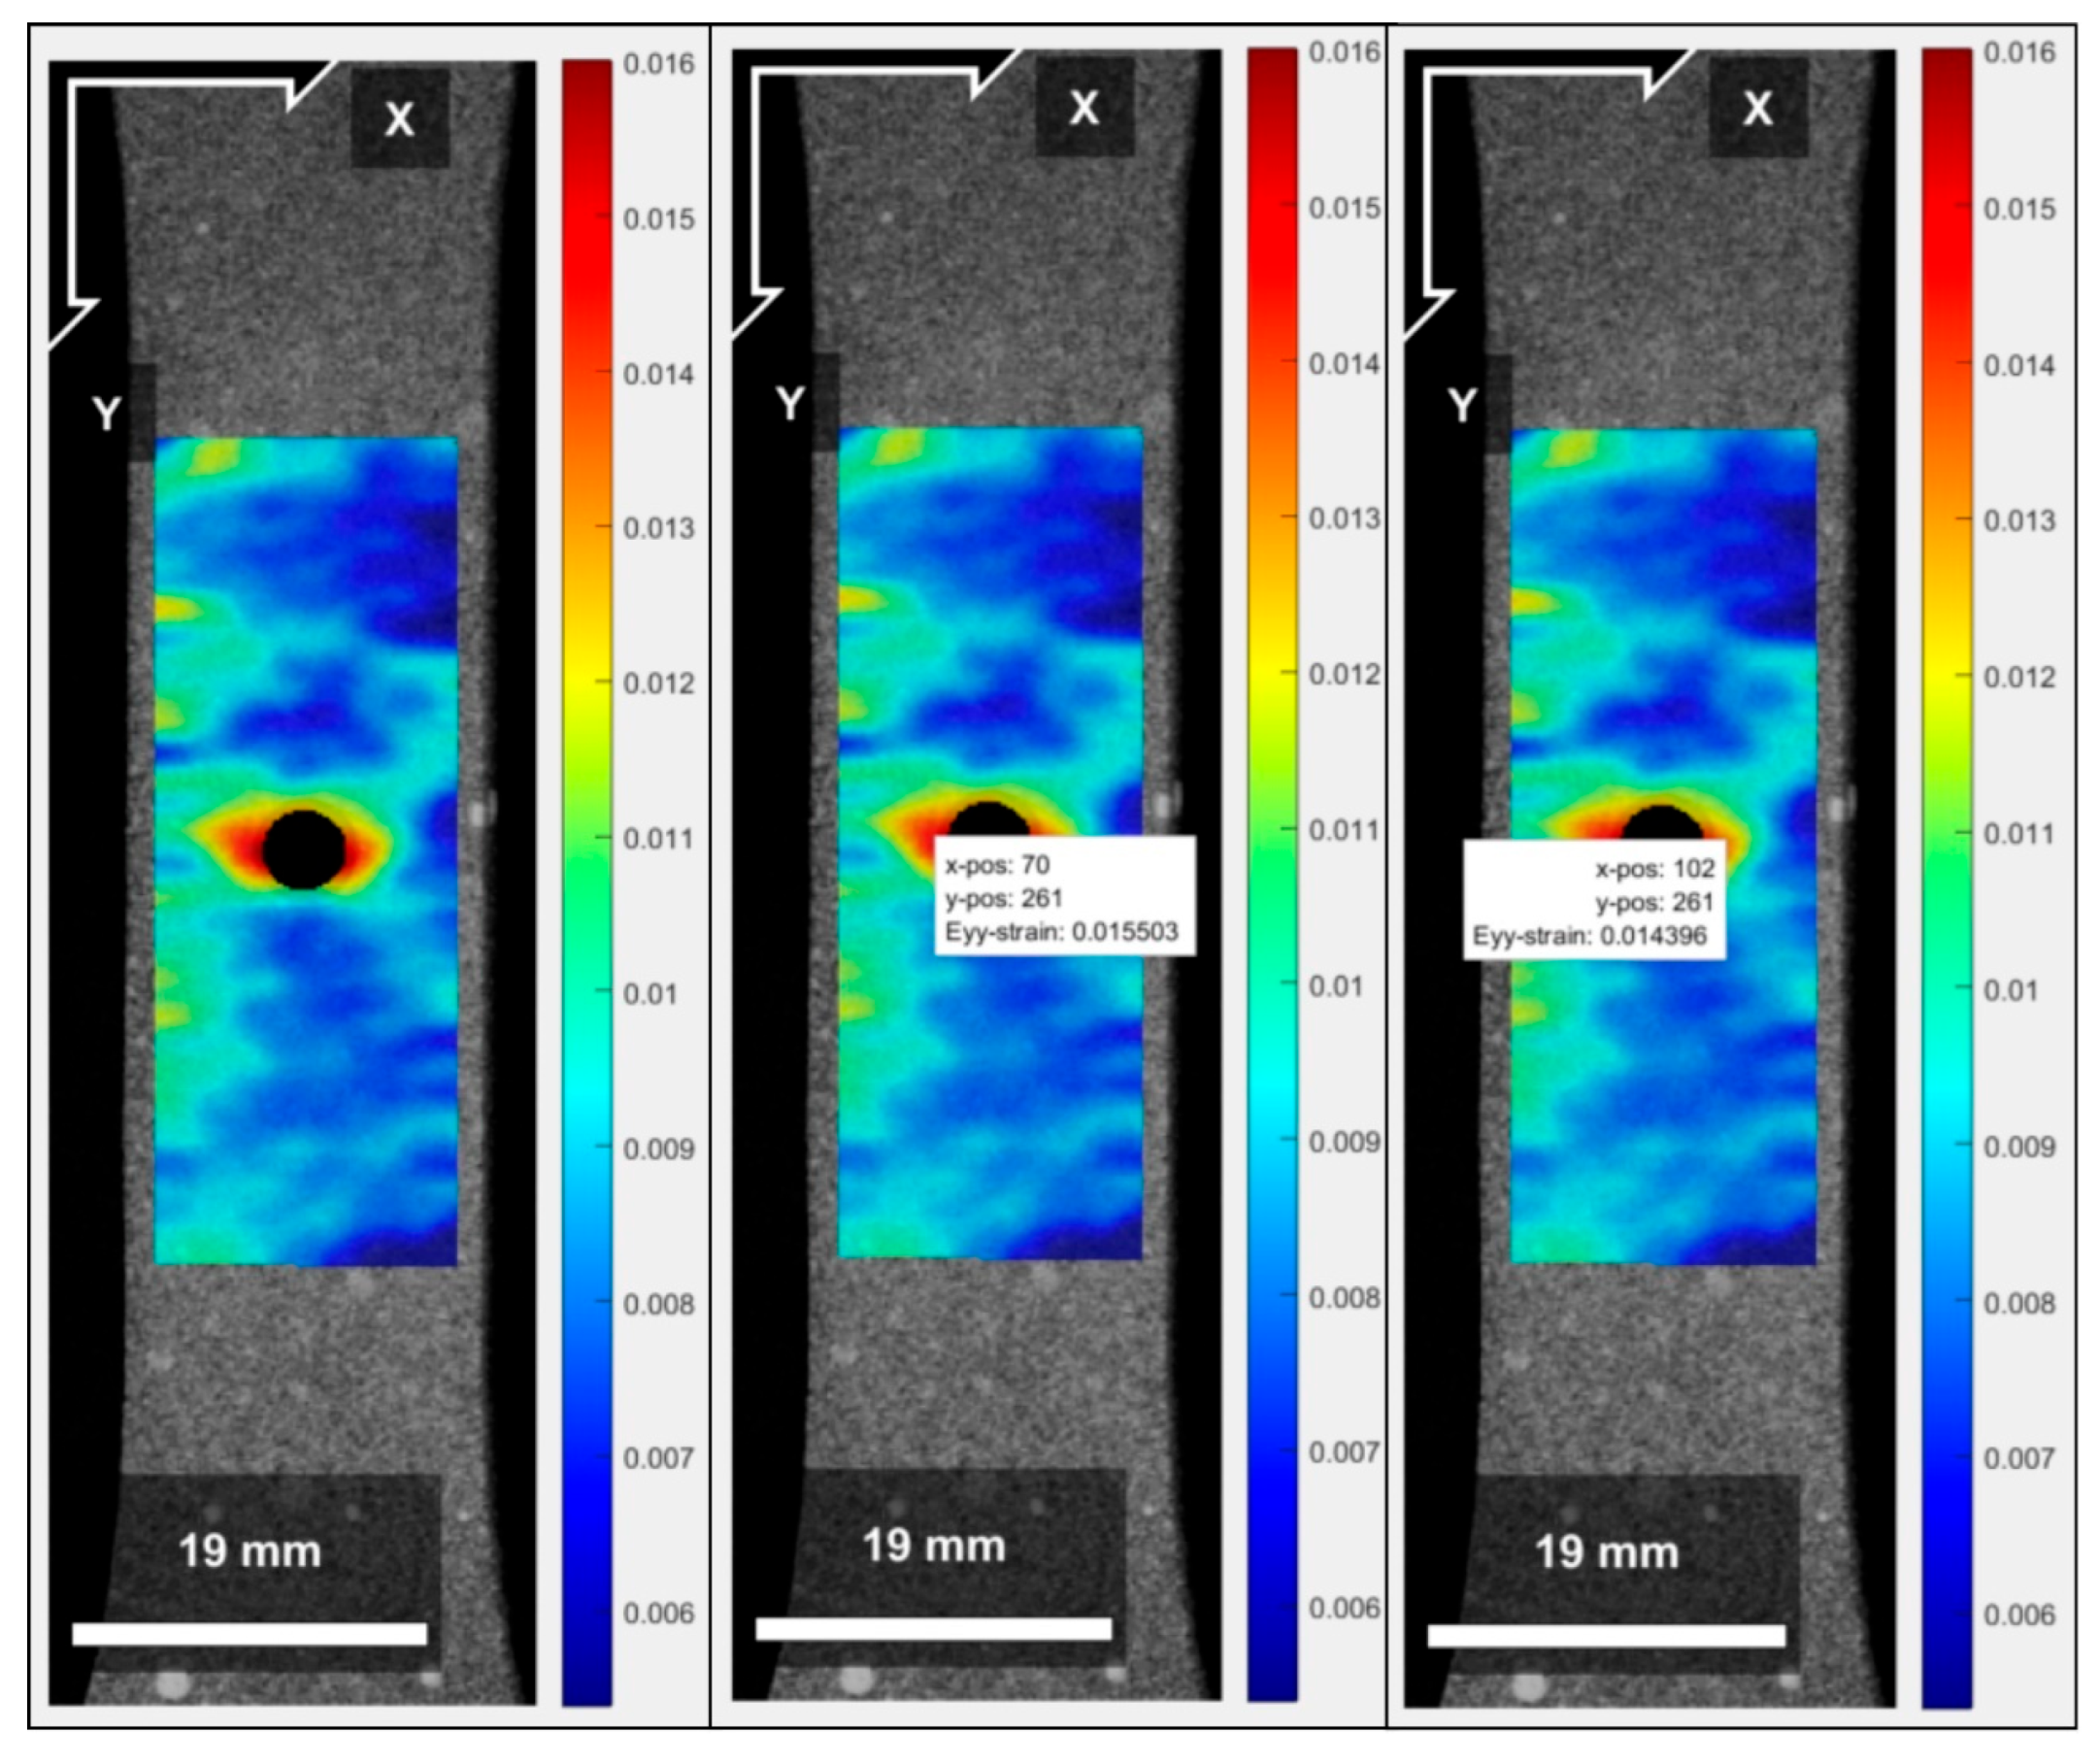
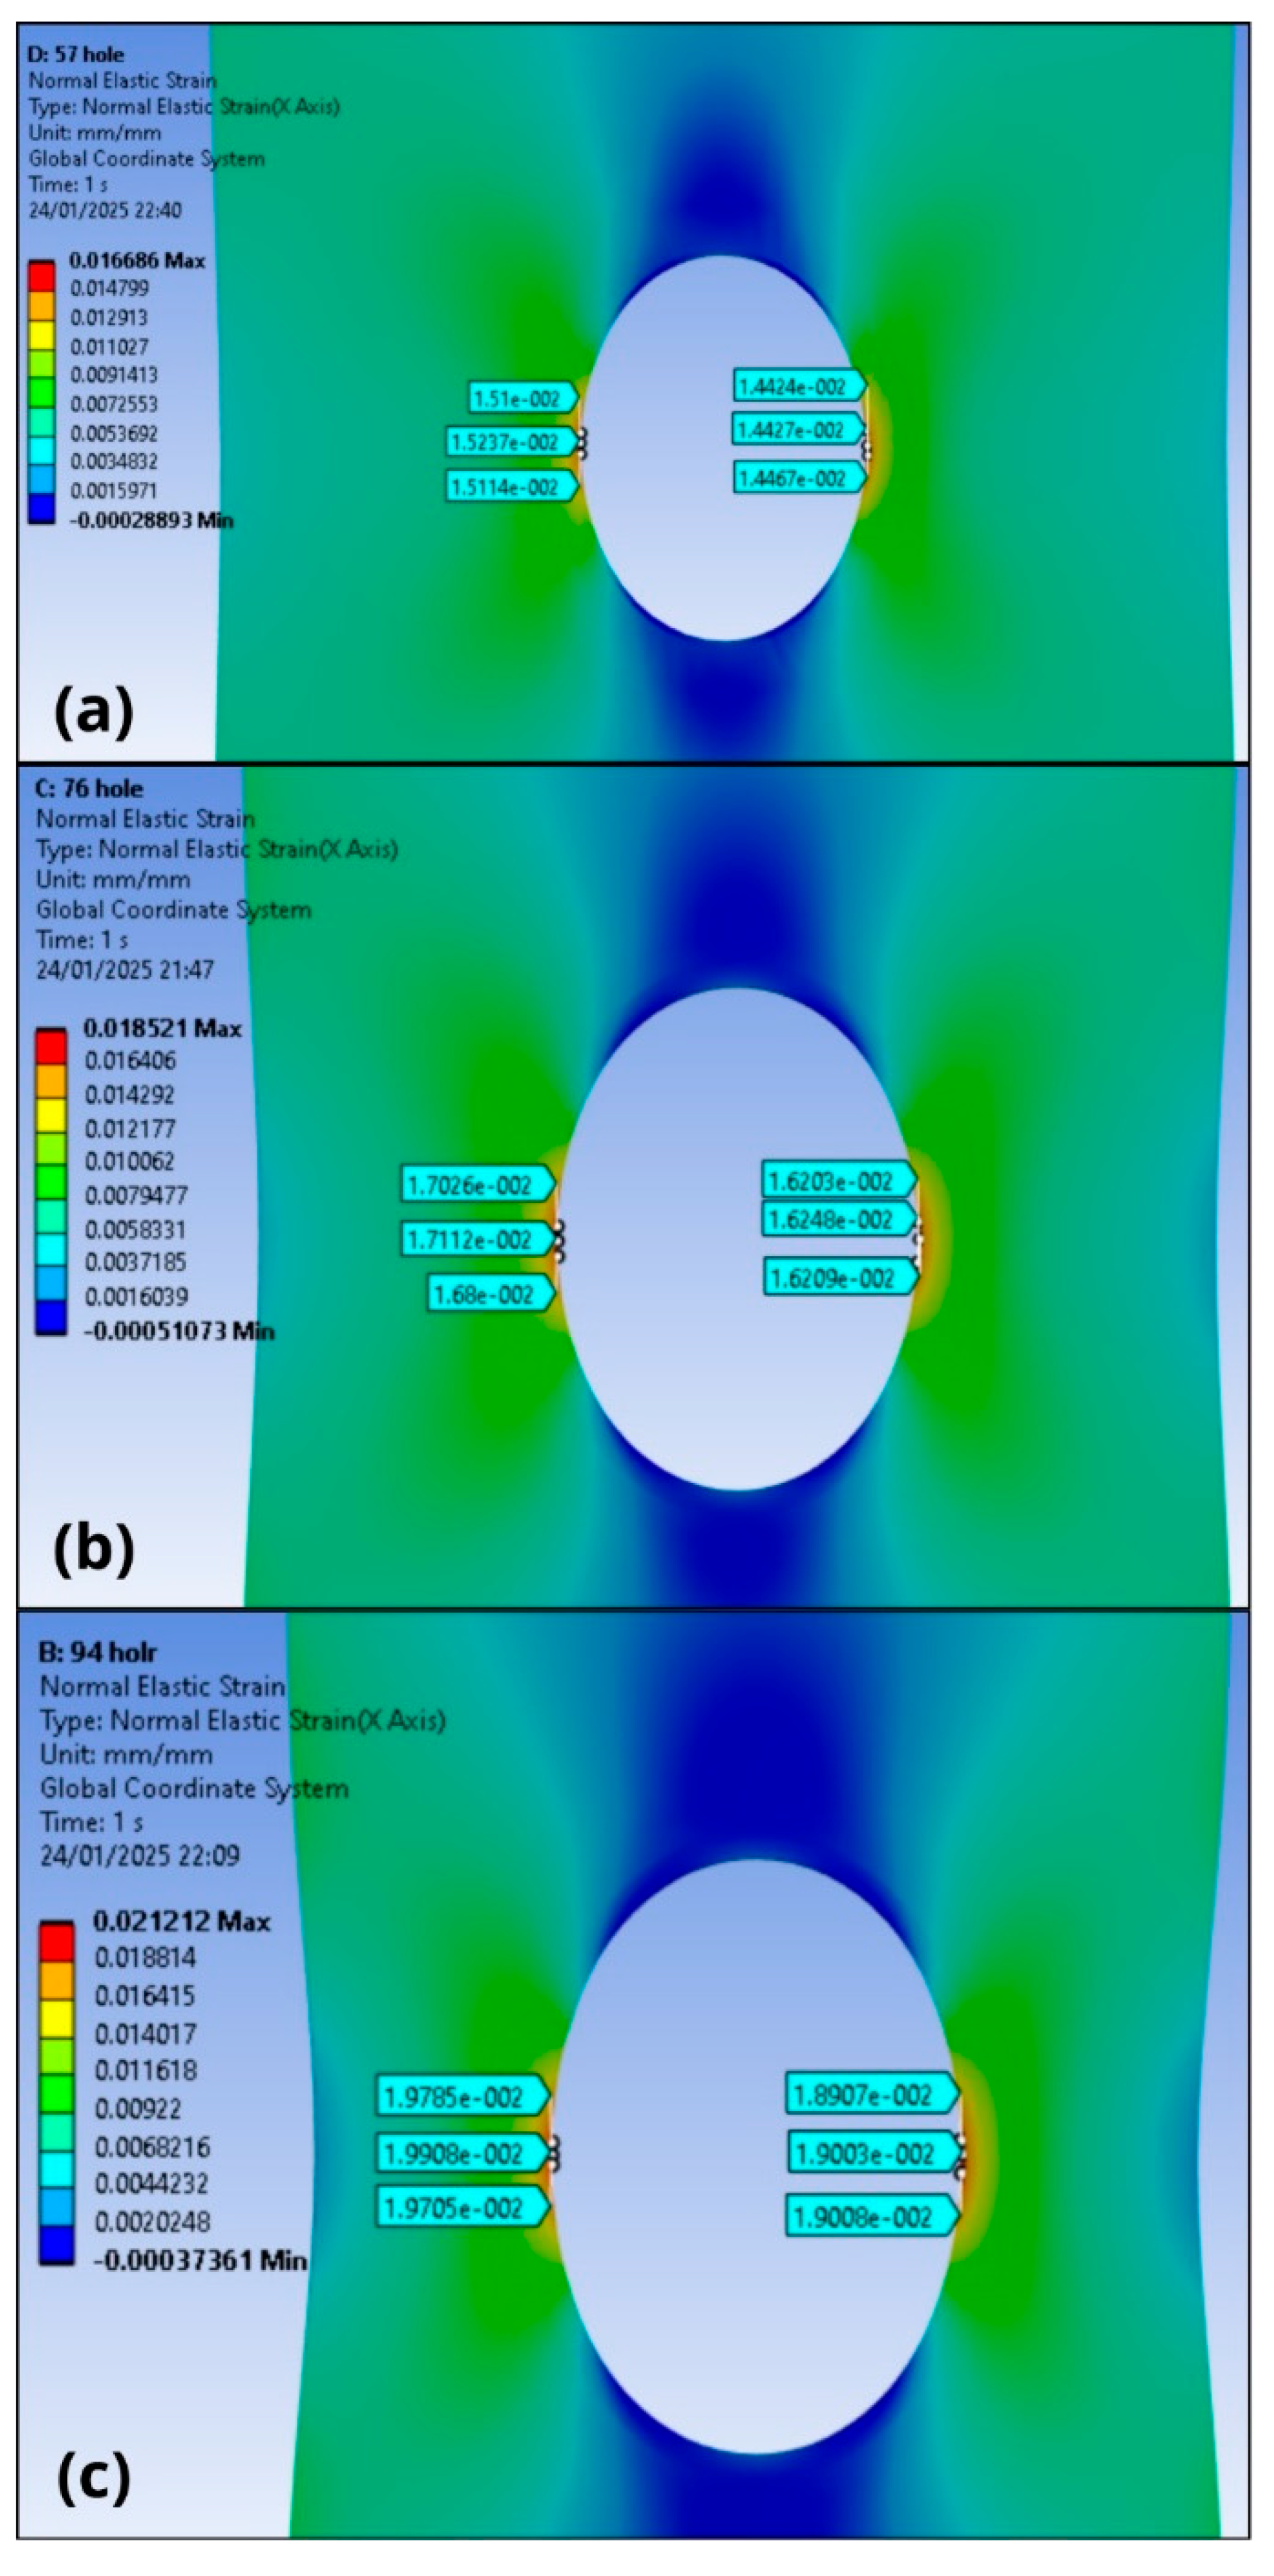
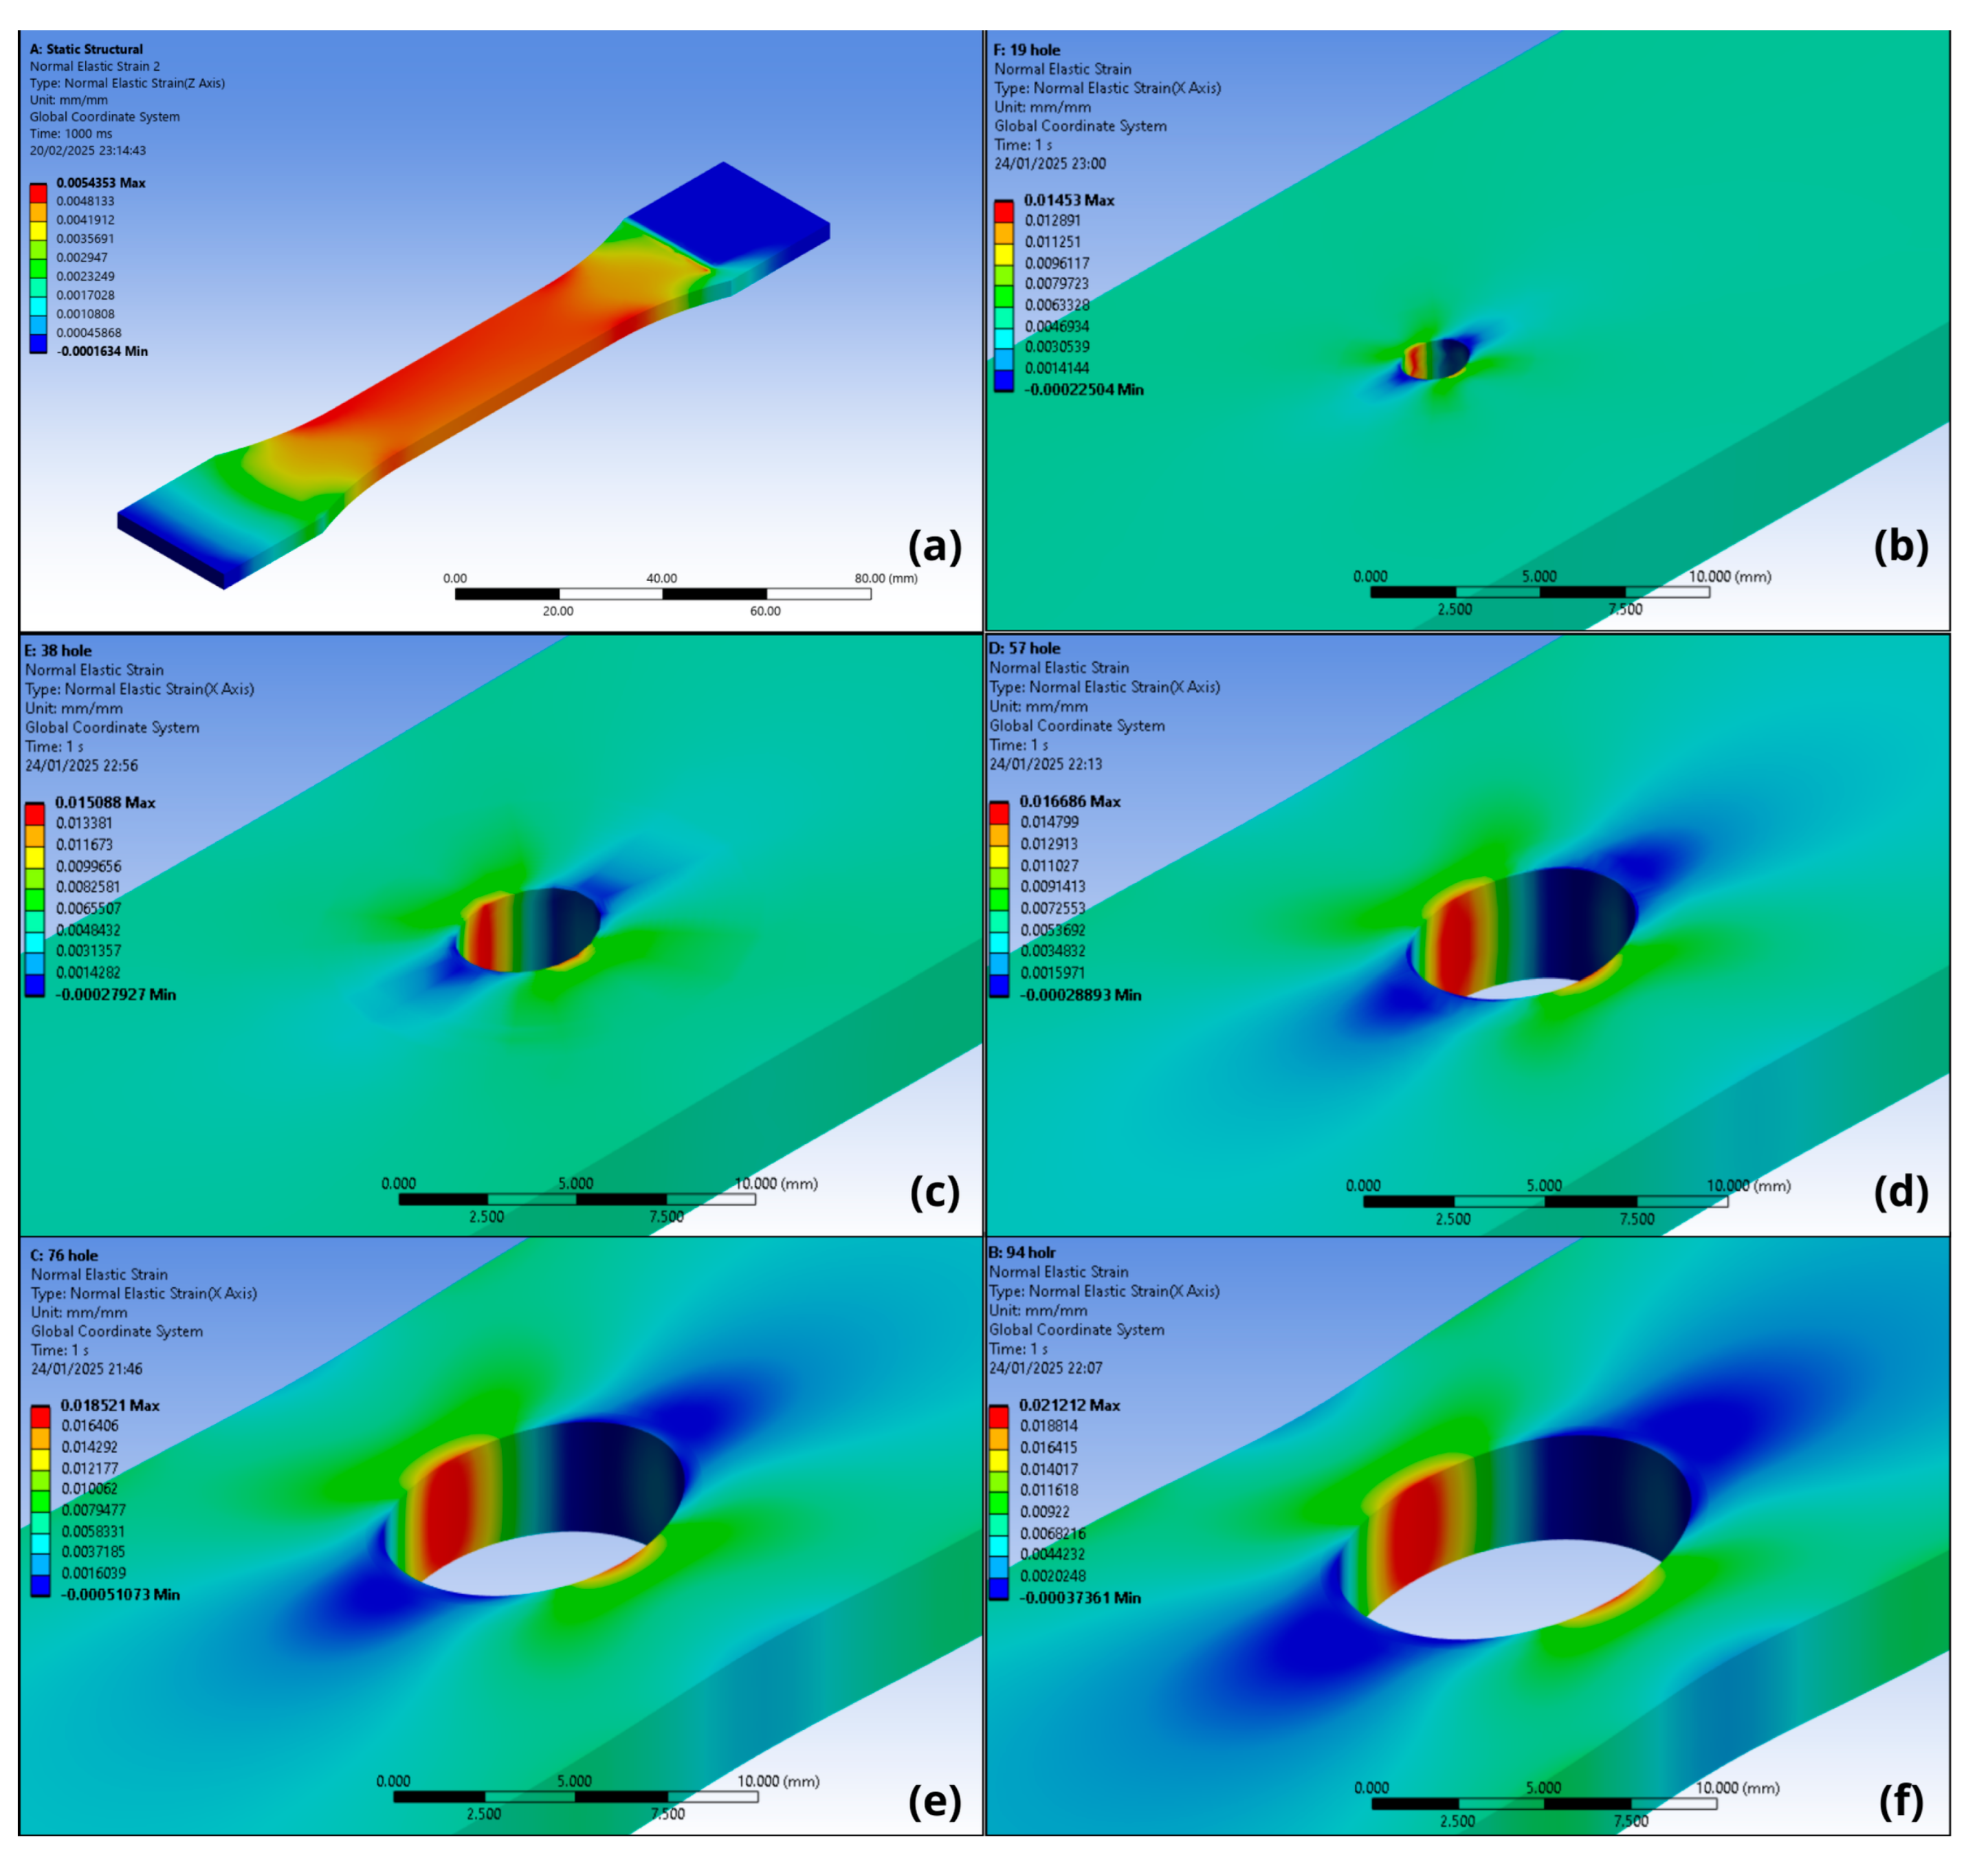
  • For the eccentric load condition, comparing the figures generated by the DIC analysis (Figure 17, Figure 18 and Figure 19) and the FEA analysis (Figure 20), it can be seen that the stress fields are similar, and the restraint imposed by the clamp minimized the bending moment effect caused by the eccentric load, generating small differences when analyzing the strain on the left and right sides. The maximum error of 6.9% for the left side (Table 11) and 0.3% for the right side (Table 12) in the FEA and DIC comparison demonstrate that the simulation model represents what occurred in the test.
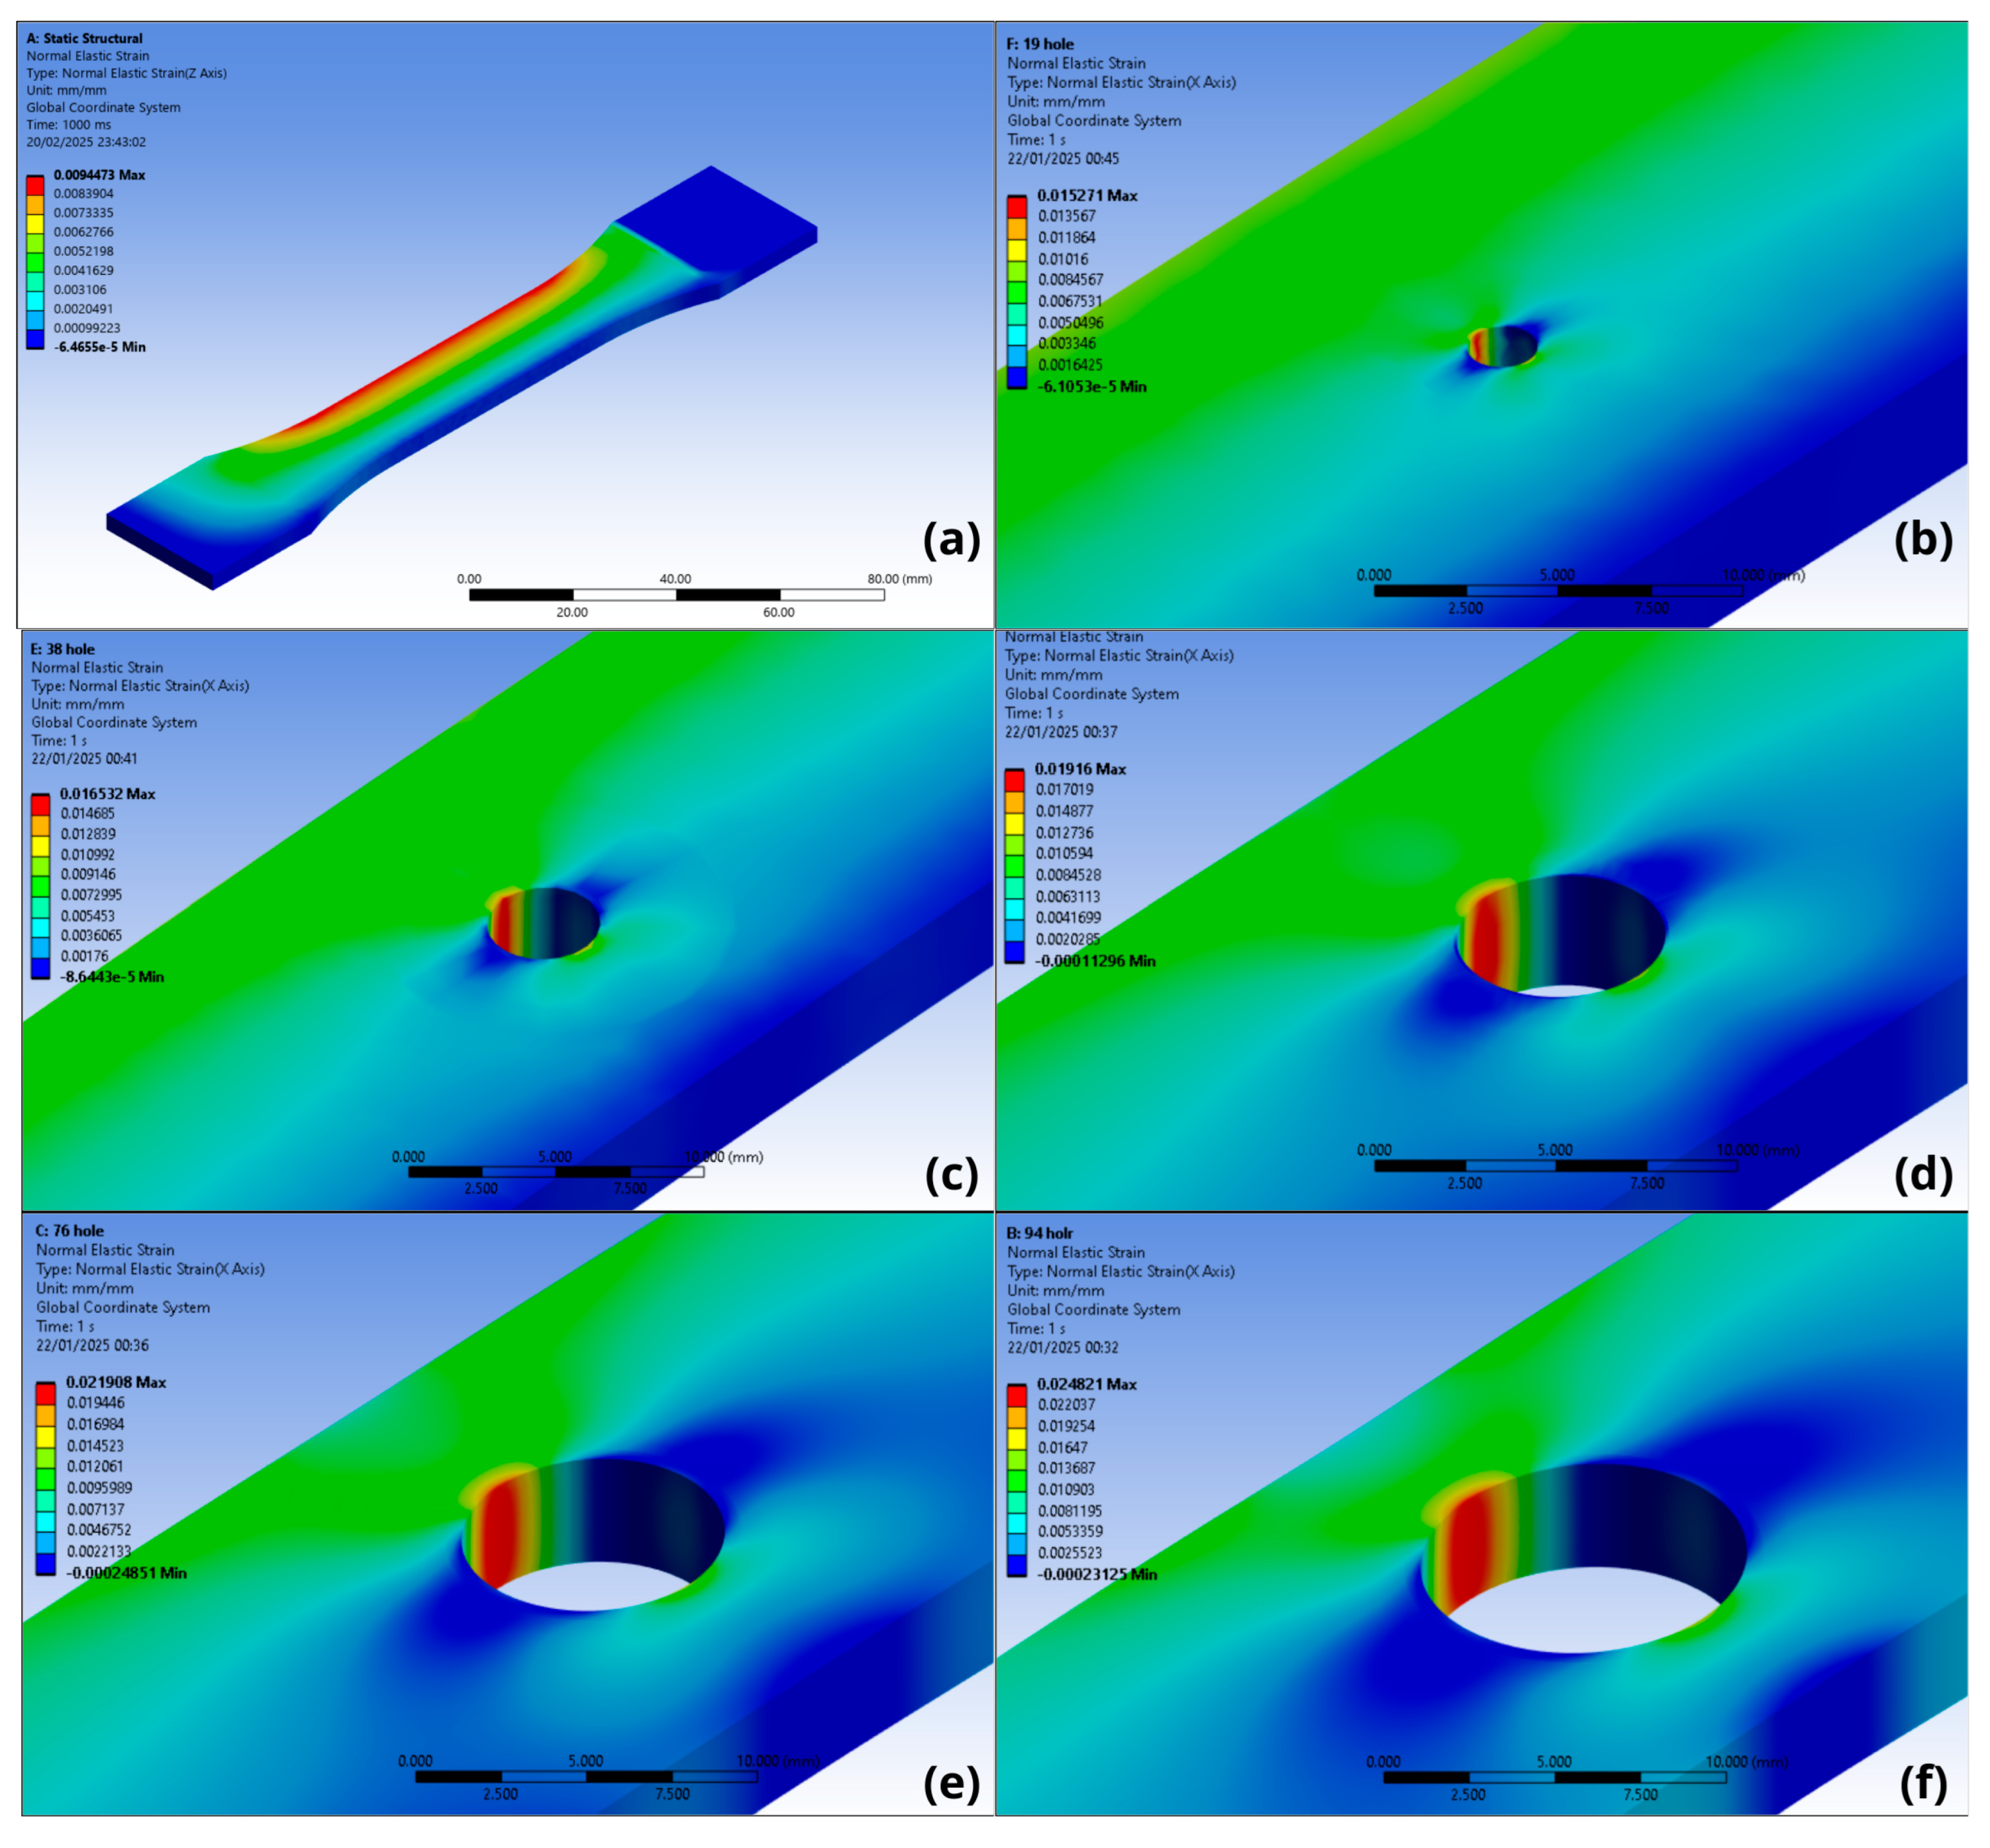
  • For the analysis of the specimens using FEA without considering the clamp restriction effect, the combined load generated the effect of tensile and bending due to the bending moment. The moment acted freely, generating very expressive strain fields (Figure 23), which do not correspond to the strain fields generated by the experimental analysis (Figure 17, Figure 18 and Figure 19). The results show a relative error of around 20% presented in Table 15 and Table 16, comparing the strain from the FEA and DIC analysis for the right and left sides, indicating that this analysis does not reproduce what occurred in the test.
  • The consistent results from the analysis of specimens subjected to axial loads demonstrate the quality of the method used. Furthermore, for the eccentric load analysis on the test specimens, it became evident that it is necessary to consider the restraint effect generated by the clamp.
  • The results reinforce the robustness of the applied methods and present data on the mechanical characteristics of photopolymeric resins printed on mSLA devices, which are scarce in the literature. Understanding the mechanical behavior associated with notches in specimens printed by mSLA is essential to expanding the application of the method and making it viable for industrial applications, as it is possible to avoid material waste, improve part design, and ensure the safety of the developed product. To evaluate ways to improve the geometry of the part, as well as the impact of voids in this material, another study is in development, aiming to investigate the influence of the degree and type of void geometry applied to photopolymeric resin parts manufactured by this technique.

Author Contributions

Conceptualization, methodology, validation, C.C.P.; supervision F.d.A.S. and E.S.G. All authors have read and agreed to the published version of the manuscript.

Funding

This research received no external funding.

Institutional Review Board Statement

Not Applicable.

Informed Consent Statement

Not Applicable.

Data Availability Statement

The original contributions presented in this study are included in the article. Further inquiries can be directed to the corresponding author.

Acknowledgments

This work was supported in part by “São Paulo State University (UNESP), School of Engineering and Sciences, Guaratinguetá”.

Conflicts of Interest

The authors declare no conflicts of interest.

Abbreviations

The following abbreviations are used in this manuscript:
FEAFinite Element Analysis
DICDigital Image Correlation
mSLAMasked Stereolithography
UVUltraviolet
LEDLight-Emitting Diode
LCDLiquid Crystal Display
srPETSelf-Reinforced Polyethylene Terephthalate
PMMAPolymethyl Methacrylate
SCFStress Concentration Factor
PLAPolylactic Acid
FDMFused Deposition Modeling
CADComputer-Aided Design
STLStereolithography
ASTMAmerican Society for Testing and Materials
ROIRegion of Interest

References

  1. Kanishka, K.; Acherjee, B. Revolutionizing manufacturing: A comprehensive overview of additive manufacturing processes, materials, developments, and challenges. J. Manuf. Process. 2023, 107, 574–619. [Google Scholar] [CrossRef]
  2. Tamez, M.B.A.; Taha, I. A review of additive manufacturing technologies and markets for thermosetting resins and their potential for carbon fiber integration. Addit. Manuf. 2021, 37, 101748. [Google Scholar] [CrossRef]
  3. Wang, E.; Yang, F.; Shen, X.; Li, Z.; Yang, X.; Zhang, X.; Peng, W. Investigation and Optimization of the Impact of Printing Orientation on Mechanical Properties of Resin Sample in the Low-Force Stereolithography Additive Manufacturing. Materials 2022, 15, 6743. [Google Scholar] [CrossRef]
  4. Junk, S.; Bär, F. Design guidelines for Additive Manufacturing using Masked Stereolithography mSLA. Procedia CIRP 2023, 119, 1122–1127. [Google Scholar] [CrossRef]
  5. Valizadeh, I.; Weeger, O. Parametric visco-hyperelastic constitutive modeling of functionally graded 3D printed polymers. Int. J. Mech. Sci. 2022, 226, 107335. [Google Scholar] [CrossRef]
  6. Rahman, M.A.; Mohiv, A.; Tauhiduzzaman, M.; Kharshiduzzaman, M.; Khan, M.E.; Haque, M.R.; Bhuiyan, M.S. Tensile Properties of 3D-Printed Jute-Reinforced Composites via Stereolithography. Appl. Mech. 2024, 5, 773–785. [Google Scholar] [CrossRef]
  7. Riccio, C.; Civera, M.; Grimaldo Ruiz, O.; Pedullà, P.; Rodriguez Reinoso, M.; Tommasi, G.; Vollaro, M.; Burgio, V.; Surace, C. Effects of Curing on Photosensitive Resins in SLA Additive Manufacturing. Appl. Mech. 2022, 2, 942–955, Erratum in Appl. Mech. 2022, 3, 123–124. [Google Scholar] [CrossRef]
  8. Nowacki, B.; Kowol, P.; Kozioł, M.; Olesik, P.; Wieczorek, J.; Wacławiak, K. Effect of Post-Process Curing and Washing Time on Mechanical Properties of mSLA Printouts. Materials 2021, 14, 4856. [Google Scholar] [CrossRef]
  9. Minin, A.; Blatov, I.; Rodionov, S.; Zubarev, I. Development of a cell co-cultivation system based on protein magnetic membranes, using a MSLA 3D printer. Bioprinting 2021, 23, e00150. [Google Scholar] [CrossRef]
  10. Andreucci, C.A.; Fonseca, E.M.M.; Jorge, R.N. Biomechanics of a Novel 3D Mandibular Osteotomy Design. Designs 2024, 8, 57. [Google Scholar] [CrossRef]
  11. Braszkiewicz, M. Manufacturing of mechanical elements with properties of metamaterials using 3D printing technology. MATEC Web Conf. 2021, 338, 01002. [Google Scholar] [CrossRef]
  12. Kumar, S.; Bhushan, P.; Pandey, M.; Bhattacharya, S. Additive manufacturing as an emerging technology for fabrication of microelectromechanical systems (MEMS). J. Micromanuf. 2019, 2, 175–197. [Google Scholar] [CrossRef]
  13. Mahshid, R.; Isfahani, M.N.; Heidari-Rarani, M.; Mirkhalaf, M. Recent advances in development of additively manufactured thermosets and fiber reinforced thermosetting composites: Technologies, materials, and mechanical properties. Compos. Part A Appl. Sci. Manuf. 2023, 171, 107584. [Google Scholar] [CrossRef]
  14. Pyl, L.; Kalteremidou, K.-A.; Van Hemelrijck, D. Exploration of the design freedom of 3D printed continuous fibre-reinforced polymers in open-hole tensile strength tests. Compos. Sci. Technol. 2019, 171, 135–151. [Google Scholar] [CrossRef]
  15. de Morais, A.B. Open-hole tensile strength of quasi-isotropic laminates. Compos. Sci. Technol. 2000, 60, 1997–2004. [Google Scholar] [CrossRef]
  16. Whitney, J.M.; Nuismer, R.J. Stress Fracture Criteria for Laminated Composites Containing Stress Concentrations. J. Compos. Mater. 1974, 8, 253–265. [Google Scholar] [CrossRef]
  17. Mohamed Makki, M.; Chokri, B. Experimental, analytical, and finite element study of stress concentration factors for composite materials. J. Compos. Mater. 2017, 51, 1583–1594. [Google Scholar] [CrossRef]
  18. Wu, C.-M.; Kumar, S.; Lin, P.-C.; Chen, J.-C. Strain and stress concentration of ductile composites in full-range deformation by digital image correlation. Mech. Adv. Mater. Struct. 2023, 30, 3817–3825. [Google Scholar] [CrossRef]
  19. Teixeira Pinto, J.M.; Touchard, F.; Castagnet, S.; Nadot-Martin, C.; Mellier, D. DIC Strain Measurements at the Micro-Scale in a Semi-Crystalline Polymer. Exp. Mech. 2013, 53, 1311–1321. [Google Scholar] [CrossRef]
  20. Belloni, V.; Ravanelli, R.; Nascetti, A.; Di Rita, M.; Mattei, D.; Crespi, M. py2DIC: A New Free and Open Source Software for Displacement and Strain Measurements in the Field of Experimental Mechanics. Sensors 2019, 19, 3832. [Google Scholar] [CrossRef]
  21. Arabul, E.; Lunt, A.J.G. A Novel Low-Cost DIC-Based Residual Stress Measurement Device. Appl. Sci. 2022, 12, 7233. [Google Scholar] [CrossRef]
  22. Saleh, M.N.; Wang, Y.; Yudhanto, A.; Joesbury, A.; Potluri, P.; Lubineau, G.; Soutis, C. Investigating the Potential of Using Off-Axis 3D Woven Composites in Composite Joints’ Applications. Appl. Compos. Mater. 2017, 24, 377–396. [Google Scholar] [CrossRef]
  23. Aidi, B.; Philen, M.K.; Case, S.W. Progressive damage assessment of centrally notched composite specimens in fatigue. Compos. Part A Appl. Sci. Manuf. 2015, 74, 47–59. [Google Scholar] [CrossRef]
  24. Luo, J.; Luo, Q.; Zhang, G.; Li, Q.; Sun, G. On strain rate and temperature dependent mechanical properties and constitutive models for additively manufactured polylactic acid (PLA) materials. Thin-Walled Struct. 2022, 179, 109624. [Google Scholar] [CrossRef]
  25. Goodarzi Hosseinabadi, H.; Bagheri, R.; Avila Gray, L.; Altstädt, V.; Drechsler, K. Plasticity in polymeric honeycombs made by photo-polymerization and nozzle based 3D-printing. Polym. Test. 2017, 63, 163–167. [Google Scholar] [CrossRef]
  26. Tanabi, H. Investigation of the shear properties of 3D printed short carbon fiber-reinforced thermoplastic composites. J. Thermoplast. Compos. Mater. 2022, 35, 2177–2193. [Google Scholar] [CrossRef]
  27. Tang, C.; Liu, J.; Yang, Y.; Liu, Y.; Jiang, S.; Hao, W. Effect of process parameters on mechanical properties of 3D printed PLA lattice structures. Compos. Part C Open Access 2020, 3, 100076. [Google Scholar] [CrossRef]
  28. Volgin, O.; Shishkovsky, I.V. Material modelling of FDM printed PLA part. Eng. Solid Mech. 2021, 9, 153–160. [Google Scholar] [CrossRef]
  29. Falta, J.; Yilmaz, E.Y. Strain-Rate Dependent Compressive Properties of Inverted Honeycomb Lattice and Bulk Cylindrical Samples 3D Printed by Msla Method. In Proceedings of the Engineering Mechanics International Conference, Milovy, Czech Republic, 9–12 May 2022; Fischer, C., Náprstek, J., Eds.; Volume 27/28, pp. 93–96. [Google Scholar] [CrossRef]
  30. Oliveira, G.C.R.d.; Rosario de Oliveira, V.A.; Alvarado Silva, C.A.; Guidi, E.S.; Silva, F.d.A. Modeling the Stress Field in MSLA-Fabricated Photosensitive Resin Components: A Combined Experimental and Numerical Approach. Modelling 2025, 6, 3. [Google Scholar] [CrossRef]
  31. Beleza, S.C.A. Medição de Deformação Através da Técnica de Correlação Digital de Imagem. Master’s Thesis, Universidade Nova Liboa, Lisboa, Portugal, 2017. [Google Scholar]
  32. ANSYS, Inc. Element Reference; ANSYS, Inc.: Canonsburg, PA, USA, 2009. [Google Scholar]
Figure 1. (a) Elegoo printer. (b) Washing chamber. (c) UV light chamber.
Applmech 06 00021 g001
Figure 2. Test environment with camera and testing machine that were used.
Applmech 06 00021 g002
Figure 3. Two-dimensional representation of the test specimen with dimensions in mm.
Applmech 06 00021 g003
Figure 4. The average stress–strain curve of the specimens.
Applmech 06 00021 g004
Figure 5. Defined ROI for strain analysis in Ncorr.
Applmech 06 00021 g005
Figure 6. Test specimen model with mesh.
Applmech 06 00021 g006
Figure 7. Boundary conditions of the test specimen for axial load simulation.
Applmech 06 00021 g007
Figure 8. Boundary conditions of the test specimen for eccentric load simulation considering the grip restriction.
Applmech 06 00021 g008
Figure 9. Boundary conditions of the specimen for eccentric load simulation disregarding the grip restriction.
Applmech 06 00021 g009
Figure 10. Strain field (mm/mm) obtained by DIC for the d/w ratio = 0.3. The X and Y axes represent the dimensionless position relative to the image data matrix.
Applmech 06 00021 g010
Figure 11. Strain field (mm/mm) obtained by DIC for the d/w ratio = 0.4. The X and Y axes represent the dimensionless position relative to the image data matrix.
Applmech 06 00021 g011
Figure 12. Strain field (mm/mm) obtained by DIC for the d/w ratio = 0.5. The X and Y axes represent the dimensionless position relative to the image data matrix.
Applmech 06 00021 g012
Figure 13. Strain fields obtained by FEA with data around the hole of specimens subjected to axial load for (a) d/w = 0.3; (b) d/w = 0.4; and (c) d/w = 0.5.
Applmech 06 00021 g013
Figure 14. Strain field obtained by FEA for specimens subjected to axial load for (a) without hole; (b) d/w = 0.1; (c) d/w = 0.2; (d) d/w = 0.3; (e) d/w = 0.4; and (f) d/w = 0.5.
Applmech 06 00021 g014
Figure 15. Stress field obtained by FEA for specimens subjected to axial load for (a) without hole; (b) d/w = 0.1; (c) d/w = 0.2; (d) d/w = 0.3; (e) d/w = 0.4; and (f) d/w = 0.5.
Applmech 06 00021 g015
Figure 16. Comparative graph of the Whitney–Nuismer, FEA, and DIC methods for specimen subjected to axial load.
Applmech 06 00021 g016
Figure 17. Diagrams of the strain fields (mm/mm) generated by the DIC method for the d/w ratio of 0.3. The X and Y axes represent the dimensionless position relative to the image data matrix.
Applmech 06 00021 g017
Figure 18. Diagrams of the strain fields (mm/mm) generated by the DIC method for the d/w ratio of 0.4. The X and Y axes represent the dimensionless position relative to the image data matrix.
Applmech 06 00021 g018
Figure 19. Diagrams of the strain fields (mm/mm) generated by the DIC method for the d/w ratio of 0.5. The X and Y axes represent the dimensionless position relative to the image data matrix.
Applmech 06 00021 g019
Figure 20. Strain fields obtained by FEA with data around the hole of specimens subjected to eccentric loads considering the effect of the clamp restriction for (a) d/w = 0.3; (b) d/w = 0.4; and (c) d/w = 0.5.
Applmech 06 00021 g020
Figure 21. Strain field obtained by FEA for specimens subjected to eccentric load considering the effect of the clamp restriction for (a) without hole; (b) d/w = 0.1; (c) d/w = 0.2; (d) d/w = 0.3; (e) d/w = 0.4; and (f) d/w = 0.5.
Applmech 06 00021 g021
Figure 22. Stress field obtained by FEA for specimens subjected to eccentric load considering the effect of clamp restriction for (a) without hole; (b) d/w = 0.1; (c) d/w = 0.2; (d) d/w = 0.3; (e) d/w = 0.4; and (f) d/w = 0.5.
Applmech 06 00021 g022
Figure 23. Strain field obtained by FEA for specimens subjected to eccentric load disregarding the effect of the clamp restriction for (a) without hole; (b) d/w = 0.1; (c) d/w = 0.2; (d) d/w = 0.3; (e) d/w = 0.4; and (f) d/w = 0.5.
Applmech 06 00021 g023
Figure 24. Stress field obtained by FEA for specimens subjected to eccentric load disregarding the effect of the clamp restriction for (a) without hole; (b) d/w = 0.1; (c) d/w = 0.2; (d) d/w = 0.3; (e) d/w = 0.4; and (f) d/w = 0.5.
Applmech 06 00021 g024
Figure 25. Strain fields obtained by FEA with data around the hole of specimens subjected to eccentric loads disregarding the effect of the clamp restriction for (a) d/w = 0.3; (b) d/w = 0.4; and (c) v = 0.5.
Applmech 06 00021 g025
Table 1. Resin parameters provided by supplier.
Resin ParametersValues
UV wavelength365–405 nm
Elongation at break8–15%
Density1.15–1.20 g/cm3
Tensile strength1600–1800 MPa
Viscosity140–250 MPa·s (25 °C)
Flexural modulus1500–1600 MPa
Hardness80 Shore D
Heat Deflection Temperature60–65 °C
Table 2. Selected parameters in 3D printing process.
Printing ParametersValues
Layer Height0.05 mm
Bottom Layer Count4
Exposure Time2.20 s
Bottom Exposure Time20.00 s
Transition Layer Count5
Transition TypeLinear
Transition Time Decrement2.97 s
Waiting Mode During PrintingResting time
Rest Time Before Lift0.00 s
Rest Time After Lift0.00 s
Rest Time After Retract0.50 s
Bottom Lift Distance3.00 + 4.00 mm
Lifting Distance3.00 + 4.00 mm
Bottom Retract Distance5.50 + 1.50 mm
Retract Distance5.50 + 1.50 mm
Bottom Lift Speed65.00 & 180.00 mm/min
Lifting Speed65.00 & 180.00 mm/min
Bottom Retract Speed180.00 & 65.00 mm/min
Retract Speed180.00 & 65.00 mm/min
Table 3. Diameter-to-width ratio (d/w) of the test specimens.
Diameter (mm)d/w 1
Without a hole-
1.90.1
3.80.2
5.70.3
7.60.4
9.50.5
1 Five specimens were used for each configuration studied.
Table 4. Experimental data of the five test specimens, including the strain–stress values along with their mean and standard deviation.
Strain (mm/mm)Stress (MPa)
S 01S 02S 03S 04S 05AverageSt. Deviation
0.0011.3191.0020.9061.6191.4121.2520.294
0.0023.0522.3602.5243.3913.0772.8810.456
0.0046.8926.2156.1997.0106.6966.6030.378
0.00610.4519.6969.80810.5869.99610.1620.337
Table 5. Number of elements and nodes for each structure.
Diameter (mm)d/wNumber of ElementsNumber of Nodes
Without a hole-102,69694,038
1.90.195,85321,191
3.80.294,038109,696
5.70.3102,416117,720
7.60.499,888114,876
9.50.598,240113,040
Table 6. Nominal stress results obtained by DIC for each d/w.
d/wStress (MPa)
0.327.34
0.431.21
0.536.07
Table 7. Average strain of the holes for each d/w ratio and values obtained by DIC.
d/wMax FEA (mm/mm)Average FEA Data
(mm/mm)
DIC
(mm/mm)
Error
(Max) 1 (%)
Error
(Average) 2 (%)
0.30.01660.01490.01556.62604.4390
0.40.01840.01680.01773.80405.7770
0.50.02110.01960.02052.84404.35270
1 Exact value was used by max (FEA). 2 Exact value was used by average (FEA).
Table 8. FEA analysis results of stress and strain for specimens subjected to axial load.
Diameter (mm)d/wStress (MPa)Strain (mm/mm)
Without a hole-8.5330.00485
1.90.125.4120.01352
3.80.228.4010.01544
5.70.330.1010.01663
7.60.433.0700.01842
9.50.537.7630.02111
Table 9. Results of Kt found by Whitney–Nuismer, FEA, and DIC.
Diameter (mm)d/wWhitney–NuismerFEA
(mm/mm)
Error FEA 1 (%)DIC
(mm/mm)
Error DIC 1 (%)
1.90.12.72902.68055.6438--
3.80.22.53172.66214.9003--
5.70.32.36092.46884.36962.24305.2547
7.60.42.23712.32483.77522.19381.9707
9.50.52.14422.23544.08502.13530.4185
1 Exact value was used by Whitney–Nuismer.
Table 10. Nominal stress results obtained by DIC for both sides of specimen and for each d/w.
d/wStress on the Left Side (MPa)Stress on the Right Side (MPa)
0.326.88225.463
0.430.36928.604
0.535.20033.440
Table 11. Average strain of the holes for the d/w ratios and values found by the DIC method on the left side.
d/wFEA Data (Left)
(mm/mm)
Max (FEA) (mm/mm)Average (FEA) (mm/mm)DIC
(mm/mm)
Error 1
(Max) (%)
Error 2
(Avg.) (%)
0.30.01510.01520.01510.01670.01520.01556.86802.3080
0.40.01700.01710.01680.01850.01700.01734.26571.6235
0.50.01980.01990.01910.02120.01960.02003.40372.1398
1 Exact value was used by max (FEA). 2 Exact value was used by average (FEA).
Table 12. Average strain of the holes for the d/w ratios and values found by the DIC method on the right side.
d/wFEA Data (Right)
(mm/mm)
Average (FEA) (mm/mm)DIC
(mm/mm)
Error 1 (%)
0.30.01440.01440.01450.01440.01440.3001
0.40.01620.01630.01620.01620.01630.1973
0.50.01890.01900.01900.018900.01900.1441
1 Exact value was used by average (FEA).
Table 13. Results of FEA analysis of stress and strain for specimens subjected to eccentric load considering the effect of the clamp restriction.
Diameter (mm)d/wStress (MPa)Strain (mm/mm)
Without a hole-8.56290.00484
1.90.126.9760.01453
3.80.227.6150.015088
5.70.329.9820.016686
7.60.433.2880.018521
9.50.537.9810.021212
Table 14. FEA analysis results of stress and strain for specimens subjected to eccentric load disregarding the effect of the clamp restriction.
Diameter (mm)d/wStress (MPa)Strain (mm/mm)
Without a hole-8.9140.00502
1.90.128.3220.01527
3.80.230.2320.01653
5.70.334.7450.01915
7.60.439.4140.02191
9.50.544.4710.02482
Table 15. Average strain of the holes for the d/w ratios and values found by DIC on the left side.
d/wFEA Data (Left)
(mm/mm)
Max (FEA)
(mm/mm)
Average (FEA)
(mm/mm)
DIC
(mm/mm)
Error 1
(Max) (%)
Error 2
(Avg.) (%)
0.30.01560.01550.01530.01920.015470.015519.27090.1961
0.40.01810.01850.01820.02190.018240. 017321.00465.4089
0.50.02060.02060.02080.02480.020660.020019.35483.1852
1 Exact value was used by max (FEA). 2 Exact value was used by average (FEA).
Table 16. Average strain of the holes for the d/w ratios and values found by DIC on the right side.
d/wFEA Data (Right)
(mm/mm)
Average (FEA)
(mm/mm)
DIC
(mm/mm)
Error 1 (%)
0.30.012420.012700.012170.012430.014415.8228
0.40.012950.013140.013000.013030.016324.7307
0.50.015290.016230.015120.015550.019022.2258
1 Exact value was used by average (FEA).
Disclaimer/Publisher’s Note: The statements, opinions and data contained in all publications are solely those of the individual author(s) and contributor(s) and not of MDPI and/or the editor(s). MDPI and/or the editor(s) disclaim responsibility for any injury to people or property resulting from any ideas, methods, instructions or products referred to in the content.

