Abstract
The performance of the porous gas bearing depends on the geometric characteristics, material, fluid properties, and the properties of the porous media, which is a restrictor that controls the gas flow. Its application in industrial environments must support higher loads, higher supply pressure, and, consequently, higher pressure in the lubricant fluid film. Because porous media has a relatively low elastic modulus, it is necessary to consider its deformation when designing porous gas bearings. The design of porous gas bearings is a multi-objective problem in engineering because the optimization objectives commonly are to maximize the load capacity or static stiffness coefficient and minimize the airflow; these objectives conflict. This work presents a multi-objective optimization algorithm based on the nature-inspired Flower Pollination Algorithm enhanced with Non-Dominated Sorting Genetic Algorithm II. The algorithm is applied to optimize the design of a porous gas bearing, maximizing the resultant force and the static stiffness coefficient and minimizing the airflow. The results indicate a better performance of the Multi-Objective Flower Pollination Algorithm than the Multi-Objective Cuckoo Search. The results show a relatively short running time of 6 min for iterations and a low number of iterations of 50.
1. Introduction
The performance of the porous gas bearing depends on the geometric characteristics, the porous media properties, the gas properties, and the operating conditions [1]. All these characteristics are directly related to the porous media, which is the restrictor that controls the airflow supply to the lubricating gas film in a porous gas bearing [2]. The porous medium can be made of metallic, ceramic, or graphite materials due to its flow characteristics (permeability coefficient), which improves the load capacity and rigidity of a porous gas bearing [3]. There are several studies on porous medium materials applied on a gas bearing, such as ceramic materials like alumina [4,5,6], metals like sintered steel [7,8] and sintered bronze [9], graphite [10,11,12,13,14], as well as cemented materials [15,16]. Graphite is the most commonly used material as a porous medium in a porous gas bearing due to its low cost, ease of manufacturing [15], and low shear resistance under friction force [17].
The application of Porous Gas Journal Bearings in industrial environments must have the capacity to support heavier components developing higher pressures in the fluid film lubricant; for example, a 5-stage centrifugal compressor rotor weighs 67 kg (147.6 lb) [18]. Due to the above and because graphite used as porous media has a relatively low elastic modulus, around 9–12 GPa [14], it is necessary to consider the deformation of the porous medium caused by the pressure gas film. That is the Fluid–Structure Interaction (FSI) between the lubricant gas film and the porous medium material.
There are a few works about Fluid–Structure Interaction (FSI) on porous gas bearings; Zhang and Lin [19] presented an analysis of the rectangular porous plate performance under deformation by combining air lubrication and commercial Finite Element Method (FEM) software. Their results show that considering deformation leads to a higher load capacity and lower stiffness. The load capacity increases as the elastic modulus and porous plate thickness decrease, particularly when the film thickness is large. Conversely, stiffness decreases as the elastic modulus and porous plate thickness decrease, but it reaches a maximum at a specific film thickness. Cui et al. [20] analyzed an aerostatic porous bearing, composed of a journal and a thrust porous bearing, used in ultra-precision machine tools. The work presents the influence of surface non-flatness and waviness on the behavior of the bearing through a numerical method based on Computational Fluid Dynamics (CFD) and Dynamic Mesh Technology (DMT). The study shows that the influence of non-flatness errors is lower than the waviness errors in the porous bearing performance, which helps in the porous bearing design and manufacturing. Yan et al. [21] took a porous aerostatic guideway to analyze its static characteristics and structural deformations through an FSI model based on CFD and FEM; its results indicate that guideways made of ceramics are the most suitable due to the relatively light weight, slight deformation, and fast dynamic response. Wang et al. [22] studied the static performance of porous thrust bearings by the FSI method using CFD- and FEM-based commercial software, showing that the deformation of porous gas bearings is proportional to the supply air pressure but is inversely proportional to the thickness and Young’s modulus. They proposed a double-layered porous gas bearing to reduce deformation and increase the stability of the porous thrust bearing. Hwang et al. [23] analyzed annular-thrust aerostatic porous journal bearings through multi-physics commercial software; the parametric study of the dynamic coefficients shows that the cross-coupled coefficients are lower than the direct stiffness and damping coefficients, which are positive, and the shaft eccentricity significantly affects the tilting dynamic coefficients.
All these considerations make porous gas journal bearing (PGJB) design a non-straightforward task. Furthermore, the design in PGJB is a multi-objective problem in engineering because its objectives are to maximize the load capacity and minimize the airflow; these objectives conflict with each other. There are many optimization algorithms; one kind is the nature-inspired algorithm like the Genetic Algorithm (GA) [24], Particle Swarm Optimization (PSO) [25], Cuckoo Search (CS) [26], the Bat Algorithm (BA) [27], Flower Pollination Algorithm (FPA) [28], and others. Some of these algorithms were extended to handle the multi-objective problem. An example is the Multi-Objective Flower Pollination Algorithm (MOFPA), which performs better than the multi-objective version of the GA and PSO [29]. The MOFPA has advantages such as its simplicity and flexibility, which makes the algorithm more straightforward to implement. Additionally, its global search is guided by Levy flights, which can explore the search space more efficiently, granting global convergence instead of a local optimum. Wang [30] used the two-stage group inching fortification (GIF) method for the optimization of porous air bearing design; the study shows a more widespread Pareto front than the GA and Hyper-Cube Dividing Method (HDM). Gu [31] used a combination of the GA and artificial neural networks to optimize a hydrostatic journal bearing; the results show an improvement in running time, load capacity, and feeding power.
This study presents a numerical analysis of the performance of the MOFPA modified with non-dominated sorting genetic algorithm II (NSGA-II) [32] for designing a PGJB, considering the FSI between the lubricant fluid film and the porous media. The NSGA II performs excellently in finding conjunct solutions and convergence near the true Pareto front. The optimization objectives are to maximize the resultant force (F) and static stiffness coefficient (Ks) and to minimize the airflow (). The MOFPA was compared with Multi-Objective Cuckoo Search (MOCS). The results indicate a better performance of MOFPA, particularly in the lower zone of the Pareto fronts. Further, it is an excellent tool for determining the geometric characteristics of the PGJB design, considering the FSI effect.
2. Flow Structure Interaction (FSI) Modeling Method
This section describes the analytical model used for the optimization process. It includes the governing equations for the fluid flow and the porous media elastic deformation.
2.1. Porous Gas Journal Bearing Theory
Different models describe the fluid flow within an annular ring. The most straightforward and most useful model is obtained with the Reynolds equation. The stable compressible 2-D modified Reynold equation in Cartesian coordinates describes the porous gas bearing behavior, Equation (1). Figure 1 shows a schematic of a porous gas journal bearing [33].
where R is the bearing radius; r is the shaft radius; h is the lubricant film thickness (in our case ); ex and ey are the components of the eccentricity (e) of the shaft; x and y are the coordinates; u is the displacement of the porous media surface deformation; µ is the fluid viscosity; and f(φ) represents the mass flow of gas through the porous media.
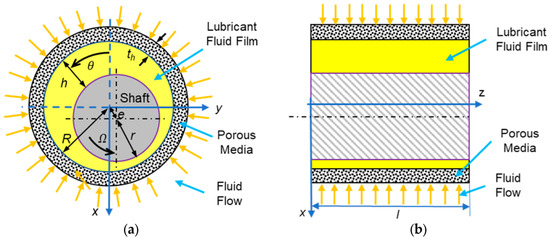
Figure 1.
A schematic of a porous gas journal bearing: (a) front view and (b) lateral view.
Considering that the gas mass flow through the porous media obeys Darcy’s law, given by , where the gas is ideal (), and assuming the temperature difference is small enough to be neglected, after some algebraic manipulation, the dimensionless form of Equation (1) is
where x = Rθ, z = Zl, p = Ppa, h = Hc, α = ps/pa, pa is the atmospheric pressure, l is the length of the bearing, and c is the clearance (c = R − r), ΛΩ = 6µΩR2/pac2, Λk = 6kR2/thc3. This indicates that, under stationary simulation conditions, the convective term is equal to zero.
The resultant forces are given by
The static stiffness coefficient is calculated from
The airflow is calculated with
The governing equations have to be solved numerically.
2.1.1. Porous Gas Journal Bearing Numerical Solution
To solve the modified Reynolds equation, the algorithm used the finite difference method
The finite difference equations, Equations (8)–(11), are substituted into the form of Equation (2) with the expanded partial derivatives
The domain is divided as shown in Figure 2. A system of quadratic equations arises from substituting Equation (12) into the fluid flow domain (red points in Figure 2). In this context, Equation (12) is expanded over the entire flow domain, where the pressure term (independent variable) is of quadratic order. The finite difference method solves this system using adjacent points. The Newton–Raphson method is used to solve the resulting system of quadratic equations.
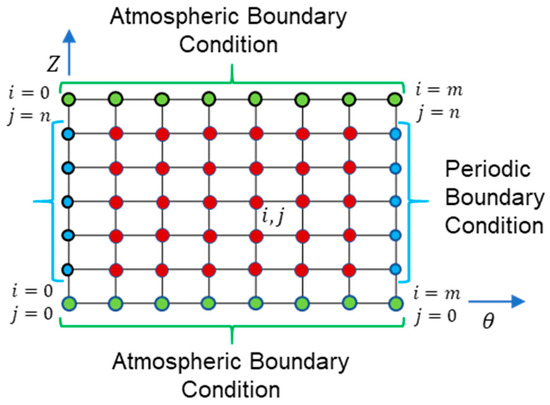
Figure 2.
Fluid flow domain; boundary conditions (blue and green points), and governing equation (red points).
2.1.2. Porous Media Deformation Theory
The Airy method is used to calculate the deformation of the porous media, which is considered a hollow cylinder under a non-uniform internal load and non-displacement boundary condition of the external surface (as illustrated in Figure 3). In this case, the axisymmetric solution is not applicable because the non-uniform internal load is not axisymmetric.
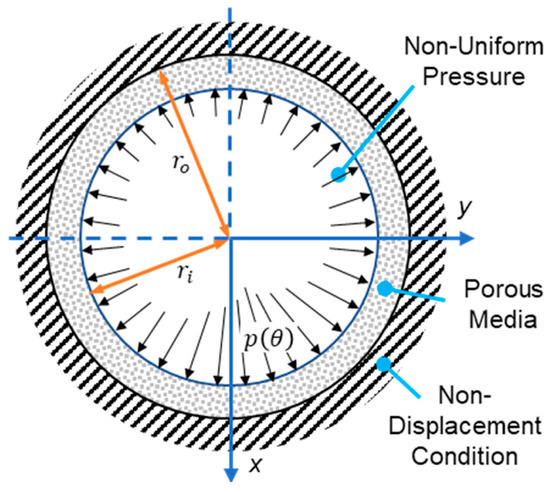
Figure 3.
Diagram of a hollow cylinder under non-uniform internal pressure (black arrow lines).
The stress component equations and the deformation for plain strain are [34]
where is the radial stress, is the tangential stress, is the shear stress, is the radial strain, E is the elastic modulus, is the Poisson ratio, and are the radial and tangential coordinates, respectively, and is the stress function. Consider a solution of the stress function under a non-uniform load p (θ) as (by Liu et al. [35])
By substituting Equation (17) into Equations (13)–(15), the resulting stress component equations are
Next, the following boundary conditions are applied to Equations (18)–(20)
where is the inner radio and is the outer radio; the constants A, B, and D are determined as
The strain equation of a hollow cylinder under non-uniform internal pressure is obtained by substituting Equations (23)–(25) into Equations (18)–(19) and then into Equation (16), followed by algebraic procedure
Finally, integrating Equation (26) yields the displacement equation
The first step of the solution algorithm procedure is calculating the pressure distribution of the lubricant fluid film considering a non-deformable porous media. Then, the initial deformation is calculated with this non-deformable pressure distribution. This initial deformation determines the new thickness of the lubricant fluid film. With the new thickness, a new fluid pressure distribution is calculated. This pressure value is compared with the previous calculation. The iteration continues until the pressure difference is lower than 1 × 10⁻⁶. The resultant force, the static stiffness coefficient, and the airflow consumption are calculated with the pressure distribution obtained in the lubricant fluid film. Figure 4 shows the flowchart of the solution algorithm of the pressure distribution considering the porous media deformation.
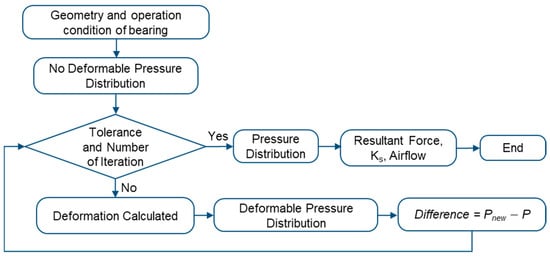
Figure 4.
Flowchart of the solution algorithm of the pressure distribution considering the deformation of porous media.
2.2. Analysis of the Algorithm Performance
The algorithm to determine the pressure distribution considering the deformation of the porous media was programmed in Octave™. Table 1 shows the bearing characteristics from [36] to analyze the mesh sensitivity and the performance of the solution algorithm. The porous media structural properties were taken from [14,37]. In all cases, the permeability coefficient is considered uniform regardless of grid size because the porous size of the graphite (typically ~50 × 10−6 mm) is minuscule compared to the mesh size.

Table 1.
Porous gas bearing characteristics, Refs. [14,36,37].
In this case, the algorithm was modified to determine the shaft’s eccentricity through an iteration process to balance the force applied. As the references show, the applied load acts in the y direction.
Figure 5 shows the displacement (eccentricity) versus the number of nodes to determine the algorithm’s mesh sensitivity; the calculations used an applied force of 15 N and a supply pressure of 3.7 bar. The displacement reaches a stable value of 9.54 N at a mesh dimension of 4250 with mesh dimensions of 85 and 50, circumferentially and axially, respectively. The percent difference between the results at this mesh size and the result at the previous mesh is lower than 0.1%.
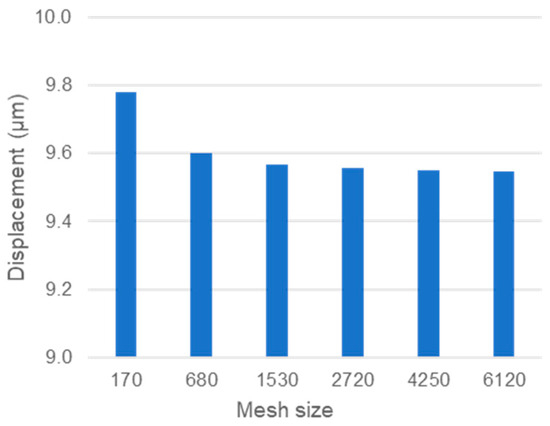
Figure 5.
Sensitivity analysis of mesh size. Supply pressure 3.7 bar, clearance 30 µm, load applied 15 N.
The results of the performance of the proposed algorithm were compared with the results from [36]. Figure 6 shows the displacement (eccentricity) versus the rotational speed, considering the bearing characteristics from Table 1, and at different rotational speeds (Ω), 0, 12,000, and 24,000 rpm. The results of the proposed algorithm show better performance than the numerical solution of reference. The results agree with the experimental result of [36] at zero speed and low rotor speed (0 and 12,000 rpm). However, the result is worse at a higher rotor speed. The lower difference between the experimental and actual prediction is 0.1 μm at 12,000 rpm. The authors of the reference express that the instrument’s characteristics and disposition influence the measurement’s accuracy.
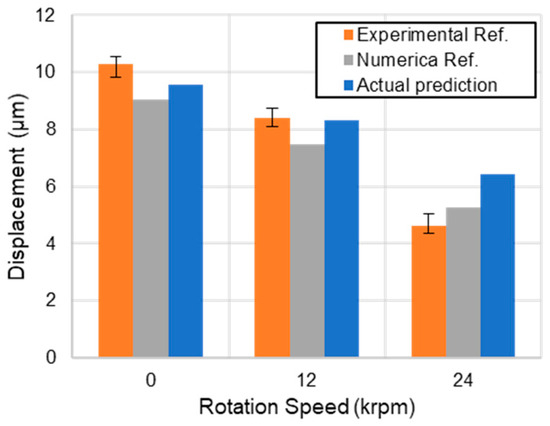
Figure 6.
Analysis of the solution algorithm performance considering the deformation of porous media [36].
2.3. Multi-Objective Flower Pollination Algorithm
The Multi-Objective Flower Pollination Algorithm [29] is an extension of the flower pollination algorithm developed by Yang [28] based on flowering plants.
The four rules of the flower pollination algorithm are as follows: First, the global pollination (rule 1) and flower constancy (rule 3) are represented mathematically as
where is the new solution, is the solution at iteration t, is a factor to control the size between steps, and is the best solution of the actual population. To mimic insects’ long-distance travel, the Levy flight parameter, , is used.
where is the standard gamma function.
Second, the local pollination (rule 2) and flower constancy (rule 3) are represented mathematically as:
where and represent pollen (solutions) from other flowers (different iterations) of the same species, is selected from a uniform distribution on the interval [0, 1].
Third, the switch between global and local pollination (rule 4) is controlled by the proximity probability .
The non-dominated sorting genetic algorithm (NSGA-II) [32] was used to extend the single-objective optimization of the flower pollination algorithm to a multi-objective optimization and to enhance the performance of the multi-objective algorithm.
Figure 7 shows the flowchart of the solution algorithm of the Multi-Objective Flower Pollination Algorithm.
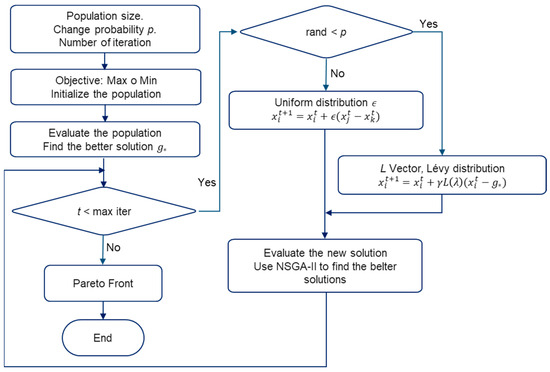
Figure 7.
Flowchart of the Multi-Objective Flower Pollination Algorithm.
3. Results
The solution algorithm of pressure distribution was tested in [38], and it shows that the algorithm convergence depends on the initial solution and the ratio between the number of nodes in the longitudinal and circumferential directions of the mesh. Additionally, with a mesh of 6480 nodes or higher, the sensitivity of the prediction of resultant force was lower than 0.1%.
3.1. Deformable Porous Gas Journal Bearing Performance
The influence of pressure variation was tested to show the importance of considering the deformation of the porous media in the PGJB performance. The geometrical characteristics of the PGJB were taken from San Andres et al. [1], and the porous media properties were taken from [14,37] (Table 2).
Table 2.
Porous gas journal bearing characteristics, from [1,14,37].
Figure 8 presents the resultant force and static stiffness coefficient considering non-deformable (ND) and deformable (D) porous media. The supply pressure is 4 bar (ND4 and D4), 6 bar (ND6 and D6), 8 bar (ND8 and D8), and 12 bar (ND12 and D12), a clearance from 8 to 30 µm, with an eccentricity ratio () of 0.01, an elastic modulus of 12 × 109 Pa, and no rotational speed. As expected, the resultant force and static stiffness coefficient predictions increase as the supply pressure increases. Figure 8 shows that as the supply pressure increases, the prediction difference of the static stiffness coefficient becomes more evident. The resultant force and stiffness coefficient predictions are lower when considering the porous medium deformation. The clearance of the maximum resultant force, 15 µm, is not affected by either the supply pressure or the consideration of the porous medium deformation, Figure 8a. In the same way, the clearance of the maximum static stiffness coefficient, 10 µm, is not affected by the supply pressure nor by consideration of the porous medium deformation; see Figure 8b.
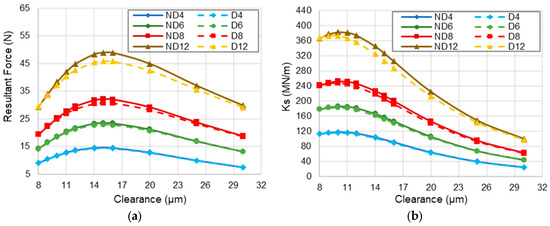
Figure 8.
Effect of the pressure variation on (a) resultant force and (b) static stiffness coefficient. Supply pressure 4, 6, 8, and 12 bar. Eccentricity ratio 0.01.
Figure 9 shows the pressure profile and the difference between non-deformable (ND) and deformable (D) porous media at the middle of the bearing length (z = ½ L). The clearance is 8 µm (ND08 and D08), 15 µm (ND 5 and D15), and 30 µm (ND30 and D30). The supply pressure is 12 bar, with an eccentricity ratio () of 0.01, an elastic modulus of 12 × 109 Pa, and no rotational speed. The resultant force is higher at a clearance of 15 µm because the difference between the maximum and minimum value of the profile is higher, in this case 0.104 bar, than in other clearances. Remember that the resultant force is obtained by integrating and balancing the pressure around the circumferential of the porous gas bearing, Equations (3)–(5). The resultant force is reduced because of the decrease in the fluid film pressure, as shown in Figure 9a. This diminution is because the deformation of the porous media affects the pressure balance between the restrictor (porous media) and the gas fluid film.
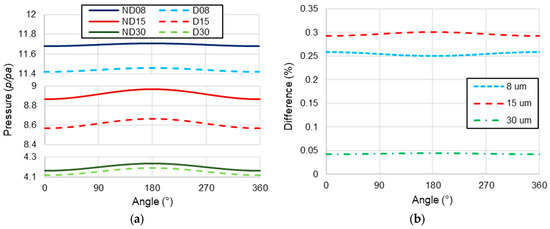
Figure 9.
(a) Pressure at the middle of the bearing length (z = ½ L), and (b) Difference between pressure at the middle of the bearing length (z = ½ L). Supply pressure 12 bar. Eccentricity ratio 0.01.
Figure 10 presents the difference in the resultant force and the static stiffness coefficient between non-deformable and deformable porous media predictions. The reference was the non-deformable porous medium prediction. It is confirmed that as the supply pressure increases, the differences between the predictions are higher. This is because the deformation of the porous media is higher. The differences in the resultant force and static stiffness coefficient, at 12 bar, reach a maximum of 3.0 N and 6.6%, respectively. The maximum difference occurs at a clearance of 15.0 μm when the maximum resultant force occurs. After that clearance, the curve tends to zero as the clearance increases; see Figure 10a,b. This trend is identical at all supply pressures. The maximum difference of resultant force at 15.0 μm clearance is because the maximum difference of pressure occurs at that clearance (Figure 9b) and the range of the pressure profile is bigger (Figure 9a). In contrast, the resultant force difference at 8.0 μm is almost depreciable; this is because, although the difference between the pressure profile is high in Figure 9b, the range of the pressure profile is small, at 0.03 bar. This indicates that the form of the pressure profile has a major influence on the resultant force.
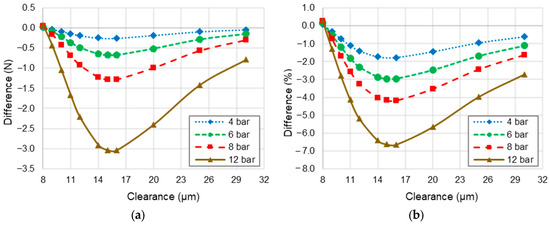
Figure 10.
Difference between prediction on (a) resultant force and (b) static stiffness coefficient. Supply pressure 4, 6, 8, and 12 bar, eccentricity ratio 0.01.
Concerning the airflow, Figure 11 presents the prediction and the difference in airflow consumption considering non-deformable (ND) and deformable (D) porous media. The supply pressure is 4 bar (ND4 and D4), 6 bar (ND6 and D6), 8 bar (ND8 and D8), and 12 bar (ND12 and D12), the clearance is 8 to 30 µm, and the eccentricity ratio is 0.01. Figure 11a shows a slight difference between the airflow prediction considering a non-deformable and deformable porous media. The predictions are higher when considering a deformable porous media. The difference in the airflow predictions is because of the decrease in the pressure in the fluid film, which affects the quadratic difference with the supply pressure in Darcy’s law. Figure 11b shows that the difference in airflow predictions increases while the clearance decreases. This trend is similar in all supply pressures. The maximum difference was 11.3% at a supply pressure of 12 bar at a clearance of approximately 8.0 μm. In contrast with the resultant force, the maximum proportional airflow difference occurs at 8 μm because the difference between the pressure profile is high (Figure 9b) and the airflow at that clearance is low (Figure 11a).
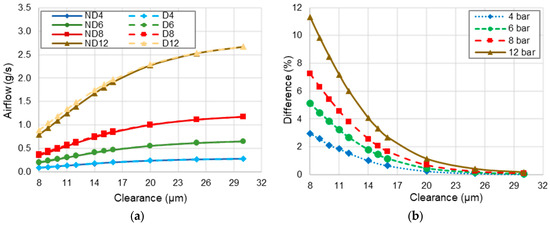
Figure 11.
(a) Effect of the pressure variation on airflow (b) difference between airflow prediction. Supply pressure 4, 6, 8, and 12 bar, eccentricity ratio 0.01.
3.2. Optimization Analysis
The optimization process of the proposed porous gas journal bearing has three optimization objectives: maximizing the resultant force (F) and static stiffness coefficient (Ks) and minimizing the airflow (). The design variables are the clearance (c), the porous layer radial thickness (th), the length (l), the supply pressure (Ps), and the rotational speed (Ω).
Table 3 shows the fixed variables for optimizing a PGJB design: the inner diameter, the coefficient of permeability, the elastic modulus, Poisson ratio [14,37], and the eccentricity ratio. It also shows the range of variables: the clearance, the porous media thickness, the pressure supply, the rotation velocity, and the length. The population was 100, and the number of iterations was 50. The time of each iteration was, on average, 6 min.
Table 3.
Optimization range of structural characteristics.
Figure 12 shows the progress of the algorithm’s search for the optimal solutions of the objectives: resultant force vs. static stiffness coefficient, resultant force vs. airflow, and static stiffness coefficient vs. airflow. The iterations start randomly, as shown in Figure 12. The fast convergence of the solution algorithm for the optimal Pareto front is evident. At the same time, it shows the trend by optimizing the objectives, maximizing the resultant force and static stiffness coefficient, and minimizing the airflow (orange arrow). At a lower number of ten iterations, the Pareto front solution is almost as converged as the Pareto front for iteration fifty.
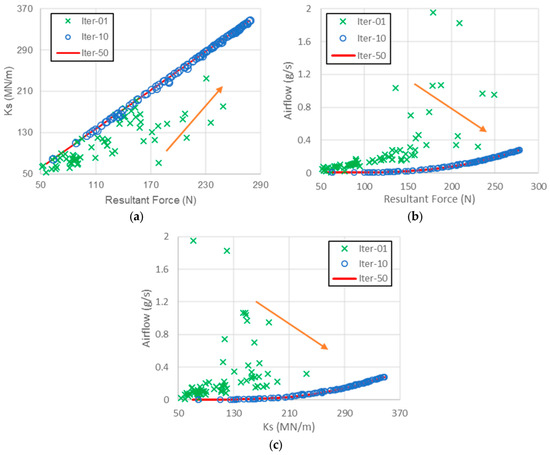
Figure 12.
Progress of the Pareto front of the objectives: (a) resultant force vs. static stiffness coefficient, (b) resultant force vs. airflow, and (c) static stiffness coefficient vs. airflow. The orange arrows show the trend by optimizing the objectives.
Continuing with the analysis, the performance of MOFPA is compared with MOCS. The population was 100, and after 50 iterations for both algorithms, the normalized values of the objective results are compared in Figure 13a. The maximum values reached for the three objectives in both algorithms are the same: 278.0 N, 347.6 MN/m, and 0.28 g/s for resultant force, static stiffness coefficient, and airflow, respectively. The comparison of the results between the MOPFA and MOCS shows four zones in Figure 13b. In the first zone (Z1), the optimum values proposed by the MOPFA are higher than those proposed by MOCS, improving the resultant force and the static stiffness coefficient, reaching a maximum difference of 13.3% at the cost of an increase of 0.1% in airflow; see Figure 13b. The second zone (Z2) shows that the optimum values proposed by MOPFA are higher than those proposed by MOCS. However, in this case, the improvement in the resultant force and static stiffness coefficient is in the same range as the increase in airflow, which is against the objective of minimizing the airflow. In the third zone (Z3), the difference between the algorithms is minimal, with a maximum difference of 1.0%. In the last zone (Z4), the optimum values proposed by the MOCS are lower than those proposed by the MOPFA, improving the resultant force and the static stiffness coefficient, reaching a maximum difference of 3.3% at the cost of an increase of 9.6% in airflow; see Figure 13b.
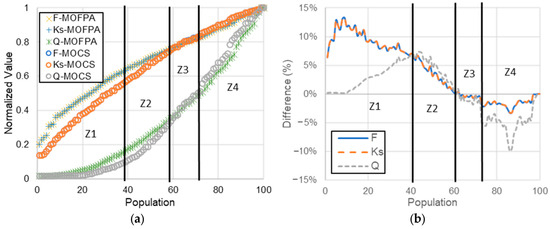
Figure 13.
Comparison between MOFPA and MOCS, normalized objective values: (a) Pareto front, (b) difference between optimum values of MOFPA and MOCS. Z1 (fist zone), Z2 (second zone), Z3 (third zone), Z4 (fourth zone).
Analyzing the Pareto fronts, in Figure 14 the relation between the resultant force and static stiffness coefficient is linear (Figure 14a), but the relation between the resultant force and airflow and the relation between static stiffness coefficient and airflow is nonlinear (Figure 14b,c). The Pareto front of resultant force vs. airflow, Figure 14b, shows three principal zones at lower values. The ratio between the resultant force and the airflow is high, which is better for the optimization objective (cyan line) because with a low increase in airflow, the resultant force is increased. The ratio between the resultant force and the airflow is low at the upper resultant force, which is against the optimization objective (orange line) because with a high increase of airflow, the rise in the resultant force is low. The middle zone (shaded zone) is the transition between the two linear zones; the relation between resultant force and airflow is nonlinear. The relation between the static stiffness coefficient and the airflow in Figure 14c has the same trend. The first linear zone (cyan line) and the first half of the middle zone (shaded zone) must be the designer’s selection zone because the ratio between the resultant force and the airflow is high or reaches an equilibrium. The resultant force, static stiffness coefficient, and airflow range in the design selection zone are 56.3 to 193.7 N, 70.4 to 242.2 MN/m, and 0.0047 to 0.067 g/s, respectively.
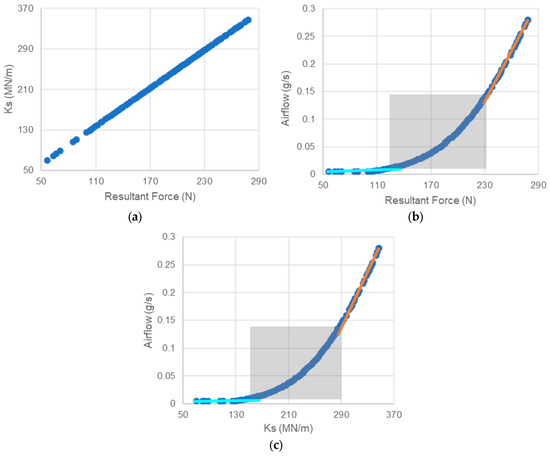
Figure 14.
Pareto front of PGJB (a) resultant force vs. static stiffness coefficient, (b) resultant force vs. airflow, linear region of high (cyan line) and low (orange line) ratio between the resultant force and the airflow and non-linear zone (shaded zone) and (c) static stiffness coefficient vs. airflow, linear region of high (cyan line) and low (orange line) ratio between the static stiffness coefficient and the airflow and non-linear zone (shaded zone).
Table 4 shows the results of higher differences between both optimization methods in the four zones; see Figure 13b. The results show that the MOFPA’s performance is better than MOCS’s for optimizing the design of porous gas bearings. The resultant force and static stiffness coefficient predictions of the MOFPA are higher than the predictions of MOCS in the design selection zone. The prediction of airflow is also higher but in a lower proportion than the improvement in the resultant force and static stiffness coefficient.
Table 4.
Comparison of the optimization zones between Multi-Objective Flower Pollination Algorithm (MOFPA) and Multi-Objective Cuckoo Search (MOCS).
The normalized values of the variables obtained by the optimization process are presented in Figure 15. The first elements of the population show that the optimum objective values are guided for the length of the porous gas bearing; as the length increases, the performance is optimized. At the same time, the clearance and the supply pressure are at the lower boundary of the range, and the thickness and rotational speed are at the upper boundary of the range. The supply pressure guides the rest of the optimum objective values in the Pareto front; the performance is optimized as the supply pressure increases. In this case, the clearance is in the lower boundary of the range, and the thickness, rotational speed, and length are in the upper boundary of the range. Taking the shaded zone from Figure 14b and translating it to Figure 15, the optimized pressure range is from 3.5 to 8 bars. The optimization process can be repeated by selecting a value in the optimized pressure range to determine the range for optimizing the following variable.
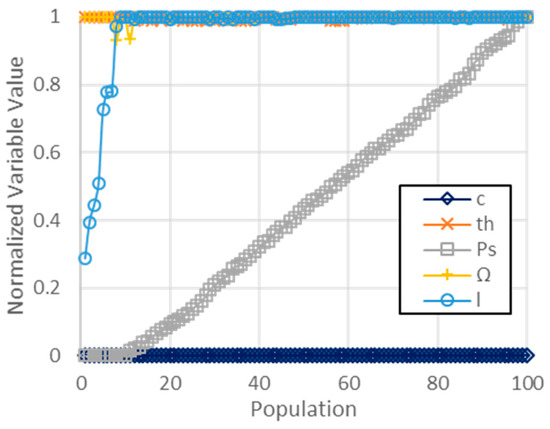
Figure 15.
Normalized values of the variables.
4. Conclusions
This paper presents a multi-objective optimization algorithm for designing a porous gas journal bearing. It analyzes the performance of the Multi-Objective Pollination Algorithm modified with Non-Dominated Sorting Genetic Algorithm II, considering the Fluid–Structure Interaction between the lubricant fluid film and the porous media. The initial calculation shows that when considering the deformation of the porous media, the difference between the resultant force, the static stiffness coefficient, and airflow prediction are higher as the pressure supply increases. The maximum differences in the resultant force and static stiffness coefficient were 3.0 N and 6.6%, respectively, at a clearance of 15.0 μm and a supply pressure of 12 bar. The maximum airflow difference was 11.3% at a supply pressure of 12 bar at a clearance of approximately 8.0 μm.
The algorithm shows convergence at a lower number of iterations of 50 and a calculation time of 6 min for iteration on average. The three optimization objectives are maximizing the resultant force (F) and static stiffness coefficient (Ks) and minimizing the airflow (). The results indicate a better performance of the Multi-Objective Pollination Algorithm than the Multi-Objective Cuckoo Search, particularly in the lower zone of the Pareto fronts. The prediction of resultant force and the static stiffness coefficient of the Multi-Objective Pollination Algorithm increase by 13.3%, with a minimum increase of 0.1% in airflow compared to the prediction of the Multi-Objective Cuckoo Search. The relation between the Pareto front of resultant force vs. static stiffness coefficient is linear. The Pareto front of resultant force vs. airflow and static stiffness coefficient vs. airflow is nonlinear. These Pareto fronts can be divided into three zones; at the lower zone, the growth ratio of the resultant force and static stiffness coefficient is higher than the growth ratio of airflow. At the upper zone, the relation is inversed. In the middle zone, the relation of the increase ratio between the optimized objectives is balanced. The optimized resultant force, static stiffness coefficient, and airflow range are 56.3 to 193.7 N, 70.4 to 242.2 MN/m, and 0.0047 to 0.067 g/s, respectively. The analysis shows that at the lower zone of the Pareto front, the length guides the optimization process, and the rest of the Pareto front, the supply pressure guides the optimization process of the porous gas journal bearing. The optimized pressure range is from 3.5 to 8 bars. While the clearance is in the lower boundary of its range, the thickness and rotational speed are in the upper boundary of its range. The Multi-Objective Flower Pollination Algorithm can explore even a local optimum value as a global optimum value, localizing the points of higher load capacity and static stiffness coefficient with a lower increment in airflow or slightly lower load capacity and higher static stiffness coefficient with a higher decrease in airflow than the Multi-Objective Cuckoo Search. These indicate that the Multi-Objective Flower Pollination Algorithm is an excellent design tool for determining the optimal geometric characteristics of the porous journal bearing, considering the Fluid–Structure Interaction between the lubricant fluid film and the porous media. The next step is evaluating the dynamic condition to determine the optimum geometrical characteristics stabilizing the porous gas journal bearing.
Author Contributions
Conceptualization, A.D.-C., J.C.J.-C., J.P.B.-R., A.D.-G. and O.C.D.S.; methodology, A.D.-C., J.C.J.-C., J.P.B.-R., A.D.-G. and O.C.D.S.; formal analysis, A.D.-C., J.C.J.-C., J.P.B.-R., A.D.-G. and O.C.D.S.; investigation, J.C.J.-C., J.P.B.-R., A.D.-G. and, O.C.D.S.; writing—original draft preparation, A.D.-C., J.C.J.-C., J.P.B.-R., A.D.-G. and O.C.D.S.; writing—review and editing, A.D.-C., J.C.J.-C., J.P.B.-R., A.D.-G. and O.C.D.S. All authors have read and agreed to the published version of the manuscript.
Funding
This research received no external funding.
Data Availability Statement
The data presented in this study are available on request from the corresponding author. The data are not publicly available due to privacy.
Acknowledgments
The authors thank the Consejo Nacional de Humanidades, Ciencia y Tecnologia (CONAHCYT) for supporting this work through student’s scholarship and project number CF-2023-I-204.
Conflicts of Interest
Oscar Cesar De Santiago was employed by the company ETU i+D–Especialistas en Turbopartes Investigacion y Desarrollo. The remaining authors declare that the research was conducted in the absence of any commercial or financial relationships that could be construed as a potential conflict of interest.
Nomenclature
| p | Pressure, Pa. |
| pa | Atmospheric pressure, Pa. |
| ps | Supply pressure, Pa. |
| Pressure ratio, ps/pa. | |
| x | Circumferential coordinate m. |
| z | Axial coordinate, m. |
| Bearing length, m. | |
| R | Bearing radius, m. |
| r | Radius of the shaft, m. |
| c | Bearing radial clearance (c = R − r), m. |
| e | Eccentricity, m. |
| ϵ | Eccentricity ratio, . |
| h | Thickness of the lubricating film, m. |
| H | Dimensionless lubricating film thickness. |
| X | Circumferential dimensionless coordinate. |
| Z | Axial dimensionless coordinate. |
| P | Dimensionless pressure. |
| ρ | Density of the air, (1.2 kg/m3). |
| µ | Viscosity (1.85 × 10⁻⁵ Pa s). |
| k | Coefficient of permeability, m2. |
| Gas constant, J/kg K. | |
| T | Temperature, K. |
| th | Porous medium thickness, m. |
| Ω | Rotation speed, rad/s. |
| Fx | Horizontal component of force, N. |
| Fy | Vertical component of force, N. |
| F | Resultant force, N. |
| Static stiffness coefficient, N/m. | |
| Mass flow, g/s | |
| ri | Porous media inner radio, m. |
| ro | Porous media outer radio, m. |
| Radial stress, Pa. | |
| Tangential stress, Pa. | |
| Shear stress, Pa. | |
| Radial strain. | |
| Stress function, N. | |
| E | Young’s modulus, Pa. |
| Poisson’s ratio. | |
| Displacement, m. |
References
- Andrés, L.S.; Yang, J.; Devitt, A. Porous Gas Journal Bearings: An Exact Solution Revisited and Force Coefficients for Stable Rotordynamic Performance. Appl. Sci. 2021, 11, 7949. [Google Scholar] [CrossRef]
- Wardle, F. 4-Aerostatic Bearings. In Ultra-Precision Bearings; Wardle, F., Ed.; Woodhead Publishing: Oxford, UK, 2015; pp. 227–306. ISBN 978-0-85709-162-8. [Google Scholar]
- Durazo-Cardenas, I.S.; Corbett, J.; Stephenson, D.J. Permeability and Dynamic Elastic Moduli of Controlled Porosity Ultra-Precision Aerostatic Structures. Ceram. Int. 2014, 40, 3041–3051. [Google Scholar] [CrossRef]
- Silveira, Z.C.; Nicoletti, R.; Fortulan, C.A.; Purquerio, B.M. Ceramic Matrices Applied to Aerostatic Porous Journal Bearings: Material Characterization and Bearing Modeling. Cerâmica 2010, 56, 201–211. [Google Scholar] [CrossRef]
- Durazo-Cardenas, I.S.; Stephenson, D.J.; Corbett, J. Controlled Porosity Alumina Structures for Ultra-Precision Hydrostatic Journal Bearings. J. Am. Ceram. Soc. 2010, 93, 3671–3678. [Google Scholar] [CrossRef][Green Version]
- Kim, J.; Ha, J.-H.; Lee, J.; Song, I.-H. Effect of Pore Structure on Gas Permeability Constants of Porous Alumina. Ceram. Int. 2019, 45, 5231–5239. [Google Scholar] [CrossRef]
- Liao, Y.; Li, X.; Zhong, W.; Tao, G.; Liu, H.; Kagawa, T. Experimental Study of Pressure Drop-Flow Rate Characteristics of Heated Tight Porous Materials. J. Fluids Eng. 2016, 138, 071102. [Google Scholar] [CrossRef]
- Zhong, W.; Ji, X.; Li, C.; Fang, J.; Liu, F. Determination of Permeability and Inertial Coefficients of Sintered Metal Porous Media Using an Isothermal Chamber. Appl. Sci. 2018, 8, 1670. [Google Scholar] [CrossRef]
- Belforte, G.; Raparelli, T.; Viktorov, V.; Trivella, A. Feeding System of Aerostatic Bearings with Porous Media. Proc. JFPS Int. Symp. Fluid Power 2005, 2005, 126–131. [Google Scholar] [CrossRef]
- Kittmer, C.A. Investigation of Permeability of Carbon-Graphite Materials; Atomic Energy of Canada Ltd.: Chalk River, ON, Canada, 1980; p. 35. [Google Scholar]
- Biloé, S.; Mauran, S. Gas Flow through Highly Porous Graphite Matrices. Carbon 2003, 41, 525–537. [Google Scholar] [CrossRef]
- Cui, H.; Wang, Y.; Yue, X.; Huang, M.; Wang, W. Effects of Manufacturing Errors on the Static Characteristics of Aerostatic Journal Bearings with Porous Restrictor. Tribol. Int. 2017, 115, 246–260. [Google Scholar] [CrossRef]
- Zeng, C.; Wang, W.; Cheng, X.; Zhao, R.; Cui, H. Three-Dimensional Flow State Analysis of Microstructures of Porous Graphite Restrictor in Aerostatic Bearings. Tribol. Int. 2021, 159, 106955. [Google Scholar] [CrossRef]
- Liu, H.; Xu, Y. Gas Permeability Measurement in Porous Graphite under Steady-State Flow. Mater. Res. Express 2022, 9, 025603. [Google Scholar] [CrossRef]
- Panzera, T.H.; Rubio, J.C.; Bowen, C.R.; Walker, P.J. Microstructural Design of Materials for Aerostatic Bearings. Cem. Concr. Compos. 2008, 30, 649–660. [Google Scholar] [CrossRef]
- da Silva, L.J.; Panzera, T.H.; Viera, L.M.G.; Bowen, C.R.; Duduch, J.G.; Rubio, J.C.C. Cementitious Porous Material Applied to Precision Aerostatics Bearings. Int. J. Precis. Eng. Manuf. 2018, 19, 239–243. [Google Scholar] [CrossRef]
- Wang, H. Graphite Solid Lubrication Materials. In Encyclopedia of Tribology; Wang, Q.J., Chung, Y.-W., Eds.; Springer: Boston, MA, USA, 2013; pp. 1550–1555. ISBN 978-0-387-92897-5. [Google Scholar]
- De Santiago, O.; Solórzano, V. Experiments With Scaled Foil Bearings in a Test Compressor Rotor. In Proceedings of the Volume 7A: Structures and Dynamics, American Society of Mechanical Engineers, San Antonio, TX, USA, 3–7 June 2013; p. V07AT29A002. [Google Scholar]
- Zhang, X.F.; Lin, B. Theoretical Research on Deformation of Porous Material in Air Bearing. Appl. Mech. Mater. 2012, 215–216, 779–784. [Google Scholar] [CrossRef]
- Cui, H.; Wang, Y.; Yue, X.; Huang, M.; Wang, W.; Jiang, Z. Numerical Analysis and Experimental Investigation into the Effects of Manufacturing Errors on the Running Accuracy of the Aerostatic Porous Spindle. Tribol. Int. 2018, 118, 20–36. [Google Scholar] [CrossRef]
- Yan, R.; Wang, L.; Wang, S. Mechanical Research on Aerostatic Guideways in Consideration of Fluid-Structure Interaction. Ind. Lubr. Tribol. 2019, 72, 285–290. [Google Scholar] [CrossRef]
- Wang, W.; Cheng, X.; Zhang, M.; Gong, W.; Cui, H. Effect of the Deformation of Porous Materials on the Performance of Aerostatic Bearings by Fluid-Solid Interaction Method. Tribol. Int. 2020, 150, 106391. [Google Scholar] [CrossRef]
- Hwang, P.; Khan, P.; Kang, S.-W. Parameter Sensitivity Analysis on Dynamic Coefficients of Partial Arc Annular-Thrust Aerostatic Porous Journal Bearings. Appl. Sci. 2021, 11, 10791. [Google Scholar] [CrossRef]
- Holland, J.H. Adaptation in Natural and Artificial Systems: An Introductory Analysis with Applications to Biology, Control, and Artificial Intelligence; The MIT Press: Cambridge, MA, USA, 1992; ISBN 978-0-262-27555-2. [Google Scholar]
- Kennedy, J.; Eberhart, R. Particle Swarm Optimization. In Proceedings of the ICNN’95—International Conference on Neural Networks, Perth, WA, Australia, 27 November–1 December 1995; Volume 4, pp. 1942–1948. [Google Scholar]
- Yang, X.-S. Suash Deb Cuckoo Search via Lévy Flights. In Proceedings of the 2009 World Congress on Nature & Biologically Inspired Computing (NaBIC), Coimbatore, India, 9–11 December 2009; pp. 210–214. [Google Scholar]
- Yang, X.-S. A New Metaheuristic Bat-Inspired Algorithm. In Nature Inspired Cooperative Strategies for Optimization (NICSO 2010); González, J.R., Pelta, D.A., Cruz, C., Terrazas, G., Krasnogor, N., Eds.; Springer: Berlin/Heidelberg, Germany, 2010; pp. 65–74. ISBN 978-3-642-12538-6. [Google Scholar]
- Yang, X.-S. Flower Pollination Algorithm for Global Optimization. In Unconventional Computation and Natural Computation; Durand-Lose, J., Jonoska, N., Eds.; Springer: Berlin/Heidelberg, Germany, 2012; pp. 240–249. [Google Scholar]
- Yang, X.-S.; Karamanoglu, M.; He, X. Flower Pollination Algorithm: A Novel Approach for Multiobjective Optimization. Eng. Optim. 2014, 46, 1222–1237. [Google Scholar] [CrossRef]
- Wang, N.; Chen, H.-Y. A Two-Stage Multiobjective Optimization Algorithm for Porous Air Bearing Design. Tribol. Int. 2016, 93, 355–363. [Google Scholar] [CrossRef]
- Gu, Y.; Wang, D.; Cheng, L.; Schimpf, A.; Böhle, M. A Novel Method to Achieve Fast Multi-Objective Optimization of Hydrostatic Porous Journal Bearings Used in Hydraulic Turbomachine. J. Fluids Eng. 2023, 145, 051205. [Google Scholar] [CrossRef]
- Deb, K.; Pratap, A.; Agarwal, S.; Meyarivan, T. A Fast and Elitist Multiobjective Genetic Algorithm: NSGA-II. IEEE Trans. Evol. Comput. 2002, 6, 182–197. [Google Scholar] [CrossRef]
- Sneck, H.J.; Yen, K.T. The Externally Pressurized, Porous Wall, Gas-Lubricated Journal Bearing. ASLE Trans. 1964, 7, 288–298. [Google Scholar] [CrossRef]
- Timoshenko, S.P.; Goodier, J.N.; Abramson, H.N. Theory of Elasticity (3rd Ed.). J. Appl. Mech. 1970, 37, 888. [Google Scholar] [CrossRef]
- Liu, X. A Closed-Form Solution for Stress Analysis of Hollow Circular Cylinder Structure under Non-Uniform External Load and Its Engineering Application. J. Eng. Res. 2020, 8, 72–88. [Google Scholar] [CrossRef]
- Li, W.; Wang, S.; Zhao, Z.; Zhang, K.; Feng, K.; Hou, W. Numerical and Experimental Investigation on the Performance of Hybrid Porous Gas Journal Bearings. Lubr. Sci. 2021, 33, 60–78. [Google Scholar] [CrossRef]
- Cost, J.R.; Janowski, K.R.; Rossi, R.C. Elastic Properties of Isotropic Graphite. Philos. Mag. J. Theor. Exp. Appl. Phys. 1968, 17, 851–854. [Google Scholar] [CrossRef]
- Duran-Castillo, A.; Jauregui-Correa, J.C.; De Santiago, O. Numerical Comparison of Two Methods for Predicting the Porous Gas Bearing Pressure. Meccanica 2024, 59, 859–874. [Google Scholar] [CrossRef]


Disclaimer/Publisher’s Note: The statements, opinions and data contained in all publications are solely those of the individual author(s) and contributor(s) and not of MDPI and/or the editor(s). MDPI and/or the editor(s) disclaim responsibility for any injury to people or property resulting from any ideas, methods, instructions or products referred to in the content. |
© 2024 by the authors. Licensee MDPI, Basel, Switzerland. This article is an open access article distributed under the terms and conditions of the Creative Commons Attribution (CC BY) license (https://creativecommons.org/licenses/by/4.0/).