Article

On the Need of Compressive Regularization in Damage Models for Concrete: Demonstration on a Modified Mazars Model

1
Laboratoire Energétique Mécanique Electromagnétisme (LEME), UPL, Univ Paris Nanterre, F92410 Ville d’Avray, France
2
Service d’Etudes Mécaniques et Thermiques, CEA, Université Paris-Saclay, 91191 Gif-sur-Yvette, France
*
Author to whom correspondence should be addressed.
Appl. Mech. 2024, 5(3), 490-512; https://doi.org/10.3390/applmech5030028
Submission received: 24 May 2024 / Revised: 19 June 2024 / Accepted: 6 July 2024 / Published: 16 July 2024

Abstract

:
Due to its significant non-linear softening characteristics and its wide variety of use cases, concrete has received considerable attention for the modeling of its mechanical behavior. The non-linear simulation of linear concrete structures is often associated with mesh dependency, the resolution of which requires some form of regularization. While most of the past research has focused on tension energy regularization for better mesh-objectivity, the compression behavior has been partly left out, even though it may have a significant impact for particular applications. By starting from the failed attempt to simulate a pushout test from the literature, this paper focuses on the enhancements brought by the energetic regularization in compression to an isotropic damage model based on Mazars’ equivalent strain. The resulting model is applied in three representative case studies where the enhanced mesh-objectivity is shown relative to the load–displacement behaviors and the damage patterns that are produced, and compared to those obtained by the classical model.

1. Introduction

Despite the proposition of increasingly sophisticated models to simulate concrete’s behavior at a local scale, the accurate simulation of concrete structures still poses challenges. Concrete is a softening material in both tension and compression, with potential cracks following various failure modes. This has led to the development of numerous methods and models within the finite element framework to simulate the non-linear behavior and represent the formation of cracks in the material under load (e.g., smeared crack models [1], remeshing techniques or linear–elastic fracture mechanics [2], or extended finite element analysis [3]).
There exist complex models that are able to accurately replicate the behavior of concrete under multiple loadings [4,5,6]. However, the sophisticated models have their own difficulties regarding simulation convergence and the identification of the various numerical parameters that they use. In this contribution, damage mechanics, and in particular, Mazars’ model [7], are selected to simulate concrete’s behavior for their simplicity and robustness relative to the fidelity of the model. There are issues with mesh objectivity, as damage mechanics exhibit potential zero-energy rupture [8] in the case of infinitely refined meshes: for a given band of elements where damage localizes [9], the total dissipated energy decreases with the volume of the band, ultimately approaching zero as the mesh refinement continues. The results from the simulations exhibit brittle failure modes, contrasting with the experimental observations.
A common approach to mitigate this issue involves adjusting the softening material parameters based on the size of the finite elements [8] to guarantee that the dissipated energy in one element is set to a user-defined value, and that it is no longer dependent on the element size. This approach is rather simple and has a limited computational cost. Other so-called regularization techniques exist, and are based on non-local quantities calculated from an average [10] or from the resolution of additional equations [11,12]. However, these methods present a higher computational cost (the maximum size of an element being limited by the characteristic length in non-local formulations) and are therefore unsuitable for the simulation of large dimensional structures.
As concrete cracking is mainly due to tensile strains, the topic of energy regularization has received more attention in tension than in compression. Most practical structures face tension rupture or shear fracture before compression failure can occur. However, while tension energy regularization reduces the mesh dependency for the tensioned members of the structure, the response is not so objective with respect to the mesh when the failure happens in compression instead. It is the case, for example, for the simulation of a frame using force-based frame elements [13], and for the simulation of a pushout test [14] based on [15].
The definition of the compression fracture energy is still debated in the scientific community. The rupture in compression is composed of complicated phenomena that involve mixed modes of rupture, not always in compression [16]. Therefore, its measurement is especially difficult, considering that the experimental setup must be able to eliminate experimental biases. The compression fracture energy is rarely measured in experimental studies that do not specifically address its quantification; consequently, an empirical expression is needed. A few authors have proposed correlations between the material parameters of concrete and its compression fracture energy, namely the compression strength f c , the tension fracture energy G f t , and the ratio between the compression strength and the tension strength f c / f t [5,17,18,19]. In the following, the law from [18] will be adopted for the estimation of the compression fracture energy G f c . Its expression, as given in Equation (1), is selected for its simplicity regarding the required material parameters. Assuming the surface area of the crack across one element is constant, the definition of the fracture energy for this work (be it in tension G f t or in compression G f c ) is specified in Equation (2). It is calculated as the integral of the reaction force F with regards to the displacement variable u .
G f c = 8.8 f c
G f t / c = 1 S 0 ± F d u = 0 ± σ d u
Within the framework of finite element analysis with only damage mechanics, only a few authors [4,20,21] have issued a local model that allows for a compression energy regularization. In [20], a modification to the Mazars’ model [7] was proposed to regularize the tension and the compression behaviors. However, no mesh dependency study was carried out to evaluate the improvements related to the compressive energy regularization and the formulation that was provided did not consider all the potential of Mazars’ model.
Starting from the case-study of a pushout test [15], where the refinement of the mesh close to the studs yields poor-quality results, this paper aims to propose a new damage model based on the original Mazars’ model [7,20], introducing regularization in compression, and validated on dedicated test cases. The model that is discussed here incorporates previous developments from the literature and is capable of simulating the behavior of concrete with an independent, energetic regularization in tension and in compression, under various load cases. Three test cases, among which is the pushout test [15], are then proposed to validate the new model and to demonstrate its efficacy in reducing the mesh dependency in the compression zones, due in particular to the introduction of the regularized compression law.

2. Original Mazars’ Model and Regularization in Tension

2.1. Original Formulation

Mazars’ model [7], called “Mazars O” in the following sections, is an isotropic damage model that was developed to simulate the behavior of softening materials such as concrete. The stress σ at each Gauss point is determined by the strain ε , the initial stiffness tensor E , and the damage d , as shown in Equation (3).
σ = 1 d E ε
The equivalent strain ε ~ written in Equation (4) is used to calculate the damage variable d , with ε I , I I ,   I I I as the principal strains. ε ~ is a representation of the extensions in the strain state. Under uniaxial tension, ε ~ = ε I , because the two other principal strains are negative. In uniaxial compression, only the first principal strain is negative and ε I I = ε I I I = ν ε I due to the Poisson effect, hence ε ~ = 2 ν ε I .
ε ~ = ε I + 2 + ε I I + 2 + ε I I I + 2 x + = x if x > 0 0 otherwise
The loading function f in Equation (5) is a function of the strain tensor via the equivalent strain ε ~ , and of the largest equivalent strain in the loading history κ . κ determines the evolution of damage when ε ~ exceeds its current value. Initially (before damage appears), κ is equal to κ 0 = ε d 0 , where ε d 0 is a material parameter describing the damage threshold.
f ε ~ ,   κ = ε ~ κ d
The total damage is calculated according to Equation (6). The coefficients α t and α c describe how the load is distributed along the principal axes. They are obtained using Equation (7). In pure tension, α t = 1 and α c = 0 , whereas in pure compression, α c = 1 and α t = 0 .
d = α t β d t + α c β d c
α t = i = 1 3 ε t i + ε t i ε ~ 2 ; α c = 1 α t
To characterize the asymmetric behavior of concrete, the damage variables d t and d c are calculated separately, as described in Equation (8). A difference in the couples of parameters A t / c and B t / c will result in different behaviors in pure tension or compression. Equations (6) and (7) express the combination of the two damage laws. The resulting damage for more complicated loading states is a compound of the damage in tension and in compression. It is important to note that due to the formulation of the equivalent strain being based on extension strains (as presented in Equation (4)), the damage thresholds in uniaxial tension and compression appear different when measured against ε I .
d t = 1 1     A t ε d 0 κ A t exp B t κ ε d 0 d c = 1 1     A c ε d 0 κ A c exp B c κ ε d 0
The coefficient β in Equation (6) is a parameter to enable the shear correction, as proposed in [22].
The unidimensional behavior in tension and compression of a 1 m concrete cube according to the original Mazars’ model is represented in Figure 1. The characteristics of the concrete in this example are calculated according to Eurocode 2 [23] with a mean compressive strength of f c m = 48   MPa , Young’s modulus E = 35   GPa , tension strength f t = 3.5   MPa , and the Poisson ratio ν set to 0.2 . The parameters of the Mazars’ O model can be obtained using Equation (9). Two additional factors are needed, as follows: the brittleness index in tension i b (which is set between 0 and 1, here 0.5) and the strain ε c at which the concrete reaches its compressive strength (here 2.3 × 10 3 ). The parameter ε c 1 from Eurocode 2 [23] can be used for the choice of the value of ε c .
A t = 1 ; B t = 1 + i b ε d 0 A c = B c ε d 0 f c 2 ν E B c ε d 0 exp B c ε d 0 1 ; B c = 1 2 ν ε c
It is important to note that the shape of the stress–strain behavior in tension or compression is entirely driven by the choice of the parameters A t / c and B t / c . Equation (9) results from common requirements on the stress–strain behavior, i.e.,:
  • The maximum stress in tension must be equal to f t ( f c in compression);
  • The asymptotic tension stress with infinite strains should be 0 (hence A t = 1 );
  • The peak compression stress must be reached at the strain ε = ε c .
To represent the bi-compression enhancement of the maximum stress in concrete as observed in experimental setups [24], a strain reduction factor may be calculated in accordance with Equation (10) [25] to lower the equivalent strain in the case of bi- or tri-compression.
γ = I = 1 3 σ c , I 2 I = 1 3 σ c , I 1 ; where σ c , I = σ I
In Equation (10), σ c , I is the compression principal stress along the I direction. It is equal to the negative part of the principal stress σ I . The γ factor is only activated when there is no tension; hence, the sum of the tension principal stresses must be equal to zero ( I = 1 3 σ I + = 0 ). It is calculated before the computation of the damage laws and can be used to reduce the equivalent strain as detailed in Equation (11). The result is a lower equivalent strain, which yields lower damage; therefore, it increases the stress for the same strain state.
ε ~ n e w = γ × ε ~

2.2. Mazars’ Model with Tension Energy Regularization

Based on the tension law proposed in [26], the tension energy regularization in the framework of Mazars’ model (called “Mazars RT” in the following) is obtained through the simpler damage evolution law presented in Equation (12) instead of the one from Equation (8). This law is somewhat similar to that of Equation (8) when A t = 1 , but dividing by κ simplifies its integration to obtain the fracture energy, and facilitates the formulation of B t as a function of the dissipated energy.
d t = 1 ε d 0 κ exp B t κ ε d 0 where:   ε d 0 = f t / E ; B t = f t h G f t f t ε d 0 h / 2
Equation (12) introduces the fracture energy in tension ( G f t ) and the size of the element ( h ), which is assessed in this contribution using the square root of the element’s area in 2D ( A ) or the cubic root of its volume ( V 3 ). Although more sophisticated ways for calculating the characteristic length were proposed in prior works [16,27], as first introduced in [9], they were not employed in this contribution. The primary objective of this research is to present a simple model for simulating potentially large structures while minimizing the extent of code modification within finite element software.
It has been suggested that when using quadratic elements, the characteristic length needs to be reduced [27] to account for the reduced localization length compared to that of linear elements. For elements with two Gauss points, the characteristic length should be h / 2 . Likewise, for elements with three Gauss points, softening occurs in two out of the three Gauss points, and the length should be 13 h / 18 .
In Equation (12), the parameters ε d 0 and B t describe the non-linearity threshold and the exponential decay factor, respectively. The parameters that are needed for the model are the characteristic length of each element h , the maximum tension stress, and the tension fracture energy G f t . It is worth noting that the expression for B t is only valid for elements smaller than h c r i t = 2 G f t / f t ε d 0 ; otherwise, B t is negative (or the denominator leads to a singularity). Moreover, for small elements, the expression of B t is equivalent to B t f t h / G f t , which amounts to neglecting the elastic stored energy, a valid assumption for very small elements. With classical parameters for concrete (such as G f t = 100   N / m , f t = 3   MPa and ε d 0 = 1 × 10 4 ), the critical length typically falls between 10 cm and 1 m. In this instance, it measures 67 cm.
Two tensile responses of Mazars’ RT damage model for different characteristic lengths are plotted in Figure 2 with the same concrete parameters as those of Figure 1, and with the tension fracture energy G f t = 100   N / m . The left graph shows the stress–displacement response for a coarse element, while the graph on the right shows the response for a finer element. After an initial elastic phase, the stress–displacement behavior softens more slowly when the characteristic length of the element is reduced to compensate for the loss in elastic energy. The two graphs in Figure 2 aim to show that the fracture energy is constant (area under the curves), as the post-peak behaviors are corrected to account for the absorbed energy in the elastic phase.
To prevent B t from reaching negative values in coarse elements, it is also possible to consider that the fracture energy is only due to the softening part [9]. An assumption like this should be taken with caution as it has an effect on the dissipated energy; i.e., smaller elements dissipate less energy overall. However, it yields the simpler relation B t = f t h / G f t . It has no restriction on the element sizes, and can still yield acceptable results. This approximation yields similar results to those obtained with Equation (12) when dealing with small elements (centimeter scale and below). In this case, the post-peak stress–displacement behaviors will be superposed.
A second method to avoid difficulties with the B t parameter becoming negative was also suggested in [9]. When the element’s size is greater than h c r i t = 2 G f t / f t ε d 0 , it is possible to consider that the stress suddenly drops after κ reaches ε d 0 (that is, the damage goes suddenly from 0 to 1), but the threshold ε d 0 must be recalculated by reducing the tensile strength according to Equation (13) for the elements whose length is above h c r i t . It is worth noting that the formula derived by the authors of [9] is compatible with the present model. In this contribution, the problem does not arise because the meshes are sufficiently refined, even in their coarse form.
f t , n e w = 2 E G f t h

2.3. Application of the Mazars’ RT Model to the Pushout Test

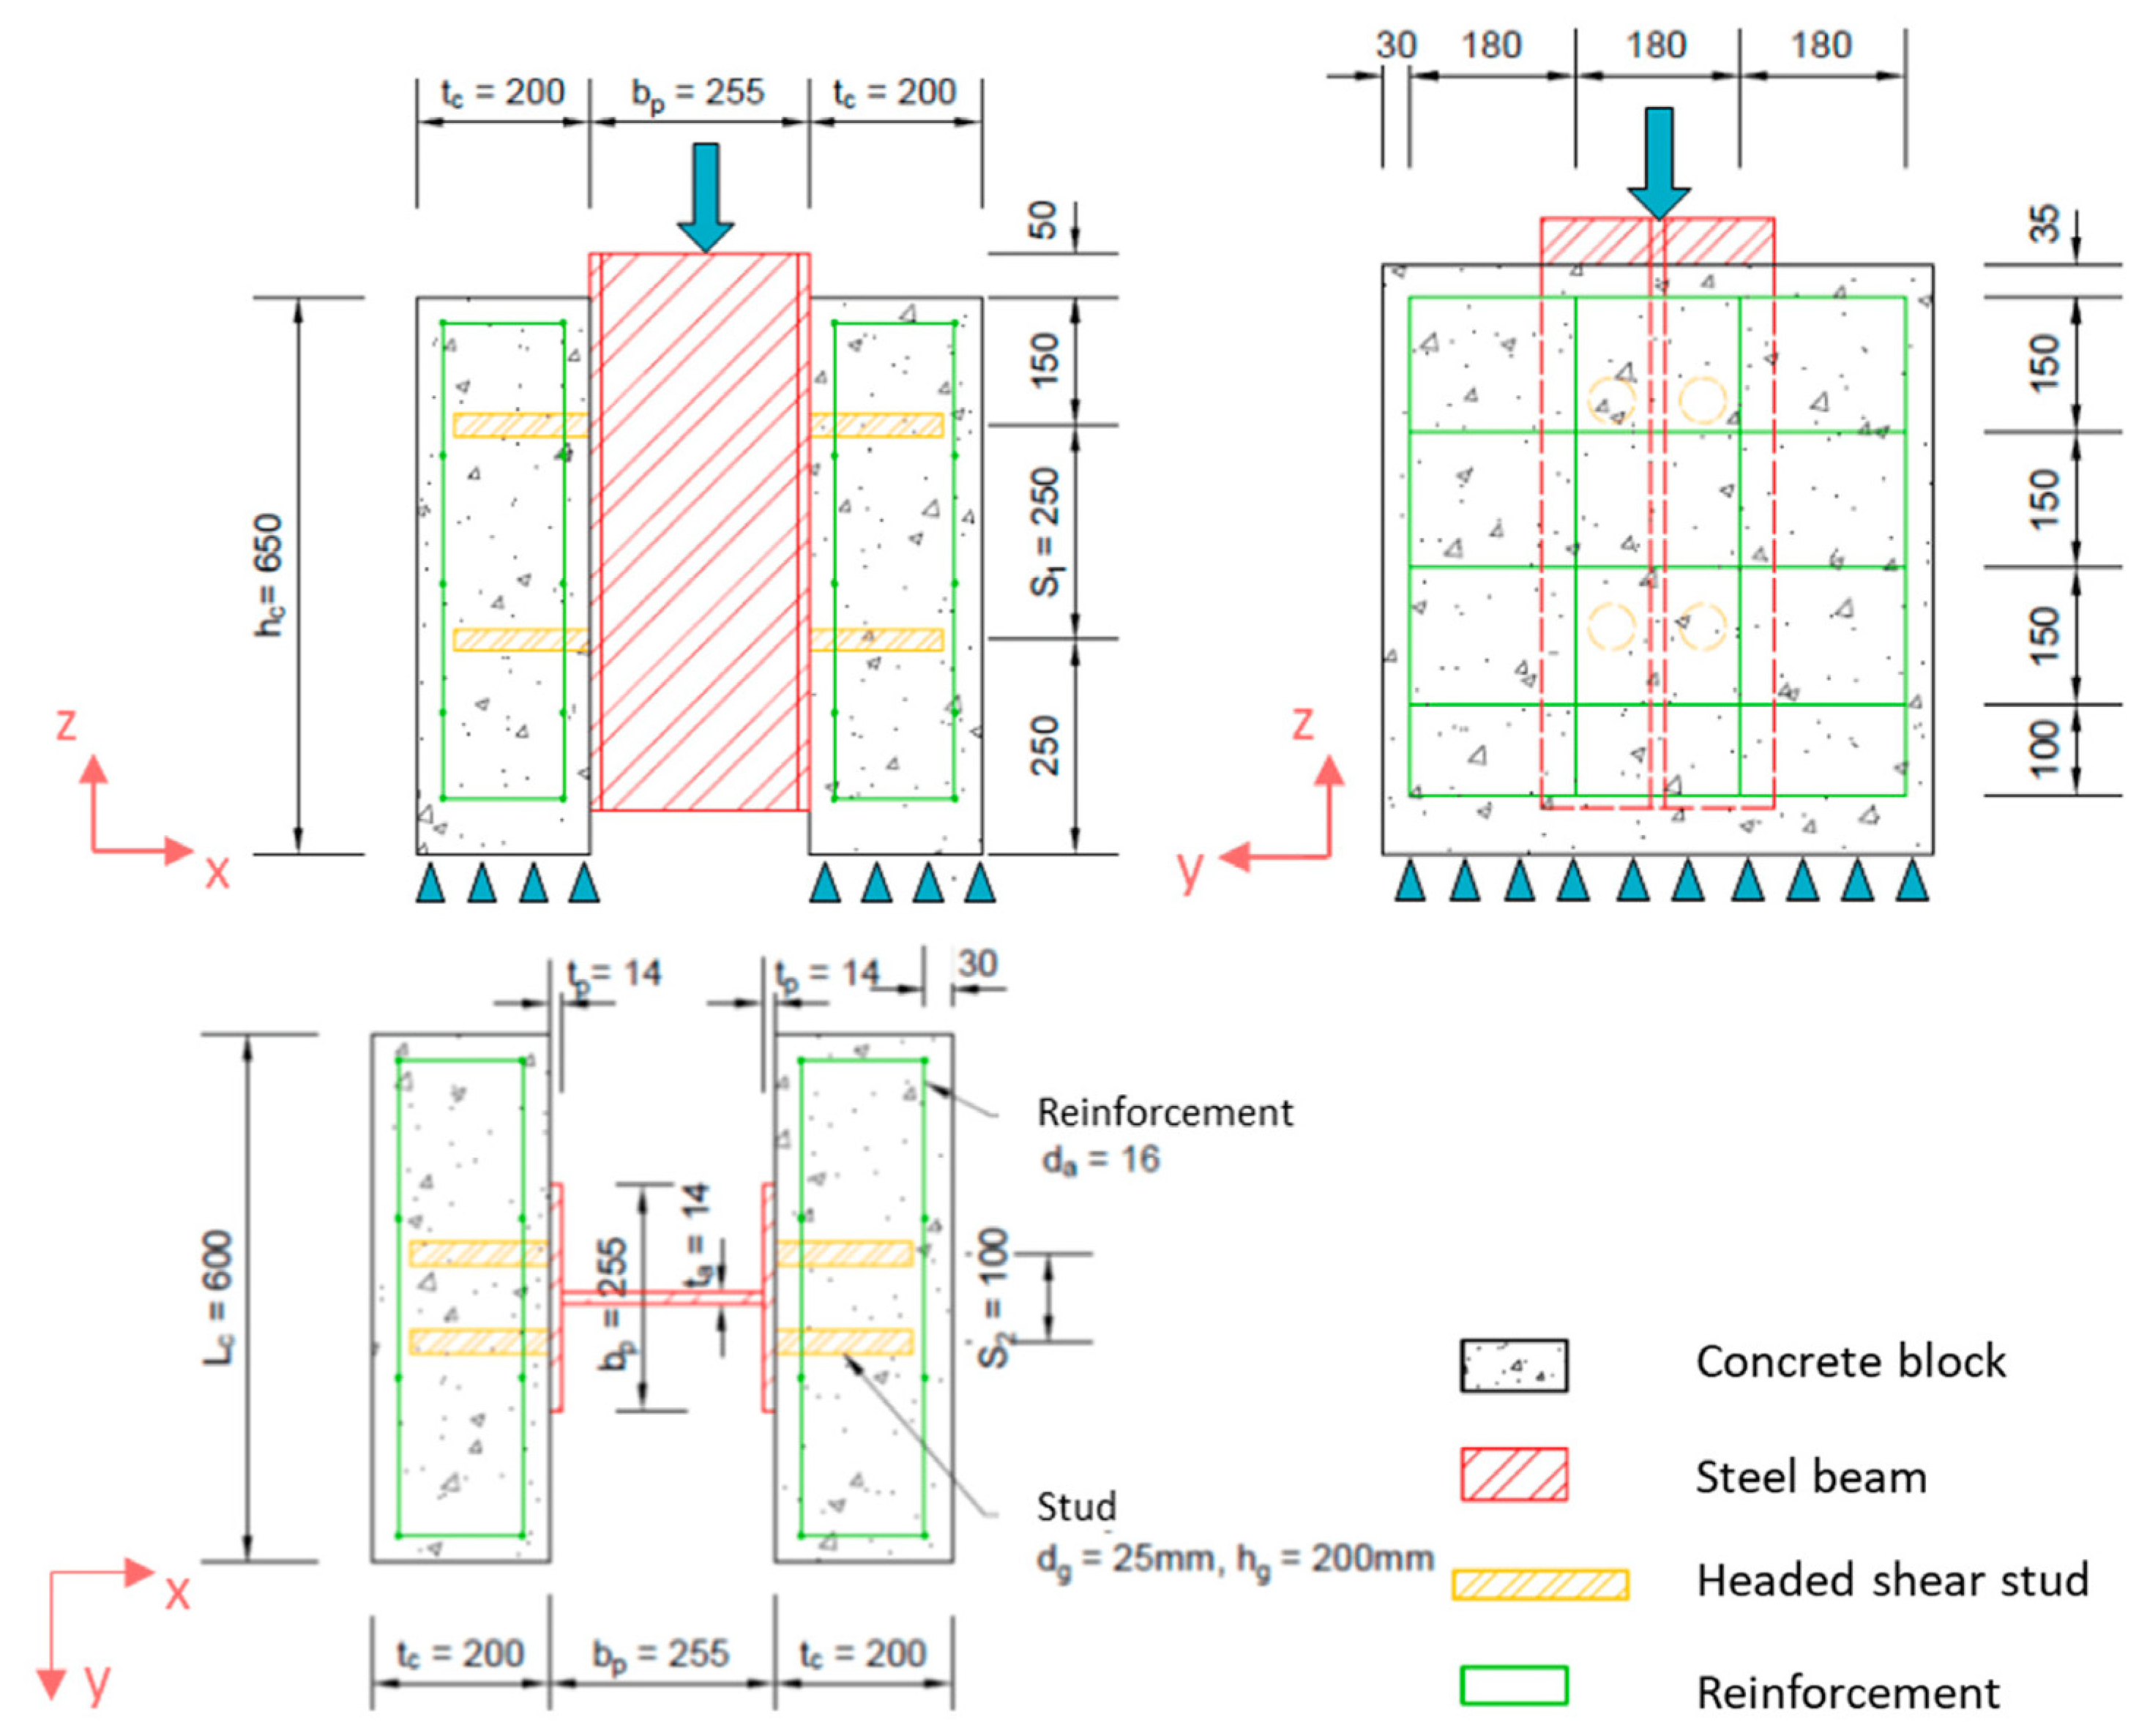
To evaluate the performance of Mazars’ RT model in a case with structural compression, this section aims at replicating the experimental results from [15]. The pushout test thereby described was performed on large stud connectors to assess their behavior when their dimensions are outside the range of common design codes. The test setup was designed according to the normalized test setup in Eurocode 4 [28]. It comprised a W-flange short beam, on the flanges of which eight shear connectors were welded. Two reinforced concrete slabs were cast around the shear connectors in a horizontal position to imitate typical construction layouts. A schematic diagram of the complete test setup is provided in [15]. An adapted diagram [29] is displayed in Figure 3. After the concrete had cured, a compressive load was applied onto the top of the steel beam (see the top-left part of Figure 3) to test the shear capacity of the studs.
This contribution aims at replicating the ST-25A tests from [15]. The simulations were performed using the CAST3M 2022 implicit finite element software [30]. Some post-processing was performed using the Matplotlib 3.8.0 library in Python [31].
The three samples of this set showed shank failure, which corresponds to the failure of the steel close to the weld due to excessive shearing. The main dimensions for the specimens are summarized in Table 1.
The material parameters adapted from [15] can be found in Table 2. Regarding the concrete, only the compression strength of the concrete is provided; therefore, the other parameters are estimated using Eurocode 2 [23]. The compressive fracture energy is estimated using Equation (1) [18], and the tensile fracture energy is taken using the default value of 150 N/m.
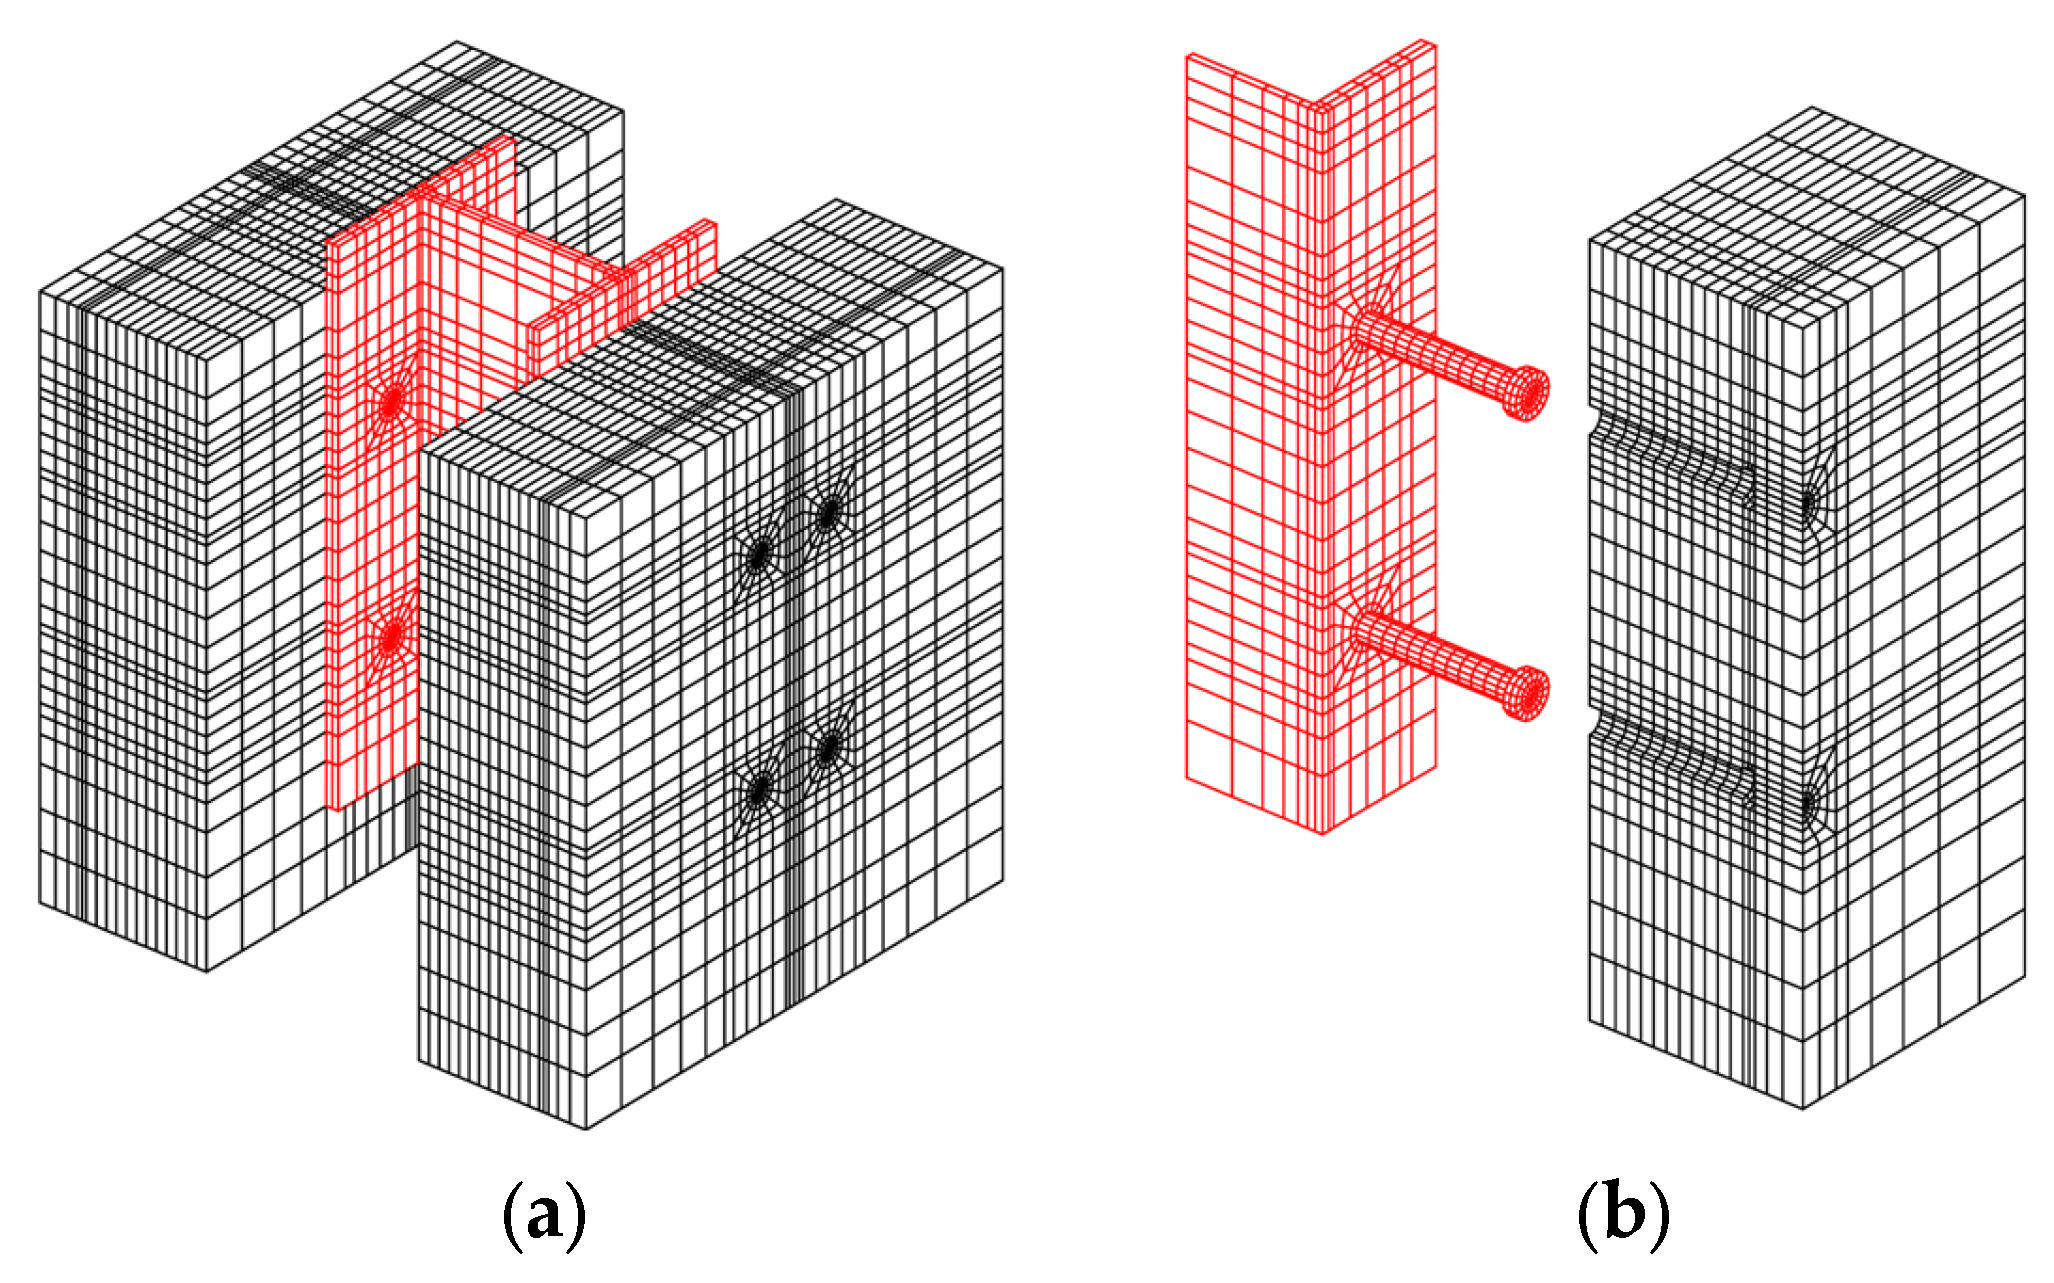
Figure 4a shows a 3D mesh of the pushout test. To save simulation time, the mesh is reduced to one fourth, as displayed in Figure 4b. Local mesh refinement is chosen to avoid significant jumps in element densities where possible, while keeping a mesh containing hexahedral elements only. This leads to increased mesh refinement next to the studs. 1D elements are embedded into the concrete slab to represent the rebar, with perfect adherence conditions to attach them to the concrete volume. All steel–concrete interfaces are simulated by frictionless contacts. These non-penetration conditions are created on the interfaces between the flanges of the beam, the studs, and the concrete slab. Such boundary conditions are assumed to be along the normal vector to the surfaces and cannot exert tangential forces.
Due to the geometry of the test setup, a shear band develops in the weld between the studs and the flanges of the steel beam. Plasticity being an atomic scale phenomenon, a correct description can only be attained through highly refined meshes. As previously suggested [14,32], a cohesive zone model consisting of 0D plastic elements can be used to describe the junction between the nodes in the stud and the corresponding nodes in the W-flange beam. The plasticity criterion of the 0D elements is set to the maximum shear force of the stud according to Eurocode 4 [28], with appropriate weighting to account for the surface that each node covers within the elements to which they belong.
Three meshes with increasing densities are considered in this study. The coarse mesh is displayed in Figure 4b. The refined meshes are obtained by multiplying all element densities by a factor of 1.5 and 2. Here, the elements are linear hexahedral elements. The numbers of nodes in the coarse and refined meshes are 11,090, 30,564, and 76,655. Using the material parameters in Table 2, the Mazars’ RT parameters are equal to the following: A c = 1.18 , B c = 1.54 , and ε d 0 = 1.01 × 10 4 . B t is estimated using Equation (12).
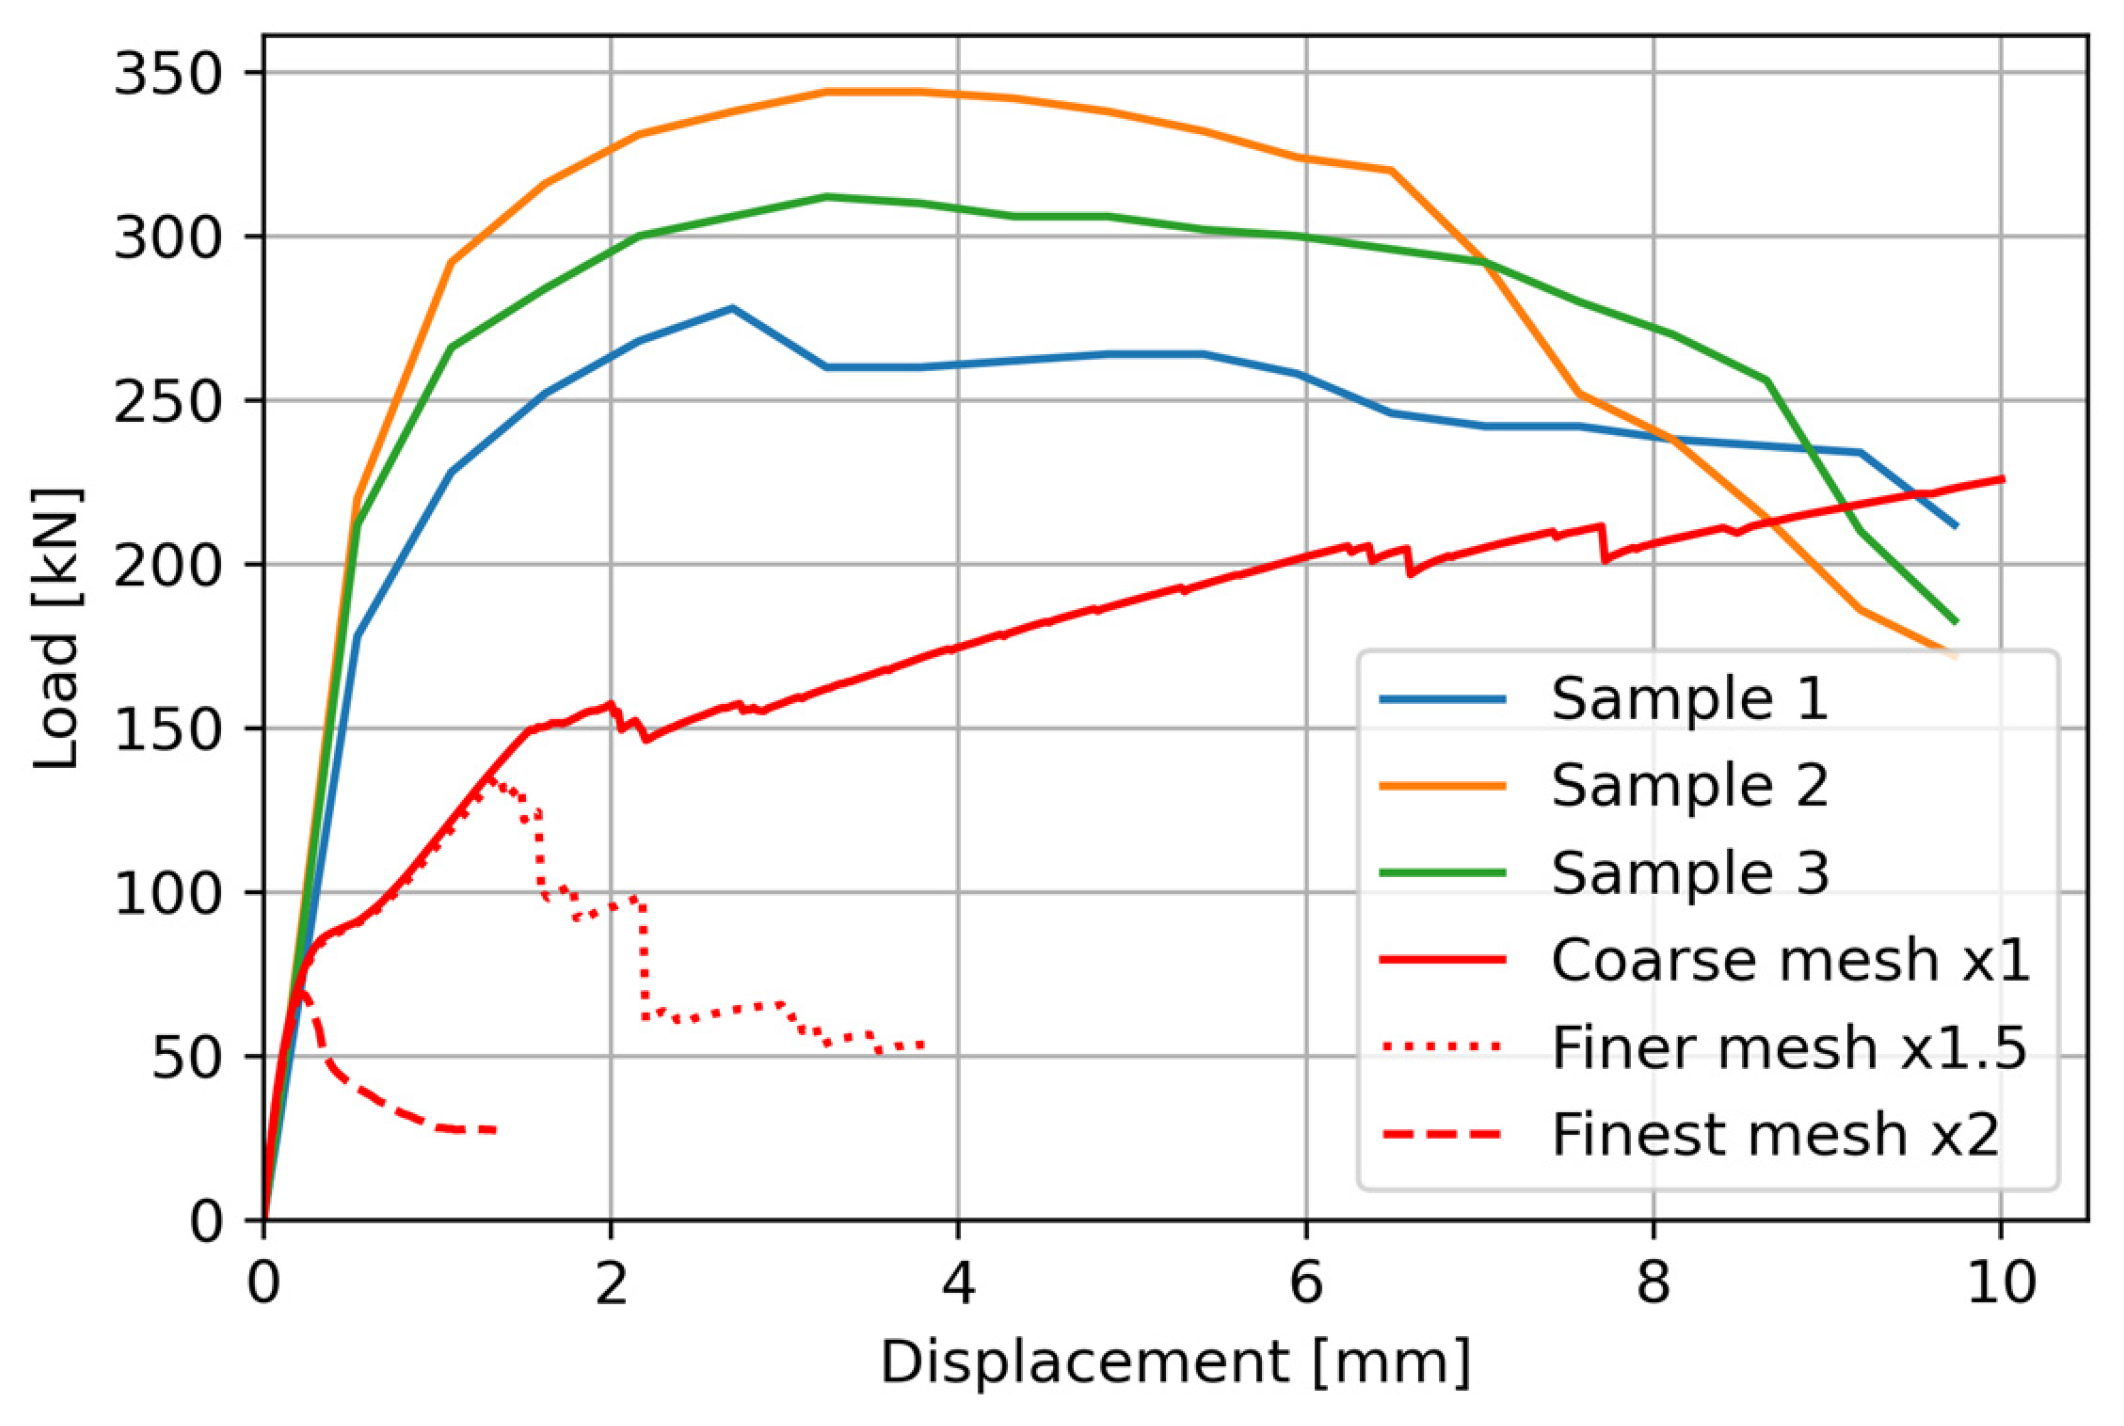
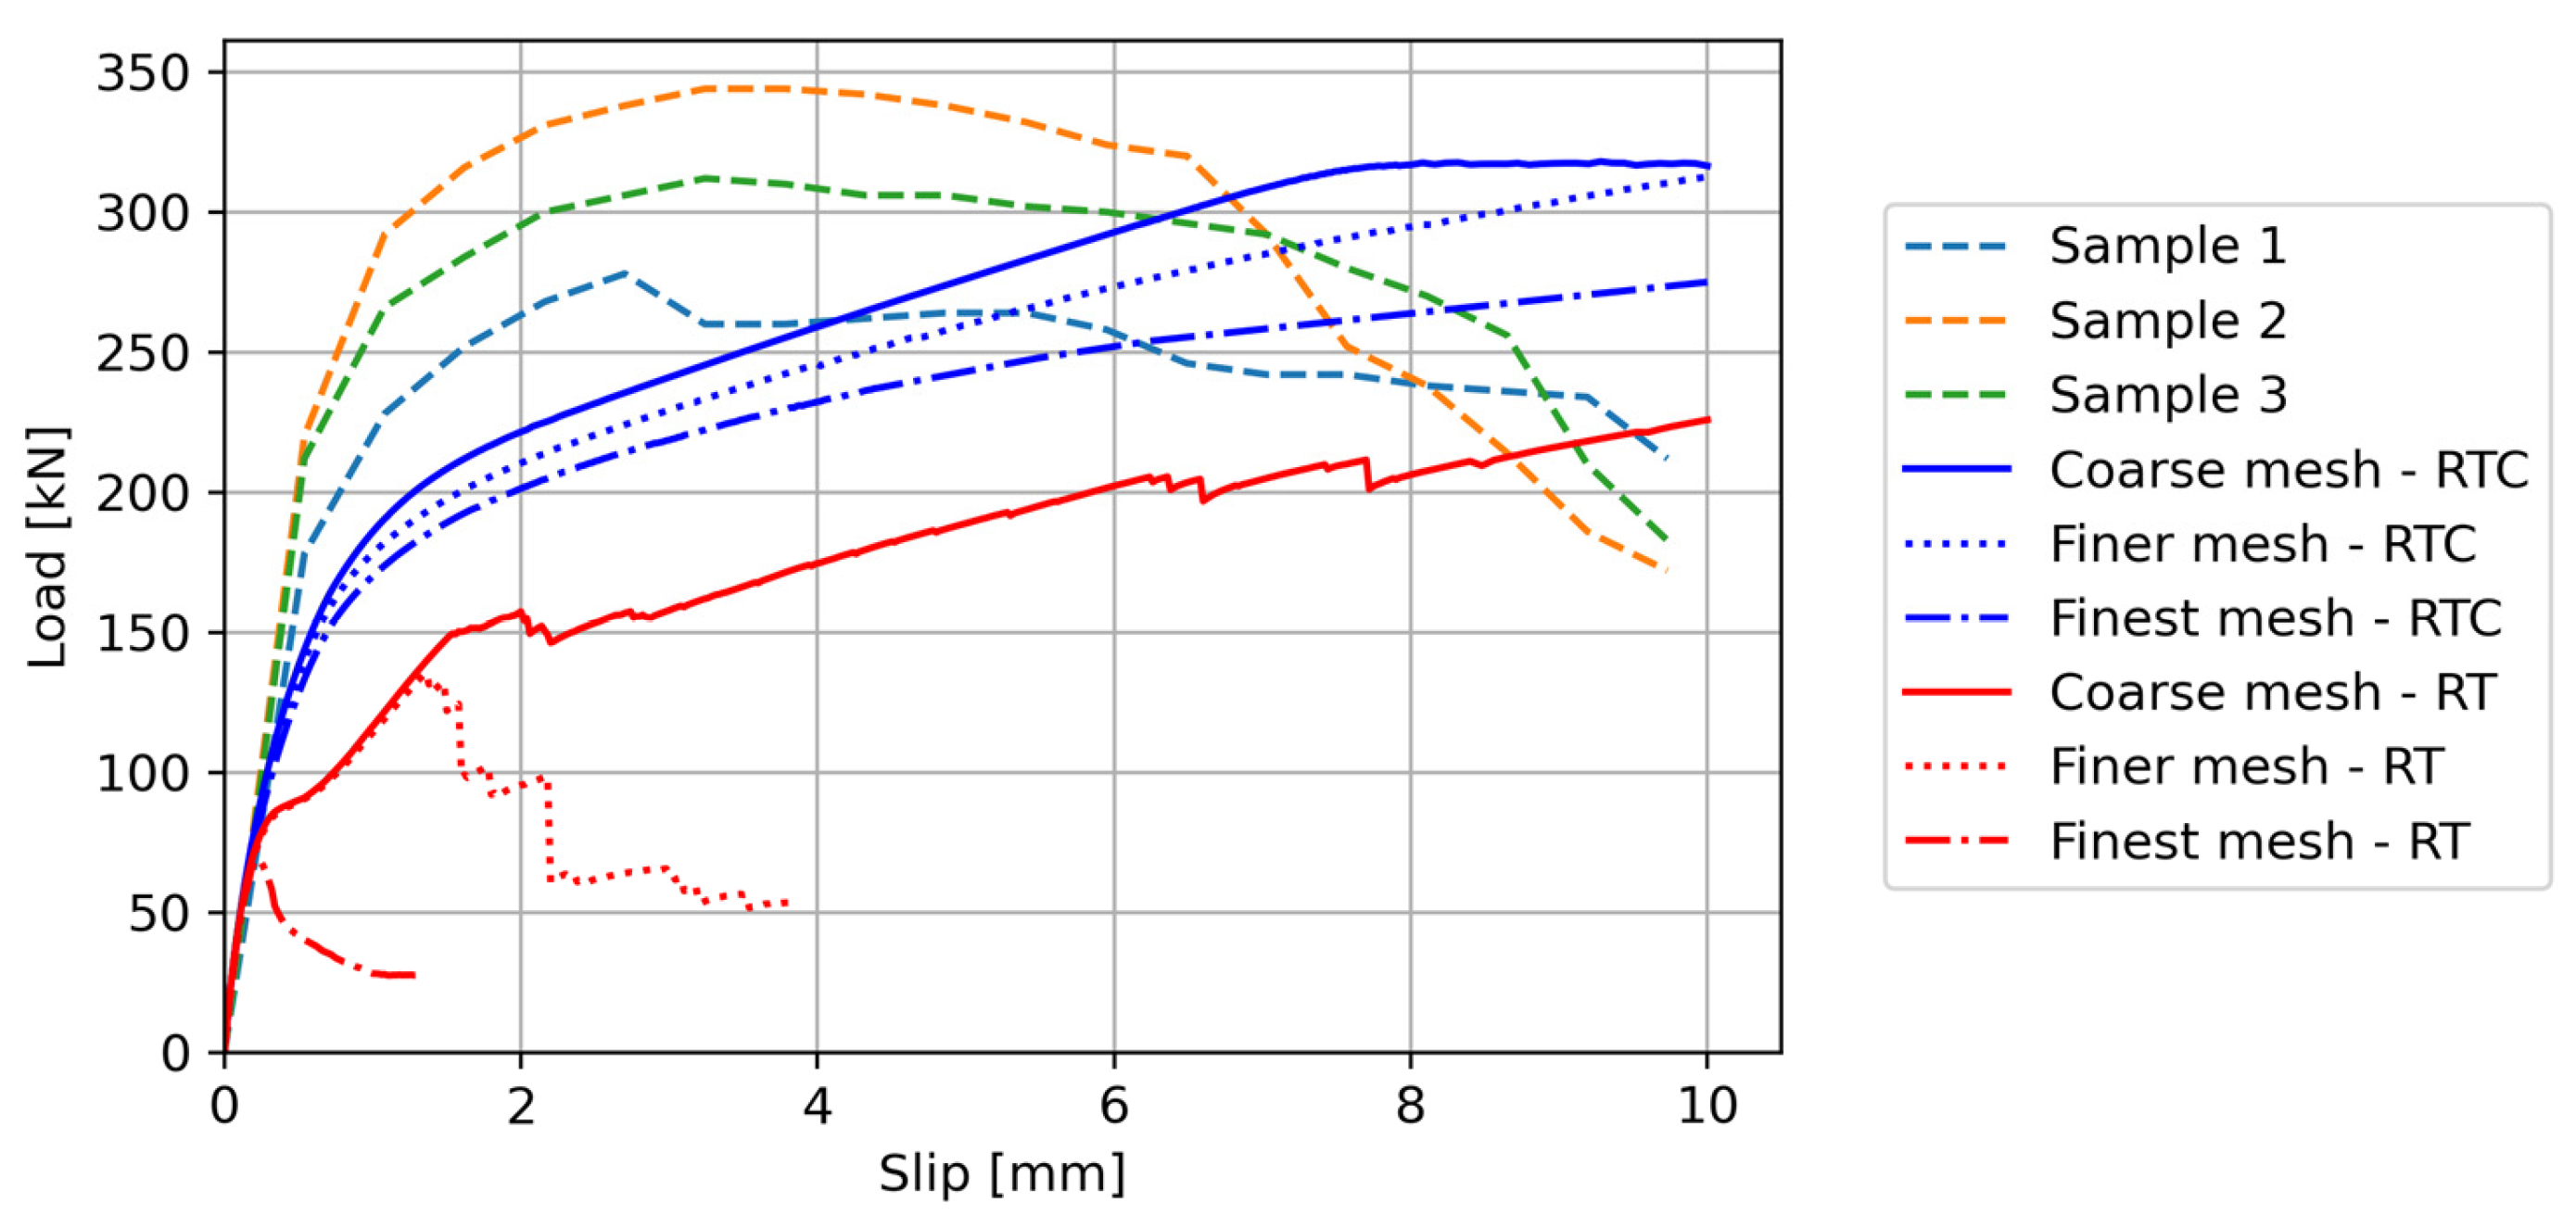
The load–slip curves that resulted from the finite element simulations on the coarse and on the refined meshes are displayed in Figure 5. The initial slope of the pushout test (up to 75 kN) is in good agreement with the results of the experimental pushout test. However, later in the loading, it is shown that despite the regularization of the tension law, the results exhibit mesh-objectivity issues, as the curves of the refined simulations fail earlier than that of the coarse mesh. Moreover, be it for the coarse mesh or the refined meshes, both simulations display early rupture when compared with the experimental curves.
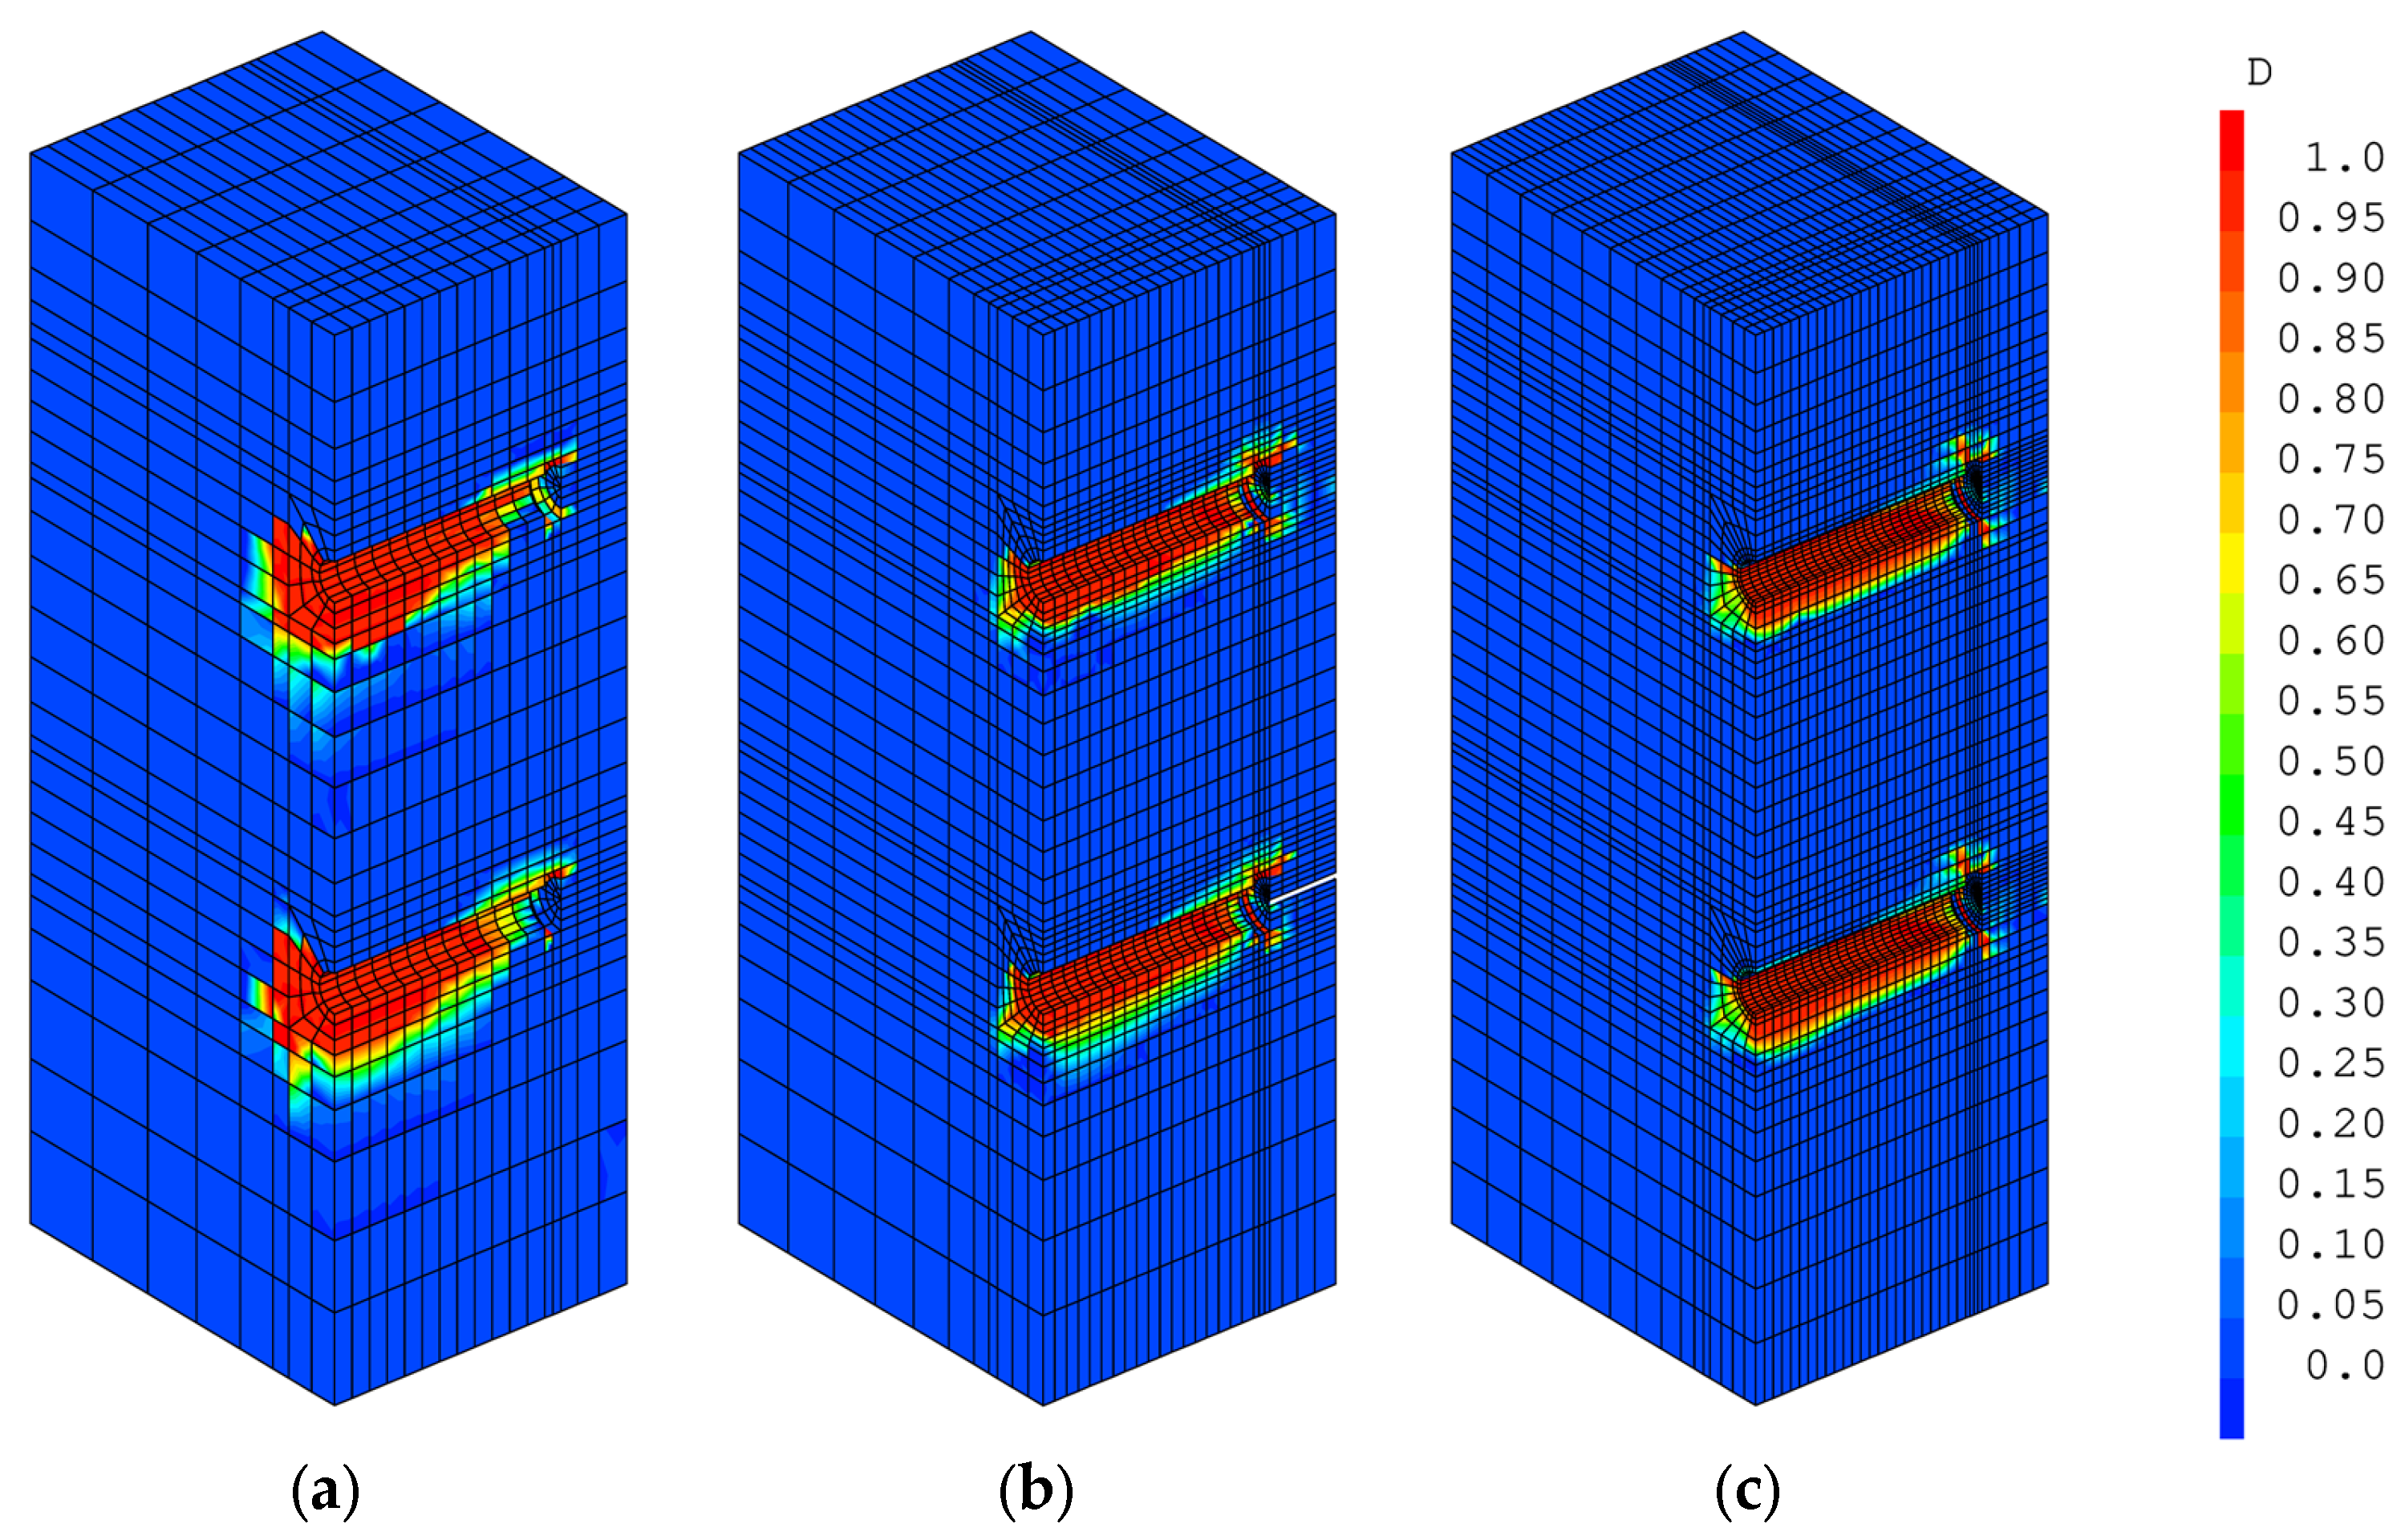
The two damage patterns in Figure 6 display high levels of damage under the studs, along their whole length. As previously mentioned, only compression can occur at the stud–concrete interface due to the interaction being modelled using unilateral conditions without friction. The pushout geometry imposes that the elements next to the studs are the finest in the mesh. Therefore, without regularization, these elements cumulate two issues: they are under the highest compression loads, and they absorb the least amount of energy by being the smallest; hence, they are the first to fail and they limit the forces that can be transmitted.

3. Towards a Regularized Model in Compression

3.1. Proposition of a Modified Mazars’ Model Combining Tensile and Compressive Energy Regularization

The limitations to the model that were shown in the previous section motivate the need for a regularized model in compression, so that the energy that is absorbed by an element during its fracture process stays constant. The initial compressive damage evolution law of Mazars’ O model does not allow for an easy energetic regularization in compression. To a certain degree (for low compression fracture energy and moderately refined meshes), it is possible to keep the original damage law and calibrate the parameters A c and B c with respect to the size of each element to ensure that the maximum stress is f c and that the correct energy G f c is dissipated during the element’s rupture, as performed in [14]. However, for a given compression fracture energy, it can be shown that A c and B c must decrease to zero when the size of the elements decreases. In uniaxial compression, Mazars’ RT and Mazars’ O formulations in compression ( d c in Equation (8), with α c = 1 and κ = 2 ν ε I ) imply the existence of a residual stress in uniaxial compression when A c < 1 (see Equation (14)).
lim κ + σ I = lim ε I E 1 d c ε I = E 1 A c 2 ν ε d 0 0
where σ I is the stress along the compressed axis. Therefore, if A c and B c are calibrated with this method, the smallest elements exhibit the highest residual stress in compression. This has two consequences regarding:
  • The definition of the facture energy (as written in Equation (2)), as the stress never goes back to zero; hence, the absorbed energy according to Equation (2) tends to infinity;
  • The physical consistency of the model, as the residual stress is mesh-dependent, located between 0 and E ε d 0 / 2 ν = 3.5 f t (with the Poisson ratio set to 0.2).
Furthermore, the strain at the compression peak stress no longer remains a constant across the mesh, as A c and B c cease to be calculated as functions of this parameter. A solution to these limitations can be obtained by modifying the compression damage law, using the same approach as the adaptation of the tension law from [26] to the Mazars’ model performed in Section 2.2. This model will be named “Mazars RTC” in the following as a shorthand for “Mazars with regularization in tension and compression”. For example, a damage law for compression was proposed in [20]. Its expression is modified according to Equation (15) in order to account for various additions in this contribution. It consists of the following five main phases:
  • An initial elastic phase between strains 0 and κ c , t h r e s .
  • The first softening phase is adapted from the Model Code 2010 model for non-linear concrete [33].
  • The second phase is a plateau at the stress f c between the strains ε c 1 and ε c 2 .
  • The third phase is a linear softening branch from f c to 0, between the strains ε c 2 and ε c u .
  • A fractured phase where d = 1 (or a close value to avoid zero-stiffness) after having reached ε c u .
d c =     0 ,   i f   κ c κ c ,   t h r e s 1 k κ ¯ c     κ ¯ c 2 1 + k     2 ε ¯ c f c E ε ~ c ,   i f   κ c ε c 1   1 f c E ε ~ c ,   i f   ε c 1 < κ c ε c 2   1 + k 1 E k 2 E κ c ,   i f   ε c 2 < κ c ε c u     1 ,   i f   κ c > ε c u where   κ c = κ / 2 ν     and   κ ¯ c = κ c ε c 1
The parameter κ c is related to the maximum equivalent strain κ by dividing it by 2 ν . It corresponds to the strain that should be applied to a cube under uniaxial compression to keep the same equivalent strain κ . In this work, it is named uniaxial equivalent strain. κ ¯ c is a dimensionless parameter adapted from the Model Code 2010 [33]. It varies between 0 and 1, and is determined by the position of the uniaxial equivalent strain κ c between 0 and ε c 1 , the beginning of the plateau at f c .
The material parameters used in Equation (15) are obtained using Equation (16). k , k 1 , and k 2 set the slope of the curve at different points of the stress–strain behavior. The parameter controlling the dissipated energy is ε c u . In uniaxial compression, it corresponds to the strain ε I at which an element’s stiffness is fully annulled. Similar to the tension case, larger elements than 2 G f c / f c 2 ε c 2 ε c 1 introduce the possibility that ε c u is lower than ε c 2 . With typical concrete material parameters ( G f c = 50   kN / m , f c = 35   MPa , ε c 2 = ε c 1 = 2.3 × 10 3 ), this condition is met when elements are larger than about one meter (here, 1.24 m). Assuming the relationship between G f c and f c in Equation (1), the critical size becomes 17.6 / f c 2 ε c 2 ε c 1 .
k 1 = f c ε c u ε c 2 ;   k = 1.05 E ε c 1 f c ;   k 2 = f c + k 1 ε c 2 ;   ε c u = 2 G f c h f c ε c 2 ε c 1
In Equation (16), E and f c are Young’s modulus and the compression strength, respectively. G f c is the compression fracture energy and h is the characteristic length for the elements. ε c 1 and ε c 2 are the two strain parameters bounding the plateau at peak stress.
It is worth mentioning that the first part of the softening law, as it was proposed in [20], leads to negative damage for uniaxial equivalent strains κ c comprised between 0 and κ c , t h r e s in Equation (17). Negative damage is deemed unacceptable in damage mechanics; therefore, a non-linearity threshold equal to κ c , t h r e s must be introduced.
κ c , t h r e s = 0.05 k ε c 1 1.05 + k k 2
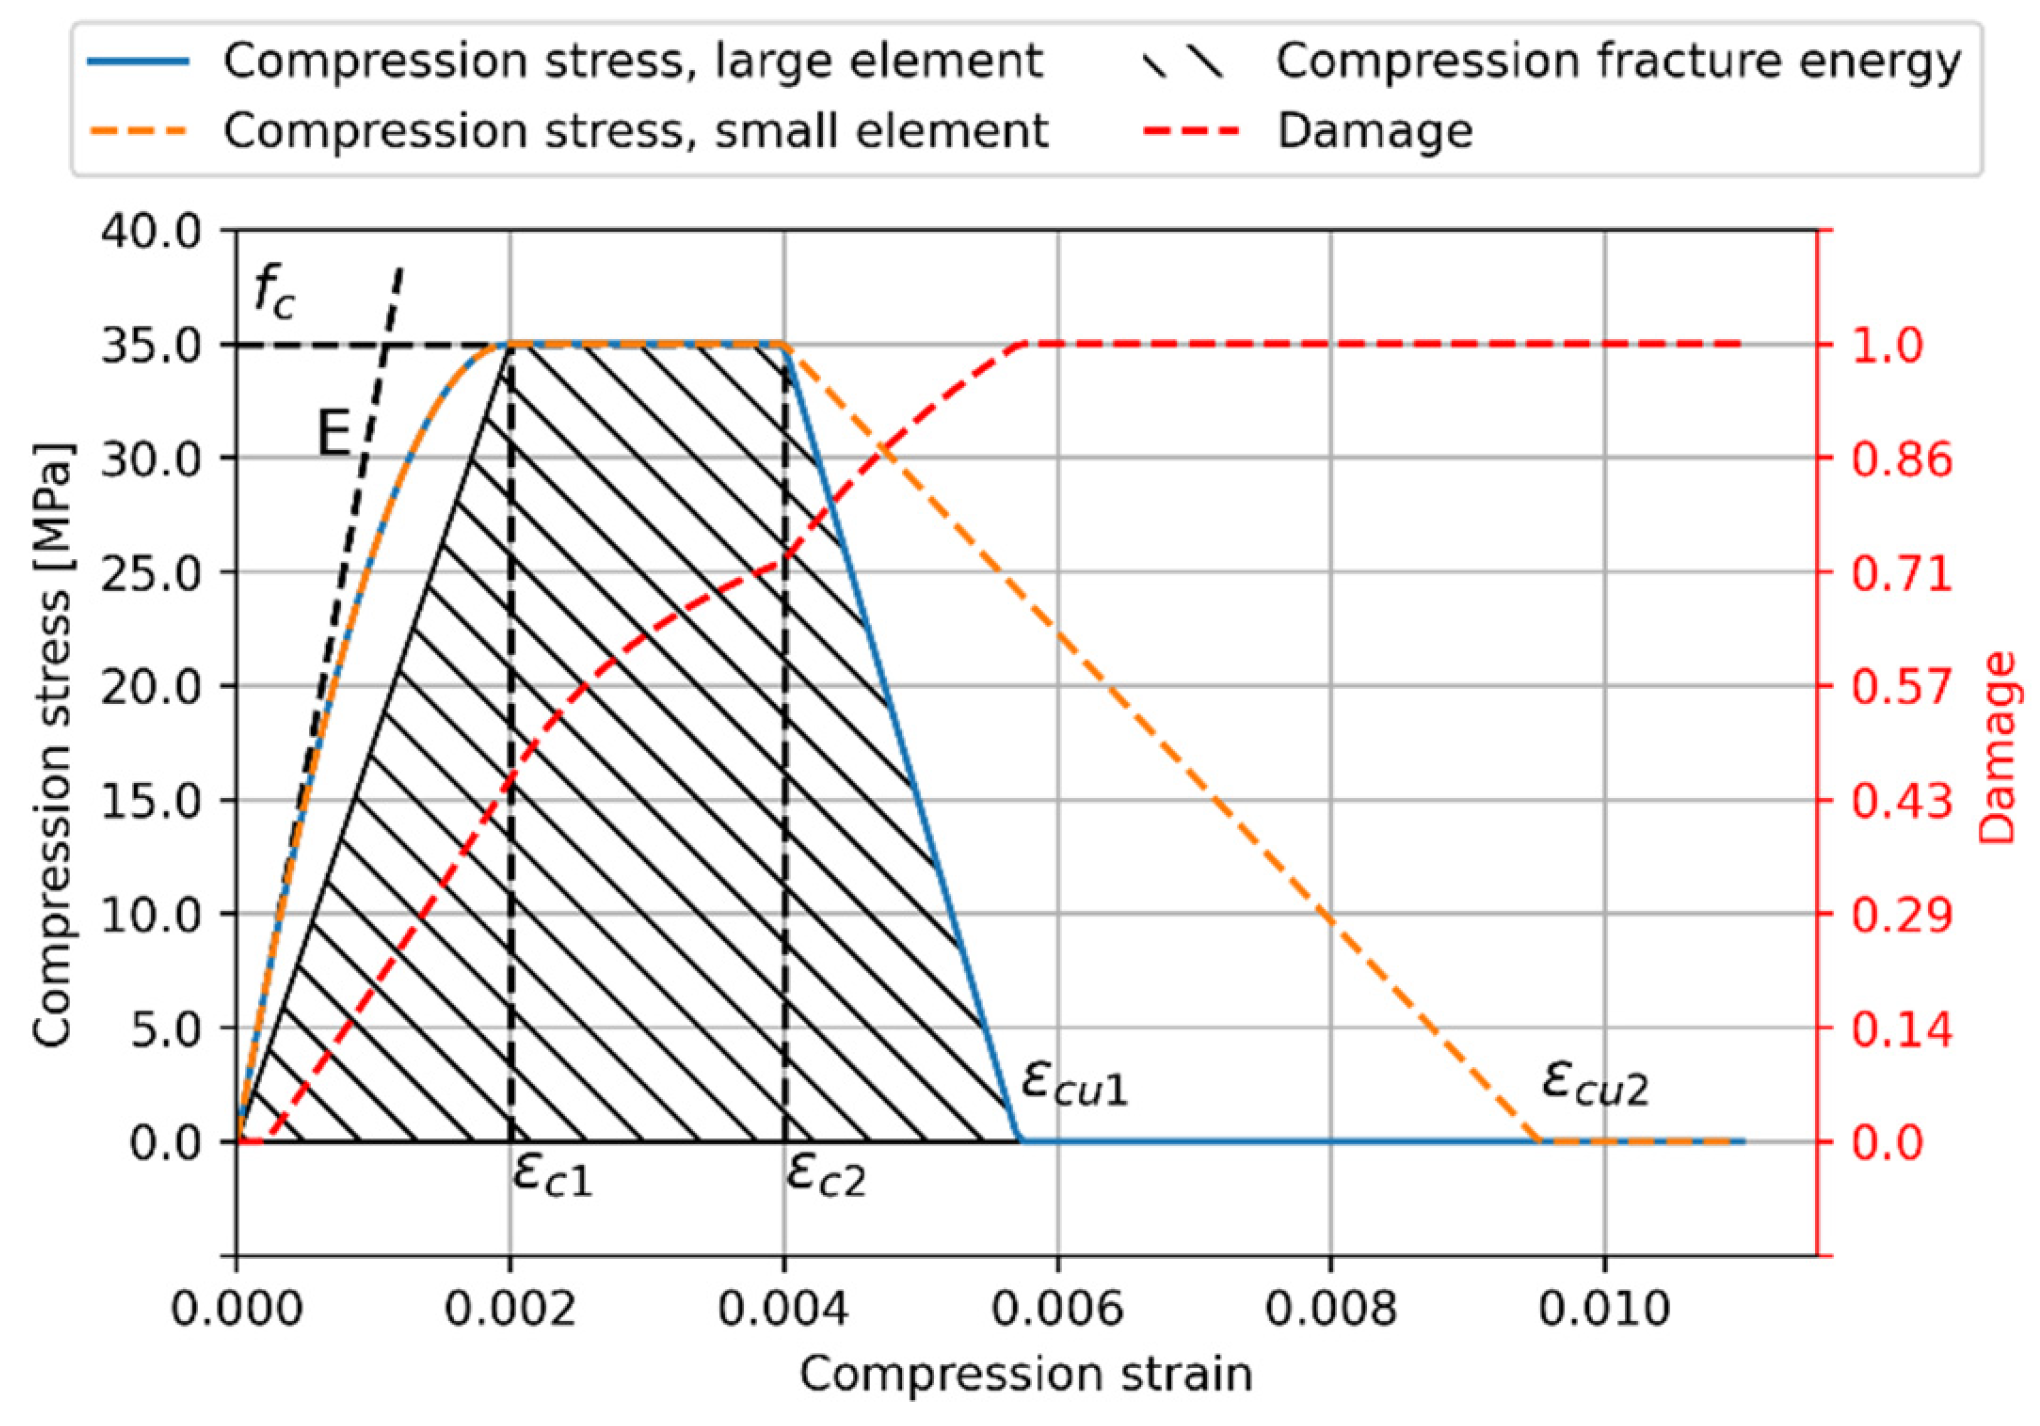
Figure 7 presents the new stress–strain model, with the plateau part expanded on purpose for a better representation of each part, along with the simplified integral for the compression fracture energy according to [20].
In the following, the plateau part of the compression law is removed by setting ε c 2 = ε c 1 because the identification of these strain parameters is not entirely clear. It is left in the formulation at the discretion of future users. Here, the strain at maximum stress is identified with the ε c 1 parameter from Eurocode 2 [23].

3.2. Validation on a Cube under Uniaxial Compression

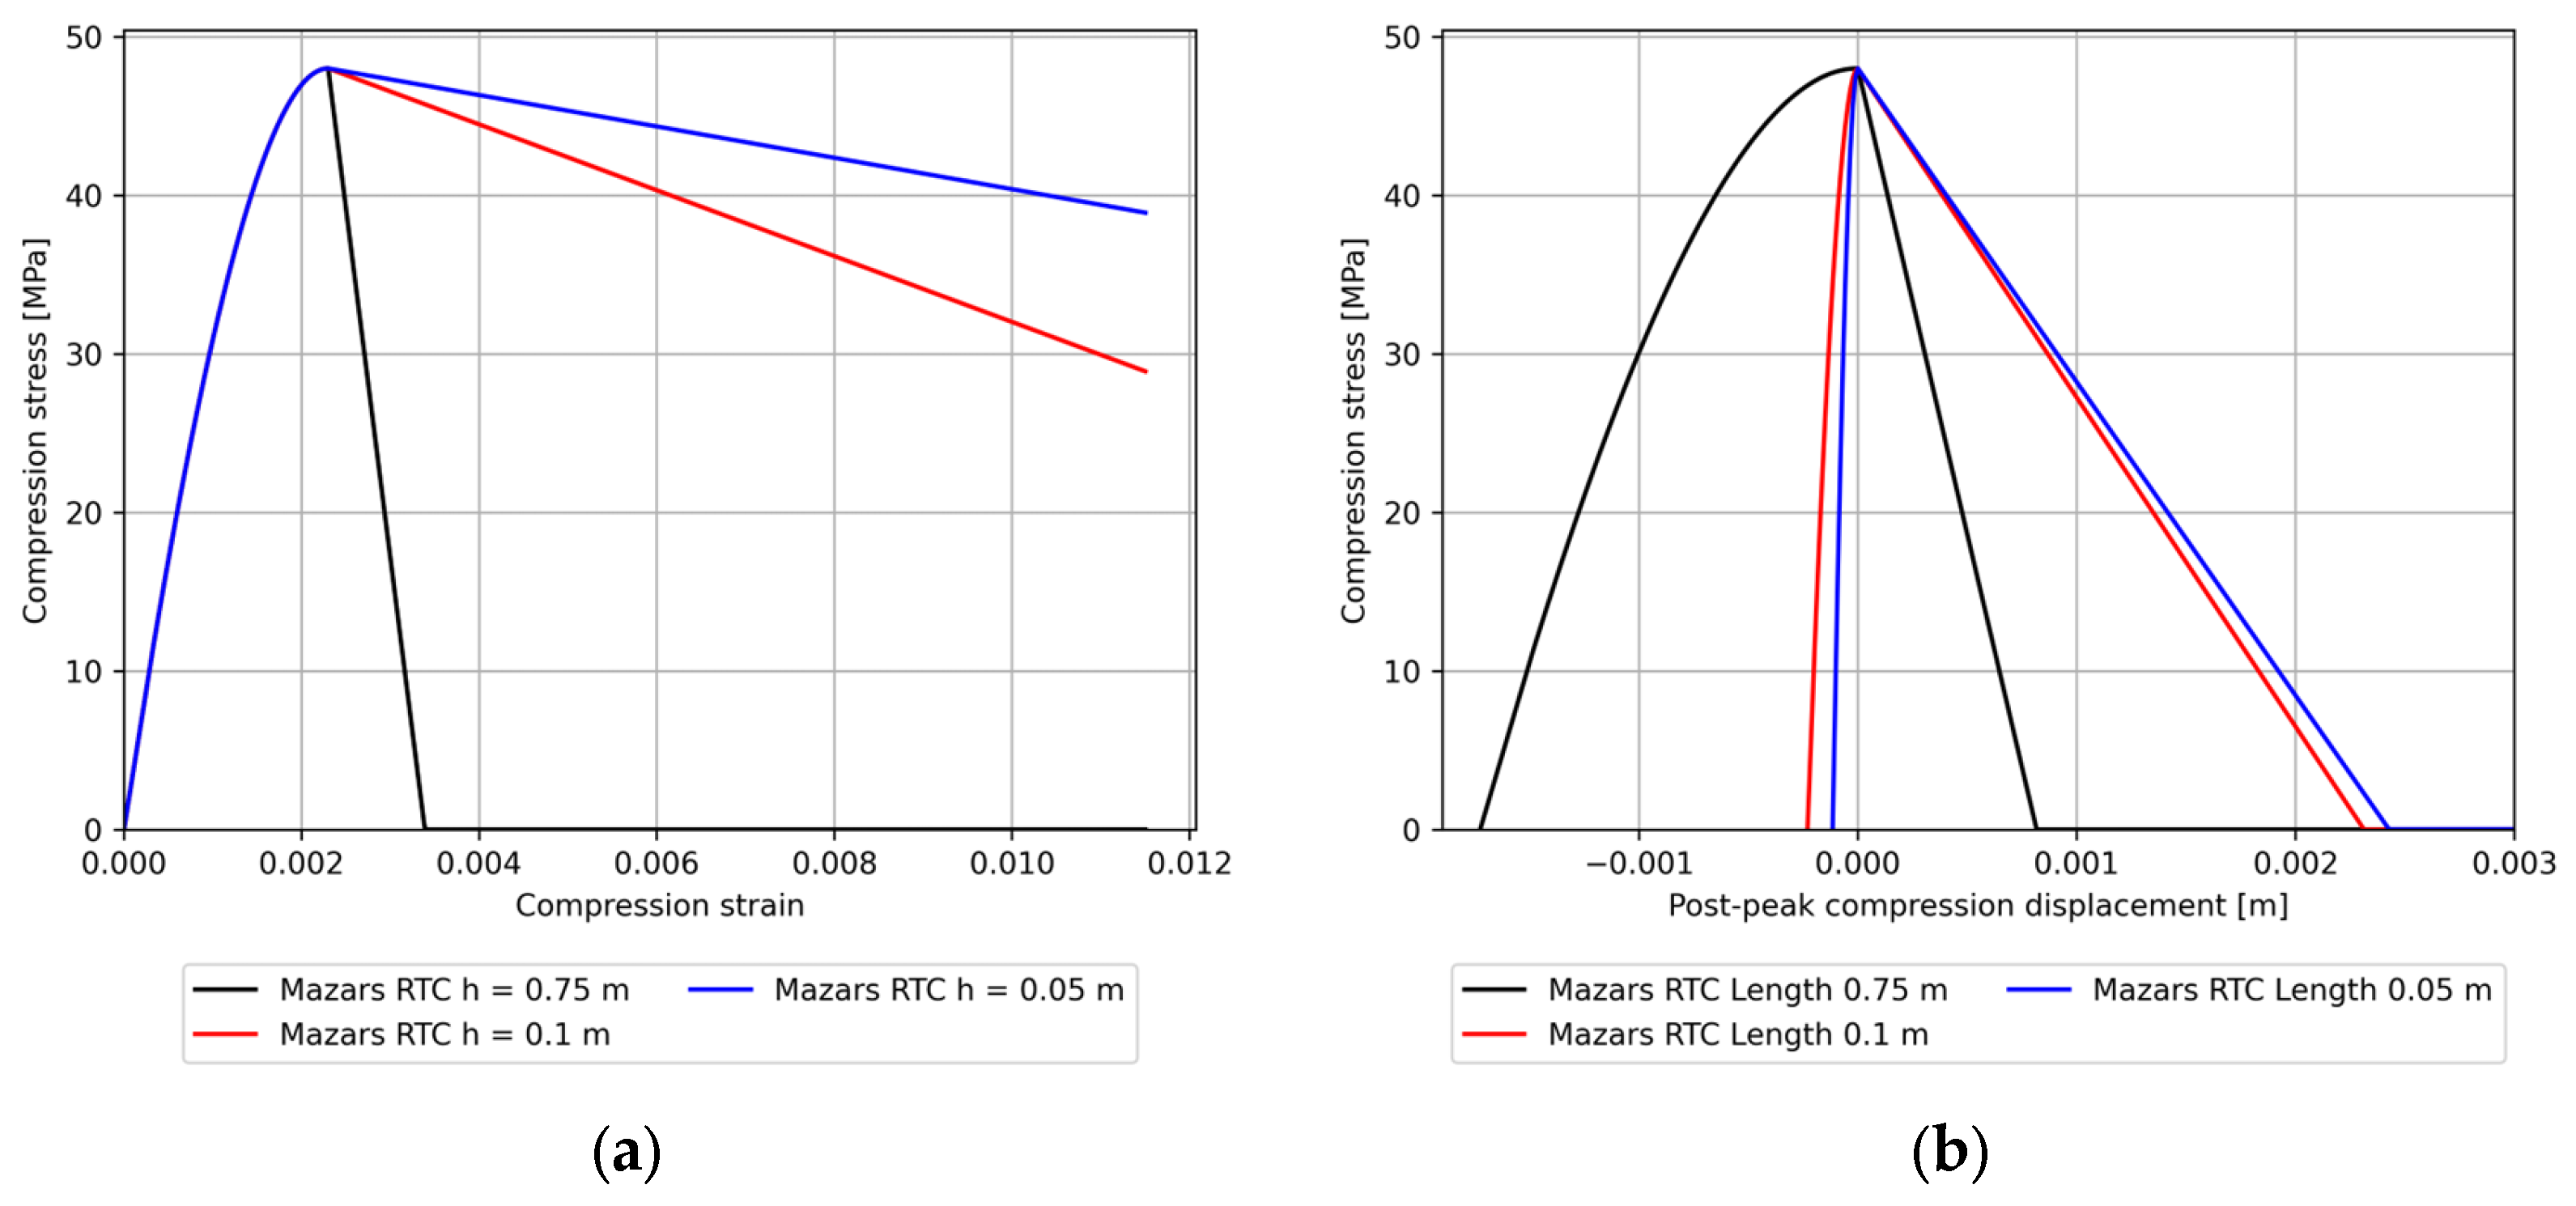
At this stage, the only modification compared to Mazars’ RT model has been performed on the compression damage law. It is first tested on a single cubic element. Figure 8 illustrates the resulting behaviors in stress–strain and stress–displacement for various cube sizes. The material parameters are chosen as follows: E = 35   GPa , ν = 0.2 , f t = 3.5   MPa , f c = 48   MPa , G f c = 60   kN / m , G f t = 150   N / m , and ε c 1 = 2.3 × 10 3 . The Mazars’ RTC parameters resulting from the expressions in Equations (9), (12), and (16) can be found in Table 3.
The stress–strain graph (left of Figure 8a) shows the superposed pre-peak responses of the Mazars’ RTC models, but the decreasing branch differs with the size of the cube. The stress–displacement graph (right of Figure 8b), illustrates the adequate energetic regularization. The post-peak mechanical responses are adjusted relative to the pre-peak behavior to keep the area under the curve constant overall.

3.3. Cube under Bi-Axial Compression

The Mazars’ RTC model from this work benefits from the same corrections and improvements as presented earlier, namely the shear correction proposed by [22] and the improvement in bi-compression [25].
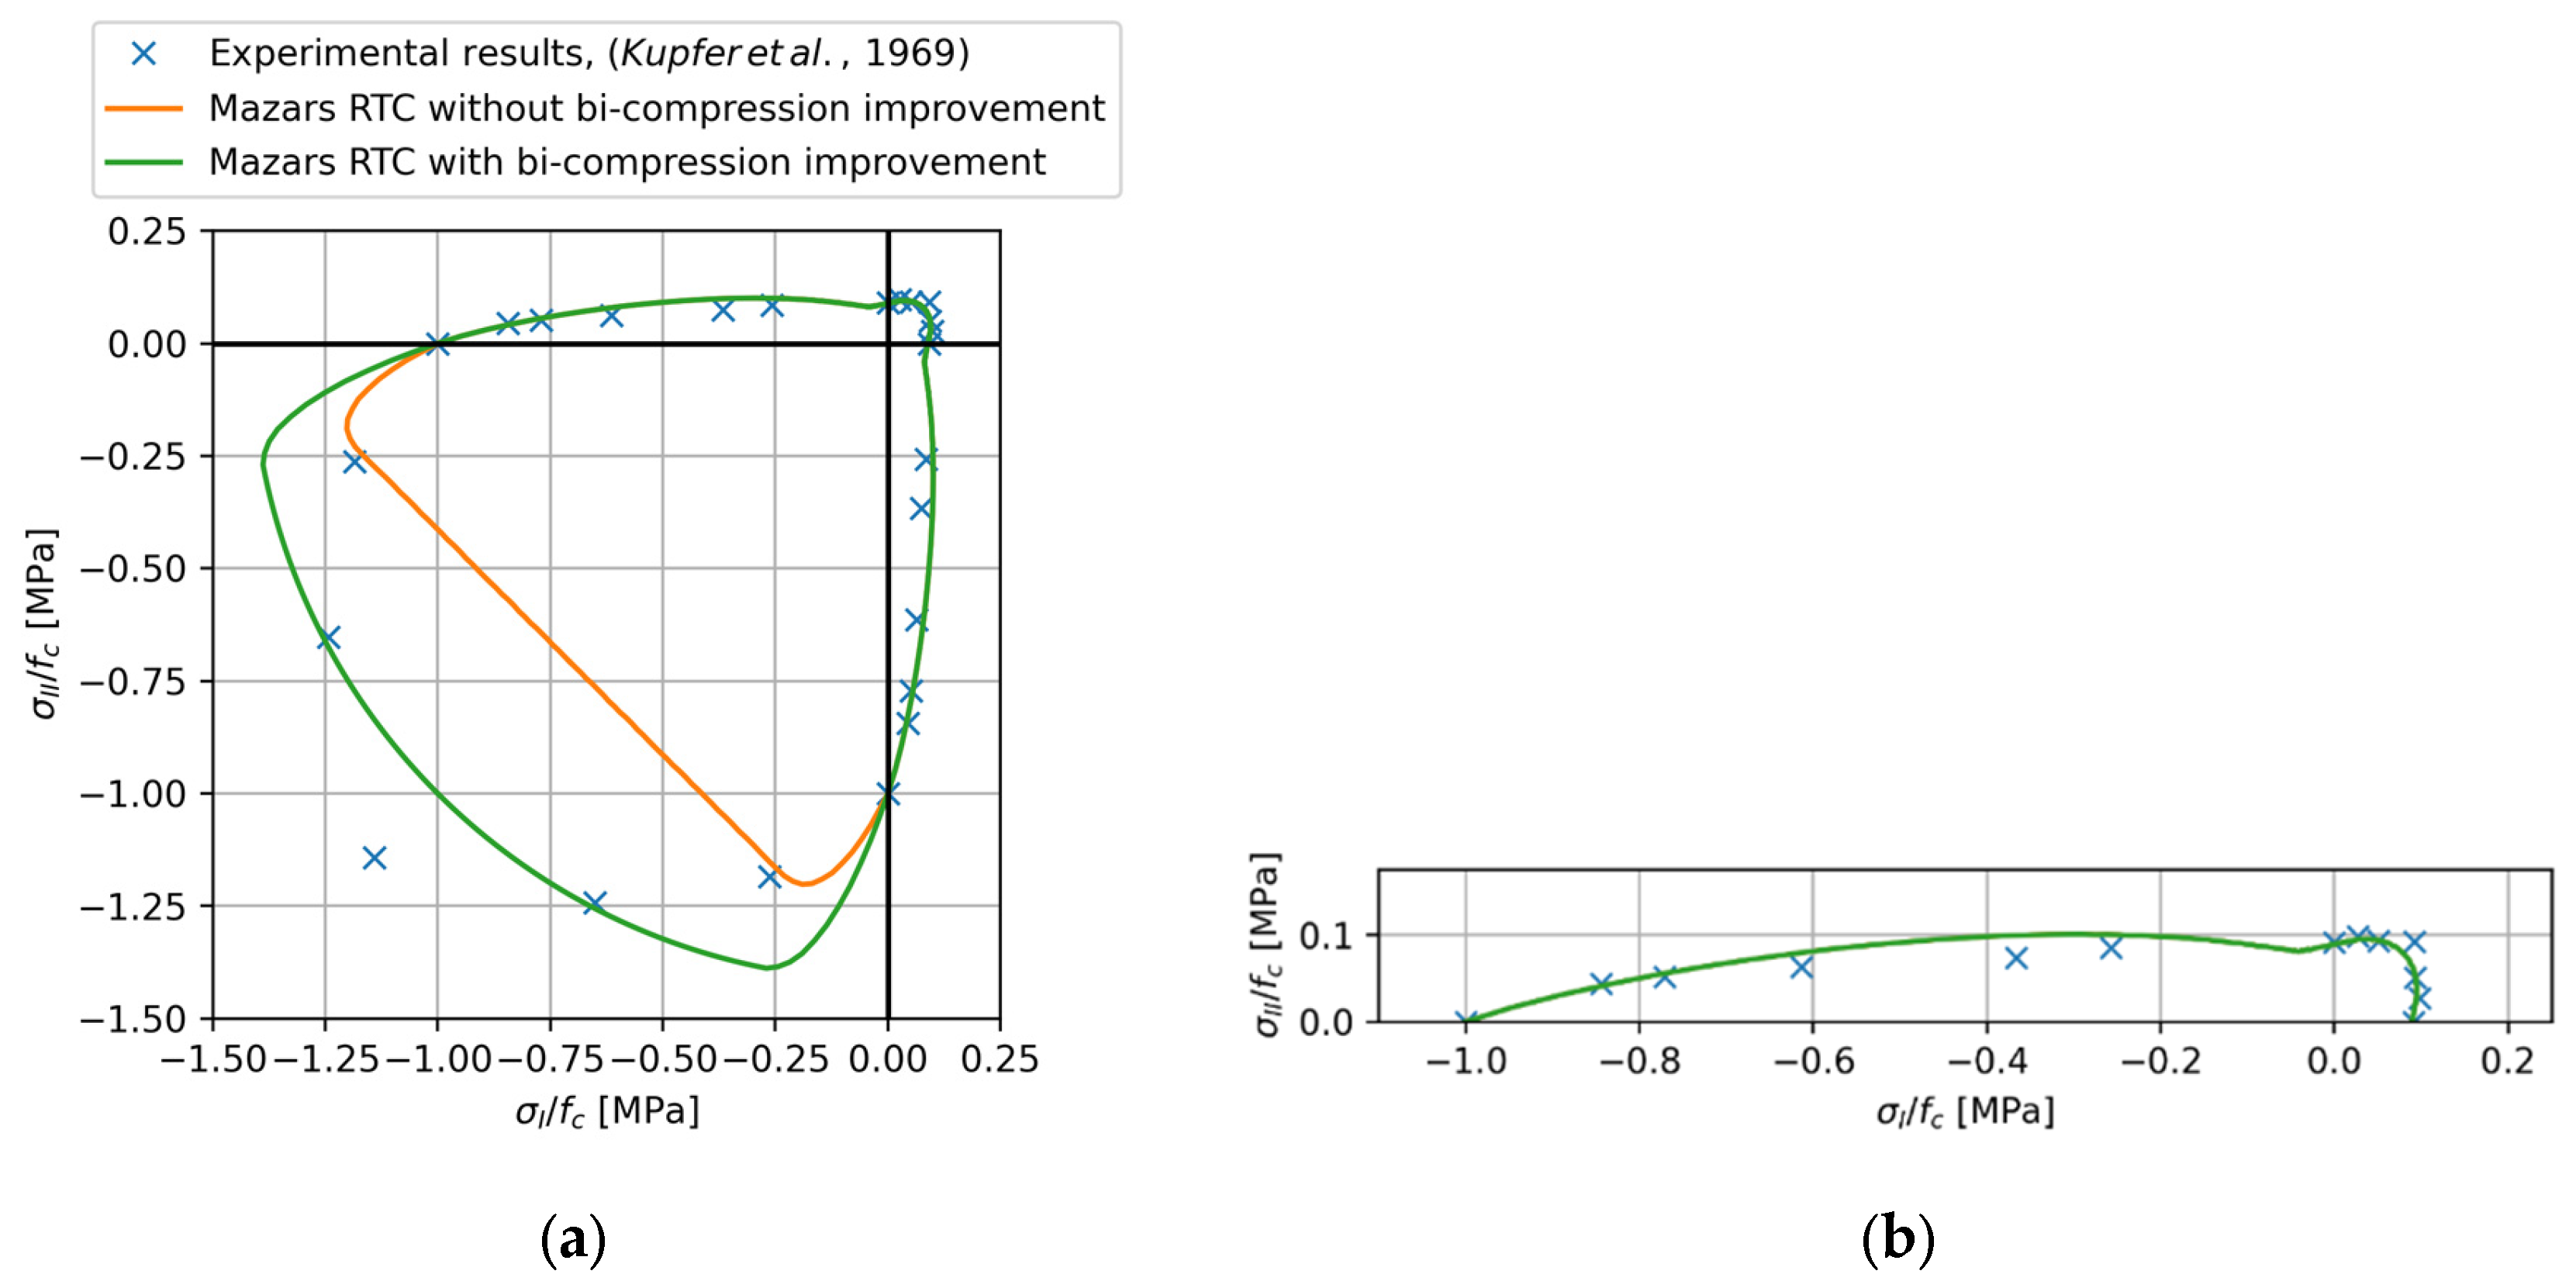
The graph of Figure 9 is constructed by subjecting a cube to a force load in tension or in compression along two of its principal directions. The lines represent the last stress state for which the simulation converged. Under these loading conditions, the loss of convergence occurs when the applied stress reaches the limit that the structure can support.
Figure 9 illustrates the effect of the bi-compression improvement method in comparison with bi-axial tests on 315 kp/cm2 (30.9 MPa) samples [24]. The maximum tension stress was measured at 9% of the compression strength. For the simulation, missing parameters such as Young’s modulus and the strain at compression strength are identified through the empirical laws available in Eurocode 2 [23]. The identified material parameters are as follows: f c = 30.9   MPa , E = 30.9   GPa , ε c 1 = 2.03 × 10 3 , ν = 0.2 , and f t = 2.78   MPa . It is worth noting that the model accurately reproduces the experimental results in shear and bi-axial tension.
For bi-axial compression, the γ -improvement method leads to increased maximum stresses. The rupture surfaces in Figure 9 show that the introduction of the γ factor has improved the correspondence between the experimental data and the simulation in the bi-compressed zones.
The gaps are due to an erroneous evolution of the γ improvement factor, as its rate of decrease is excessive when the stress state is close to the axes. For low confinement ratios ( σ I I / σ I < ν ), the ideal value of γ should stay close to one. This would ensure that the rupture stays close to experimental values. It is interesting to note that the value of the confinement ratio beyond which the γ factor should ideally start decreasing is σ I I / σ I = ν , that is when the second principal strain ε I I turns negative.

4. Validation of Mazars’ RTC Model in Structural Compression

In this part, three test cases of increasing complexity are proposed to evaluate the impact of the compression energy regularization in FE simulations when the mesh is refined. The results of the simulations using Mazars’ RTC will be compared to those obtained without regularization in compression, namely by utilizing Mazars’ RT model. Mesh objectivity studies are usually performed in cases involving tension rupture, but have rarely been executed for the compression case in the literature, even in contributions dedicated to this type of models [20]. The three test cases consist of:
  • a skewed crack prism under compression load adapted from [34];
  • a 3-point bending test on a regular reinforced concrete beam [35];
  • the pushout test from Section 2.3 [15].

4.1. Skewed Crack Prisms

The first example is a skewed crack test performed by [34]. In this experimental study, the samples consist of straight prisms with a square base, featuring a pre-crack extending through the thickness of the prisms. Their dimensions are summarized in Table 4.
Given the experimental data provided in [34], the experimental configurations chosen for displaying the results are those of the PD4 group (load–displacement curves) and the PD5 group (crack pattern vs. damage distribution). The PD4 and PD5 groups consist of prisms with a 60° and a 45° pre-crack, respectively.
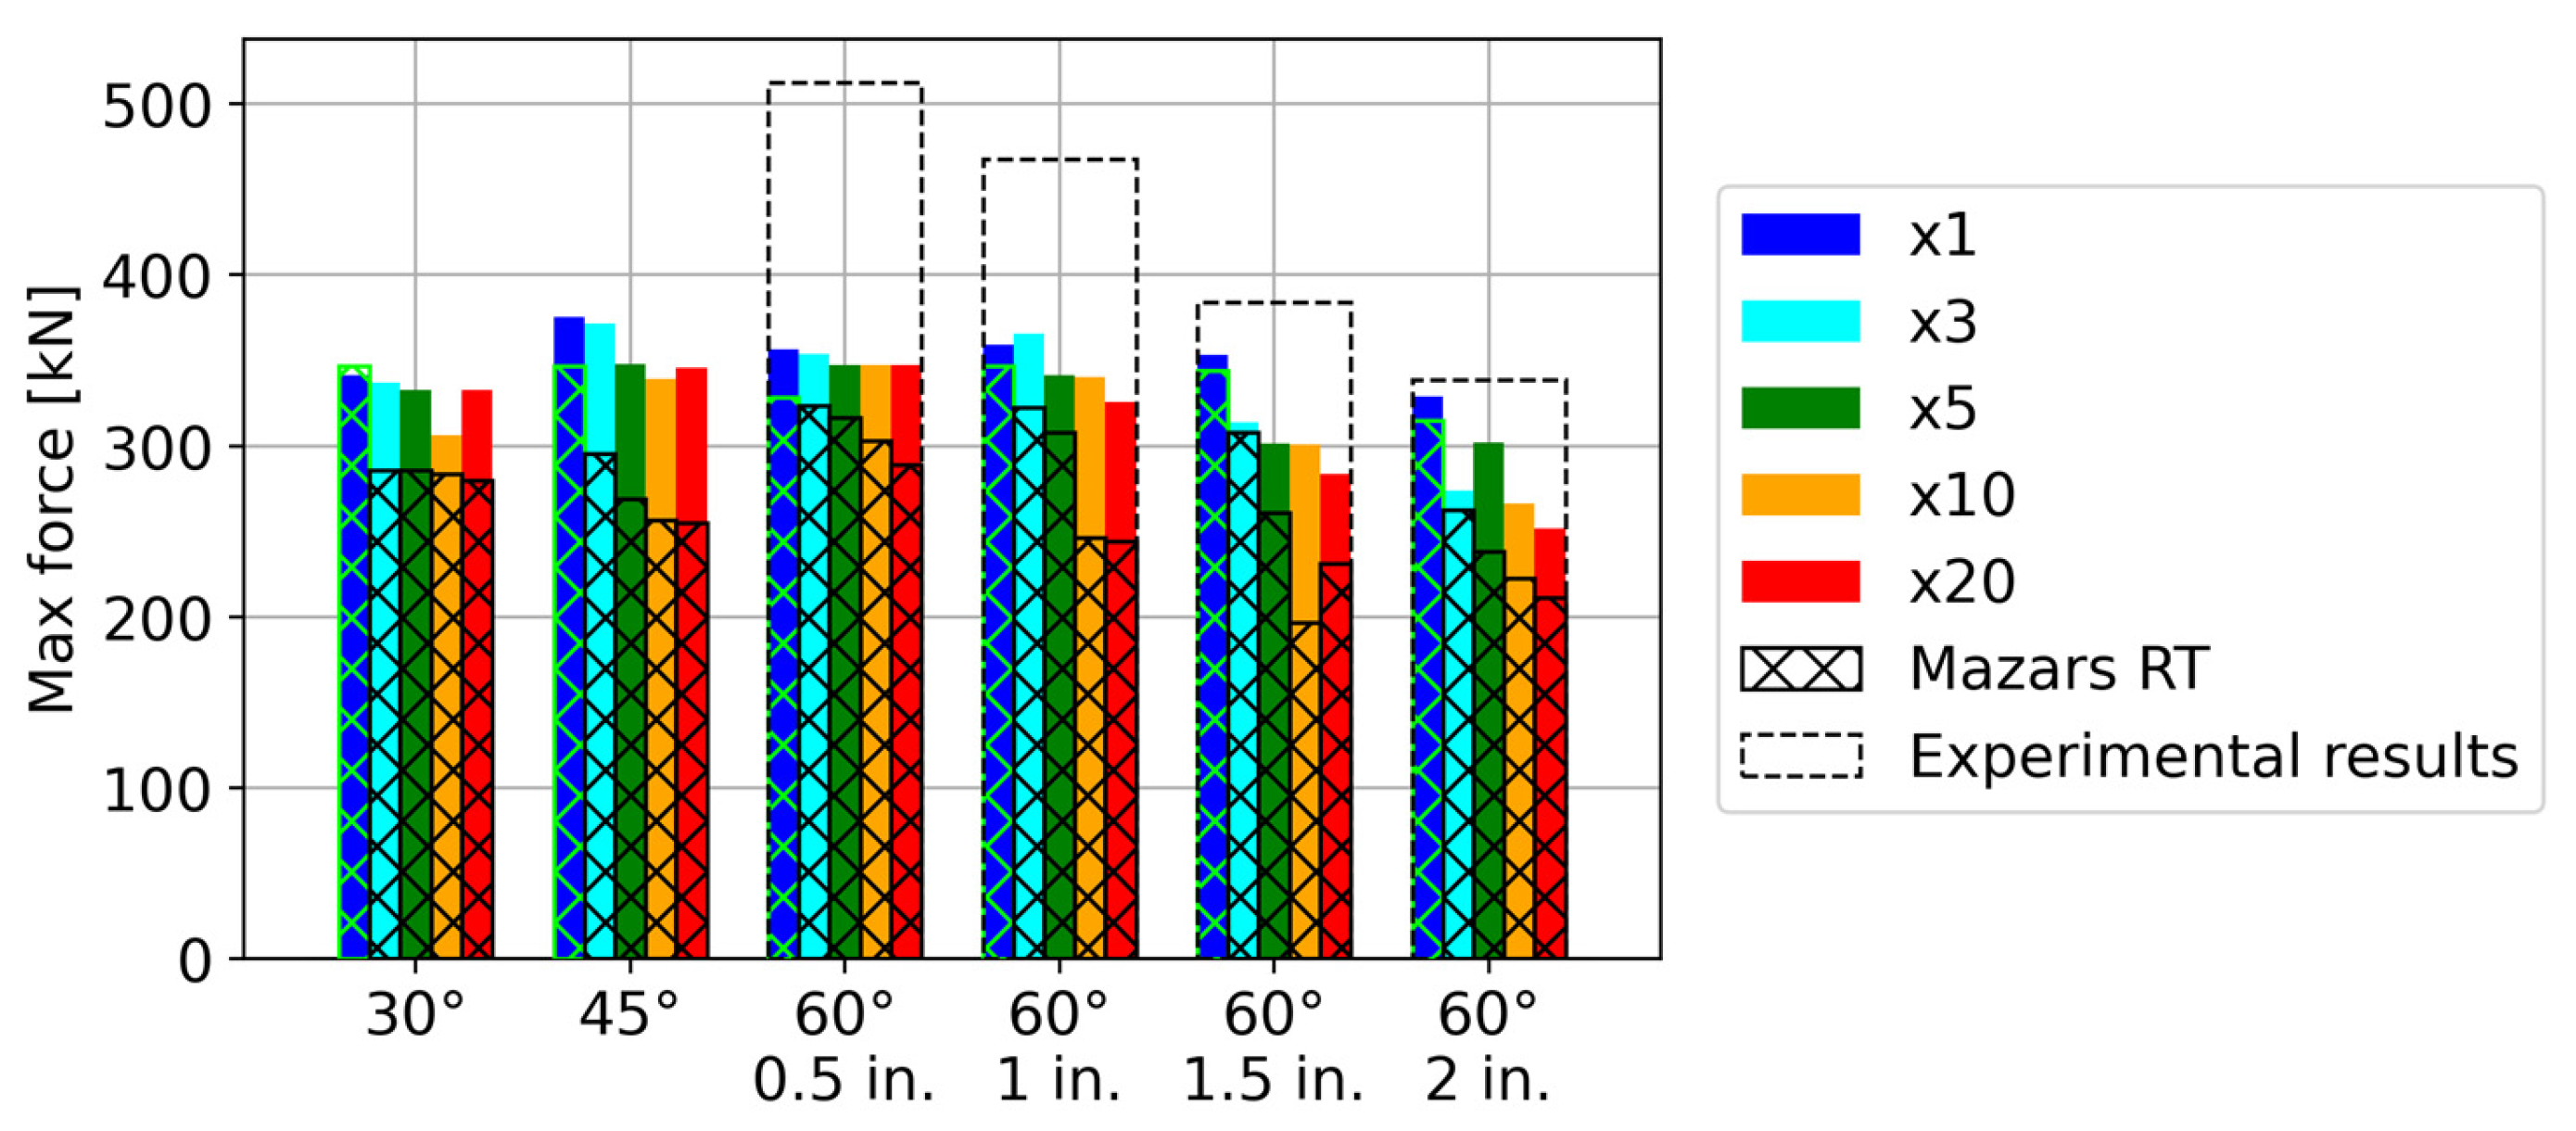
Additionally, the effect of the compression energy regularization on the maximum load will be investigated for all configurations by plotting the maximum reaction force obtained in the range of prescribed displacements (0–0.5 mm) with a comparison to the experimental data when the data are available. In the case of simulations without compression regularization, it is possible that the solver may fail to converge beyond a certain displacement; consequently, the results will represent the maximum applied load.
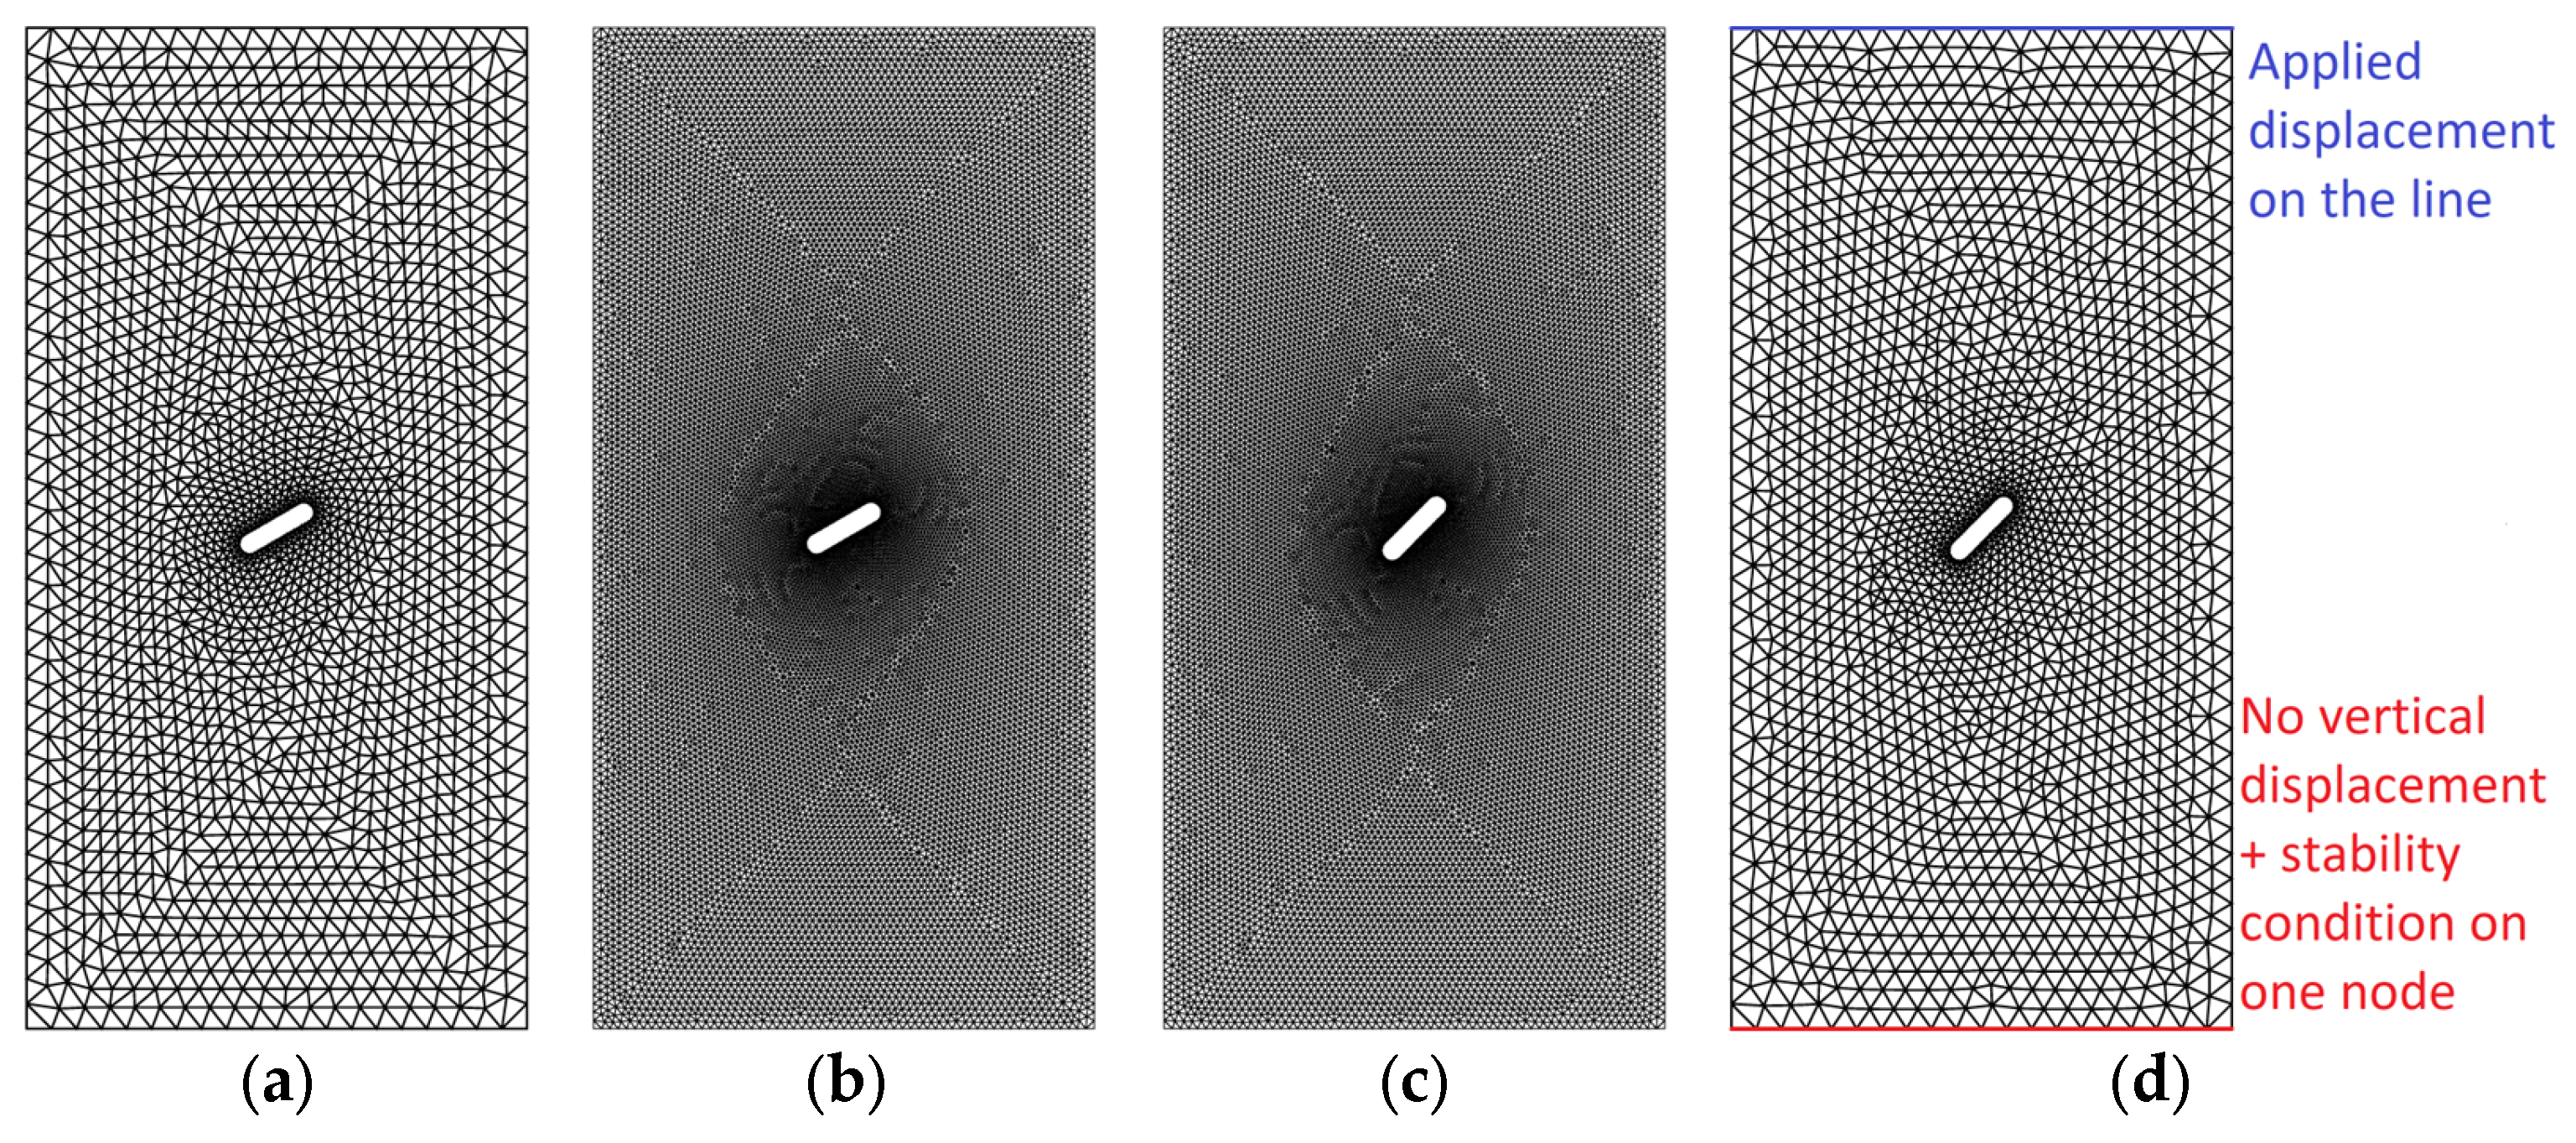
The effect of the regularization of the compression damage law is explored using progressively refined meshes, by multiplying the numbers of elements in all directions by a factor (3, 5, 10, and 20). The initial number of nodes in the coarse mesh is 1885. It is increased to 16,956; 47,089; 188,008; and 752,181. The elements in the simulations of this section consist of linear triangular elements. Four examples of the coarse and refined meshes that are used in this study are presented in Figure 10, for specimens with a crack angle of (from left to right) 60° and 45°. The boundary conditions consist of an applied vertical displacement in compression on the top line, and no vertical displacement allowed on the bottom line. They are applied using Lagrange multipliers.
The missing material parameters ( f t , E , ε c 1 ) are identified using Eurocode 2 [23]. Likewise, the recommended value of Poisson’s ratio for concrete, 0.2, will be used in the simulations. The tension fracture energy is estimated using the Model Code 2010 formula [33]. The material parameters used for the simulations in this section are summarized in Table 5.
Based on the material parameters summarized in Table 5, Mazars’ RT parameters can be calculated according to Equation (9) for the compression parameters and Equation (12) for the tension parameters. Given the absence of steel in the specimens, there is no interaction between steel and concrete; therefore, the β parameter responsible for the shear correction [22] is set to 1. The Mazars’ RTC parameters are calculated according to Equation (16), using ε c 1 = 2 × 10 3 . To calculate the characteristic length, the simple formula h = S is used, as the mesh is 2-dimensional.
Figure 11a,b show the force–displacement behaviors of the 60° and 45° specimens obtained with the finite element simulations, compared to the experimental data when available. Concerning the 60° sample, Mazars’ RTC simulations align well with the experimental results. Comparatively, Mazars’ RT simulations present strong mesh dependency as the maximum load can decrease by up to 40% depending on the degree of mesh-refinement. For both orientations, the more refined simulations using Mazars’ RT model tend to fail earlier (0.25 mm for the coarse mesh, compared to 0.1 mm for the finer meshes). On the other hand, simulations with a regularized compression law are more mesh-objective as they are superposed until about 0.2 mm. Beyond this point, the force–displacement curves do not precisely coincide as a consequence of the existence of multiple possible crack paths. This is especially the case after softening occurs, because the crack paths later in the loading are determined by the crack paths found by the solver at earlier time steps. The damage distributions displayed in Figure 12 use the case of the 45° pre-crack to illustrate that the crack paths found by the solver do not overlap, even if the solution is still satisfactory regarding the convergence criterion of the solver.
In Figure 11a,b, the post-peak behavior obtained using Mazars’ RTC model is a slow decrease in force. Their peaks do not necessarily exactly align, but the curves are somewhat superposed after 0.4 mm. The absence of sudden failure in Mazars’ RTC simulations can be attributed to the way that the loading is prescribed. To control the softening in the simulation and avoid convergence issues, a displacement is applied to the top of the mesh. Given the energies at play, it is plausible that the machines used in the experimental case store a significant amount of energy. If not controlled properly, the machine relaxes its elastic energy into the specimen upon failure, resulting in a sudden drop in force and a rapid increase in displacement of the top loading platen. In the case of the simulation, control is more direct; therefore, the failure is allowed to be more gradual, especially as the displacement of the top line is imposed through Lagrange’s multipliers.
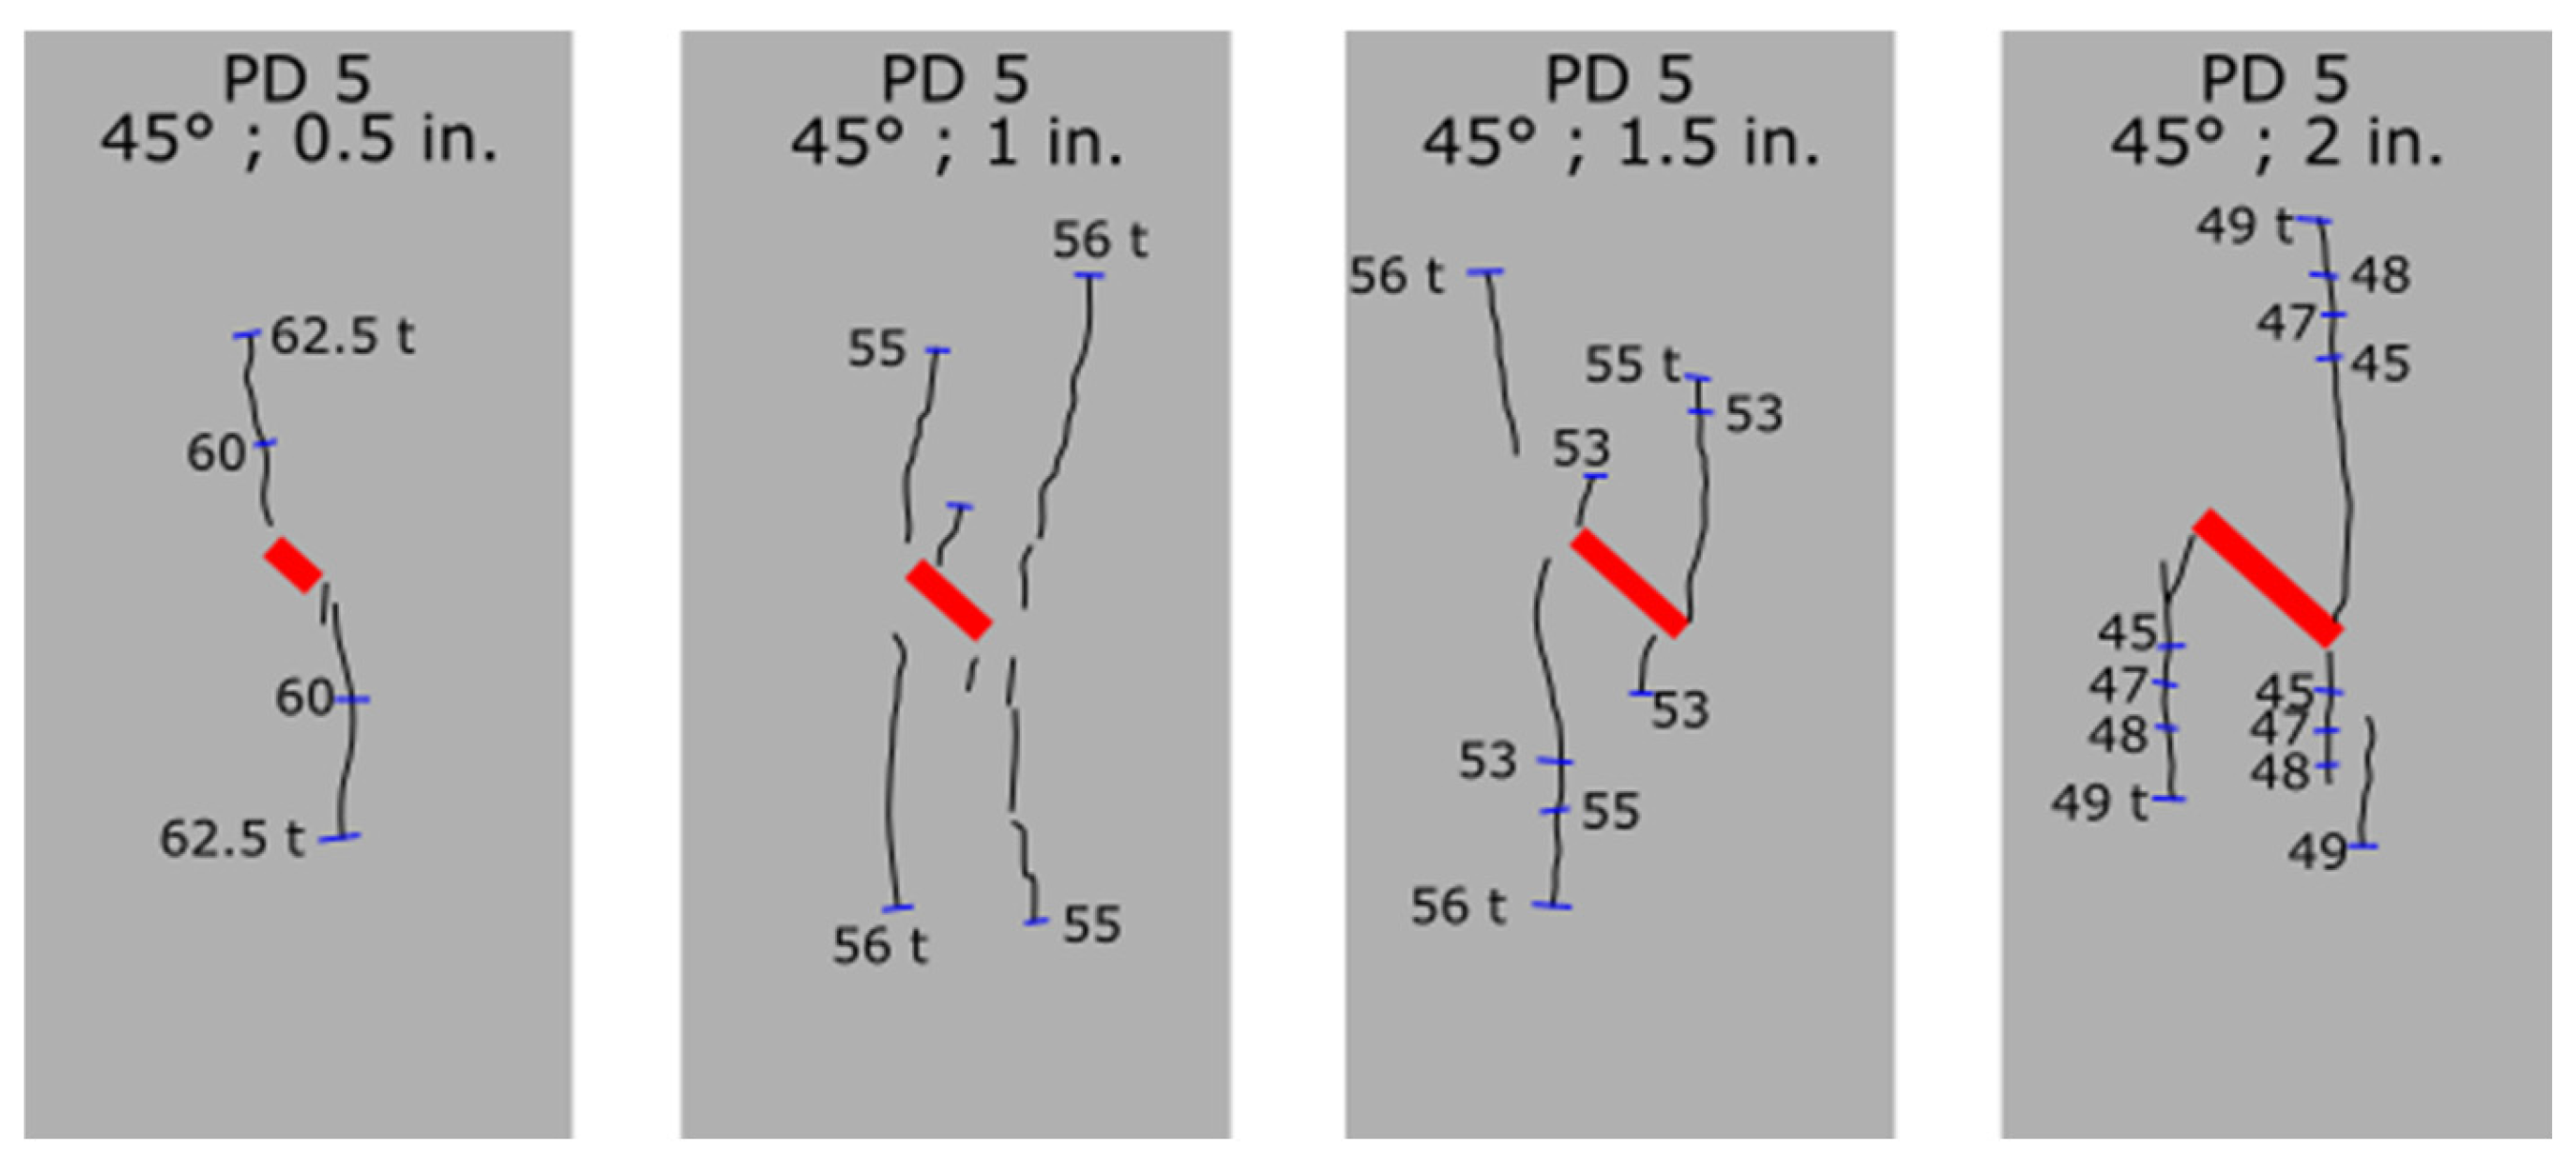
The available photos displaying the crack patterns in [34] concern the 45° samples. The numerical configuration that is considered here has a pre-crack measuring one inch (second specimen from the left, in Figure 13). Figure 12 shows the damage distributions obtained at a 0.3 mm loading displacement with Mazars’ RTC (a–c) and Mazars’ RT (d–f) models. This point is chosen because it is situated after the onset of softening in the force–displacement curves (see Figure 11), and because the Mazars’ RT simulations have all failed beyond this point, so their maximum force has already been reached and the strain has localized. For comparison, Figure 13 displays the pictures of the experimental crack patterns from [34]. In the Mazars’ RT simulations, both the coarse mesh and the finer ×5 mesh follow a damage distribution similar to the crack pattern in Figure 13. Failure occurs when the damaged strip has crossed the full width. The results from the ×3 and ×10 simulations yield similar results to those of the ×5 simulation. The damage pattern obtained on the most refined mesh shows that the rupture mode changes, as the cracks are located at the top of the mesh. It is interesting to note that the damage distributions obtained with Mazars’ RT model have large areas of undamaged concrete, when compared to those obtained with Mazars’ RTC model.
Figure 12a–c present the damage distributions obtained with Mazars’ RTC model for increasingly finer meshes. It is worth mentioning that good localization of the damaged band occurs when using Mazars’ RTC model. For the first four refinement factors (×1, ×3, ×5, and ×10), the damage pattern stays similar to that of the central mesh in Figure 12, as well as the experimental crack pattern. The damage patterns displayed here show that the whole surface of concrete is at least partially damaged, which indicates that a significant part of the elements have reached high strains during the simulation, therefore high stresses.
As a final note, Figure 14 shows the strength deduced from the simulation results for all geometries tested in [34]. As mentioned earlier, the strength is defined as the maximum force achieved up to a 0.5 mm displacement, because all simulations have reached their maximum load in this range. Simulations with the Mazars’ RT model are shown in a hatched pattern, while the simulations with the Mazars’ RTC model are represented in solid bars. The reduced mesh objectivity is demonstrated through the decrease in the maximum force in the Mazars’ RT simulations when the mesh is refined. In the worst case (60° + 1.5 in. with ×10 refinement), the decrease can reach 40% of the strength obtained with the coarsest mesh. Meanwhile, the range of maximum forces in Mazars’ RTC simulations (non-hatched bars) is usually narrower (in the worst case: 25% in the 60°, 2-inch pre-crack), with cases where the maximum force does not decrease. For the 60° specimens, the forces obtained using the Mazars’ RTC model are closer to the experimental values represented by the dashed boxes, especially when compared with the results of the Mazars’ RT model.
Differences between the experimental and the numerical results still exist. However, it is worth mentioning that some of the experimental specimens (namely those with a 0.5 in. and a 1.0 in. notch) displayed unexpected results, as the maximum load that was applied to them was higher than those of the un-notched prisms. Given that only one prism was tested for each pair of orientation and crack length, it is possible that these results are due to experimental variability, and it could explain why these experimental results are further from the simulations.

4.2. Three-Point Bending

The classical example used to demonstrate the effects of regularization in tension is an unreinforced notched beam (for example, [6,19]), such as that experimentally tested by [36]. However, in this contribution, the regularization of the compressive behavior can only be tested if the elements in compression reach their maximum stress in compression. A reinforced concrete beam subjected to three-point bending [35] is selected, as this test-case allows failure in compression. As displayed in Figure 15, the beam has a length of 5 m, and a section of 500 mm × 200 mm. The longitudinal reinforcement consists of four bars. Two T32 bars are placed at a height of 44 mm and two T8 bars are placed at a height of 468 mm. The shear reinforcement consists of T8 stirrups spaced evenly every 100 mm.
Given the symmetry of the beam, one fourth of the beam is modeled to reduce simulation time. It is common to place load distribution plates between the hydraulic jack and the concrete beam to spread the loading force and prevent local concrete crushing at the force application points. Therefore, two plates with steel material properties have been added: one at the center and one at the support. Considering the symmetries, the center plate is reduced to a quarter plate, and the support plate is reduced to a half. The load and support are applied to the steel plates along a single line of elements to allow rotation. The stirrups and rebar are modeled by 1D elasto-plastic elements without bending. They are linked to the concrete volume using perfect adherence relations.
Here again, the aim is to assess the effect of the compression energy regularization relative to the mesh dependency. As was performed previously, two sets of simulations were performed with the Mazars’ RT and RTC models. To demonstrate the effectiveness of the compression energy regularization across various element types, the beam considered in this section is modeled using quadratic cubic elements with 20 nodes. The mesh objectivity study is implemented through three meshes (coarse, refined, and extra-refined) by multiplying the element densities of the coarse mesh by 1.5 and 2 in each direction. The numbers of nodes are 36,518; 103,369; and 254,645.
The material properties that are used are available in Table 6. The Mazars’ RT parameters are estimated using Equation (9) ( A c and B c ) and Equation (12) ( ε d 0 and B t ). For the Mazars’ RTC parameters, Equation (16) is used.
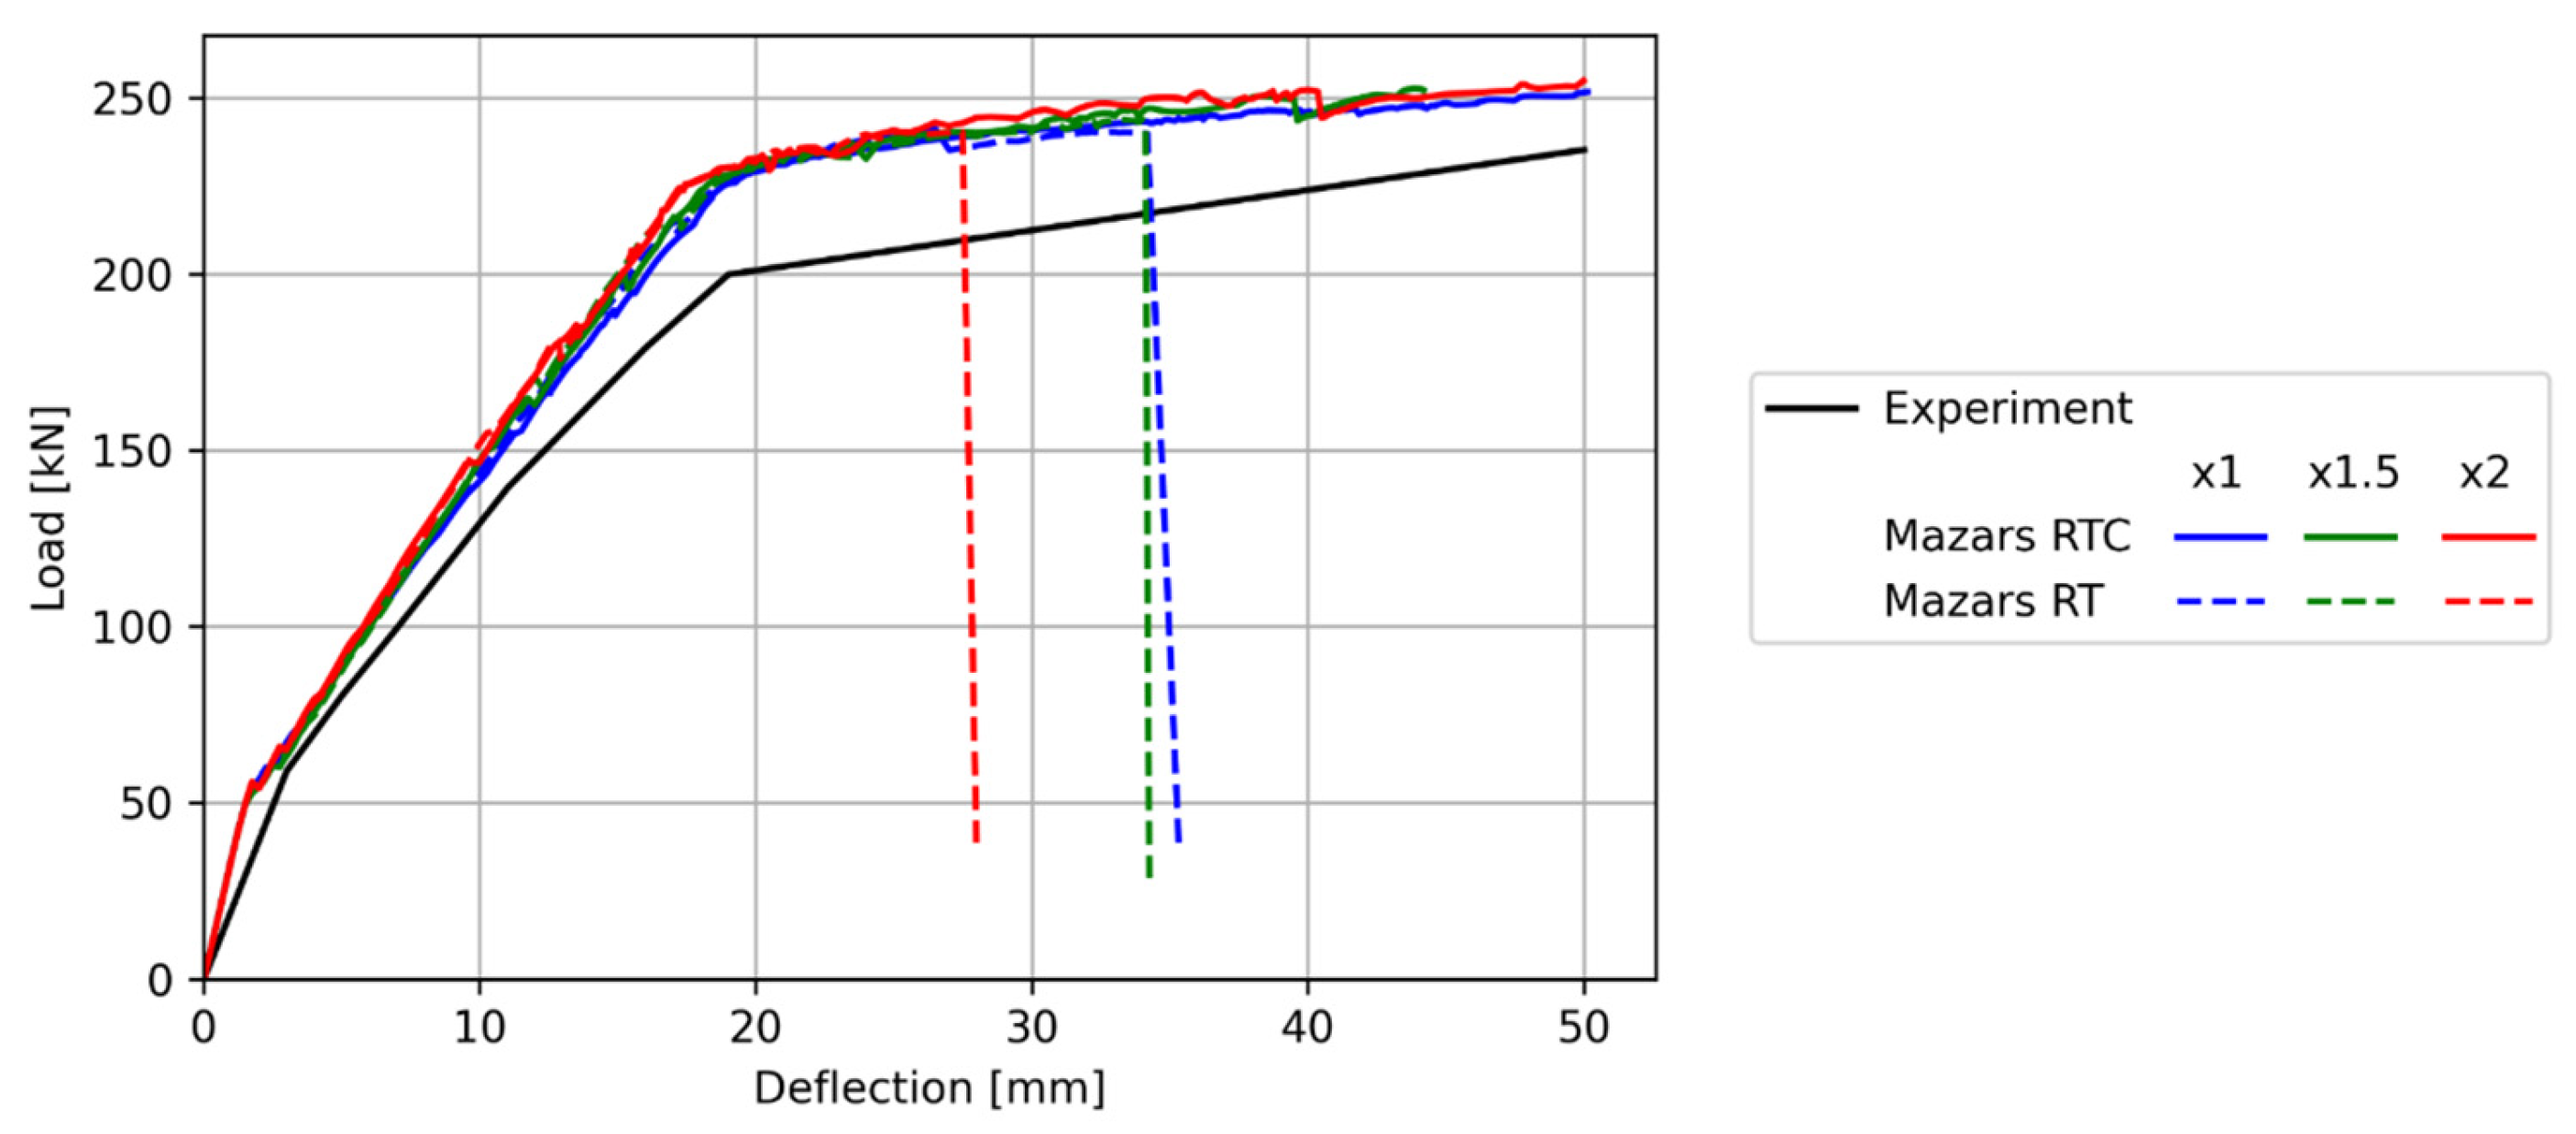
Figure 16 shows a comparison between the experimental and simulated load—mid-span deflection diagrams. The behavior of the experimental beam can be divided into three main phases: initial elasticity until a mid-span deflection of 2 mm, then cracks appear and propagate in the tensioned and sheared members up to the deflection 19 mm. The final phase corresponds to the rebar’s hardening and gradual development of damage in the compressed zones. The results from all simulations are stiffer than the experimental results. Increased stiffness is a classical result from the simulation of bending beams, as can for example be found in [37,38]. It could be attributed to experimental biases such as local compression singularities at the support points in the experimental setup, some slippage between the concrete and the rebar, small defects in the beam, or incorrectly identified material parameters. Here, the differences could be explained by an excessive initial modulus of elasticity for the steel bars or of the concrete, causing the reaction force to increase too fast. Likewise, steel’s hardening modulus appears to be too low compared to the slope of the third part in the experimental results.
When the deflection reaches 34 mm and 28 mm, the Mazars’ RT simulations display mesh-dependency. The most refined mesh fails earliest. It is worth noting that the early failure happens during the hardening phase, where damage in the compressed zones slowly increases up to the softening branch, that is when κ reaches ε c 1 / 2 ν . In these simulations, when concrete reaches its strength, the failure is sudden because the dissipation of energy is not imposed by the stress–strain behavior.
Conversely, the results of Mazars’ RTC simulations are superposed, even when the mesh is refined. Compression energy regularization eliminates the mesh sensitivity with respect to the load–deflection curve in this test case. Coarse and refined simulations do not show very different results because the compression failure has not yet been reached.
Figure 17 presents the damage distributions obtained with Mazars’ RT model. They are displayed on the deformed configuration to highlight the localization of the strain. The coarse mesh (×1) and the extra-refined mesh (×2) both present similar modes of failure in compression, whereas the zone that failed in compression in the refined mesh (×1.5) has moved further from the loading point. The movement of the cracked zone (from close to the loading point to further from it) translates to a change in the mode of rupture, which can explain why the (×1) and (×1.5) curves from Figure 16 overlap during rupture. The stresses in the regions further from the loading point are expected to be lower, so the movement of the failed zone offsets the increased brittleness due to the increased mesh density. On the contrary, when using Mazars’ RTC model (Figure 18), the damage patterns show no failure in compression, in accordance with the experimental results.

4.3. Pushout Tests

The last example showing the enhancements given by compression energy regularization is the pushout test [15] that was discussed in Section 2.3. An example of the coarse mesh is displayed in Figure 4. The simulation assumptions (symmetries, rebar modelling, element type, and mesh construction) are the same as those described in Section 2.3. The dimensions as well as the material parameters of the ST-25A specimens are provided in Table 1 and Table 2, respectively. Based on these material properties, the Mazars’ RT parameters are calculated using Equation (9) for A c and B c , and Equation (12) for the tension parameters. The Mazars’ RTC parameters are estimated using Equation (16).
Figure 19 illustrates a comparison between the simulation results with the Mazars’ RT and Mazars’ RTC models and the experimental results. In all cases, the numerical response softens almost immediately due to the onset of non-linearity: damage initiation in the concrete and some plastic behavior in the steel. The load–slip curve of the coarse mesh with Mazars’ RTC shows good adequacy between the experimental results and the numerical results, well within the bounds of the experimental variability. The numerical behavior flattens when the cohesive zones have entirely plasticized in shear. The kink in the response (coarse mesh—RTC) at a 7.5 mm slippage is due to the transition of the last cohesive element from the elastic to plastic phase. Therefore, the force that can be transmitted through the interface is now limited by the shear behavior, contrary to the simulations using Mazars’ RT model. It is worth mentioning that the experimental softening after 4 mm cannot be reproduced in this simulation because the cohesive zone model does not include damage, nor softening, in its formulation, not because the concrete model cannot reproduce softening.
Figure 20 displays a comparison of the damage distributions obtained using Mazars’ RT and RTC models on the coarse and refined meshes. For all results (a, b, c, and d), the areas in red below the studs show highly damaged zones, which correspond to some concrete crushing in compression. The areas above the studs are left undamaged because the non-penetration boundary conditions only allow compressive stresses. In the case of simulations b and d, it can be noted that most of the damage in the concrete is located close to the W-flange beam, whereas less damage can be seen near the heads of the studs. The remaining length of undamaged concrete before the head of the studs indicates that failure does not happen because of the concrete crushing under the action of the stud, or the whole length would be damaged (like in simulations a and c). This conclusion is in line with the experimental failure mentioned in [15]. It is important to note that due to ε c u having high values for small elements, relatively high stresses can still be present, even under high levels of damage. Therefore, the area in red in the Mazars’ RTC simulations has not necessarily fully failed in compression, unless the equivalent strain approaches ε c u .
Unlike their Mazars’ RTC counterparts, the damage patterns of the Mazars’ RT simulations (a and c) display ruptured elements along the whole length of the studs, with little damage in the volume between the studs. This indicates that comparatively small forces are transmitted through the concrete. It is important to note that the presence of damage between the studs in the case of the Mazars’ RTC simulations does not equate to loss of strength, rather loss of stiffness. Depending on the strain evolution, if the growth of damage is slower than that of strain, stress can still increase, even if there is damage. This is particularly true for this model in compression, because the compression damage threshold is about one tenth of the strain at peak stress. Therefore, when the material is reaching peak stress, the damage process has already started.
The Mazars’ RTC simulations (blue curves in Figure 19) are less prone to early rupture of the concrete elements next to the studs due to strain localization; hence, their load–slip responses are closer to those of the experimental samples. It is worth noting that the Mazars’ RTC simulation performed on the finer meshes also yields softer results, but not in the same proportion as those obtained with the Mazars’ RT model. The regularization method proposed in this contribution is rather simple; therefore, the method cannot be perfect, especially for a complex test-case such as that of the pushout. However, it is shown to significantly improve the quality of the results that are obtained. The pushout test is especially difficult to simulate because it involves complex phenomena, as follows: damage in the concrete, hardening in the steel, steel–concrete interactions; the modelling of which can also involve mesh inobjectivity. For example, the Mazars’ RTC simulation with the coarse mesh displays a secondary slope between 2 mm and 7.5 mm. It is associated with the hardening in the connectors close to the weld, but not in the cohesive zone. This hardening also displays mesh sensitivity. This can explain the differences between the simulation on the fine mesh and on the coarse mesh.

5. Conclusions

To solve the problem of the zero-energy rupture that hampers the accurate modelling of concrete structures, a model for compression energy regularization in concrete is proposed. By combining the advances on a few models that were based on the Mazars’ equivalent strain, the new model stays within the formalism of Mazars’ original model, by modifying the damage evolution laws to allow for independent energetic regularization in both tension and compression.
While the tension damage law has already been thoroughly tested against experimental data, compression energy regularization has not yet been tested in detail because compression is rarely a limiting factor. This work provided three example structures of increasing complexity where refining the mesh decreases the quality of the results when no compression fracture energy is considered. The model from this work yields adequate results compared to experimental data, both with global results (e.g., the load applied on the structure) and with more local results such as damage distributions.
Furthermore, thanks to the nature of the energetic regularization method [8], the only modifications that are made pertain to the compression damage law and the material parameters that are now a function of the size of the elements. Therefore, the model from this work does not require additional computational power, contrary to other non-local methods, and is least programmatically intrusive. The model makes accessible the simulation of large structures where an unphysical compression failure could constitute a numerical bottleneck for the mechanical response.
Further research is needed for a clear and reliable identification of the compression energy as its choice may significantly affect the speed of failure in the simulations after the onset of softening. Moreover, the estimation of the correct characteristic length is still an open question. Ideally, it should be the length of the element along the direction driving dissipation, as proposed in [19], but the rotation of the stress state during loading due to the propagation of cracks elsewhere in the structure could lead to the modification of the characteristic length as time progresses. This may lead to difficulties within the thermodynamic context of Mazars’ model as the softening parameters of the model would change over time (i.e., the slope of the decreasing branch being driven by the ultimate strain ε c u , calculated using the characteristic length).

Author Contributions

Conceptualization, M.D., L.D. and L.J.; methodology, software, formal analysis, investigation, visualization and writing—original draft preparation, M.D.; validation, resources, data curation, writing—review and editing, supervision, project administration, and funding acquisition, L.D. and L.J. All authors have read and agreed to the published version of the manuscript.

Funding

This work was partly supported by the PhD funding program for the Ecole Normale Supérieure Paris-Saclay alumni (CDSN). This program had no involvement in the conduct of the research presented here.

Data Availability Statement

The original contributions presented in this study are included in the article; further inquiries can be directed to the corresponding author.

Conflicts of Interest

The authors declare no conflicts of interest. The funders had no role in the design of the study; in the collection, analyses, or interpretation of data; in the writing of the manuscript; or in the decision to publish the results.

References

  1. Rashid, Y.R. Ultimate Strength Analysis of Prestressed Concrete Pressure Vessels. Nucl. Eng. Des. 1968, 7, 334–344. [Google Scholar] [CrossRef]
  2. Ingraffea, A.R.; Saouma, V. Numerical Modeling of Discrete Crack Propagation in Reinforced and Plain Concrete. In Fracture Mechanics of Concrete: Structural Application and Numerical Calculation; Springer: Dordrecht, The Netherlands, 1985; Volume 4, pp. 171–225. ISBN 978-94-009-6152-4. [Google Scholar]
  3. Melenk, J.M.; Babuška, I. The Partition of Unity Finite Element Method: Basic Theory and Applications. Comput. Methods Appl. Mech. Eng. 1996, 139, 289–314. [Google Scholar] [CrossRef]
  4. Cicekli, U.; Voyiadjis, G.Z.; Abu Al-Rub, A.K. A Plasticity and Anisotropic Damage Model for Plain Concrete. Int. J. Plast. 2007, 23, 1874–1900. [Google Scholar] [CrossRef]
  5. Alfarah, B.; López-Almansa, F.; Oller, S. New Methodology for Calculating Damage Variables Evolution in Plastic Damage Model for RC Structures. Eng. Struct. 2017, 132, 70–86. [Google Scholar] [CrossRef]
  6. Lubliner, J.; Oliver, J.; Oller, S.; Oñate, E. A plastic-damage model for concrete. Int. J. Solids Struct. 1989, 25, 299–326. [Google Scholar] [CrossRef]
  7. Mazars, J. A Description of Micro- and Macroscale Damage of Concrete Structures. Eng. Fract. Mech. 1986, 25, 729–737. [Google Scholar] [CrossRef]
  8. Hillerborg, A.; Modéer, M.; Petersson, P.-E. Analysis of Crack Formation and Crack Growth in Concrete by Means of Fracture Mechanics and Finite Elements. Cem. Concr. Res. 1976, 6, 773–781. [Google Scholar] [CrossRef]
  9. Bažant, Z.P.; Oh, B.H. Crack Band Theory for Fracture of Concrete. Matér. Constr. 1983, 16, 155–177. [Google Scholar] [CrossRef]
  10. Pijaudier-Cabot, G.; Bažant, Z.P. Nonlocal Damage Theory. J. Eng. Mech. 1987, 113, 1512–1533. [Google Scholar] [CrossRef]
  11. Peerlings, R.H.J.; Geers, M.G.D.; de Borst, R.; Brekelmans, W.A.M. A Critical Comparison of Nonlocal and Gradient-Enhanced Softening Continua. Int. J. Solids Struct. 2001, 38, 7723–7746. [Google Scholar] [CrossRef]
  12. Giry, C.; Dufour, F.; Mazars, J. Stress-Based Nonlocal Damage Model. Int. J. Solids Struct. 2011, 48, 3431–3443. [Google Scholar] [CrossRef]
  13. Coleman, J.; Spacone, E. Localization Issues in Force-Based Frame Elements. J. Struct. Eng. 2001, 127, 1257–1265. [Google Scholar] [CrossRef]
  14. Calixte, R.; Davenne, L.; Jason, L. Refined and Simplified Modelling of Steel-Concrete-Steel (SCS) Composite Beams. In Computational Modelling of Concrete and Concrete Structures; CRC Press: London, UK, 2022; pp. 332–340. [Google Scholar]
  15. Shim, C.-S.; Lee, P.-G.; Yoon, T.-Y. Static Behavior of Large Stud Shear Connectors. Eng. Struct. 2004, 26, 1853–1860. [Google Scholar] [CrossRef]
  16. Červenka, J.; Červenka, V.; Laserna, S. On Crack Band Model in Finite Element Analysis of Concrete Fracture in Engineering Practice. Eng. Fract. Mech. 2018, 197, 27–47. [Google Scholar] [CrossRef]
  17. Lertsrisakulrat, T.; Watanabe, K.; Matsuo, M.; Niwa, J. Experimental Study on Parameters in Localization of Concrete Subjected to Compression. J. Mater. Concr. Struct. Pavements JSCE 2001, 50, 309–321. [Google Scholar] [CrossRef] [PubMed]
  18. Nakamura, H.; Higai, T. Compressive Fracture Energy and Fracture Zone Length of Concrete. In Modeling of Inelastic Behavior of RC Structures under Seismic Loads; ASCE: Reston, VA, USA, 2001; pp. 471–487. [Google Scholar]
  19. Oliver, J. A Consistent Characteristic Length for Smeared Cracking Models. Int. J. Numer. Methods Eng. 1989, 28, 461–474. [Google Scholar] [CrossRef]
  20. Arruda, M.R.T.; Pacheco, J.; Castro, L.M.S.; Julio, E. A Modified Mazars Damage Model with Energy Regularization. Eng. Fract. Mech. 2022, 259, 108129. [Google Scholar] [CrossRef]
  21. Comi, C.; Perego, U. Fracture Energy Based Bi-Dissipative Damage Model for Concrete. Int. J. Solids Struct. 2001, 38, 6427–6454. [Google Scholar] [CrossRef]
  22. Pijaudier-Cabot, G.; Mazars, J.; Pulikowski, J. Steel-Concrete Bond Analysis with Nonlocal Continuous Damage. J. Struct. Eng. 1991, 117, 862–882. [Google Scholar] [CrossRef]
  23. European Committee for Standardization. Eurocode 2: Design of Concrete Structures, Part 1-1: General Rules and Rules for Buildings; European Committee for Standardization: Brussels, Belgium, 2004. [Google Scholar]
  24. Kupfer, H.; Hilsdorf, H.K.; Rusch, H. Behavior of Concrete under Biaxial Stresses. J. Proc. 1969, 66, 656–666. [Google Scholar] [CrossRef]
  25. Davenne, L.; Saouridis, C.; Piau, J. Un Code de Calcul Pour La Prévision Du Comportement de Structures Endommageables En Béton, En Béton Armé, Ou En Béton de Fibres. Ann. Inst. Tech. Bâtim. Trav. Publics 1989, B267, 137–156. [Google Scholar]
  26. Feenstra, P.H.; De Borst, R. A Composite Plasticity Model for Concrete. Int. J. Solids Struct. 1996, 33, 707–730. [Google Scholar] [CrossRef]
  27. Jirásek, M.; Bauer, M. Numerical Aspects of the Crack Band Approach. Comput. Struct. 2012, 110–111, 60–78. [Google Scholar] [CrossRef]
  28. European Committee for Standardization. Eurocode 4, Design of Composite Steel and Concrete Structures, Part 1-1, General Rules and Rules for Buildings; European Committee for Standardization: Brussels, Belgium, 2004. [Google Scholar]
  29. Calixte, R.; Jason, L.; Davenne, L. Refined and Simplified Simulations for Steel–Concrete–Steel Structures. Appl. Mech. 2023, 4, 1078–1099. [Google Scholar] [CrossRef]
  30. CEA CAST3M 2024. Available online: https://www-cast3m.cea.fr/ (accessed on 11 June 2004).
  31. Hunter, J.D. Matplotlib: A 2D Graphics Environment. Comput. Sci. Eng. 2007, 9, 90–95. [Google Scholar] [CrossRef]
  32. Nguyen, H.T.; Kim, S.E. Finite Element Modeling of Push-out Tests for Large Stud Shear Connectors. J. Constr. Steel Res. 2009, 65, 1909–1920. [Google Scholar] [CrossRef]
  33. Fib Model Code 2010; Bulletins 55, 56, 65 and 66; Wilhelm Ernst & Sohn: Berlin, Germany, 2012.
  34. Desayi, P. Fracture of Concrete in Compression. Matér. Constr. 1977, 10, 139–144. [Google Scholar] [CrossRef]
  35. Péra, J. Poutres Hyperstatiques en Béton Armé: Analyse Théorique et Expérimentale. Ph.D. Thesis, INSA Lyon, Villeurbanne, France, 1973. [Google Scholar]
  36. Arrea, M.; Ingraffea, A.R. Mixed Mode Crack Propagation in Mortar and Concrete; Cornell University, Department of Structural Engineering: Ithaca, NY, USA, 1981. [Google Scholar]
  37. Dawari, V.B.; Vesmawala, G.R. Application of Nonlinear Concrete Model for Finite Element Analysis of Reinforced Concrete Beams. Int. J. Sci. Eng. Res. 2014, 5, 776–782. [Google Scholar]
  38. Kwak, H.G.; Filippou, F.C. Finite Element Analysis of Reinforced Concrete Structures under Monotonic Loads; University of California: Berkeley, CA, USA, 1990. [Google Scholar]
Figure 1. Stress–strain behavior of the Mazars’ O Model: (a) in uniaxial tension; (b) in uniaxial compression.
Applmech 05 00028 g001
Figure 2. Post-peak tension stress vs. tension displacement graphs obtained using the Mazars’ RT model. (a) 0.25 m cube; (b) 0.025 m cube.
Applmech 05 00028 g002
Figure 3. Dimensions of the pushout test [15], adapted by [29].
Applmech 05 00028 g003
Figure 4. Pictures of the meshes used to simulate the pushout test. (a) The 3D mesh of the complete pushout test; (b) exploded view of the quarter-mesh used for the simulations.
Applmech 05 00028 g004
Figure 5. Load–slip curves obtained using Mazars’ RT model on the pushout test.
Applmech 05 00028 g005
Figure 6. Damage patterns in the concrete obtained using Mazars’ RT model on (a) coarse mesh, (b) the finer mesh, and (c) the finest mesh.
Applmech 05 00028 g006
Figure 7. Compression stress according to Mazars’ RTC model, damage law, and area used for energy regularization.
Applmech 05 00028 g007
Figure 8. (a) Compressive stress–strain behaviors; (b) post-peak stress–displacement behaviors.
Applmech 05 00028 g008
Figure 9. Normalized bi-axial failure surface with Mazars’ RTC with and without bi-compressive correction, compared with the experimental results from [24]. (a) Total surface; (b) zoom on the sheared part.
Applmech 05 00028 g009
Figure 10. Examples of 2D meshes used for the simulation of the samples from [34]. (a) Coarse mesh, 60° pre-crack; (b) refined mesh ×3, 60°; (c) refined mesh ×3, 45°; (d) coarse mesh, 45° pre-crack (with boundary conditions).
Applmech 05 00028 g010
Figure 11. Load–displacement curves obtained with various degrees of refinement for (a) the 60° sample with a crack length of 1.5 in.; and (b) the 45° sample with a crack length of 1.0 in.
Applmech 05 00028 g011
Figure 12. Damage patterns obtained at a 0.3 mm top displacement, on the 1.0 in. pre-crack and 45° specimen. (a) With the Mazars’ RTC model on a coarse mesh. (b) Mazars’ RTC on a ×5 finer mesh. (c) Mazars’ RTC model on the finest mesh (×20). (d) Mazars’ RT model on the coarse mesh. (e) Mazars’ RT model on a ×5 finer mesh. (f) Mazars’ RT model on the finest mesh (×20).
Applmech 05 00028 g012
Figure 13. Experimental crack patterns of the PD5 group, under load up to 62.5 tons (622.5 kN), adapted from [34]. The red areas correspond to the pre-crack and the black lines represent the cracks that appeared under load. The blue lines show the extent of the cracks at each load step (in tons, where 1 ton = 9.96 kN).
Applmech 05 00028 g013
Figure 14. Maximum force within the 0 , 0.3 mm displacement range with varying refinement levels for each experimental geometry.
Applmech 05 00028 g014
Figure 15. Dimensions of the beam [35].
Applmech 05 00028 g015
Figure 16. Comparison of the experimental and numerical force–deflection behaviors.
Applmech 05 00028 g016
Figure 17. Damage distribution of Mazars’ RT simulations. (a) Coarse mesh ×1; (b) finer mesh ×1.5; (c) finest mesh ×2.
Applmech 05 00028 g017
Figure 18. Damage distributions of Mazars’ RTC simulations. (a) Coarse mesh ×1; (b) finest mesh ×2.
Applmech 05 00028 g018
Figure 19. Load–slip curves obtained with the refined and coarse meshes.
Applmech 05 00028 g019
Figure 20. Damage distributions obtained with (a) Mazars’ RT, coarse mesh; (b) Mazars’ RTC, coarse mesh; (c) Mazars’ RT, finer mesh; (d) Mazars’ RTC; finer mesh, (e) Mazars’ RT, finest mesh; and (f) Mazars’ RTC, finest mesh.
Applmech 05 00028 g020
Table 1. Dimensions of the pushout experimental setup [15].
Stud DiameterStud Length
(Including Head)
Head DiameterHead Length
25 mm155 mm38 mm11 mm
Table 2. Concrete and steel material parameters [15].
ConcreteCompression Strength f c Young’s Modulus E Poisson Ratio ν Tension Strength f t Compressive Fracture Energy G f c Tensile Fracture Energy G f t
35.3 MPa32.1 GPa0.23.23 MPa50.0 kN/m150 N/m
W-flange beam SteelYield strength  f y Young’s modulus  E Poisson ratio  ν s Hardening modulus  H
235 MPa210 GPa0.39 GPa
Stud steelYield strength  f y Young’s modulus  E Poisson ratio  ν s Hardening modulus  H
426 MPa210 GPa0.39 GPa
Table 3. Mazars’ RTC for the three cubes that were tested in this section.
SizeMazars’ RTC Parameters
ε d 0 B t k k 1 k 2 ε c u
0.75 m 1 × 10 4 140,000 1.76 4.65 × 10 10 1.55 × 10 8 3.33 × 10 3
0.1 m 2640 2.11 × 10 9 5.29 × 10 7 2.5 × 10 2
0.05 m 1240 1.01 × 10 9 5.03 × 10 7 5.0 × 10 2
Table 4. The geometrical parameters of the skewed crack prisms from [34].
HeightLengthThicknessLength of the CrackAngle of the Crack
12 in.
(30.48 cm)
6 in.
(15.24 cm)
6 in.
(15.24 cm)
0.5, 1.0, 1.5 and 2.0 in.
(1.3, 2.5, 3.8 and 5.1 cm)
30°, 45°, and 60°
Table 5. Material parameters for each group of samples.
Specimen AngleConcrete Strength f c [MPa]Young’s Modulus E [GPa]Poisson’s Ratio ν Tension Strength [MPa]Tension Fracture Energy G f t [N/m]Compression Fracture Energy G f c [N/m]
60°25.329.00.22.013044,300
45°26.429.40.22.113045,200
30°24.628.80.21.913043,600
Table 6. Material properties [35].
ConcreteCompression Strength f c Young’s Modulus E Poisson Ratio ν Tension Strength f t Compressive Fracture Energy G f c Tensile Fracture Energy G f t
38.3 MPa37.3 GPa0.23.9 MPa54.0 kN/m110 N/m
Rebar SteelYield strength  f y Young’s modulus  E Poisson ratio  ν s Hardening modulus  H
400 MPa200 GPa0.333.28 GPa
Disclaimer/Publisher’s Note: The statements, opinions and data contained in all publications are solely those of the individual author(s) and contributor(s) and not of MDPI and/or the editor(s). MDPI and/or the editor(s) disclaim responsibility for any injury to people or property resulting from any ideas, methods, instructions or products referred to in the content.