Article

AFM Indentation on Highly Heterogeneous Materials Using Different Indenter Geometries

by
Stylianos Vasileios Kontomaris
1,2,*,
Andreas Stylianou
3,
Georgios Chliveros
2 and
Anna Malamou
4
1
BioNanoTec Ltd., 2043 Nicosia, Cyprus
2
Faculty of Engineering and Architecture, Metropolitan College, 15125 Athens, Greece
3
School of Sciences, European University Cyprus, 2404 Nicosia, Cyprus
4
Independent Power Transmission Operator S.A. (IPTO), 10443 Athens, Greece
*
Author to whom correspondence should be addressed.
Appl. Mech. 2023, 4(2), 460-475; https://doi.org/10.3390/applmech4020026
Submission received: 7 March 2023 / Revised: 11 April 2023 / Accepted: 14 April 2023 / Published: 18 April 2023
(This article belongs to the Special Issue Feature Papers in Material Mechanics)

Abstract

:
Hertzian mechanics is the most frequently used theory for data processing in Atomic Force Microscopy (AFM) indentation experiments on soft biological samples, due to its simplicity and significant scientific results previously published. For instance, using the Hertz model, it has been proven that there are significant differences in the mechanical properties of normal and cancerous tissues and that cancer cells’ invasive properties are correlated with their nanomechanical properties. However, many scientists are skeptical regarding the applicability of the Hertz theory to biological materials, as they are highly heterogeneous. The main critical question to be addressed is “what do we calculate” when fitting the force-indentation data to Hertz equations. Previous studies have shown that when using cylindrical, parabolic, or conical indenters, the fitting parameter is the average Young’s modulus. In this paper, it is demonstrated that it is also valid to fit equations derived from Hertzian mechanics to force-indentation data when testing soft, heterogeneous samples for any indenter geometry. The fitting factor calculated through this approach always represents the average Young’s modulus for a specific indentation depth. Therefore, Hertzian mechanics can be extended to soft heterogeneous materials, regardless of the indenter’s shape.

1. Introduction

Atomic Force Microscopy (AFM) nanoindentation is a powerful method for the characterization of biological samples at the nanoscale [1,2,3]. Significant scientific results have been published during the last two decades, indicating the possibility of early diagnosis of various diseases such as cancer or osteoarthritis using AFM [2,4,5,6,7,8,9,10,11]. The force-indentation data in a typical experiment is usually processed using equations arising from Hertzian mechanics. However, these equations are valid only for materials that can be approximated as elastic half spaces [3]. In contrast, biological materials at the nanoscale are highly heterogeneous [12]. This is a major limitation of AFM indentation since the results strongly depend on the indentation depth when using Hertzian equations for data processing [12]. As a result, the stiffness in terms of Young’s modulus (often referred to as the ‘apparent Young’s modulus’) will differ when using two different indentation depths on the same sample. Therefore, the results are user-dependent and can be difficult to reproduce. Thus, a critical question arises: “What are we calculating” when fitting the force-indentation data to classic Hertzian equations? Is this approach valid for determining the mechanical properties of biological samples at the nanoscale? Despite the mathematical limitations, it has been experimentally proven that classic fitting procedures can provide important information regarding the mechanical properties. For example, Hertzian mechanics can be used to characterize cancer cells since they are softer than healthy ones [1,2]. Furthermore, it has been demonstrated that stiffness distributions differ between healthy, benign, and cancerous tissues [2,4]. Despite the important experimental results, the question remains, “How accurate is it to use the Hertzian equation when testing biological samples?” An attempt to provide a conclusive answer to this question was recently presented [13]. In particular, it was shown that the equations arising from Hertzian mechanics when using cylindrical, parabolic, and conical indenters can be extended to the case of highly heterogeneous materials [13].
Specifically, a highly heterogeneous sample consisting of N narrow homogeneous slices (Figure 1a,b) can be mathematically described using the following equation:
E ¯ = E 1 + E 2 + + E N N
In Equation (1),  E 1 , E 2 , , E N  are the Young’s moduli of the N narrow homogeneous slices, and  E ¯  is the average Young’s modulus. Equation (1) can also be written in the form:
E ¯ = E 1 Δ h + E 2 Δ h + + E N Δ h N Δ h = 1 h i = 1 N E i Δ h
Assuming  N  layers with the same thickness (it is assumed that the mechanical properties change smoothly from one layer to the next) [13], Equation (2) takes the form:
E ¯ = 1 h 0 h E y d y
For the case of parabolic indenters, the applied force ( F ) on the sample is related to the indentation depth ( h ) using the following equation [13]:
F = 4 R 1 / 2 E ¯ 3 1 v 2 h 3 / 2
In Equation (4),  R  is the indenter’s radius, and  v  is the sample’s Poisson ratio. In addition, for conical indenters [13]:
F = 2 t a n θ π 1 v 2 E ¯ h 2
In Equation (5), θ represents the cone’s half-angle. Equations (4) and (5) indicate that when fitting the force-indentation data to equations arising from Hertzian mechanics (i.e., Equations (4) and (5)), the fitting parameter being calculated is the average Young’s modulus of the N narrow homogeneous slices. In other words, the fitting parameter is the average Young’s modulus for a specific domain (i.e., the “apparent” Young’s modulus equals the average Young’s modulus). This explains the strong depth dependence of the “apparent” Young’s modulus in conventional experiments. Hence, it is correct to use Equations (4) and (5) when testing heterogeneous materials. However, the results are meaningless without specifying the exact value of the indentation depth. In other words, the result is valid for a specific domain. For example, for  0 h h 1  the average Young’s modulus is  E ¯ 1 , for  0 h h 2  the average Young’s modulus is  E ¯ 2  etc.
An important question that still remains is whether this result applies to any indenter shape. For example, in an indentation experiment using a spherical indenter and for large indentation depths, what is being calculated using a classic fitting procedure? Is it always valid to use Hertzian mechanics when testing heterogeneous soft samples? In many cases of indentation experiments, the AFM tip can be better modeled as a sphere or as a sphero-conical indenter [14]. Spherical indenters are commonly used in AFM experiments when testing soft biological samples [15,16,17,18,19,20]. They do not damage the sample during the indentation process (at least in cases where the indentation depth is not significantly bigger compared to the tip radius). In addition, for small indentation depths, typical pyramidal tips are better approximated as sphero-conical indenters, since the tip radius is comparable to the indentation depth [14]. In such cases, the perfect conical approximation leads to significant errors [14]. Sphero-conical indenters can be considered as axisymmetric rigid indenters that can be described by an arbitrary function Z = f(r), which is rotated about the z-axis to produce a solid of revolution.
Thus, it is critical to examine whether the aforementioned approach (i.e., the extension of the classic equations for heterogeneous materials) can also be applied in these cases. In other words, we will examine whether the average Young’s modulus approach can be extended when testing soft heterogeneous materials for any indenter’s geometry. We will show that classic fitting procedures using equations arising from Hertzian mechanics are valid regardless of the indenter’s shape. Therefore, it is mathematically valid to use Hertzian equations for spherical indentations and equations for axisymmetric rigid indenters when testing highly heterogeneous soft materials. In both cases, the fitting parameter is the average Young’s modulus.

2. Materials and Methods

2.1. Theoretical Analysis

In this paper, the mathematical analysis (previously presented in [13]) will be further extended for (a) indentations on highly heterogeneous materials with spherical indenters and (b) for axisymmetric indenters of arbitrary geometry. The methodology is based on considering the highly heterogeneous material as a sum of N homogeneous slices ( N ). The goal is to calculate the average Young’s modulus of these slices, which is the average Young’s modulus of the tested sample for a specific indentation depth.

2.2. Open Access Synthetic Data

Open access simulated data on an elastic half space with Young’s modulus equals to E = 20 kPa and Poisson’s ratio v = 0.5 was used. The data was generated in Mathematica 8.0, mimicking real force curves. The data collected assumed spherical indenters with a radius of 1 μm mounted on a cantilever with a spring constant of 0.1 N/m. The synthetic data were produced by means of Sneddon’s equation for perfect spherical indenters and adding random (Gaussian distributed) noise. The (force-indentation) data used in this study have been deposited in the (AtomicJ) repository (https://sourceforge.net/projects/jrobust/files/TestFiles/ (accessed on 10 January 2023)) [21].

2.3. Experiments on H4 Human Glioma Cells

Spherical indentations on H4 human glioma cells (ATCC) using a ball-shape tip (the tip radius was 2.5 μm and the cantilever’s spring constant was measured at 0.08 Nm−1 using the thermal noise method [22]) were performed according to the protocol described in [23]. Each fitting procedure was evaluated using the R-squared coefficient ( R 2 ). A fitting procedure is accurate when the  R 2  coefficient is close to 1.

3. Results

3.1. The Average Young’s Modulus for Deep Spherical Indentations

The equation that relates the applied force ( F ) to the indentation depth ( h ) for a spherical indentation was derived by Sneddon [24]:
F = E 2 1 v 2 r c 2 + R 2 l n R + r c R r c 2 r c R
In Equation (6),  R  is the indenter’s radius, where  E ,   and   v  are Young’s modulus and Poisson’s ratio, respectively.
The indentation depth is related to the contact radius ( r c ) with the following equation:
l n R + r c R r c = 2 h r c
However, a new equation was recently derived that directly relates the applied force to the indentation depth for spherical indentations [25]:
d F d h = S h = 2 E r c h 1 v 2
In Equation (8),  r c  equals to [25]:
r c = c 1 R h R 1 / 2 + c 2 R h R + c 3 R h R 2 + c 4 R h R 3 + + c N R h R N 1
In Equation (9),  c 1 c 2 ,…,  c N  are constants that can be found in [25].
By substituting Equation (9) for Equation (8) it can be concluded [25]:
F = 2 E R 1 v 2 2 3 c 1 R 1 / 2 h 3 / 2 + 1 2 c 2 R 1 h 2 + 1 3 c 3 R 2 h 3 + 1 4 c 4 R 3 h 4 + + 1 N c N R 1 N h N
Using Equation (8), the applied force on a heterogeneous sample can be expressed in the following form (see also Figure 1c, where the applied force equals the area under the  S = f h  graph):
F = 0 h S y d y
More specifically, the area under the graph in Figure 1c can be divided into N narrow strips (where  N ) in which the stiffness is constant. Thus, for every strip  d F = S d h . By adding all the strips, it is easy to conclude in Equation (11). In addition, in case that  S = c o n s t a n t S = 2 E R 1 v 2  (this is the case of a flat ended punch with diameter R indenting an elastic half space) [13]. On the contrary, for heterogeneous samples, there is no single Young’s modulus value to describe the sample’s properties. Hence,
S y = d F d y = 2 E y r c y 1 v 2
By combining Equations (9) and (12) it can be concluded:
S y = d F d y = 2 E y R 1 v 2 c 1 y R 1 2 + c 2 y R + c 3 y R 2 + c 4 y R 3 + + c N y R N 1
In Equations (11)–(13),  y  symbolizes an arbitrary value of the indentation depth for which  0 y h .
Thus, the force applied on the sample equals to:
F = 0 h S y d y = 2 c 1 R 1 / 2 1 v 2 0 h E y y 1 / 2 d y + 2 c 2 1 v 2 0 h E y y d y + 2 c 3 R 1 1 v 2 0 h E y y 2 d y + 2 c 4 R 2 1 v 2 0 h E y y 3 d y + + 2 c N R 2 N 1 v 2 0 h E y y N 1 d y
The first integral of the second part of Equation (14) can be expressed as follows:
I 1 = 2 c 1 R 1 / 2 1 v 2 0 h E y y 1 / 2 d y  
By changing variable  y 3 / 2 = u ,   d u = 3 2 y 1 / 2 d y , Equation (15) is written as follows:
I 1 = 4 c 1 R 1 / 2 3 1 v 2 0 h 3 / 2 E u 2 / 3 d u
The integral  0 h 3 / 2 E u 2 / 3 d u = 0 u m a x E d u  equals the area under the  E u 2 / 3 = f u  graph as shown in Figure 1d. Thus,
I 1 = 4 c 1 R 1 / 2 3 1 v 2 E 1 Δ u + E 2 Δ u + + E N Δ u
The average value of the function  E u 2 / 3  is provided below:
E ¯ u 2 / 3 = E 1 Δ u + E 2 Δ u + + E N Δ u N Δ u = E ¯
Thus, Equation (16) can be written in the form:
I 1 = 4 c 1 R 1 / 2 3 1 v 2 0 h 3 / 2 E u 2 / 3 d u = 4 c 1 R 1 / 2 3 1 v 2 E ¯ u 2 / 3 N Δ u = 4 c 1 R 1 / 2 3 1 v 2 E ¯ h 3 / 2
The same procedure can also be applied to every integral of Equation (14). For,
I 2 = 2 c 2 1 v 2 0 h E y y d y ,   y 2 = u ,   d u = 2 y d y
Thus,
I 2 = 2 c 2 1 v 2 0 h 2 E u d u  
In addition, the integral of Equation (21) equals the area under the  E u = f u  graph:
  I 2 = 2 c 2 1 v 2 0 h 2 E u d u = 2 c 2 1 v 2 E 1 Δ u + E 2 Δ u + + E N Δ u
The average value of the function  E u  is provided below:
E ¯ u = E 1 Δ u + E 2 Δ u + + E N Δ u N Δ u = E ¯
Thus, Equation (21) is modified as follows:
I 2 = 2 c 2 1 v 2 0 h 2 E u d u = 2 c 2 1 v 2 E ¯ u N Δ u = 2 c 2 1 v 2 E ¯ h 2
As already mentioned, the same approach can be applied to any integral. For the last one,
I N = 2 c N R 2 N 1 v 2 0 h E y y N 1 d y ,   y N = u ,     d u = N y N 1 d y
Thus,
I 4 = 2 c N R 2 N 1 v 2 0 h N E u 1 / N d u
Using the area under the  E u 1 / N = f u  graph,
0 h N E u 1 / N d u = E 1 Δ u + E 2 Δ u + + E N Δ u
The average value of  E u 1 / N  is,
E ¯ u 1 / N = E 1 Δ u + E 2 Δ u + + E N Δ u N Δ u = E ¯
Hence,
I N = 2 c N R 2 N 1 v 2 0 h N E u 1 / N d u = 2 c N R 2 N 1 v 2 E ¯ u 1 / N N Δ u = 2 c N R 2 N 1 v 2 E ¯ h N
Finally, Equation (14) is written as follows:
F = I 1 + I 2 + I 3 + I 4 + + I N
Using Equations (19), (24), and (29) it is concluded:
F = 2 E ¯ R 1 v 2 2 3 c 1 R 1 / 2 h 3 / 2 + 1 2 c 2 R 1 h 2 + 1 3 c 3 R 2 h 3 + 1 4 c 4 R 3 h 4 + + 1 N c N R 1 N h N
Equation (31) is the same as Equation (10), for elastic half spaces. However, in this case, the fitting parameter is the average Young’s modulus. It should be evident that Equation (31) can be used for soft heterogeneous samples.

3.2. Axisymmetric Indenters with General Shape

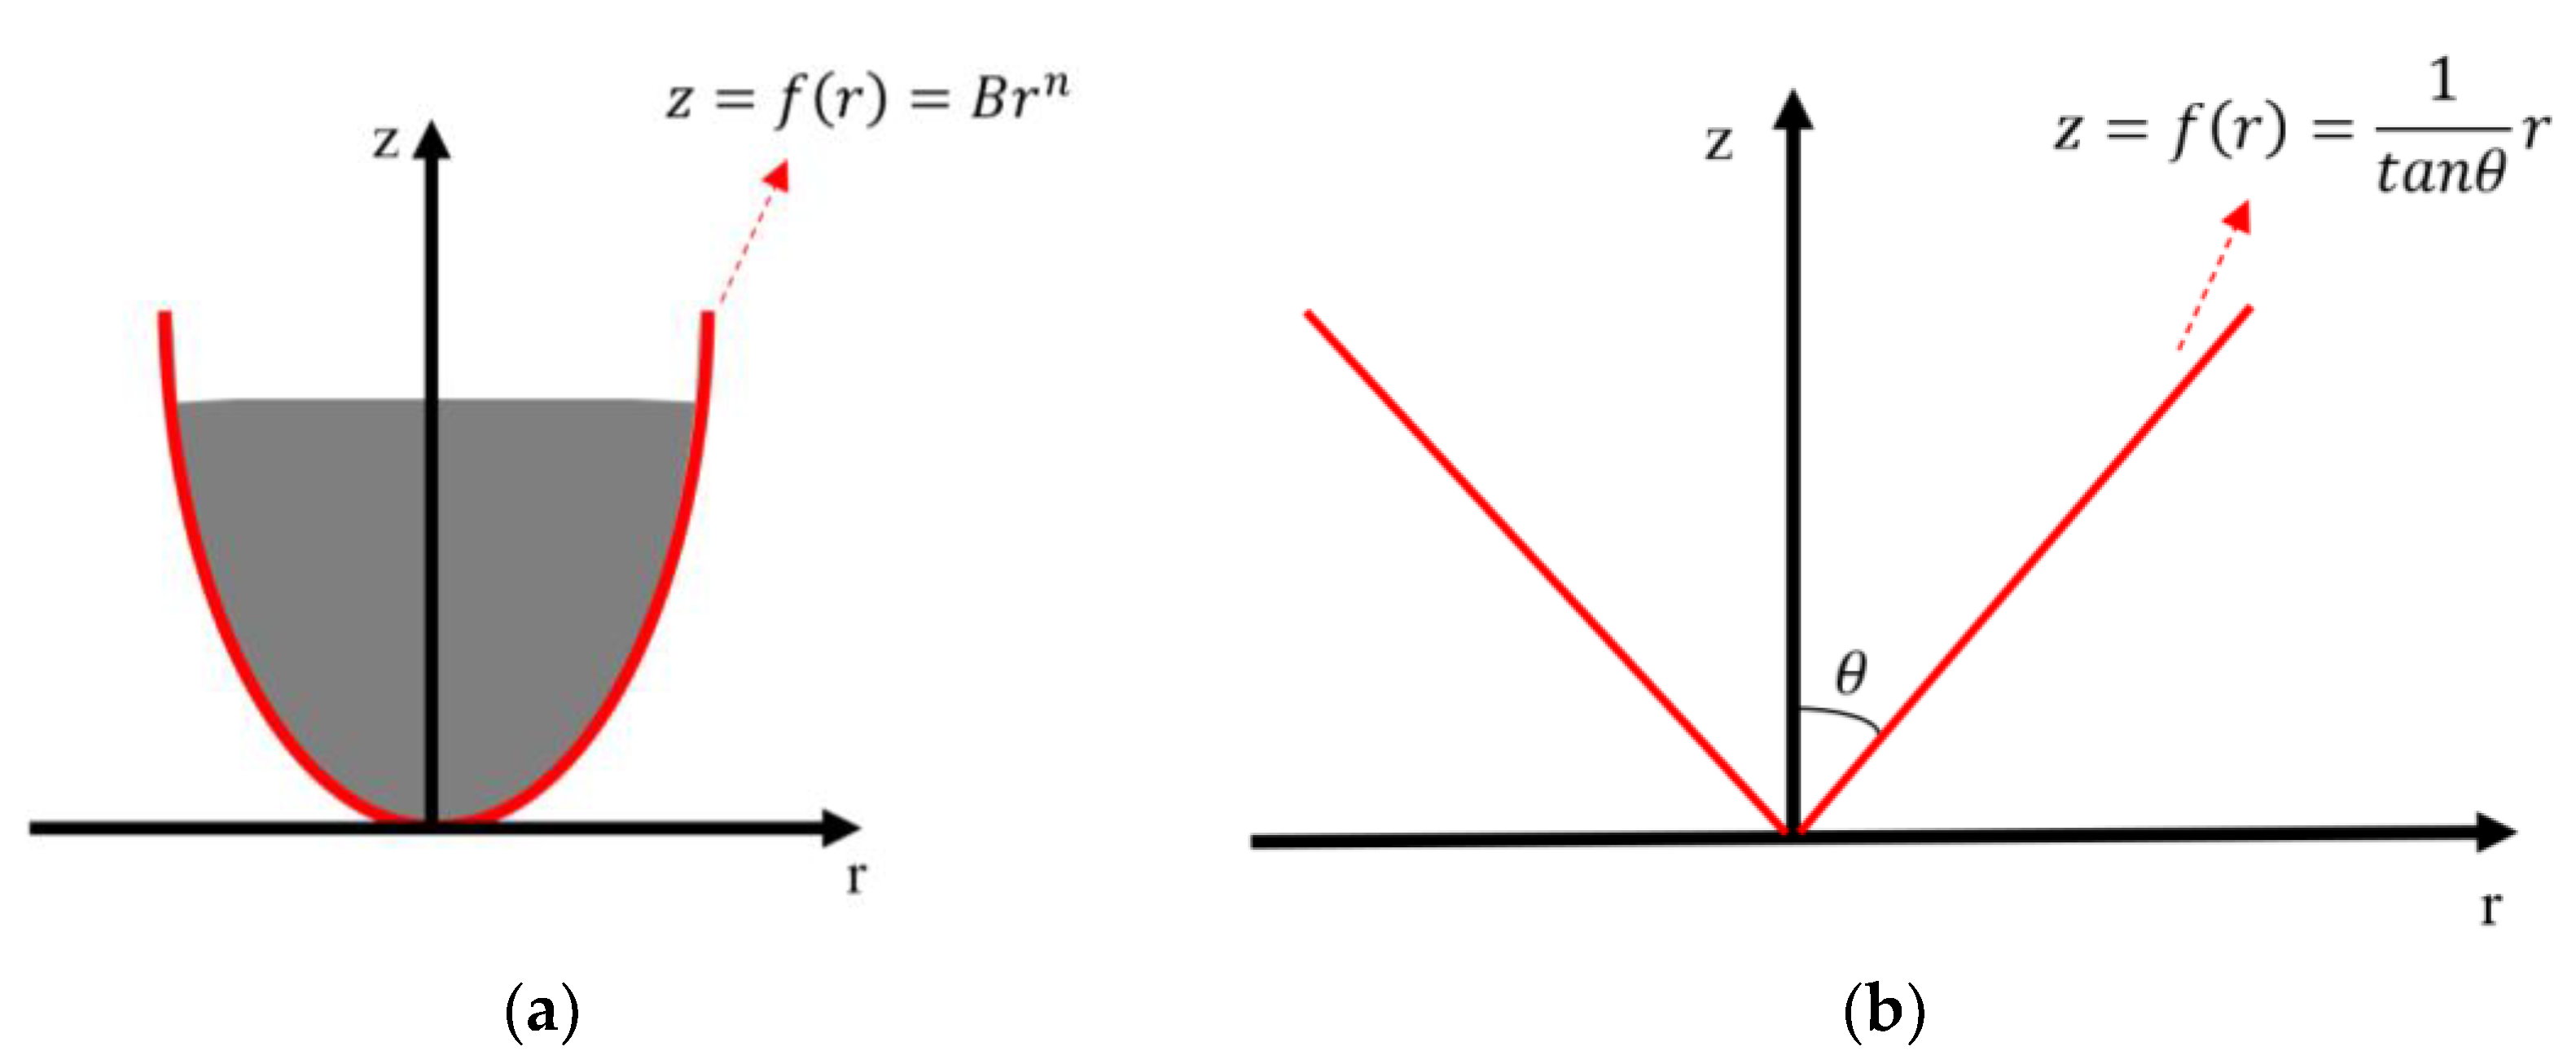
Sneddon [24,26] has shown that for the indentation of an elastic half-space by an axisymmetric rigid indenter described by the power-law relation  z = B r n  (where r is the radial distance from the center of contact (Figure 2a)), the force-indentation relationship is:
F = 2 E 1 v 2 π Β 1 / n n n + 1 Γ n 2 + 1 2 Γ n 2 + 1 1 / n h 1 + 1 / n
where  B  is a constant parameter that depends on the indenter’s shape and  Γ .  is the gamma function. For a specific indenter, the  1 π Β 1 / n n n + 1 Γ n 2 + 1 2 Γ n 2 + 1 1 / n  is a constant parameter and it can be symbolized as  c . For example, for a conical indenter with cone’s half angle  θ r = z t a n θ , or  z = 1 t a n θ r  (Figure 2b). Thus,  B = 1 / t a n θ  and  n = 1 . In addition,  Γ 1 2 + 1 2 = 1  and  Γ 1 2 + 1 = π / 2 . Therefore, Equation (32) takes the form,  F = 2 E t a n θ π 1 v 2 h 2 .
Thus, Equation (32) can be simply written as:
F = 2 E c 1 v 2 h 1 + 1 / n
The contact stiffness can be written as follows:
S = d F d h = 2 E c 1 v 2 1 + 1 n h 1 / n
In the general case, the Young’s modulus is depth-dependent, thus,
S y = d F d y = 2 E y c 1 v 2 1 + 1 n y 1 / n
In Equation (35),  y  symbolizes an arbitrary value of the indentation depth for which  0 y h . Using Equation (11),
F = 0 h S y d y = 2 c 1 v 2 1 + 1 n 0 h E y y 1 / n d y
By changing variable  y 1 n + 1 = u ,   d u = 1 + 1 n y 1 / n d y , Equation (36) is written as follows:
F = 0 h S y d y = 2 c 1 v 2 n + 1 n n 1 + n 0 h n + 1 / n E u n / n + 1 d u
The integral  0 h n + 1 / n E u n / n + 1 d u  equals the area under the  E = f u  graph as shown in Figure 1d. Thus,
F = 2 c 1 v 2 E 1 Δ u + E 2 Δ u + + E N Δ u
The average value of the function  E u n n + 1  is provided below:
E ¯ u n n + 1 = E 1 Δ u + E 2 Δ u + + E N Δ u N Δ u = E ¯
Finally,
F = 2 c 1 v 2 E ¯ N Δ u = 2 E ¯ c 1 v 2 h 1 + 1 / n
Equation (40) proves that Equation (32) can be used for heterogeneous samples; however, the fitting factor that is determined is the average Young’s modulus for a specific domain.

3.3. Avoiding a Pseudo-Softening Behavior

The indentation of a material at the nanoscale using a spherical indenter may reach false results if the correct model is not taken into account. For example, when testing cells, Equation (4) is usually employed. However, this equation is valid for parabolic indenters or spherical indenters for small indentation depths (h << R). In this case, Equation (4) can provide the average Young’s modulus for different indentation depths, and as a result, the  E ¯ = f h  graph [12] or the average Young’s modulus maps with respect to the indentation depth [13].
However, for big indentation depths, Equation (4) can also reach false results. For example, when testing a homogeneous sample (i.e.,  E ¯ = c o n s t a n t )  a pseudo-softening behavior may appear. The reason is that the accurate equation is Equation (31) instead of Equation (4). Thus, the fitting parameter is:
E ¯ f i t t i n g = E ¯ r e a l 4 3 c 1 R 1 / 2 h 3 / 2 + c 2 R 1 h 2 + 2 3 c 3 R 2 h 3 + 1 2 c 4 R 3 h 4 + + 2 N c N R 1 N h N = E ¯ r e a l Z
In Equation (41),
Z = 4 3 c 1 R 1 / 2 h 3 / 2 + c 2 R 1 h 2 + 2 3 c 3 R 2 h 3 + 1 2 c 4 R 3 h 4 + + 2 N c N R 1 N h N
It has been previously shown [25] that for  0 h / R 4.95  the term  Z  can be expressed as the sum of six factors with  c 1  = 1.0100000,  c 2  = −0.0730300,  c 3  = −0.1357000,  c 4  = 0.0359800,  c 5  = −0.0040240 and  c 6  = 0.0001653. For any indentation depth  Z < 1 . In addition, as the indentation depth increases, the factor  Z  decreases [25]. Thus, since for an elastic half space  E ¯ r e a l = c o n s t a n t E ¯ f i t t i n g  decreases as the indentation depth increases. To provide an example of pseudo-softening behavior, open access simulated curves using a spherical indenter, as described in Section 2.2, were used.
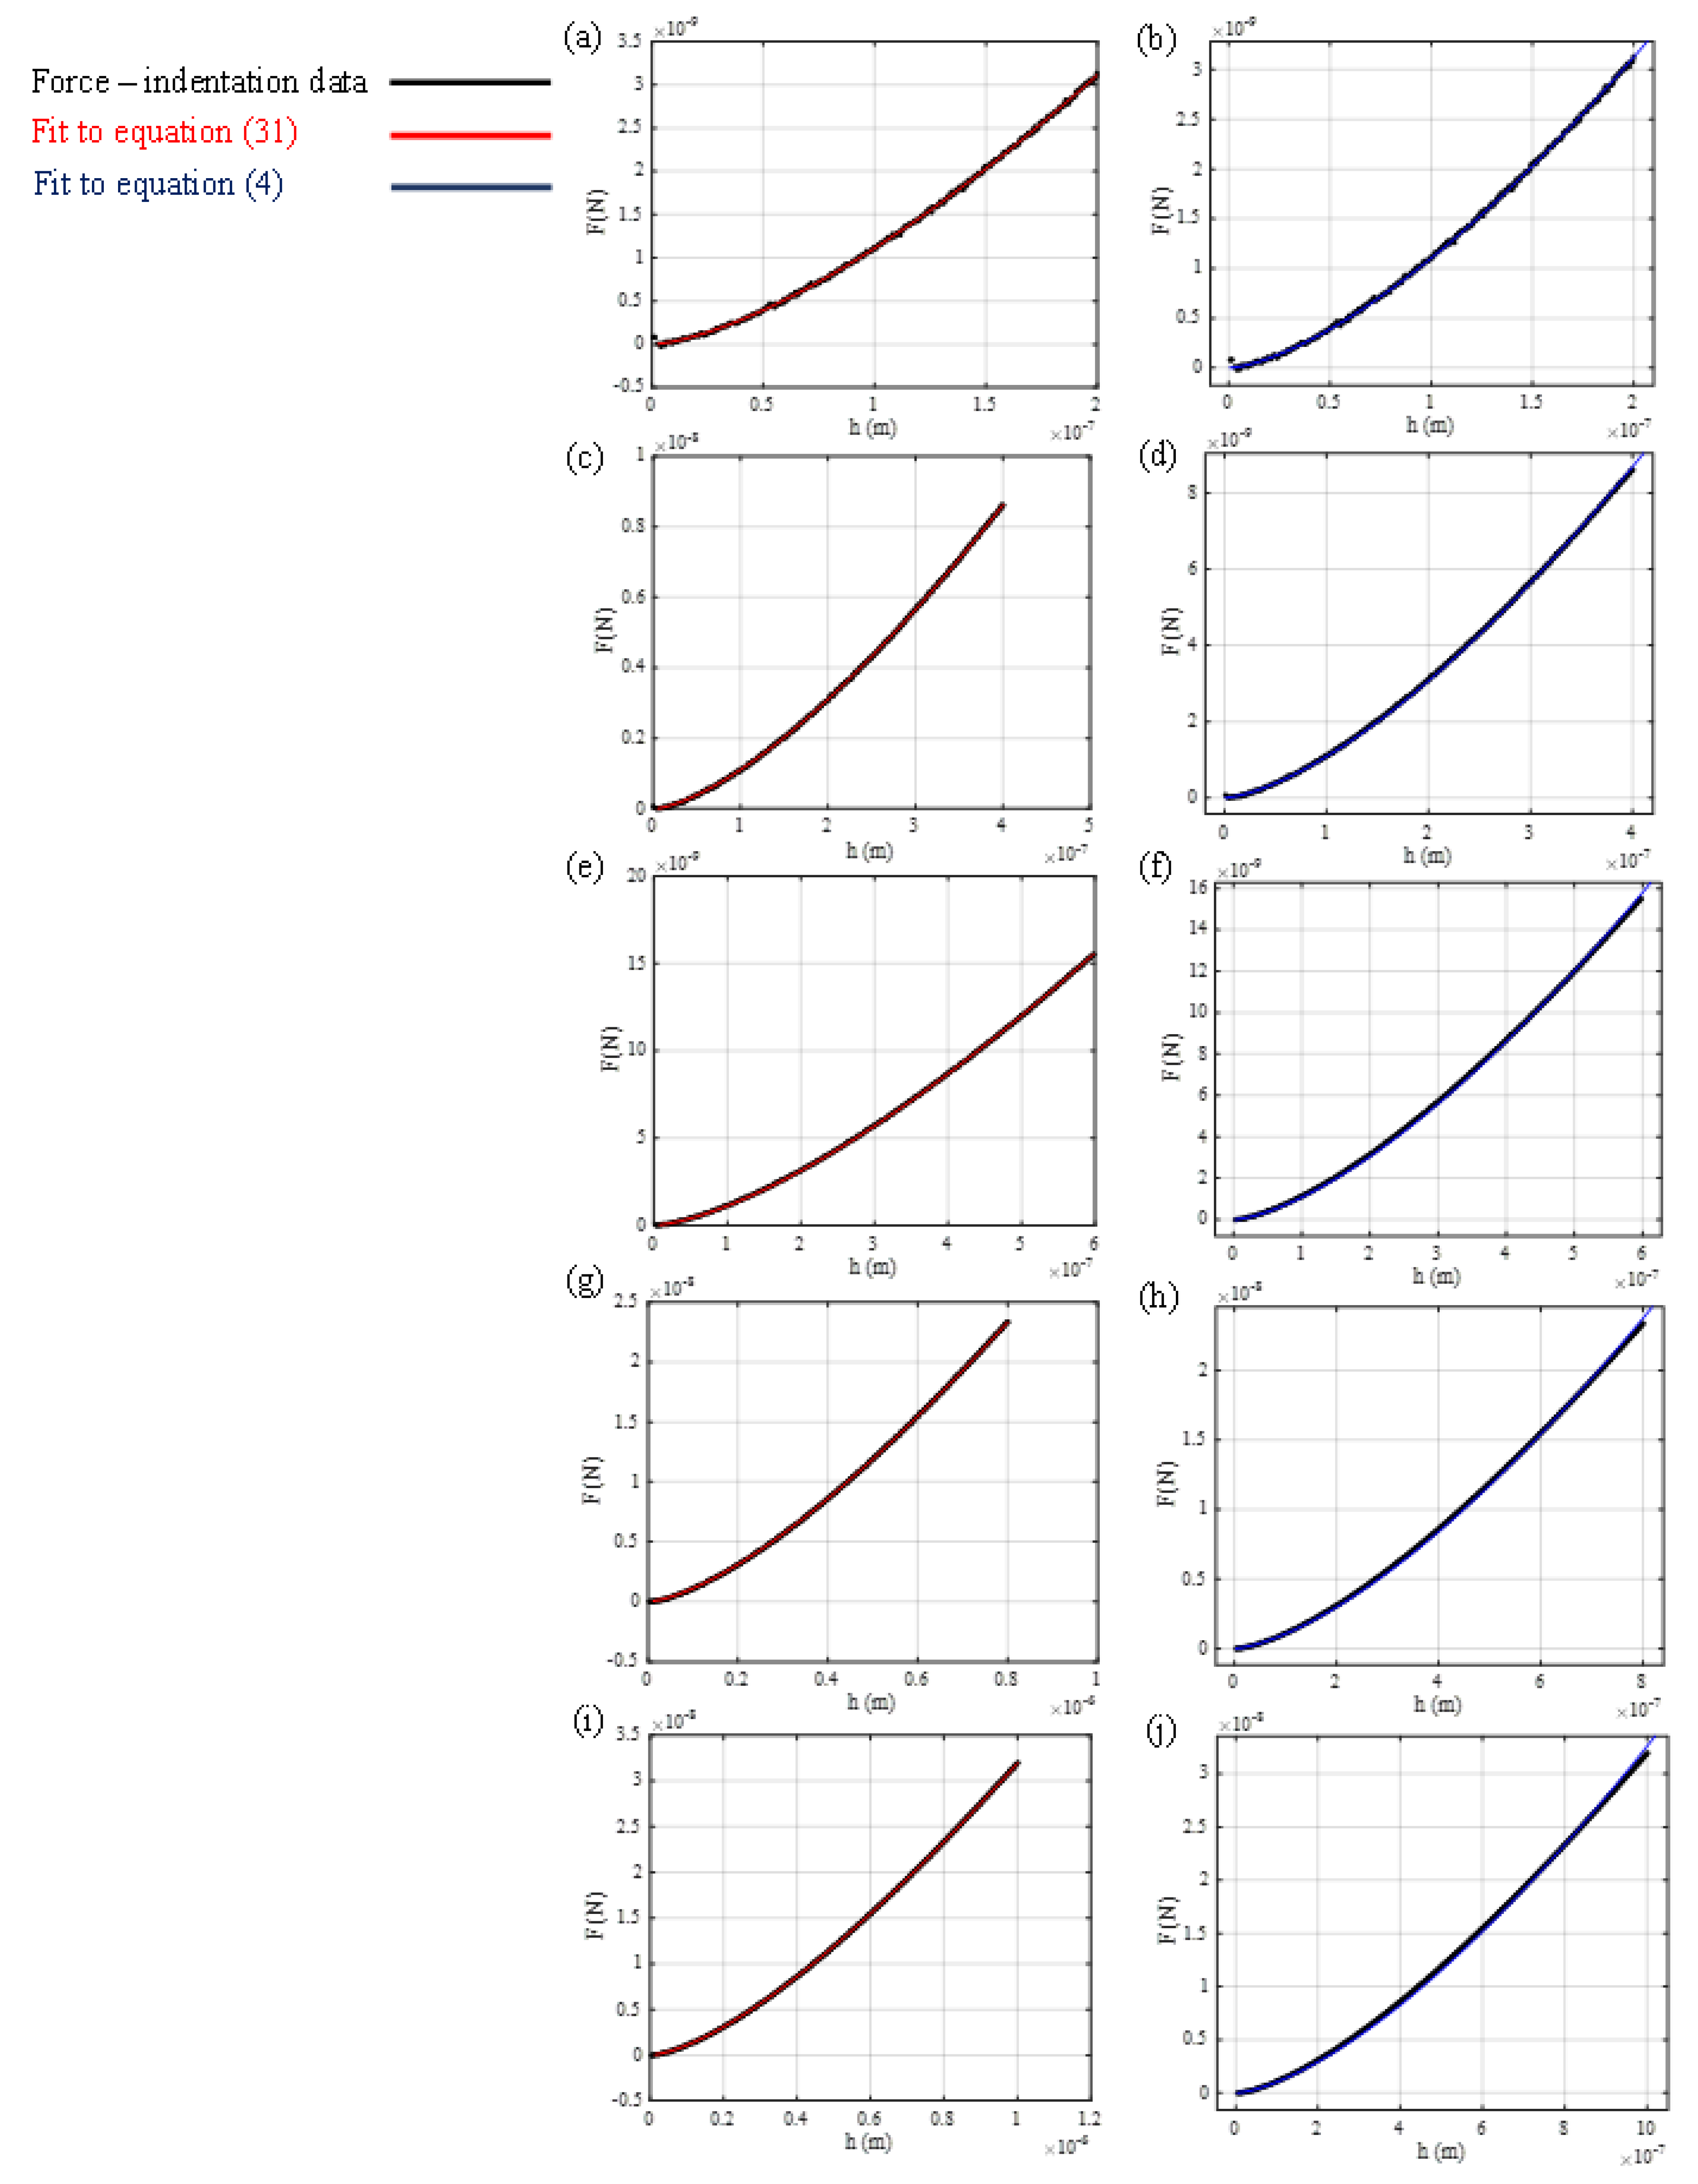
In Figure 3, five force indentation curves with maximum indentation depths of 200 nm (Figure 3a,b), 400 nm (Figure 3c,d), 600 nm (Figure 3e,f), 800 nm (Figure 3g,h), and 1000 nm (Figure 3i,j) are presented. Since the tested sample is an elastic half space with Young’s modulus  E = 20   kPa , regardless of the maximum indentation depth, the average Young’s modulus should be  E ¯ = 20   kPa  in any case. In Figure 3a,c,e,g,i the force indentation data was fitted to Equation (31). In every case, the R-squared coefficient resulted in  R 2 = 1.0000  and the average Young’s modulus was 20 kPa.
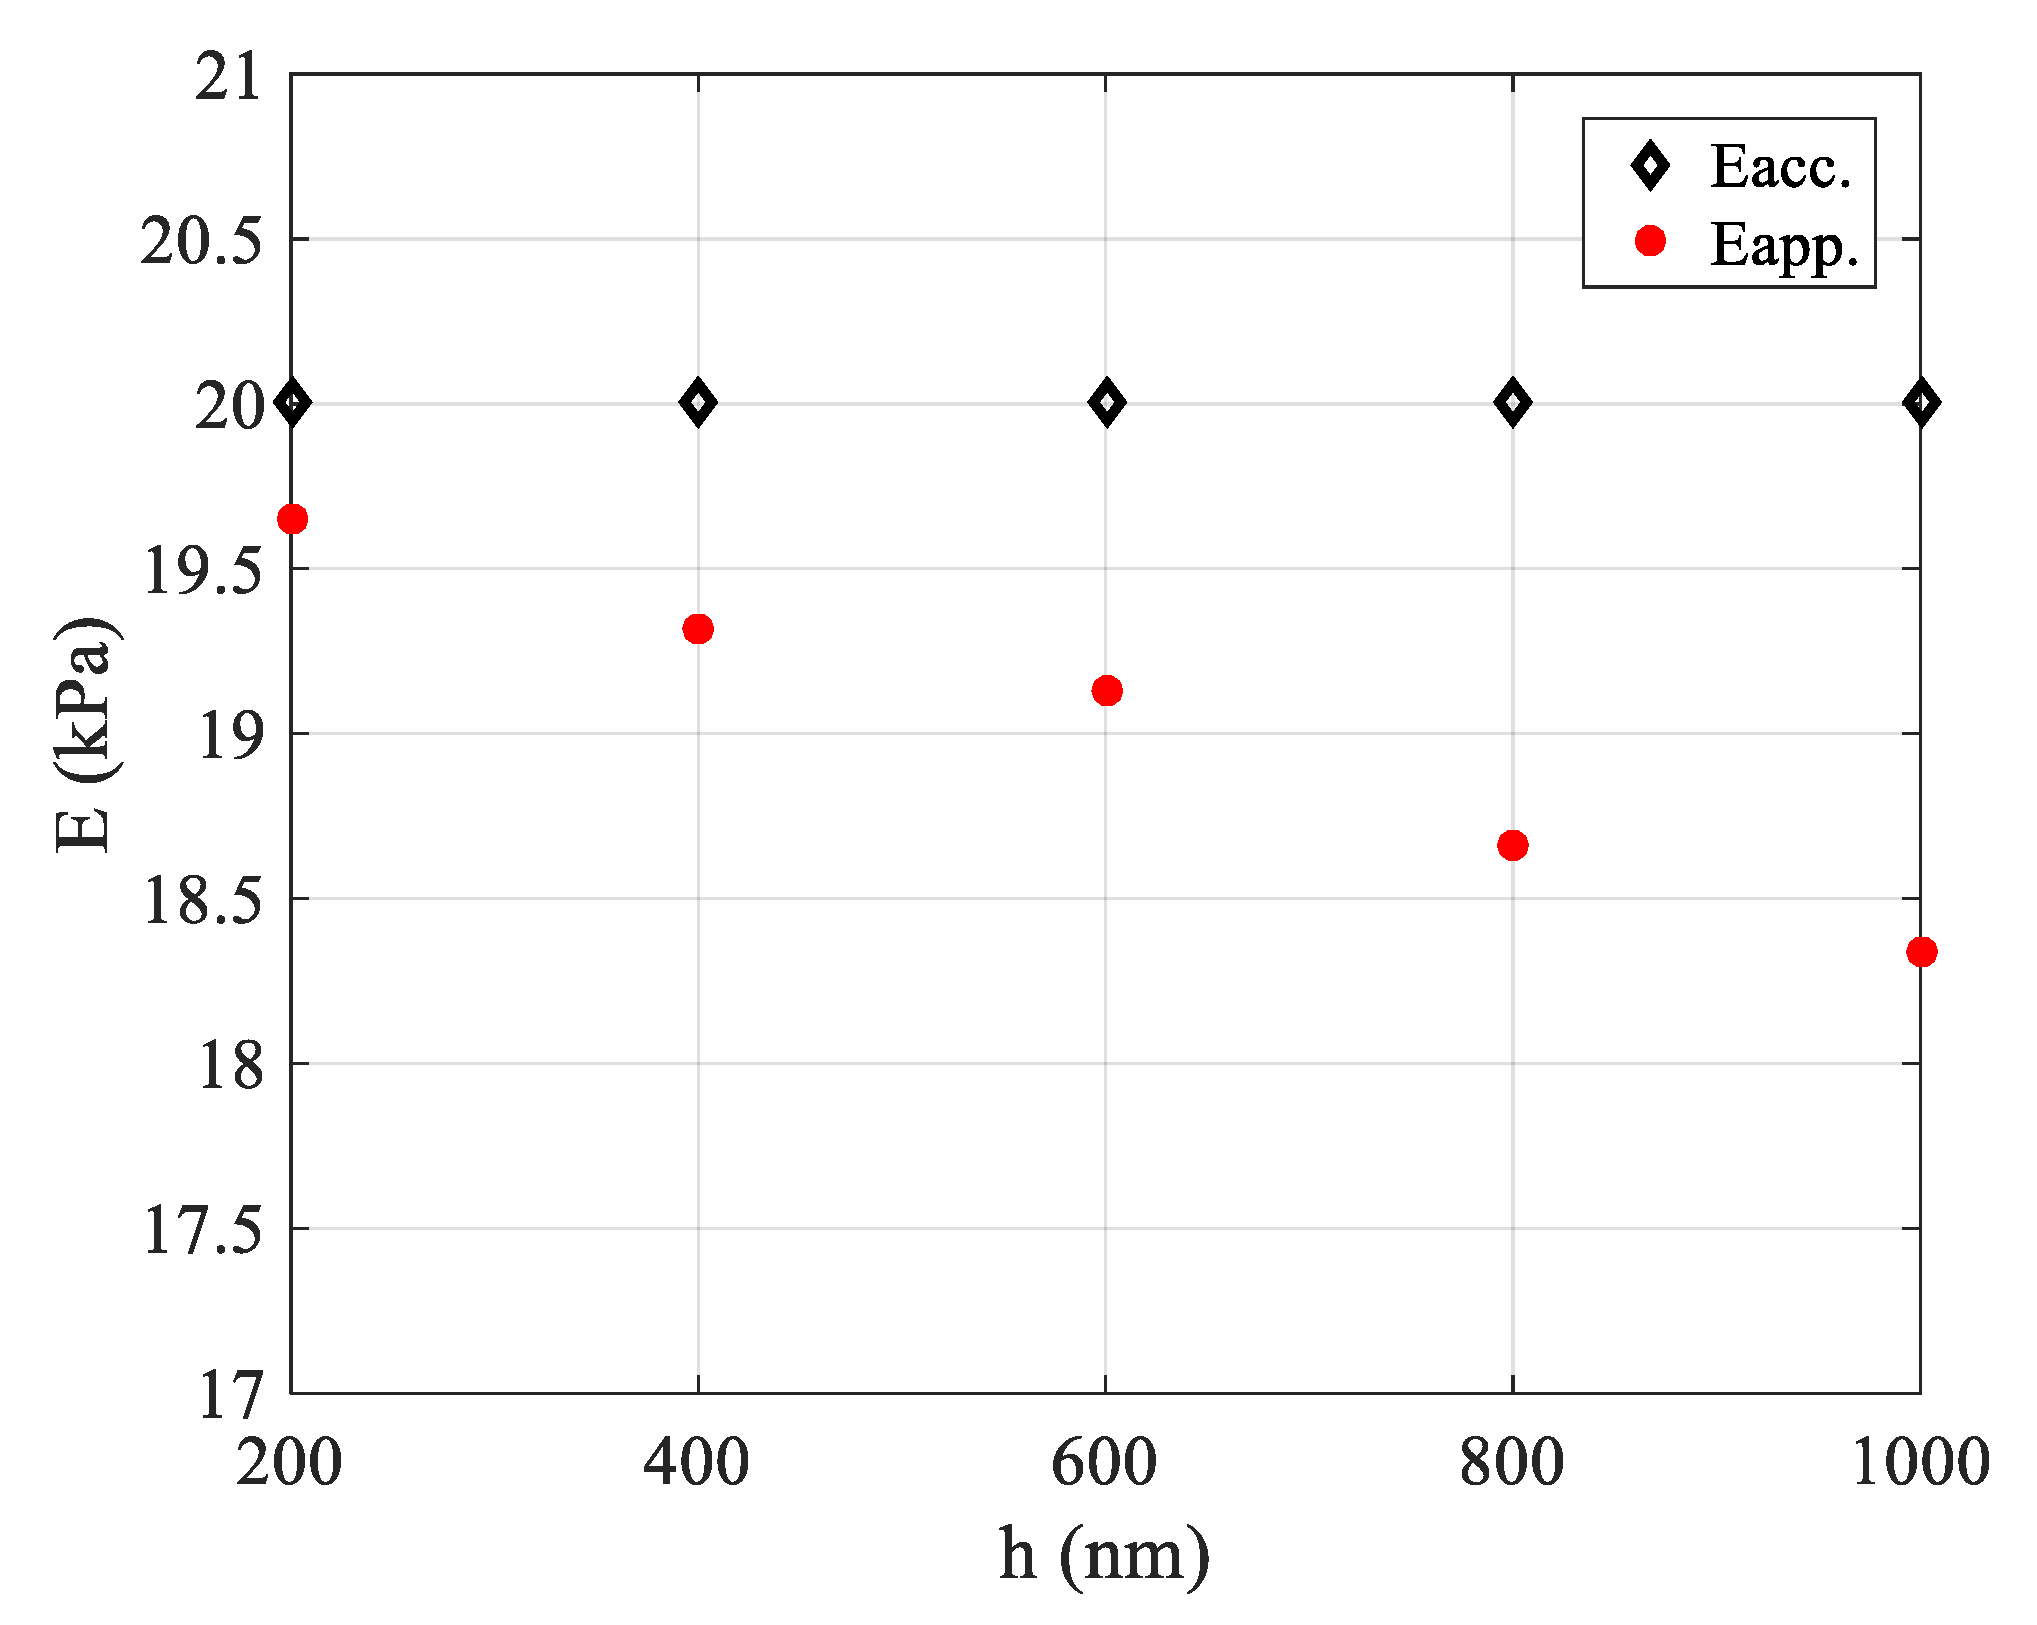
In Figure 3b,d,f,h,j the data was fitted to Equation (4), which is the most commonly used equation for spherical indentations on soft samples. However, as already mentioned, Equation (4) is only valid for small indentation depths compared to the tip radius. Thus, the errors when using it for deep spherical indentations cannot be ignored. In particular, in Figure 3b,  E ¯ = 19.65   kPa  ( R 2 = 0.9997 ) , in Figure 3d,  E ¯ = 19.31   kPa  ( R 2 = 0.9999 ) , in Figure 3f,  E ¯ = 19.13   kPa  ( R 2 = 0.9996 ) , in Figure 3h,  E ¯ = 18.66   kPa  ( R 2 = 0.9995 ) , and in Figure 3j,  E ¯ = 18.34   kPa  ( R 2 = 0.9992 ) . Thus, for  h = 1000   nm , there is an 8.3% smaller value compared to the actual one (i.e., 20 kPa). In Figure 4, the average Young’s modulus when fitting the force indentation data to Equation (31) and when fitting the data to Equation (4) are presented comparatively. The pseudo-softening behavior in the second case is clear.
At this point, it should be noted that for bigger indentation depths, the error is also bigger. Apart from the error in the calculation of the average Young’s modulus, the results are also misleading regarding the sample’s behavior. In particular, pseudo-softening behavior was recorded for the case of a homogeneous and isotropic material. It is significant to note that many biological materials present a ‘stiffening’ or ‘softening’ behavior as the indentation depth increases due to their high mechanical heterogeneity [27,28]. For example, cells present a ‘softening’ behavior as the indentation depth increases [12,20]. Therefore, a false data processing can lead to significant misunderstandings regarding the behavior of an unknown sample. An approximately homogeneous sample can be categorized as a heterogeneous sample with a softening behavior as the indentation depth increases, or the extent of the mechanical heterogeneity cannot be revealed due to the contribution of errors in data processing.
Thus, the extension of the average Young’s modulus approach for deep spherical indentations is significant to avoid errors in data processing when testing highly heterogeneous materials. For the same reasons, it is also important to extend the applicability of the average Young’s modulus approach for axisymmetric indenters with a general shape since, in many cases, blunted AFM pyramidal tips are approximated to perfect conical indenters. Thus, similar errors as for the case of spherical indentations may occur.

3.4. An Example on a H4 Human Glioma Cell

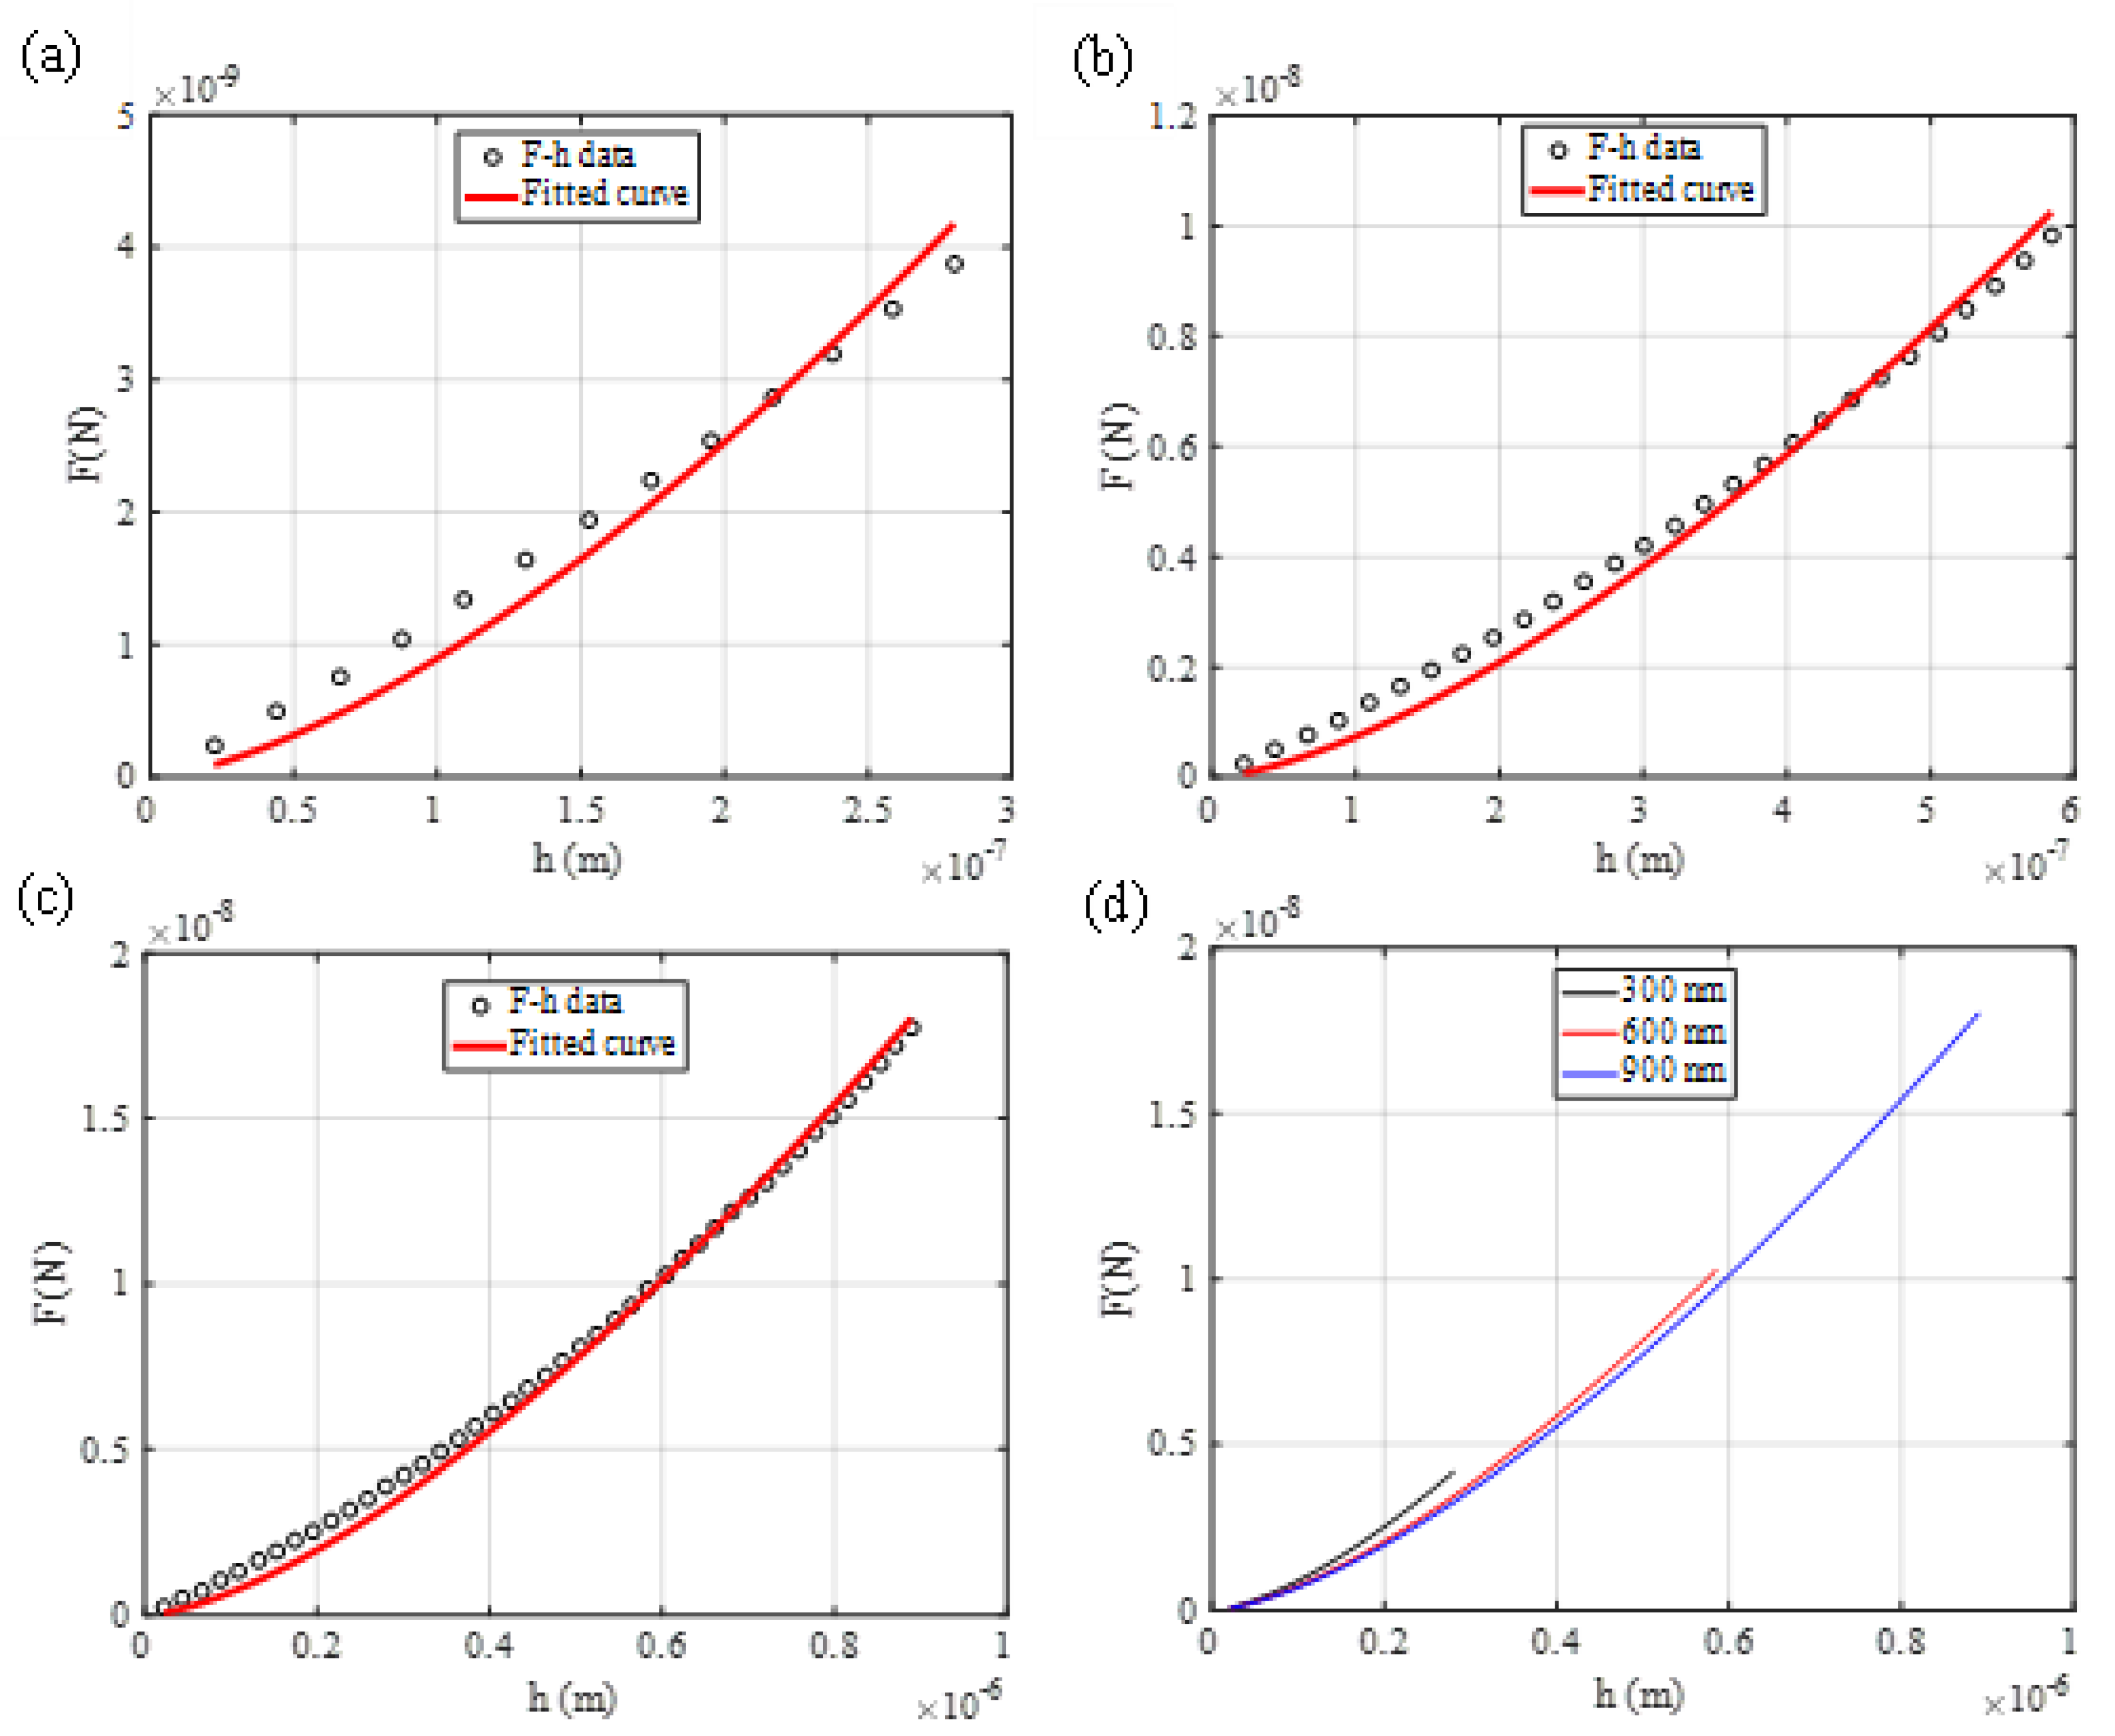
An example of calculating the average Young’s modulus of a H4 human glioma cell is presented in Figure 5. In Figure 5a, the maximum indentation depth was ~300 nm. For  h 1 = 300   nm ,   E ¯ 1 = 10.2   kPa . This value is valid at the domain  0 h 300   nm .  The R-squared coefficient resulted in  R s . c . 2 = 0.9604 . In Figure 5b, the same procedure was performed at the domain  0 h 600   nm . In this case,  E ¯ 2 = 8.4   kPa  and  R s . c . 2 = 0.9943 . In Figure 5c,  E ¯ 3 = 7.9   kPa  at the domain  0 h 900   nm  ( R s . c . 2 = 0.9981 ). In Figure 5d, the fitted curves presented in Figure 5a–c are presented comparatively. The average Young’s modulus reduces as the indentation depth increases, as expected [12].

4. Discussion

In this paper, previously presented theoretical methods [13] were used to extend the applicability of classic equations for indentations using spherical or arbitrary-shaped axisymmetric indenters on highly heterogeneous materials. It was shown that when fitting the force—indentation data obtained on soft heterogeneous materials, to Hertzian equations, the fitting parameter that is determined is the average Young’s modulus for a specific indentation depth. The extension of the average Young’s modulus approach to the aforementioned cases is significant since, in many cases, the AFM tips cannot be approximated as parabolic or conical. Spherical indenters (e.g., using AFM borosilicate glass spheres) are used in many experiments when testing the mechanical properties of cells or other biological samples [15,16,17,18,19,20]. In addition, pyramidal tips cannot approximate perfect conical indenters in any case [14].
Errors regarding the approximation of the AFM tip can result in significant misunderstandings regarding the behavior of an unknown sample. For example, when using Equation (4) on an elastic half space for data processing, a pseudo-softening behavior was recorded. The pseudo-softening behavior can also be recorded in other cases. It was recently shown that an AFM tip that can be considered a truncated cone can lead to the aforementioned behavior if approximated to a perfect cone [29]. The force with respect to the indentation depth for an indentation experiment using a truncated cone is given by the equation below [29]:
F = 2 E t a n θ π 1 v 2   h 2 + 4 E t a n θ π 1 v 2 h t i p h
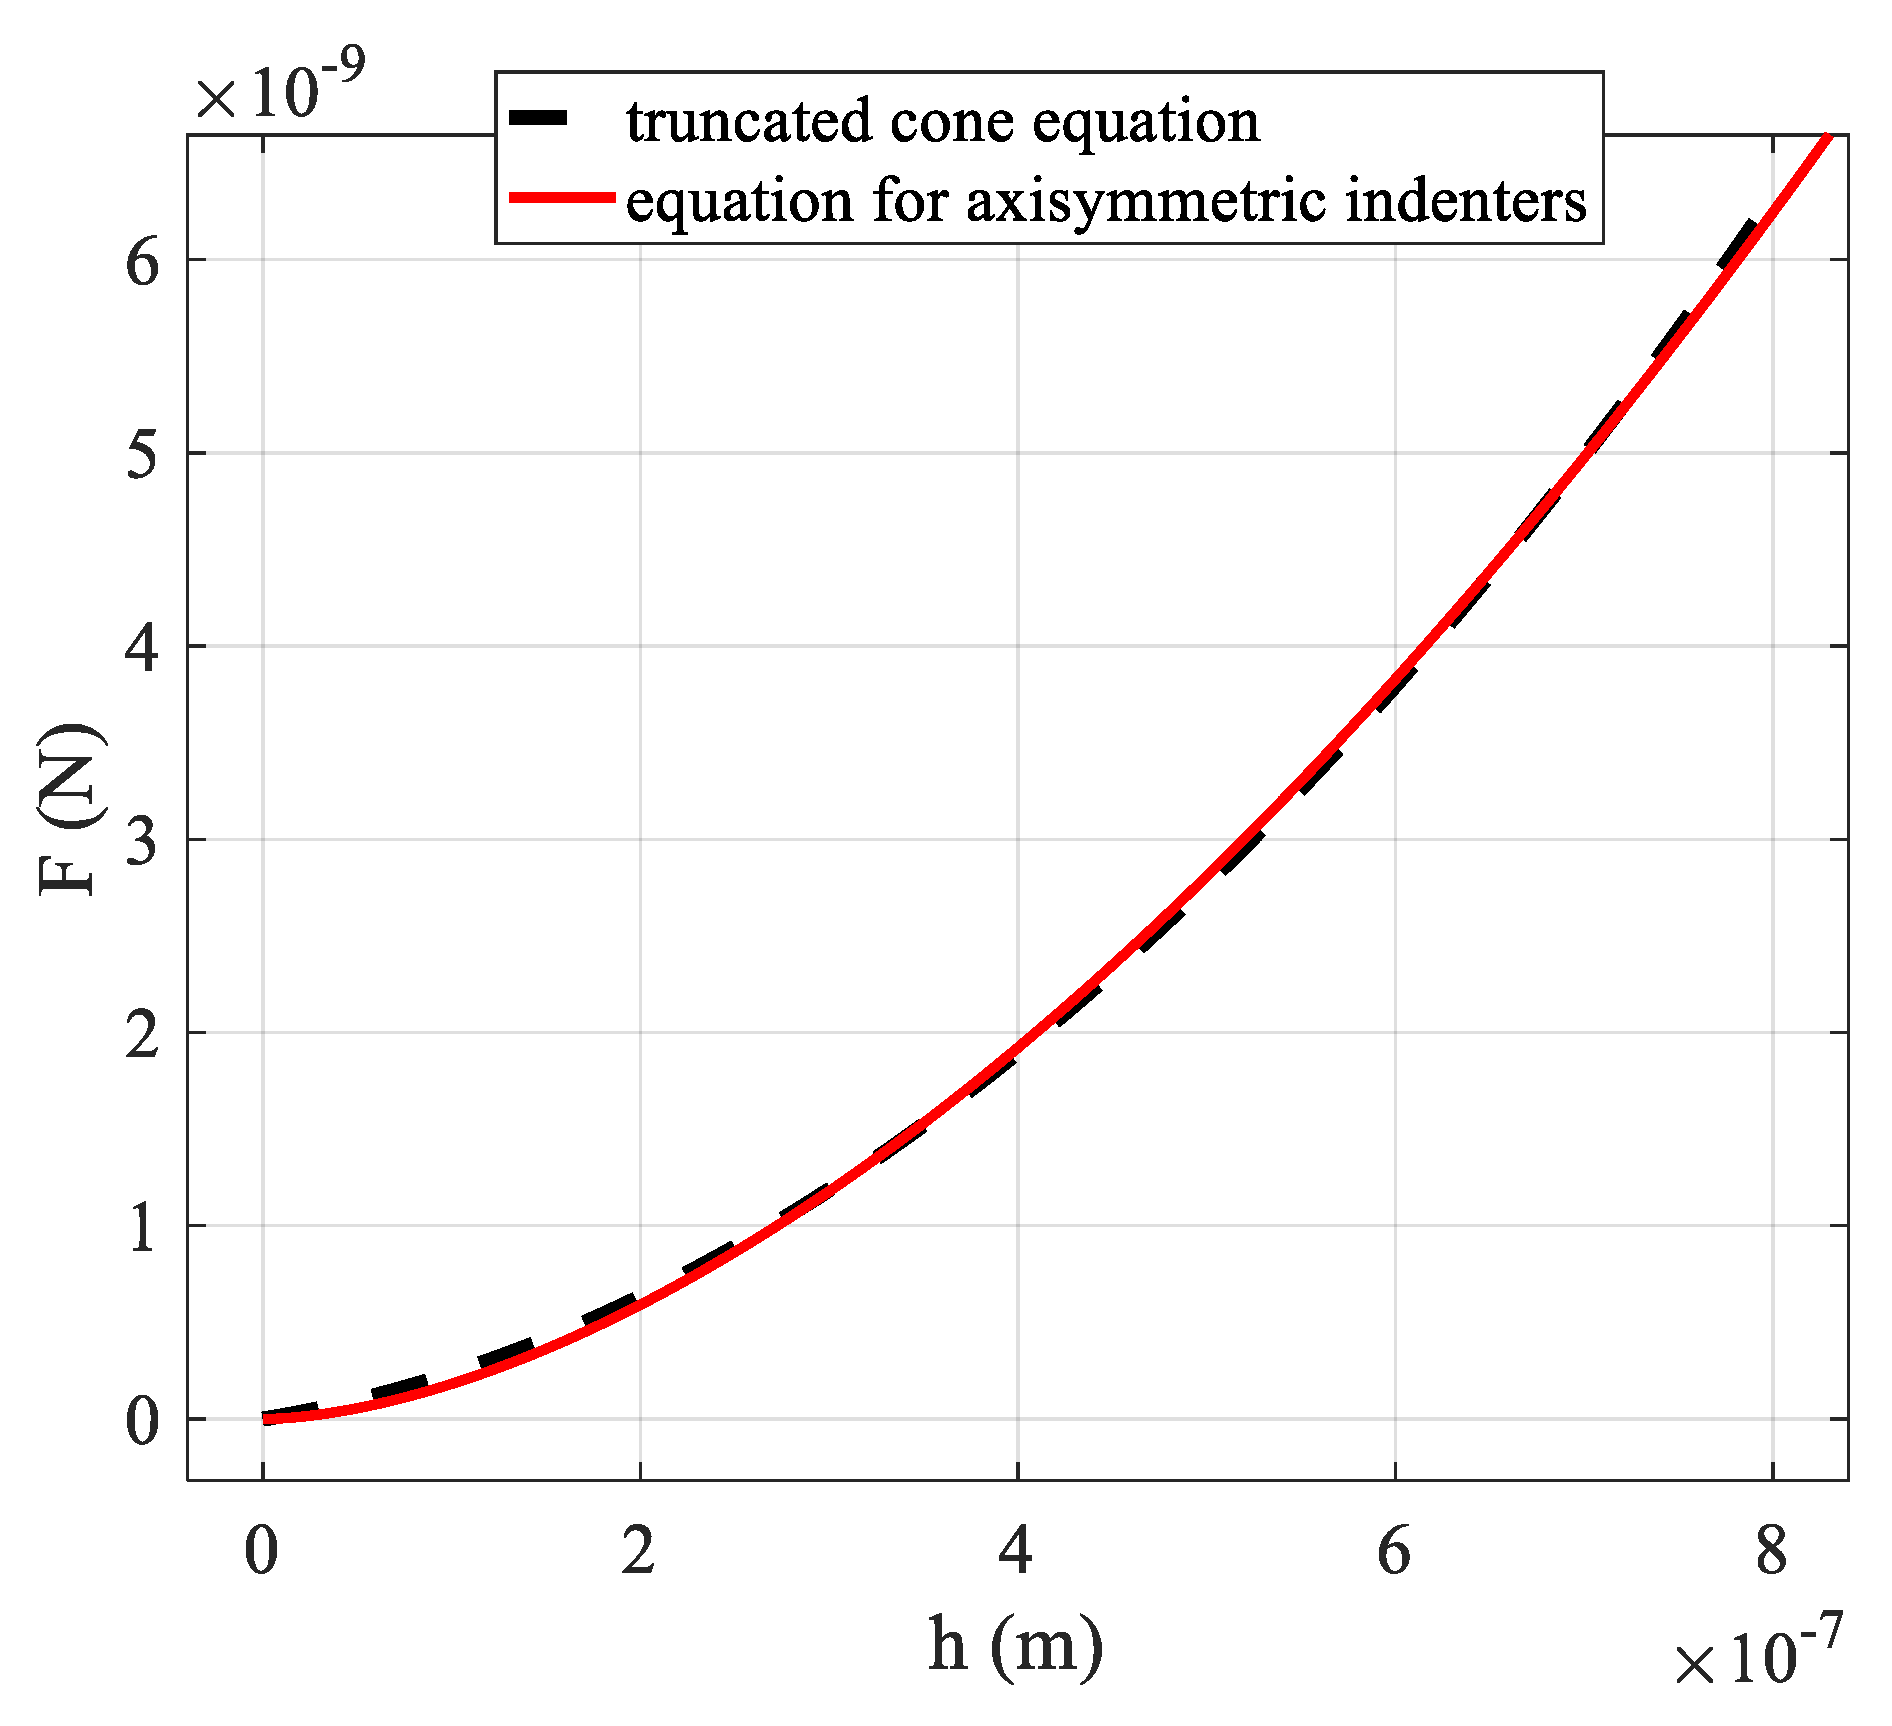
However, a truncated cone is an axisymmetric indenter that can be described by an arbitrary function Z = f(r), which is rotated about the z-axis to produce a solid revolution. Thus, Equation (40) is also valid for data processing. It is easy to prove that Equation (40) is also valid by fitting it to simulated force—indentation data obtained on an elastic half space using a truncated cone (Figure 6). The Young’s modulus and the Poisson’s ratio of the half space were E = 20 kPa and v = 0.5, respectively, the cone’s angle θ = 25° and the  h t i p = 100   nm . The force indentation data was fitted to an equation of the form  F = a h m  (the same form as Equation (40), where  a = 2 E ¯ c 1 v 2  and  m = 1 + 1 / n . The domain was  0 h 800   nm  and the fitting factors were  a = 144.6 m = 1.7 ). The R-squared coefficient resulted in  R s . c . 2 = 0.9996 . As a result, it is also rational to extend the applicability of Equation (43) for highly heterogeneous soft samples using the average Young’s modulus as follows:
F = 2 E ¯ t a n θ π 1 v 2   h 2 + 4 E ¯ t a n θ π 1 v 2 h t i p h
Thus, it is crucial to extend the applicability of the average Young’s modulus approach on highly heterogeneous materials for indenters with different geometries, since false approximations of the AFM tip can result in significant errors and misconceptions regarding the behavior of an unknown sample. The average Young’s modulus approach is significant since it can provide quantitative information regarding the depth–dependent mechanical properties of soft samples (i.e., depth-dependent average Young’s modulus maps [13]). The reason is that the determination of the depth-dependent mechanical properties of biological samples can lead to a 3D mechanical characterization [30]. More specifically, classic Young’s modulus maps provide a 2D mechanical characterization since they present the mechanical variability of the sample at the x-y plane, but they do not provide the changes of the mechanical properties over the z-axis (depth-dependent mechanical properties) [31,32,33,34]. The extension of the Hertzian equations to heterogeneous materials is significant since, by using this approach, a 3D mechanical nanocharacterization can be achieved. In the proposed model, it is assumed that the mechanical heterogeneity is only depth-dependent for each measurement (i.e., for each force-indentation curve). However, this assumption does not preclude a 3D nanocharacterization. By obtaining multiple force-indentation curves on the sample (i.e., by creating average Young’s modulus maps [30]), it is easy to derive the mechanical properties of the samples in three dimensions. This approach has been previously used for conical indenters to achieve 3D mechanical nanocharacterization [30]. With the results presented in this paper, the same procedure can be applied regardless of the indenter’s geometry.
As previously mentioned, an accurate 3D mechanical characterization at the nanoscale may lead to new techniques for accurate cancer diagnosis, for recording a cancer metastasis procedure at early stages, or for characterization at the nanoscale of highly heterogeneous materials [31,35,36,37,38,39,40,41,42,43,44,45,46].
Lastly, using the presented by this paper approach, the  F = f h  equation for any heterogeneous sample can be derived. If multiple fitting procedures are performed on the force-indentation data, then the average Young’s modulus for different indentation depths can be obtained:
For  0 h h 1 E ¯ = E ¯ 1
For  0 h h 2 E ¯ = E ¯ 2
For  0 h h N E ¯ = E ¯ N
Thus, if we use the values  E ¯ 1 E ¯ 2 , , E ¯ N  then we can find an  E ¯ = f h  function and as a result, we can find the real  F = f h  function.
At this point, it is significant to highlight the limitations of the presented approach. The proposed model assumes that a heterogeneous sample can be considered as the sum of N narrow homogeneous slices, where  N . In other words, when processing force indentation data for each nanoregion, it is assumed that mechanical heterogeneity occurs only in the z-direction and not in the x-y plane. However, in materials with extreme variability in mechanical properties in the x-y plane, this approach may lead to errors in the analysis.
For example, suppose the volume of a semi-infinite material at the tested region is divided into two: the left and the right sides, with one having  E l  and the other having  E r . Suppose the tip is aligned such that one-half projects over the right portion of the sample and the other over the left portion. For simplicity, assume  E r E l . Then the force curve will approximately evolve as if only the  E l  part is being indented. In this case, the sample will seem slightly softer because the effective radius of the tip is smaller, and thus the force will be reduced by a factor of approximately  2 1 / 2  (or a little smaller because of geometry). In a real experiment, the case  E r E l  does not apply, so assuming homogeneity in the x-y plane will result in an error, but it will be significantly smaller than 1/ 2 1 / 2 .
Furthermore, in Section 3.4, a cell was used as an example of a heterogeneous material. However, it is still under discussion whether a cell can be considered as the sum of N slices with elementary thickness. In particular, the cytoskeleton contains microtubules and filaments, which are 1D structures on a local scale. From a mathematical point of view, if the N slices have an elementary thickness (since,  N ), their thickness can be considered orders of magnitude smaller compared to the cell’s inner parts, making this approach seem rational. Thus, if the heterogeneity in the x-y plane for each force curve is negligible, the proposed model can provide an approximation of the depth-dependent heterogeneity. Nevertheless, areas with extensive heterogeneity at the x-y plane (within the tested nanoregion) will not be accurately characterized using this approach. To determine whether this approach applies to any cell and calculate the exact errors in each case, extensive experimental research should be performed. Regardless of the exact error in any case, the proposed approach is a simple way to record whether the sample of interest ‘stiffens or softens’ as the indentation depth increases.
Lastly, it is significant to also note the importance of the proposal made by this paper’s analysis. The benefit of this approach is that it explains why the Hertz equations provide valuable results despite being initially derived for homogeneous materials. Additionally, this approach shows how the Hertzian equations can be correctly used for heterogeneous materials. In many cases, Young’s modulus maps are presented without mentioning the indentation depth for each measurement. As the average Young’s modulus strongly depends on the indentation depth, it can be difficult to obtain reproducible results between different research groups. In other words, presenting a Young’s modulus map without specifying the indentation depth for each measurement is meaningless. We propose using a specific domain, where  0 h h m a x  for every force indentation curve and fitting the same data portion in each case [30]. By doing this, we can obtain an average Young’s modulus map that pertains to the domain  0 h h m a x . Then, we can create another Young’s modulus map for a different domain, such as  0 h h m a x , and so on [30]. If every Young’s modulus value on a map refers to the same indentation depth, then the results can be easily reproduced between different research groups.

5. Conclusions

A crucial question regarding AFM indentation experiments on biological samples is whether it is correct to fit the data to equations arising from Hertzian mechanics. Previous research [13] has shown that it is valid to fit Hertzian equations to data obtained from biological samples when using cylindrical, parabolic, or conical indenters. In this case, the fitting parameter is the average Young’s modulus for a specific domain (i.e., 0 ≤ yh). If the maximum depth of indentation changes, the average Young’s modulus will also vary accordingly. However, a critical question remained. In particular, is this approach valid for any indenter? In this paper, it was shown that the same analysis can be applied regardless of the indenter’s geometry. It was proved that when fitting the data to Hertzian equations for spherical indenters or indenters with an arbitrary axisymmetric shape, the fitting parameter that is determined is also the average Young’s modulus. Thus, fitting procedures to classic Hertzian equations are the correct approach towards the mechanical nanocharacterization of highly heterogeneous samples such as biological materials. In other words, the ‘apparent’ Young’s modulus, which is determined as a fitting parameter, equals the average Young’s modulus regardless of the indenter’s shape. It should also be mentioned that providing the ‘apparent’ Young’s modulus without specifying the indentation depth at each point is meaningless. Two different researchers can obtain different results when testing the same sample if the maximum indentation depth is not the same. On the contrary, by providing depth-dependent mechanical properties using the average Young’s modulus, it is easy to obtain reproducible results.

Author Contributions

Conceptualization, S.V.K.; methodology, S.V.K.; investigation and resources, S.V.K., A.S., G.C. and A.M.; writing—original draft preparation, S.V.K. and G.C.; writing—review and editing, S.V.K., A.S., G.C. and A.M.; and funding acquisition, S.V.K. and A.S. All authors have read and agreed to the published version of the manuscript.

Funding

This research was funded by the Cyprus Research and Innovation Foundation, grant number CONCEPT/0521/0069, “3D NANOBIOSAMPLES”(3D Characterisation Of The Nanomechanical Properties Of Biological Samples).

Data Availability Statement

Data from AtomicJ software are referenced in the manuscript and a link is provided.

Conflicts of Interest

The authors declare no conflict of interest.

References

  1. Lekka, M.; Laidler, P. Applicability of AFM in cancer detection. Nat. Nanotechnol. 2009, 4, 72. [Google Scholar] [CrossRef] [PubMed]
  2. Stylianou, A.; Lekka, M.; Stylianopoulos, T. AFM assessing of nanomechanical fingerprints for cancer early diagnosis and classification: From single cell to tissue level. Nanoscale 2018, 10, 20930–20945. [Google Scholar] [CrossRef] [PubMed]
  3. Krieg, M.; Fläschner, G.; Alsteens, D.; Gaub, B.M.; Roos, W.H.; Wuite, G.J.L.; Gaub, H.E.; Gerber, C.; Dufrêne, Y.F.; Müller, D.J. Atomic force microscopy-based mechanobiology. Nat. Rev. Phys. 2019, 1, 41–57. [Google Scholar] [CrossRef]
  4. Plodinec, M.; Loparic, M.; Monnier, C.A.; Obermann, E.C.; Zanetti-Dallenbach, R.; Oertle, P.; Hyotyla, J.T.; Aebi, U.; Bentires-Alj, M.; Lim, R.Y.H.; et al. The nanomechanical signature of breast cancer. Nat. Nanotechnol. 2012, 7, 757–765. [Google Scholar] [CrossRef] [PubMed]
  5. Stylianou, A.; Kontomaris, S.V.; Grant, C.; Alexandratou, E. Atomic Force Microscopy on Biological Materials Related to Pathological Conditions. Scanning 2019, 2019, 8452851. [Google Scholar] [CrossRef]
  6. Stolz, M.; Gottardi, R.; Raiteri, R.; Miot, S.; Martin, I.; Imer, R.; Staufer, U.; Raducanu, A.; Dueggelin, M.; Baschong, W.; et al. Early detection of aging cartilage and osteoarthritis in mice and patient samples using atomic force microscopy. Nat. Nanotechnol. 2009, 4, 186–192. [Google Scholar] [CrossRef]
  7. Stolz, M.; Raiteri, R.; Daniels, A.U.; Van Landingham, A.M.W.R.; Baschong, W.; Aebi, U. Dynamic elastic modulus of porcine articular cartilage determined at two different levels of tissue organization by indentation-type atomic force microscopy. Biophys. J. 2004, 86, 3269–3283. [Google Scholar] [CrossRef]
  8. Drolle, E.; Hane, F.; Lee, B.; Leonenko, Z. Atomic force microscopy to study molecular mechanisms of amyloid fibril formation and toxicity in Alzheimer’s disease. Drug Metab. Rev. 2014, 46, 207–223. [Google Scholar] [CrossRef]
  9. Li, N.; Jang, H.; Yuan, M.; Li, W.; Yun, X.; Lee, J.; Du, Q.; Nussinov, R.; Hou, J.; Lal, R.; et al. Graphite-templated amyloid nanostructures formed by a potential pentapeptide inhibitor for Alzheimer’s disease: A combined study of real-time atomic force microscopy and molecular dynamics simulations. Langmuir 2017, 33, 6647–6656. [Google Scholar] [CrossRef]
  10. Ramalho, R.; Rankovic, S.; Zhou, J.; Aiken, C.; Rousso, I. Analysis of the mechanical properties of wild type and hyperstable mutants of the HIV-1 capsid. Retrovirology 2016, 13, 17. [Google Scholar] [CrossRef]
  11. Zhao, G.; Perilla, J.R.; Yufenyuy, E.L.; Meng, X.; Chen, B.; Ning, J.; Ahn, J.; Gronenborn, A.M.; Schulten, K.; Aiken, C.; et al. Mature HIV-1 capsid structure by cryo-electron microscopy and all-atom molecular dynamics. Nature 2013, 497, 643–646. [Google Scholar] [CrossRef]
  12. Kontomaris, S.V.; Georgakopoulos, A.; Malamou, A.; Stylianou, A. The average Young’s modulus as a physical quantity for describing the depth-dependent mechanical properties of cells. Mech. Mater. 2021, 158, 103846. [Google Scholar] [CrossRef]
  13. Kontomaris, S.V.; Stylianou, A.; Georgakopoulos, A.; Malamou, A. Is it mathematically correct to fit AFM data (obtained on biological materials) to equations arising from Hertzian mechanics? Micron 2022, 164, 103384. [Google Scholar] [CrossRef]
  14. Kontomaris, S.V.; Malamou, A.; Stylianou, A. The Hertzian theory in AFM nanoindentation experiments regarding biological samples: Overcoming limitations in data processing. Micron 2022, 155, 103228. [Google Scholar] [CrossRef]
  15. Ding, Y.; Xu, G.K.; Wang, G.F. On the determination of elastic moduli of cells by AFM based indentation. Sci. Rep. 2017, 7, 45575. [Google Scholar] [CrossRef]
  16. Li, Q.S.; Lee, G.Y.H.; Ong, C.N.; Lim, C.T. AFM indentation study of breast cancer cells. Biochem. Biophys. Res. Commun. 2018, 374, 609–613. [Google Scholar]
  17. Guz, N.; Dokukin, M.; Kalaparthi, V.; Sokolov, I. If cell mechanics can be described by elastic modulus: Study of different models and probes used in indentation experiments. Biophys. J. 2014, 107, 564–575. [Google Scholar] [CrossRef]
  18. Gavara, N. A beginner’s guide to atomic force microscopy probing for cell mechanics. Microsc. Res. Tech. 2017, 80, 75–84. [Google Scholar] [CrossRef]
  19. Kontomaris, S.V.; Malamou, A. Hertz model or Oliver & Pharr analysis? Tutorial regarding AFM nanoindentation experiments on biological samples. Mater. Res. Express 2020, 7, 033001. [Google Scholar]
  20. Ding, Y.; Wang, J.; Xu, G.K.; Wang, G.F. Are elastic moduli of biological cells depth dependent or not? Another explanation using a contact mechanics model with surface tension. Soft Matter 2018, 14, 7534–7541. [Google Scholar] [CrossRef]
  21. Hermanowicz, P.; Sarna, M.; Burda, K.; Gabryś, H. An open source software for analysis of force curves. Rev. Sci. Instrum. 2014, 85, 063703. [Google Scholar] [CrossRef] [PubMed]
  22. Bontempi, M.; Salamanna, F.; Capozza, R.; Visani, A.; Fini, M.; Gambardella, A. Nanomechanical Mapping of Hard Tissues by Atomic Force Microscopy: An Application to Cortical Bone. Materials 2022, 15, 7512. [Google Scholar] [CrossRef]
  23. Butt, H.J.; Jaschke, M. Calculation of thermal noise in atomic force microscopy. Nanotechnology 1995, 6, 1. [Google Scholar] [CrossRef]
  24. Sneddon, I.N. The relation between load and penetration in the axisymmetric Boussinesq problem for a punch of arbitrary profile. Int. J. Eng. Sci. 1965, 3, 47–57. [Google Scholar] [CrossRef]
  25. Kontomaris, S.V.; Malamou, A. A novel approximate method to calculate the force applied on an elastic half space by a rigid sphere. Eur. J. Phys. 2021, 42, 025010. [Google Scholar] [CrossRef]
  26. Oliver, W.C.; Pharr, G.M. Measurement of hardness and elastic modulus by instrumented indentation: Advances in understanding and refinements to methodology. J Mater. Res. 2004, 19, 3. [Google Scholar] [CrossRef]
  27. Pogoda, K.; Jaczewska, J.; Wiltowska-Zuber, J.; Klymenko, O.; Zuber, K.; Fornal, M.; Lekka, M. Depth-sensing analysis of cytoskeleton organization based on AFM data. Eur. Biophys. J. 2012, 41, 79–87. [Google Scholar] [CrossRef]
  28. Chen, S.W.; Teulon, J.M.; Kaur, H.; Godon, C.; Pellequer, J.L. Nano-structural stiffness measure for soft biomaterials of heterogeneous elasticity. Nanoscale Horiz. 2023, 8, 75–82. [Google Scholar] [CrossRef]
  29. Kontomaris, S.V.; Malamou, A. The truncated cone effect in AFM nanoindentation on soft materials. Micro Nanosyst. 2023. [Google Scholar] [CrossRef]
  30. Kontomaris, S.V.; Stylianou, A.; Georgakopoulos, A.; Malamou, A. 3D AFM Nanomechanical Characterization of Biological Materials. Nanomaterials 2023, 13, 395. [Google Scholar] [CrossRef]
  31. Kontomaris, S.V.; Stylianou, A.; Chliveros, G.; Malamou, A. Determining Spatial Variability of Elastic Properties for Biological Samples Using AFM. Micromachines 2023, 14, 182. [Google Scholar] [CrossRef]
  32. Islam, M.T.; Tang, S.; Liverani, C.; Saha, S.; Tasciotti, E.; Righetti, R. Non-invasive imaging of Young’s modulus and Poisson’s ratio in cancers in vivo. Sci. Rep. 2020, 10, 7266. [Google Scholar] [CrossRef]
  33. Chen, X.; Hughes, R.; Mullin, N.; Hawkins, R.J.; Holen, I.; Brown, N.J.; Hobbs, J.K. Mechanical Heterogeneity in the Bone Microenvironment as Characterized by Atomic Force Microscopy. Biophys. J. 2020, 119, 502–513. [Google Scholar] [CrossRef]
  34. Louca, M.; Stylianou, A.; Minia, A.; Pliaka, V.; Alexopoulos, L.G.; Gkretsi, V.; Stylianopoulos, T. Ras suppressor-1 (RSU-1) promotes cell invasion in aggressive glioma cells and inhibits it in non-aggressive cells through STAT6 phospho-regulation. Sci. Rep. 2019, 9, 7782. [Google Scholar] [CrossRef]
  35. Kilpatrick, J.I.; Revenko, I.; Rodriguez, B.J. Nanomechanics of cells and biomaterials studied by atomic force microscopy. Adv. Healthc. Mater. 2015, 4, 2456–2474. [Google Scholar] [CrossRef]
  36. Wu, P.-H.; Aroush, D.R.-B.; Asnacios, A.; Chen, W.-C.; Dokukin, M.E.; Doss, B.L.; Durand-Smet, P.; Ekpenyong, A.; Guck, J.; Guz, N.V.; et al. A comparison of methods to assess cell mechanical properties. Nat. Methods 2018, 15, 491–498. [Google Scholar] [CrossRef]
  37. Grant, C.A.; Brockwell, D.J.; Radford, S.E.; Thomson, N.H. Effects of hydration on the mechanical response of individual collagen fibrils. Appl. Phys. Lett. 2008, 92, 233902. [Google Scholar] [CrossRef]
  38. Heim, A.J.; Matthews, W.G.; Koob, T.J. Determination of the elastic modulus of native collagen fibrils via radial indentation. Appl. Phys. Lett. 2006, 89, 181902. [Google Scholar] [CrossRef]
  39. Minary-Jolandan, M.; Yu, M.F. Nanomechanical heterogeneity in the gap and overlap regions of type I collagen fibrils with implications for bone heterogeneity. Biomacromolecules 2009, 10, 2565–2570. [Google Scholar] [CrossRef]
  40. Yadavalli, V.K.; Svintradze, D.V.; Pidaparti, R.M. Nanoscale measurements of the assembly of collagen to fibrils. Int. J. Biol. Macromol. 2010, 46, 458–464. [Google Scholar] [CrossRef]
  41. Andriotis, O.G.; Manuyakorn, W.; Zekonyte, J.; Katsamenis, O.L.; Fabri, S.; Howarth, P.H.; Davies, D.E.; Thurner, P.J. Nanomechanical assessment of human and murine collagen fibrils via atomic force microscopy cantilever-based nanoindentation. J. Mech. Behav. Biomed. Mater. 2014, 39, 9–26. [Google Scholar] [CrossRef] [PubMed]
  42. Baldwin, S.J.; Kreplak, L.; Lee, J.M. Characterization via atomic force microscopy of discrete plasticity in collagen fibrils from mechanically overloaded tendons: Nano-scale structural changes mimic rope failure. J. Mech. Behav. Biomed. Mater. 2016, 60, 356–366. [Google Scholar] [CrossRef] [PubMed]
  43. Andriotis, O.G.; Elsayad, K.; Smart, D.E.; Nalbach, M.; Davies, D.E.; Thurner, P.J. Hydration and nanomechanical changes in collagen fibrils bearing advanced glycation end-products. Biomed. Opt. Express 2019, 10, 1841–1855. [Google Scholar] [CrossRef] [PubMed]
  44. Papi, M.; Paoletti, P.; Geraghty, B.; Akhtar, R. Nanoscale characterization of the biomechanical properties of collagen fibrils in the sclera. Appl. Phys. Lett. 2014, 104, 103703. [Google Scholar] [CrossRef]
  45. Kazaili, A.; Al-Hindy, H.A.A.; Madine, J.; Akhtar, R. Nano-scale stiffness and collagen fibril deterioration: Probing the cornea following enzymatic degradation using peakforce-qnm afm. Sensors 2021, 21, 1629. [Google Scholar] [CrossRef]
  46. Läubli, N.F.; Burri, J.T.; Marquard, J.; Vogler, H.; Mosca, G.; Vertti-Quintero, N.; Shamsudhin, N.; de Mello, A.; Grossniklaus, U.; Ahmed, D.; et al. 3D mechanical characterization of single cells and small organisms using acoustic manipulation and force microscopy. Nat. Commun. 2021, 12, 2583. [Google Scholar] [CrossRef]
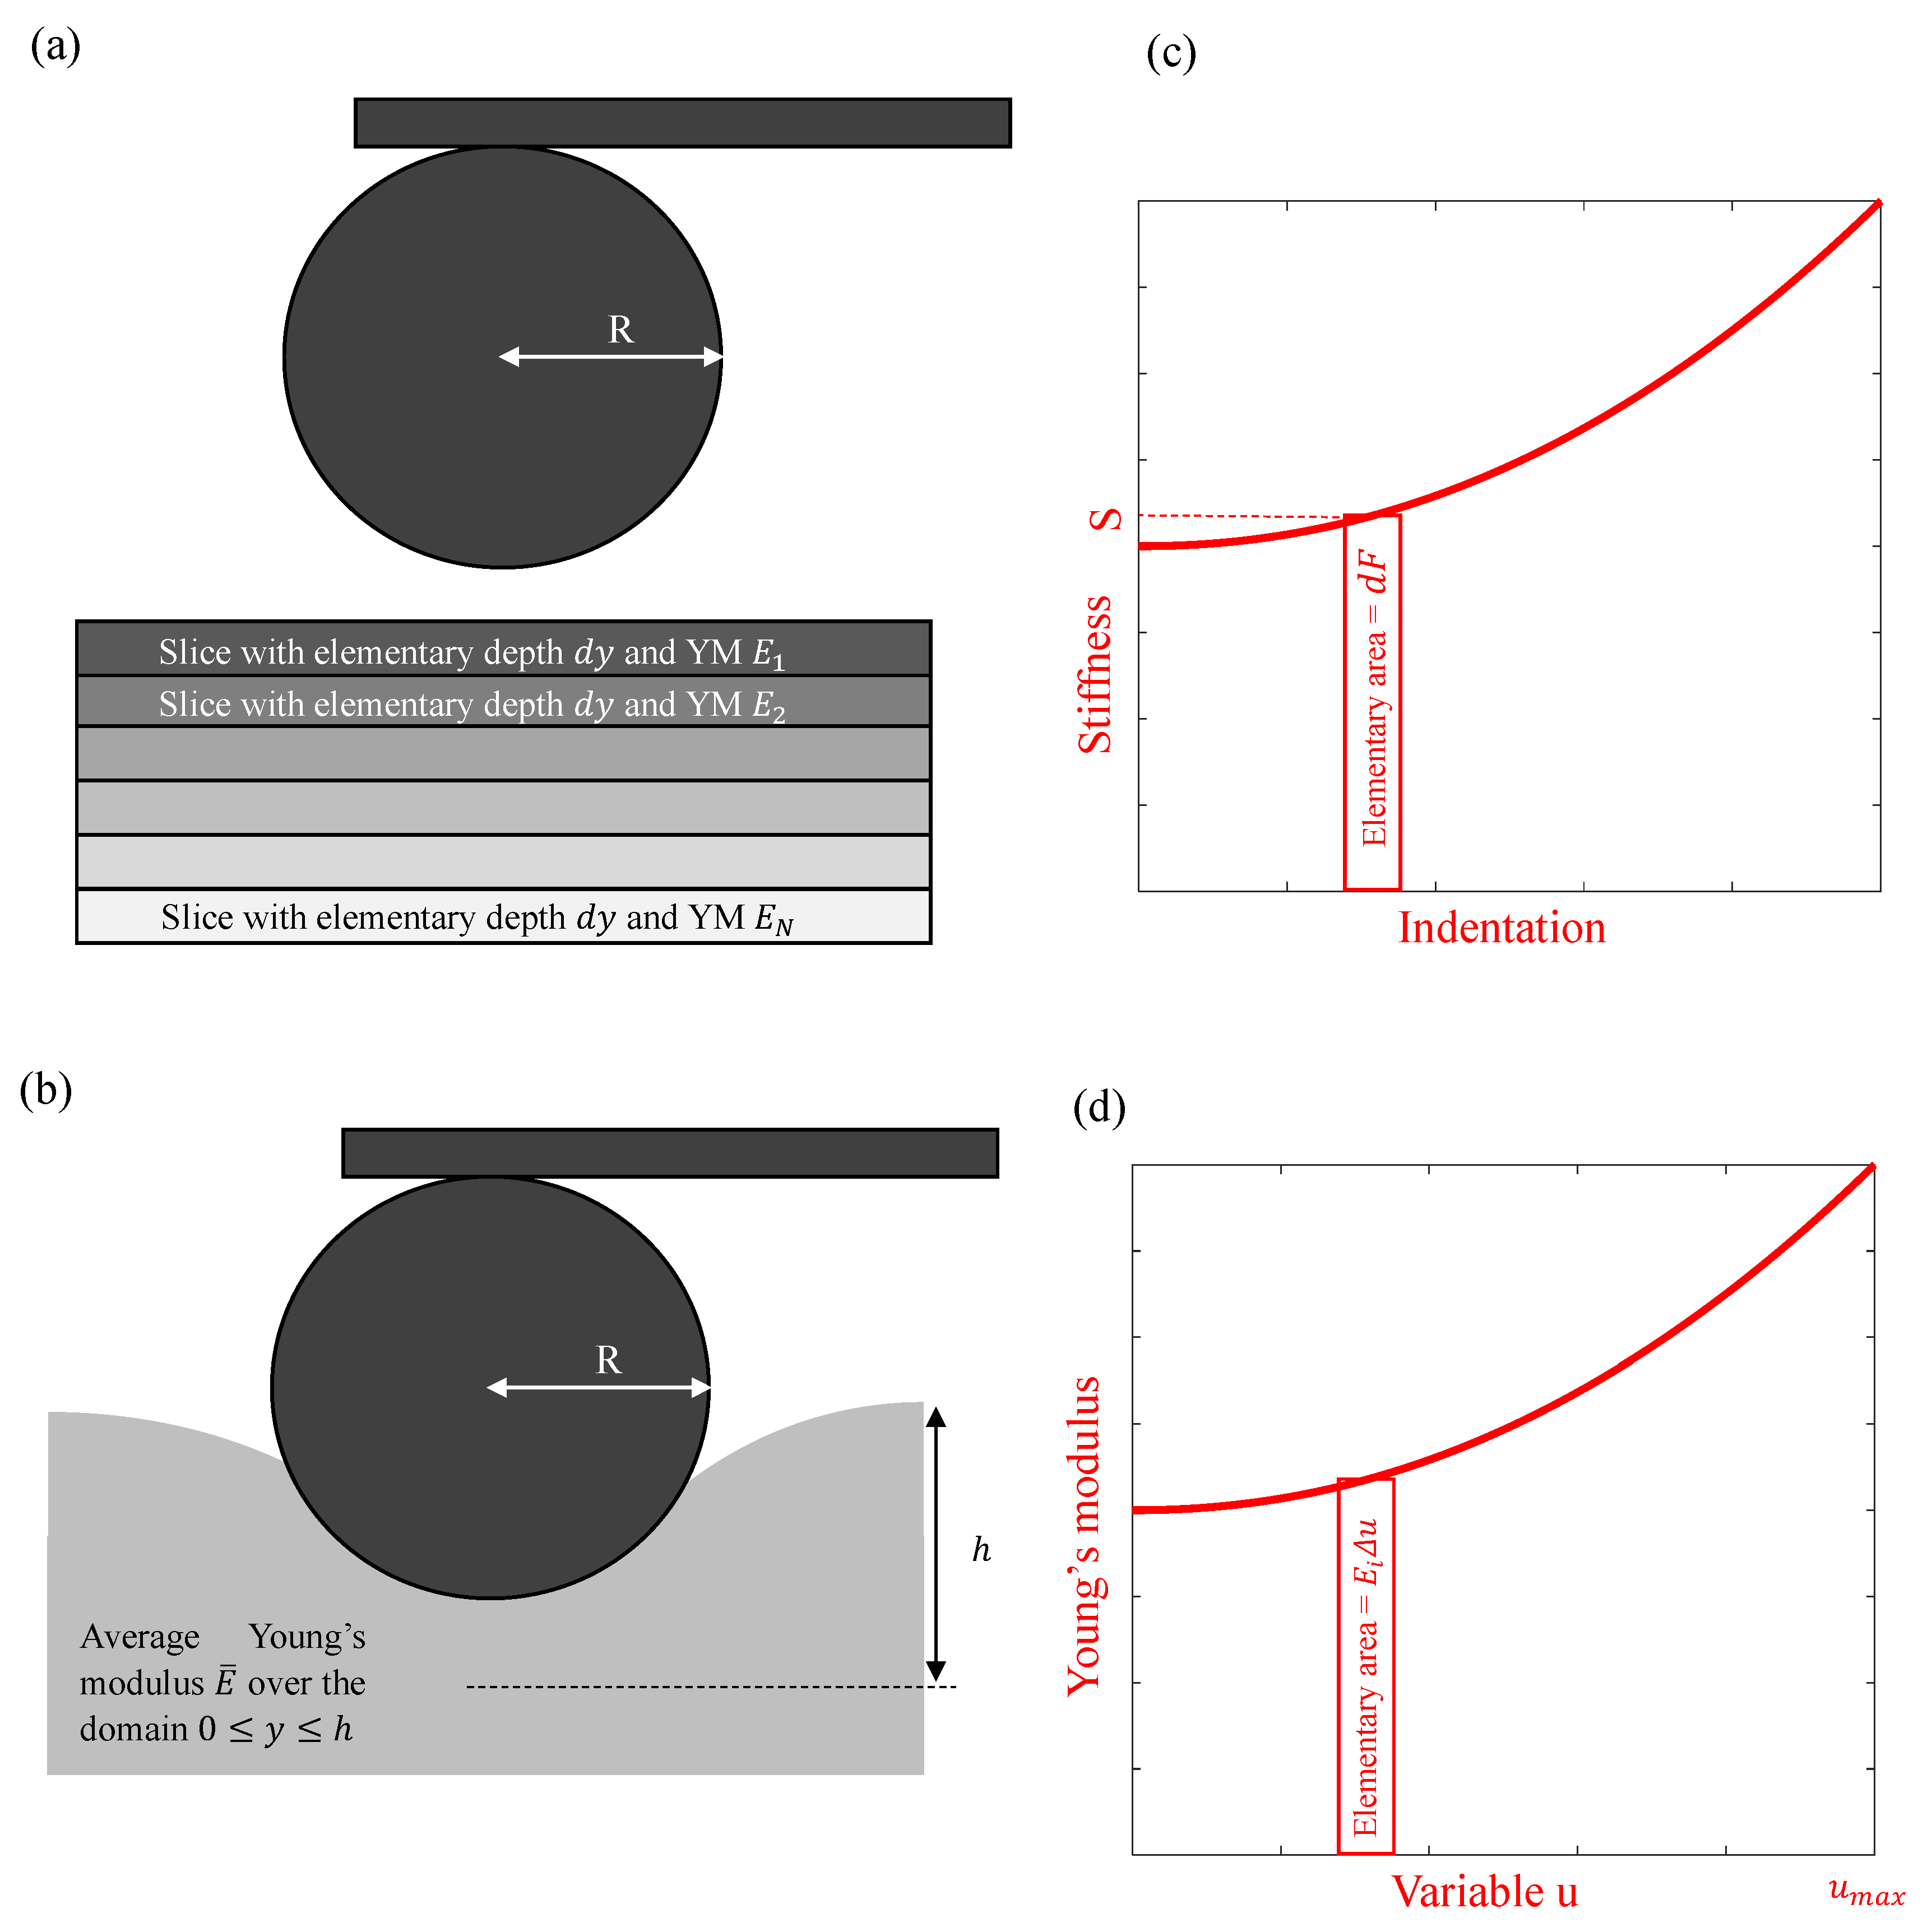
Figure 1. (a) A spherical indentation on a highly heterogeneous material. The sample can be considered as the sum of N homogeneous slices. (b) The fitting parameter is the average Young’s modulus for a specific domain  0 y h . The average Young’s modulus is strongly depth-dependent. (c) Since,  d F = S d h , the area under the  S = f h    graph equals the applied force on the sample (area under the graph =   0 h S d y ). (d) The integral in Equations (16), (21), (26), and (34) equals the area under the  E = f u  graph (area under the graph =   0 u m a x E d u ). In addition,  u m a x = N Δ u .
Applmech 04 00026 g001
Figure 2. (a) Axisymmetric rigid indenter described by the power-law relation  z = B r n . (b) A conical indenter.
Applmech 04 00026 g002
Figure 3. Simulated force—indentation data on an elastic half space with E = 20 kPa and v = 0.5. The maximum indentation depth is (a,b) 200 nm, (c,d) 400 nm, (e,f) 600 nm, (g,h) 800 nm, and (i,j) 1000 nm. The data was fitted to Equation (31) (red curves, figures (a,c,g,i) and to Equation (4) (blue curves, figures (b,d,f,h,j).
Applmech 04 00026 g003
Figure 4. The average Young’s modulus as calculated by fitting the data to Equation (4) ( E a p p . ) and to Equation (31) ( E a c c . ). When fitting the data to Equation (4), a pseudo-softening behavior is recorded since Equation (4) is not valid for deep spherical indentations.
Applmech 04 00026 g004
Figure 5. AFM indentation on a H4 human glioma cell. (a) For  0 h 300   nm E ¯ 1 = 10.2   kPa , (b) for  0 h 600   nm , E ¯ 2 = 8.4   kPa , (c) for  0 h 900   nm , E ¯ 3 = 7.9   kPa . (d) The fitted curves are presented comparatively.
Applmech 04 00026 g005
Figure 6. Simulated AFM data derived using Equation (43) (black curve). The data was fitted to an equation of the form  F = a h m  (the same form as Equation (40), where  a = 2 E ¯ c 1 v 2  and  m = 1 + 1 / n .
Applmech 04 00026 g006
Disclaimer/Publisher’s Note: The statements, opinions and data contained in all publications are solely those of the individual author(s) and contributor(s) and not of MDPI and/or the editor(s). MDPI and/or the editor(s) disclaim responsibility for any injury to people or property resulting from any ideas, methods, instructions or products referred to in the content.