Abstract
A great number of reinforced concrete structures are approaching the end of their service life and they are strongly affected by progressive deterioration processes due to insufficient maintenance. A fundamental understanding of all damage phenomena acting together on reinforced concrete, RC, structures under service loads is a crucial step toward more sustainable structures. The present work aims to study the creep of RC beams in the cracked state. To achieve this objective, an analytical model was developed based on Bernoulli’s theory and the global equilibrium of the RC beam. A Newton–Raphson algorithm was also proposed to solve the non-linear equilibrium equations related to the non-linearity in the adopted materials models. The proposed model allows predicting the instantaneous and long-term behavior under any loading level up to the steel yielding, and it takes into consideration the effect of creep on the behavior of concrete both in tension and compression. In addition to the evolution of the deflection with time, the model is also able to follow the height of the compression zone as well as the evolution of crack’s height and width under any sustained service load. The comparison between analytical and experimental results found in the literature for long-term loaded beams showed a good agreement.
1. Introduction
The most common material used in the world’s construction industry is concrete. Contrary to all other building materials, concrete has mechanical characteristics that vary over time. Additionally, it behaves differently in compression and tension [1]. Concrete’s capacity to deform under continuous, sustained stress is referred to as creep [2,3]. Creep causes a change in volume, an increase in the deflection of beams and slabs, and a redistribution of stress, all of which have a significant impact on the performance of reinforced concrete members [2,4,5,6]. The age of the concrete at the time of loading, the curing and ambient conditions, the stress level, the duration and rate of loading, the size of the concrete member, as well as the material composition, all affect long-term behavior [3,7,8].
By suggesting a linear behavior for concrete and ignoring the entirety of the tensioned concrete in the RC section, Ghali et al. [1] proposed a simple method to predict both the short- and long-term behavior of RC beams based on Bernoulli’s theory. However, the approach is appropriate for a rough evaluation of the deflection values.
Gilbert and Ranzi [9] described the primary approaches for investigating the long-term behavior of RC members, including “the Effective Modulus Method EMM”, “Step by Step Method SSM”, “the Age-adjusted Effective Modulus Method AEMM”, and “the Rate of Creep Method RCM”, and they noted that each approach has its own advantages and restrictions.
Mullem [5] compared the experimental results with an analytical model created by the author by assuming a linear behavior for concrete in compression, ignoring the concrete in tension, and using the AEMM approach proposed by Gilbert and Ranzi [9] for calculating the long-term deflection. The experimental results involved 48 RC beams subjected to a 4-point bending test over a period of about four years with varying sustained loading levels. Depending on the loading level, the discrepancy between experimental and analytical deflection values ranged from 10 to 25%. By considering the nonlinear behavior of compressed concrete while ignoring the contribution of concrete in tension, Reybrouck et al. [10] presented an enhancement to the methodology of Ghali et al. [2] using the AEMM approach presented in Gilbert and Ranzi [9]. With regard to deflection, all monitoring data have an average variance of less than 27% with the calculated results. Due to its significant impact on the results, the authors emphasized the need to take into account non-linear creep after a specific level of actual stress. The conclusions of Tošic et al. [11] and Sryh and Forth [12] are nearly identical to those of Mullem et al. [5]. De Vitorio [4] investigated 10 different types of one-way RC slabs for 120 days while they were subjected to three different stress levels by means of four-point bending tests. The author found a 45–60% difference between the test results and the results of his model in terms of mid span deflection.
Some researchers have attempted to conduct research on already-built structures. For example, Shallal [13] conducted a field-measured investigation for RC beams in a building in Al-Diwania, Iraq, and contrasted the findings with those of commonly employed techniques to determine the long-term deflection of RC beams. The comparison revealed that these methodologies were not compatible with on-site measurements.
The instantaneous deflection occurs as soon as the service load is applied, therefore serviceability considerations can have a significant impact on the design of a structural member. The structural standards impose guidelines on a structure’s serviceability to prevent excessive vibration or deflection and minimize user inconvenience [14]. The design standards take into consideration the contribution of cracked and non-cracked sections in the flexural element’s deflection. However, several authors demonstrated that the analysis methods suggested in the standards are limited [6,15,16]. Due to the uncertainty concerning the moment of inertia of cracked sections, standardized approaches are inadequate [6,15]. According to Mohamad et al. [16], the problem is related to the equilibrium equations’ ignoring of the properties of the fracture properties of concrete in tension. These characteristics, which depend on the concrete’s mix design parameters and compressive strength, are described by the fracture energy and critical crack opening [17,18].
The current study’s aim is to investigate the instantaneous and long-term behavior of simply supported reinforced concrete beams while accounting for the whole stress–strain behavior of concrete in both compression and tension and using the mid-span deflection as a critical parameter.
2. Instantaneous Flexural Behavior
2.1. Material Models
2.1.1. Concrete in Compression
The adopted behavior for concrete in compression (stress–strain relationship) was taken from EC2 [14] and can be expressed by Equation (1).
where fcm is the concrete compressive strength, η = ε/εc1, k = (1.05·Ecm · εc1)/fcm, εc1 the concrete compressive strain corresponding to the peak stress fcm, εcu is the ultimate compressive strain in concrete as per EC2 [14], and Ecm is the secant modulus of elasticity. Figure 1 shows the adopted compressive behavior of concrete. All the above mentioned parameters can be evaluated as functions of the compressive strength [14] (Equations (2)–(4)).
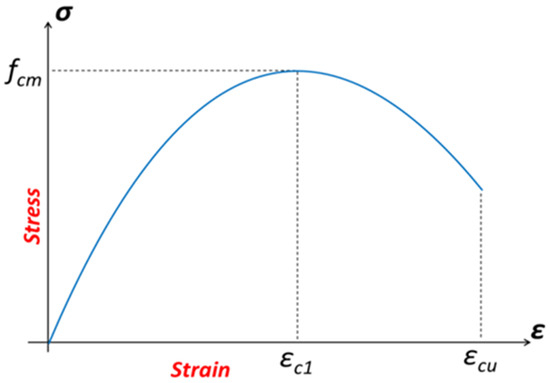
Figure 1.
The adopted behavior of concrete in compression [14].
2.1.2. Concrete in Tension
If no experimental data are available, the tensile strength of concrete fctm can be determined as a function of the compressive strength using Equation (5). The full tensile behavior is divided into two parts as shown in Figure 2. The first part is linear and can be described by the classical Hooke’s law up to the peak stress. The second part is nonlinear and can be expressed by a stress-crack opening curve (σ-w) where the stress decreases with the increase of the crack opening (Figure 2). The preferred model to explain the softening behavior is the power law model (Equation (6)) [16,17]. According to the established law, n stands for its power and wu for the critical crack width where zero tensile strength corresponds.
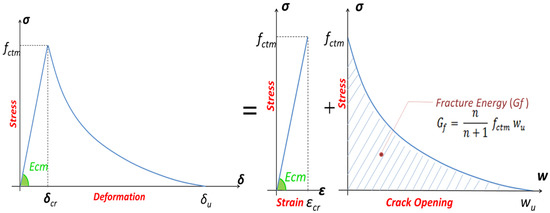
Figure 2.
The adopted behavior of concrete in tension [6,7].
2.1.3. Steel Reinforcement Behavior
In this paper, the stress–strain relationship proposed in EC2 [14] is adopted, which is a stress–strain curve (Figure 3) composed of two parts. The first part describes the linear phase up to yielding stress fy and the second part represents the plastic phase which is taken here as an inclined line up to the ultimate steel strain εuk and a maximum steel stress fyk = k · fy. Equation (7) [14] represents this behavior with k = 1.25, εy = fy/Es and εuk = 10%.
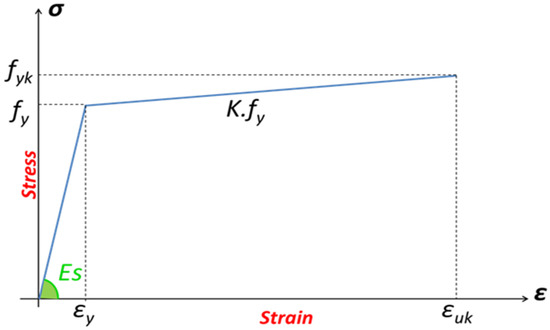
Figure 3.
The adopted behavior of Steel Reinforcement [14].
2.2. Mechanical Model of RC Section Subjected to Bending
Finding the instantaneous deflection of a simply supported beam subjected to 4-point bending at any loading level is one of the main aims of the present work.
A cross-sectional analysis based on Bernoulli’s theory was performed to accomplish this objective. Figure 4 shows a typical reinforced concrete cross section with the strain distribution diagram due to an external bending moment. Three unknowns, namely the concrete strain (εc), the steel strain (εs), and the height of the compression zone (x), are present in the non-ultimate state (also known as the serviceability state) versus two equilibrium equations.
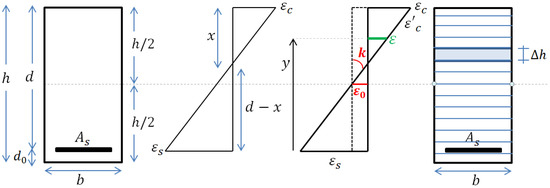
Figure 4.
RC section with Strain distribution diagram & dividing the section into layers.
Any fiber’s deformation in the cross section may be defined as a function of the curvature, κ, and mean normal strain so-called ε0 at the beam axis. Equation (8) can be used to calculate the strain in the strip that is positioned at y distances from the beam’s bottom.
A reinforcement bar and layered strips of concrete are supposed to compose the cross section of the beam. The only degree of freedom for each strip is the elongation; therefore the task is to create a correlation between generalized sectional forces and strains in both compression and tension. If the strip is in the compression zone, Equation (1) is used to determine the compressive stress. In the tension zone, the stress is determined using Equation (5) which takes account of the softening behavior. The stress is determined for the reinforcement-representing strip as a function of strain using the EC2 [14] bi-linear relationship (Equation (7)). The neutral axis is determined by the cross-section’s equilibrium of compressive and tensile forces under the effect of an external bending moment (Equation (9)).
The internal and external forces equilibrium equations are mathematically nonlinear because of the adopted material’s nonlinear behaviors; hence an analytical model is needed to solve these equations. Thesolution of these nonlinear equations consists in finding the values of the curvature, κ, and the mean strain ε0, which satisfy the equilibrium of the cross-section. The numerical solution of the equilibrium equations was performed using the Newton–Raphson method with two variables. The cross section has been divided into n + 1 strip defining n layers in order to the integrals of Equation (9). The force of each layer is computed by multiplying the average stress by the area of the layer. As a result, sums can be used in place of integrals. After reaching the equilibrium and determining the two variables (ε0 and k) all strains values as well as stresses along the section could be determined, in addition to the height of the compression zone (Equation (10)). These results are essential for long-term analysis.
Equation (11) can be used to compute the deflection of the beam for each value of curvature. The variable represents the distance between the left support and the point where the deflection is required.
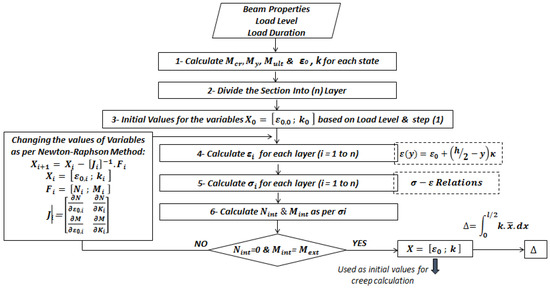
Figure 5.
Work flow algorithm for initial loading.
2.3. Initial Loading Model Assessment
The experimental results of the NAC1 + NAC2 beams [19] and the H50-0 beam [20] are compared to the results of the present work’s model in Figure 6. It can be seen that there is a good agreement between the theoretical predictions and the experimental data, especially at high cracking forces with a small (less than 10%) variation in the cracked phase prior to yielding.
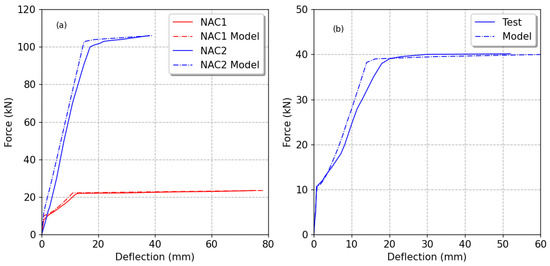
Figure 6.
P-Δ diagram comparison: Experiments vs. Present Work; (a) Ignjatovic et al. [19]; (b) Seara-Paz [20].
The results of a comparison between numerical and experimental results for additional beams obtained from the literature for the instantaneous behavior [10,11,12] are also summarized in Table 1. It can be observed that there is a good agreement with the experimental results. Moreover, the variance does not exceed 10%, except for the beam NAC7 [11] whose variance reaches the value of 34%, which probably results from the uncertainty of mechanical properties measured at the age of seven days.

Table 1.
Comparison between experiments in the literature [10,11,12] and the present work.
3. Long-Term Flexural Behavior
3.1. Material Models
Regarding the long-term behavior of concrete, a number of models have been presented in the literature, including “the Effective Modulus Method EMM”, “Step by Step Method SSM”, “the Age-adjusted the Effective Modulus Method AEMM”, and “the Rate of Creep Method RCM” [9,21]. According to the fundamental idea of Lee [21], a model was developed in the current work using the EMM approach, which adjusts the value of the elasticity modulus by Equation (12). The model also modifies the actual stress–strain relationship. Equation (13) describe the modifications made to the adopted model. φ(t,t0) is the creep coefficient according to EC2 [14] Annex B which represents the ratio between the long-term strain at time t due to a sustained load applied at time t0 and the instantaneous strain at time t0 while Eeff (t,t0) is the effective modulus of elasticity. In uniaxial compression, Equation (14) describes the chosen stress–strain relationship, where εcu,LT is the adjusted ultimate compressive strain at time t. This model is shown in Figure 7, where it can be seen that the stress–strain curve is dependent on the loading duration (t − t0) and the creep coefficient value φ (t, t0).
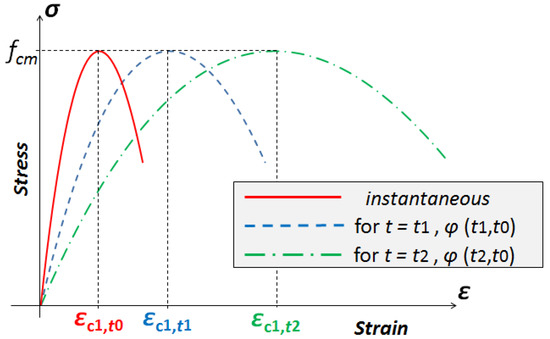
Figure 7.
The adopted behavior of compressed concrete due to creep.
The identical law described previously concerning the concrete tensile behavior was applied here but Ecm was replaced by Eeff (t, t0) (Equation (12)) as illustrated in Figure 8.
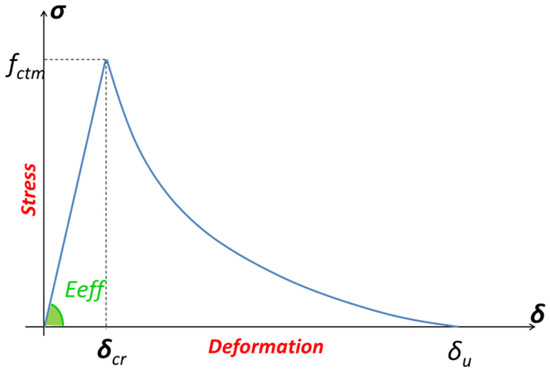
Figure 8.
The adopted behavior of tensioned concrete due to creep.
The same steel behavior was used since the steel material does not exhibit the creep deformations.
3.2. The Mechanical Model of RC Section Subjected to Sustained Bending
To achieve the equilibrium status under any given external load at any loading time, the same approach described previously for the initial loading was performed with the updated material model and by taking the non-linear creep coefficient into consideration as per EC2 [14] (Figure 9 illustrates the algorithm of the work flow). The creep phenomenon causes the longitudinal reinforcement to experience higher stress and strain while the top fiber of the concrete experiences decreasing stress and increasing strain leading to an increase in the height of the compression zone (Figure 10). Due to the redistribution, some layers’ stress states will shift from compression to tension, and those of other layers will change from being cracked after initial loading to un-cracked after creep. However, since this is not true and physically impossible, one of the key ideas was to stop these entirely fractured layers from bearing any tension loads after the strain and stress redistribution. The stress and strain redistribution resulting from persistent loading, as determined by the proposed model, is shown in Figure 10.
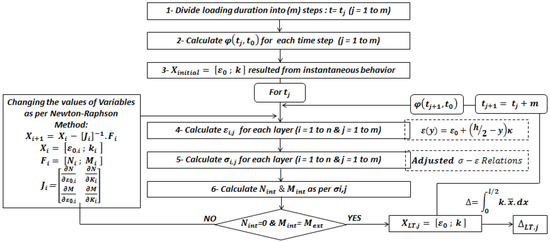
Figure 9.
Work flow algorithm for long-term loading.
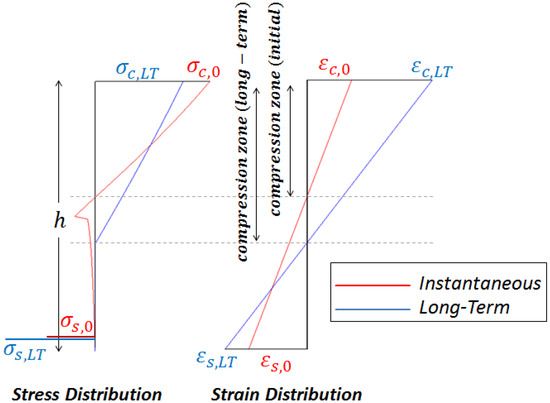
Figure 10.
Stress & strain redistribution due to creep.
3.3. Long-Term Loading Model Assessment
Four beams collected from the literature [10,11,12] were used to validate the model developed in this study. Figure 11 depicts a comparison of the experimental data with the model’s predictions, where it can be observed that the creep rates for the NC beam [12] and B2-L52 beam [10] differ just marginally.
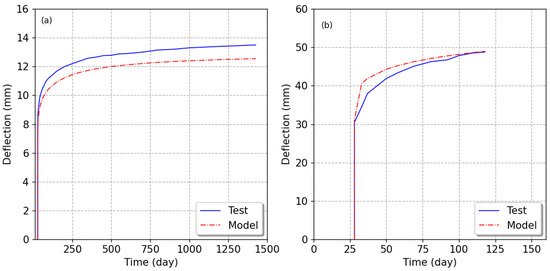
Figure 11.
Time-deflection Diagram comparison: Experimental vs. Present Work; (a) Reybrouck et al. [10]; (b) Sryh and Forth [12].
Additionally, the comparison recapitulated in Table 1 demonstrates that the model results agree with the experimental ones because the variance in long-term deflection values is only about 10% or less. Figure 12 also summarizes the comparison of long-term deflection at the end of the tests.
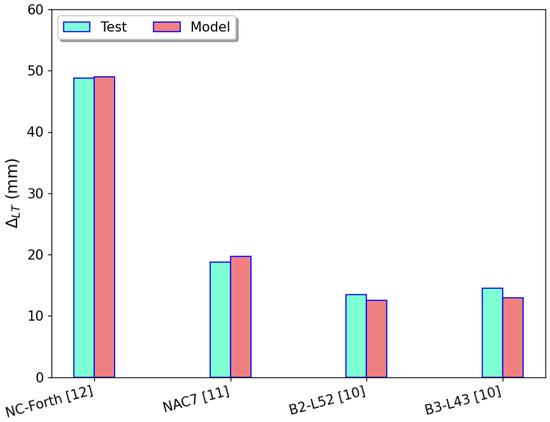
Figure 12.
Long-Term Deflection- Experimental [10,11,12] vs. Present Work.
4. Conclusions
In this work, a new model was developed to predict the short- and long-term behavior of RC beams at any level of loading. The developed model was validated by comparing the experimental deflection values for beams chosen from the literature with the numerical ones. The following conclusions can be derived from the findings:
- Any simply supported beam under any level of loading can be examined instantly and over time using the established model.
- The concrete stress–strain relationship can be modified using the EMM approach to produce reliable numerical results.
- The model may also be used to calculate the height and width of the cracks following creep advancement. Unfortunately, due to a lack of experimental studies, a comparison of crack evolution during creep was not conducted in the current work.
Author Contributions
Conceptualization, formal analysis, investigation, B.B.; supervision and validation of numerical results, H.H. and G.W.; review and editing the original manuscript, G.W. All authors have read and agreed to the published version of the manuscript.
Funding
This research received no external funding.
Data Availability Statement
The data that support the findings of this study are available from the corresponding author George Wardeh upon reasonable request.
Conflicts of Interest
The authors declare no conflict of interest.
References
- Jacques, B.; Jean-Pierre, O. Les Bétons: Bases et Données Pour Leur Formulation; Eyrolles: Paris, France, 1996. [Google Scholar]
- Ghali, A.; Favre, R.; Elbadry, M. Concrete Structures: Stresses and Deformations: Analysis and Design for Serviceability, 3rd ed.; Spon Press: London, UK, 2002. [Google Scholar]
- Torres, P.P.; Ghorbel, E.; Wardeh, G. Towards a New Analytical Creep Model for Cement-Based Concrete Using Design Standards Approach. Buildings 2021, 11, 155. [Google Scholar] [CrossRef]
- De Vittorio, S. Time-Dependent Behaviour of Reinforced Concrete Slabs; University of Bologna: Bologna, Italy, 2011. [Google Scholar]
- Van Mullem, T. Analysis and Numerical Simulation of Long-Term Creep Tests on Concrete Beams; Ghent University: Ghent, Belgium, 2016. [Google Scholar]
- Shaaban, I.G.; Saidani, M.; Nuruddin, M.F.; Malkawi, A.B.; Mustafa, T.S. Service ability Behavior of Normal and High-Strength Reinforced Concrete T-Beams. Eur. J. Mater. Sci. Eng. 2017, 2, 99–110. [Google Scholar]
- Tošić, N.; de la Fuente, A.; Marinković, S. Creep of recycled aggregate concrete: Experimental database and creep prediction model according to the fib Model Code 2010. Constr. Build. Mater. 2019, 195, 590–599. [Google Scholar] [CrossRef]
- Mayfield, B. Creep and shrinkage in concrete structures, Edited by Z. P. Bazant and F. H. Wittman, Wiley, Chichester, 1982. No. of pages: 363. Price: £24.95. Earthq. Eng. Struct. Dyn. 1983, 11, 591–592. [Google Scholar] [CrossRef]
- Gilbert, R.I.; Ranzi, G. Time-Dependent Behaviour of Concrete Structures; Spon Press: London, UK, 2010. [Google Scholar]
- Reybrouck, N.; Criel, P.; Van Mullem, T.; Caspeele, R. Long-term data of reinforced concrete beams subjected to high sustained loads and simplified prediction method. Struct. Concr. 2017, 18, 850–861. [Google Scholar] [CrossRef]
- Tošić, N.; Marinković, S.; Pecić, N.; Ignjatović, I.; Dragaš, J. Long-term behaviour of reinforced beams made with natural or recycled aggregate concrete and high-volume fly ash concrete. Constr. Build. Mater. 2018, 176, 344–358. [Google Scholar] [CrossRef]
- Sryh, L.; Forth, J. Long-Term Flexural Behaviour of Cracked Reinforced Concrete Beams with Recycled Aggregate. Int. J. Concr. Struct. Mater. 2022, 16, 19. [Google Scholar] [CrossRef]
- Shallal, M.A. Prediction of Long-Term Deflection of Reinforced Concrete Beams Suitable for Iraqi Conditions. J. Babylon Univ. Sci. 2013, 21, 1328–1347. [Google Scholar]
- EN 1992-1-1; Eurocode 2: Design of Concrete Structures: Part 1–1: General Rules and Rules for Buildings. European Committee for Standardization: Brussels, Belgium, 2004.
- Shaaban, I.G.; Mustafa, T.S. Towards efficient structural and serviceability design of high-strength concrete T-beams. Proc. Inst. Civ. Eng.—Struct. Build. 2021, 174, 836–848. [Google Scholar] [CrossRef]
- Mohamad, R.; Hammadeh, H.; Kousa, M.; Wardeh, G. Fracture based non linear model for reinforced concrete beams. Geomate J. 2020, 18, 110–117. Available online: https://geomatejournal.com/geomate/article/view/408 (accessed on 16 December 2022). [CrossRef]
- Ghoson, D.; Mayada, K.; Wardeh, G. The Effect of Paste Volume and Concrete Properties on Size Independent Fracture Energy. J. Mater. Eng. Struct. 2014, 1, 58–72. [Google Scholar]
- Wardeh, G.; Ghorbel, E. Prediction of fracture parameters and strain-softening behavior of concrete: Effect of frost action. Mater. Struct. 2015, 48, 123–138. [Google Scholar] [CrossRef]
- Ignjatović, I.S.; Marinković, S.B.; Mišković, Z.M.; Savić, A.R. Flexural behavior of reinforced recycled aggregate concrete beams under short-term loading. Mater. Struct. 2013, 46, 1045–1059. [Google Scholar] [CrossRef]
- Seara-Paz, S.; González-Fonteboa, B.; Martínez-Abella, F.; Eiras-López, J. Flexural performance of reinforced concrete beams made with recycled concrete coarse aggregate. Eng. Struct. 2018, 156, 32–45. [Google Scholar] [CrossRef]
- Lee, K.-W. Nonlinear Time Dependent Design and Analysis of Slender Reinforced Concrete Columns; University of Hamburg: Hamburg, Germany, 2004. [Google Scholar]
Disclaimer/Publisher’s Note: The statements, opinions and data contained in all publications are solely those of the individual author(s) and contributor(s) and not of MDPI and/or the editor(s). MDPI and/or the editor(s) disclaim responsibility for any injury to people or property resulting from any ideas, methods, instructions or products referred to in the content. |
© 2023 by the authors. Licensee MDPI, Basel, Switzerland. This article is an open access article distributed under the terms and conditions of the Creative Commons Attribution (CC BY) license (https://creativecommons.org/licenses/by/4.0/).