1. Introduction
Task automation has made it possible to streamline processes, reduce costs, and increase efficiency in various digital environments, which has driven the development of software capable of performing actions autonomously and in a distributed manner over the Internet. In this context, bots are defined as computer programs that can incorporate artificial intelligence (AI) techniques to interact with systems and users. Depending on the transparency of their identity and the purpose of their activities, they can be classified as legitimate bots or malicious bots [
1].
In recent years, the use of malicious bots on social media has increased significantly, particularly for the creation and dissemination of false or manipulated content. These practices have facilitated the commercialization of automated accounts and the execution of fraudulent activities that compromise users’ security and integrity [
2]. Likewise, digital platforms have been affected by breaches involving access to confidential data and private content [
3,
4]. Social bots have also been identified in activities such as cyberbullying [
5], sexting [
6], and the manipulation of financial markets through the artificial promotion of assets [
7].
Content shared on social media directly influences the polarization of social and political issues. A notable example occurred in Russia, where bot networks amplified anti-vaccine messages, creating significant divisions in public perception about the effectiveness of vaccines [
8]. Similarly, bots have contributed to intensifying ideological divisions in various societies [
9] and have demonstrated the ability to influence electoral processes and political outcomes [
10].
Studies have shown that the reach and visibility of social media posts influence user behavior. In the Mexican context, social bots have been documented as active agents in politically sensitive events. During the 2018 presidential election, bot networks were identified amplifying specific candidates’ messages and suppressing opposing viewpoints on Twitter/X, contributing to the artificial polarization of public debate [
11]. Similarly, bots have been used to manipulate hashtag trends during social movements such as #YoSoy132 and #Ayotzinapa, distorting public perception and undermining the organic reach of citizen mobilization [
12]. More broadly, quantitative studies have demonstrated that social bots are responsible for a disproportionate share of misinformation diffusion: Ref. [
13] analyzed 14 million Twitter messages and found that bots, representing only 6% of accounts, were responsible for spreading 31% of all low-credibility content, acting primarily in the early seconds of diffusion before an article goes viral. Similarly, Ref. [
14] showed that during the 2017 Catalan referendum, bots generated 23.6% of all posts and systematically targeted human influencers with negative and inflammatory content, exacerbating social conflict online. Furthermore, analyses conducted by experts and political actors in countries such as the United States, Japan, France, and Spain indicate that the algorithms of platforms like Twitter/X can amplify or silence certain voices, indirectly influencing public debate [
15].
In recent elections, social media bots have favored political candidates through disinformation campaigns and artificial amplification in countries such as Ecuador (2017), Colombia, Brazil, and Mexico (2018), as well as in Argentina (2019) [
11,
16]. More recently, bot activity has been documented in the United States (2020), Brazil (2022), and Mexico (2024), where automated accounts were used to amplify political messaging, suppress dissenting voices, and spread coordinated misinformation during electoral campaigns [
17,
18]. Recent studies suggest a shift from simple automated accounts toward more sophisticated, hybrid bot behaviors that combine automation with human-like interaction patterns, increasing their effectiveness in political discourse manipulation [
18]. Given this landscape, the automatic detection of bots has become a significant issue within the fields of cybersecurity and social media analysis.
To address this challenge, numerous studies have proposed solutions based on artificial intelligence and machine learning algorithms. Some approaches use social network graph models [
19], while others employ traditional classifiers such as Random Forest combined with crowdsourcing techniques, achieving accuracies of up to 85% [
20].
More recent studies have incorporated deep learning models, such as a hybrid architecture based on convolutional neural networks and transformers, with mixed results [
21]. Meanwhile, simpler approaches, such as logistic regression, have reported accuracy exceeding 97% when supported by sets of highly discriminative variables [
22].
One of the main challenges in bot detection lies in the selection and availability of relevant features. With respect to current TwiBot-22 benchmarks, state-of-the-art methods such as graph neural networks and multimodal transformers have reported AUC values above 0.85 on the full dataset [
23,
24]. However, these approaches typically require access to the complete social graph structure and large-scale pretraining, which limits their practical deployability. The present study is positioned as a complementary, interpretable alternative that operates exclusively on static user profile and behavioral features, achieving competitive performance without relying on relational graph data or pretraining resources.
Unlike transformer-based approaches, which rely on large-scale pretraining and often require access to relational or graph-based information, the proposed methodology operates exclusively on static profile and behavioral features, enabling broader applicability in scenarios with limited data availability.
Insufficient informative variables can limit the performance of classification models. Previous studies have shown that relying solely on basic profile metadata limits the discriminative capability of classification models. For instance, ref. [
25] report that isolated profile attributes provide limited predictive power, while ref. [
20] demonstrate that incorporating behavioral features significantly improves classification performance. To mitigate this problem [
25] proposed datasets enriched with variables correlated with user behavior and interactions between accounts, thereby increasing the model’s discriminatory power.
Although recent state-of-the-art approaches, including graph neural networks and transformer-based models, achieve strong performance on TwiBot benchmarks, they often depend on the availability of full graph structures, temporal sequences, or large-scale pretraining. In contrast, the proposed methodology is designed as a complementary approach that operates exclusively on static profile and behavioral features, enabling its application in scenarios where complex relational data are not available. This highlights the need for lightweight, interpretable models capable of maintaining competitive performance under realistic constraints.
In this context, the objective of this research is to identify social bots on the Twitter/X platform by analyzing the characteristics of real users and automated accounts, as well as to increase the number and quality of variables through feature engineering. Unlike graph-based approaches that require access to the full social network structure [
23,
24], or transformer-based methods that depend on large-scale pretraining [
21], the proposed methodology relies exclusively on user profile and behavioral features, offering a more interpretable and computationally efficient alternative suitable for scenarios with limited relational data. To this end, four classification models are evaluated: a Neural Network, Support Vector Machines, a Random Forest classifier, and Extreme Gradient Boosting (XGBoost), using robust evaluation metrics for the comparative analysis of the results.
The rest of the document is organized as follows:
Section 2 describes the Materials and Methods used;
Section 3 presents the results obtained;
Section 4 discusses these results; and finally,
Section 5 outlines the conclusions and directions for future research.
2. Related Work
Feature-based approaches represent the earliest and most interpretable line of research in social bot detection. Ref. [
26] introduced TwiBotX, an explainable AI framework for bot detection on Twitter/X using 14 user profile features combined with machine learning and SHAP-based explainability, achieving an accuracy of 96.47% on TwiBot-22. Similarly, Ref. [
17] proposed Botcheck, a profile-based explainable bot detection system that integrates LIME to provide local explanations for each classification decision, demonstrating that transparent models operating exclusively on user profile features can achieve competitive performance. These results confirm that carefully designed feature sets combined with explainability mechanisms can be as decisive as model complexity, a principle that directly motivates the present study.
Graph-based approaches have gained significant traction following the release of large-scale benchmarks such as TwiBot-22 [
27]. Ref. [
23] proposed SEGCN, a subgraph encoding-based graph convolutional network that computes node representations from surrounding induced subgraphs rather than immediate neighbors only. Evaluated on TwiBot-20 and TwiBot-22, SEGCN improved the accuracy of state-of-the-art bot detection models by approximately 2.4% and 3.1% respectively, published in Scientific Reports. More recently, Ref. [
24] proposed a multimodal bot detection framework integrating user profile features, text analysis, and graph-based techniques on TwiBot-22, addressing limitations of methods that use outdated techniques or lack reproducibility, published in Social Network Analysis and Mining. Despite their strong performance, these graph-based approaches require access to the full social network structure, which may not be available in practical deployment scenarios.
Multimodal and transformer-based approaches combine user profile features, tweet content, and graph structure. Arranz-Escudero et al. [
24] proposed a multimodal bot detection framework integrating user profile features, text analysis, and graph-based techniques on TwiBot-22, addressing limitations of methods that use outdated techniques or lack reproducibility. Ref. [
18] applied deep learning techniques for early detection and prevention of malicious user behavior on Twitter, published in IEEE Transactions on Computational Social Systems [
28] proposed BotDCGC, an unsupervised detection framework based on deep contrastive graph clustering that jointly optimizes user node embeddings and cluster assignments without requiring labeled data, published in Knowledge-Based Systems.
Explainability in bot detection remains an underexplored area. A recent systematic literature review covering studies from January 2010 to June 2024 identified data quality, model generalizability, feature selection, adversarial resistance, and interpretability as the main open challenges in machine learning-based social bot detection [
29]. While SHAP-based explanations have been widely adopted in adjacent cybersecurity domains, their application to social bot detection specifically remains limited, representing a gap that the present work addresses through explicit SHAP analysis of the XGBoost model and decision hyperplane coefficient analysis of the linear SVM.
Despite strong performance from graph and transformer-based methods, these approaches typically require access to the full graph structure of the social network, which may not always be available in practice. Therefore, there remains a need for interpretable and resource-efficient approaches that can operate effectively without relying on full graph structures or large-scale pretraining.
The present study focuses on a complementary setting: profile-based and behavioral feature engineering with explainable classifiers, offering a transparent and reproducible alternative suitable for deployment scenarios with limited relational data.
Recent advances in social bot detection (2024–2026) highlight the growing importance of explainable and hybrid approaches, particularly in scenarios where access to full graph data or large-scale training resources is limited.
This work contributes to the literature by demonstrating that explainable, profile-based approaches can remain competitive with more complex models, while offering greater transparency and deployability. Despite these advances, there remains a lack of interpretable, profile-based approaches that operate effectively without relying on graph structures, temporal sequences, or large-scale pretraining. This gap motivates the proposed methodology, which focuses on leveraging static profile and behavioral features to achieve competitive performance while maintaining interpretability and practical applicability.
Recent studies from 2024 to 2026 highlight the increasing use of graph neural networks, transformer-based architectures, and multimodal approaches for social bot detection, reflecting rapid advances in the field.
3. Materials and Methods
This section provides a detailed description of the materials, the dataset used, the preprocessing procedures, feature engineering, data balancing and normalization techniques, as well as the steps followed for the design, training, and evaluation of the machine learning models. The level of detail provided allows for the complete replication of the experimental process.
3.1. Materials
The experiments were conducted on an Acer Nitro AN515-55 laptop (Acer Inc., New Taipei City, Taiwan) with the following hardware specifications:
The software environment was based on the Python 3.11.9 language and ran under the Anaconda 23.9.0 distribution. The following libraries were used: TensorFlow 2.17.0 for implementing neural networks, Pandas 3.0.2 for data manipulation and cleaning, NumPy 2.0.0 for vectorized numerical operations, Matplotlib 3.10.9 for visualizing results, and Scikit-learn 1.5.1 for implementing machine learning models and preprocessing utilities.
3.2. Data
The dataset used was provided by the authors of TwiBot-22 [
27], who granted explicit permission for its use for research purposes. This dataset includes accounts of real users and automated accounts (bots), as well as metadata associated with tweets and structural and interactional features that reflect the similarity and relationships among users. The official documentation and the public version of the dataset are available in the corresponding GitHub repository. In this study, the complete version shared directly by the authors was used.
3.3. Preparation of the Dataset
This stage involves the procedures used to construct the final dataset used for training and evaluating the classification models.
3.3.1. Data Preprocessing
An initial filtering step was performed to remove records with missing values, incomplete attributes, or inconsistent formats. Only those instances containing complete and valid information were retained. This process reduced the dimensionality of the original dataset and improved the quality of the input data for the models.
3.3.2. Feature Selection
To identify the most informative variables, an exploratory analysis was conducted using Principal Component Analysis (PCA). This method was not used as a technique for transforming the feature space, but rather as a diagnostic tool. Specifically, the loading coefficients of the first principal component were analyzed to determine which original variables contributed significantly to the explained variance. Based on this analysis, the features with the highest absolute loading values in the first principal component, which explained 22.2% of the total variance, were manually selected, while preserving the interpretability of the original variables. Feature selection was based on relative contribution rankings rather than fixed loading thresholds, prioritizing interpretability over dimensionality reduction. It is important to note that PCA was applied exclusively as a descriptive diagnostic tool and not as a dimensionality reduction technique—the original variables were preserved in their interpretable form throughout the analysis.
Feature selection was based on relative contribution rankings rather than fixed loading thresholds, prioritizing interpretability over dimensionality reduction. This approach ensures that feature selection is guided by statistical relevance while maintaining model interpretability. The features resulting from this transformation are summarized in
Table 1.
3.3.3. Feature Engineering
The original features of the TwiBot-22 dataset —primarily account metadata such as follower counts, creation date, and activity statistics —proved insufficient for achieving a robust classification between human accounts and bots. This limitation has been documented in previous work [
25] demonstrated that datasets relying solely on profile metadata show limited discriminatory power, and emphasized that behavioral and interaction-based variables are key factors for effective bot detection. Similarly, ref. [
20] noted that crowdsourcing-enriched feature sets significantly outperform raw metadata approaches. Based on these findings, additional features were designed to capture behavioral, structural, and temporal patterns associated with automated account behavior. These variables aim to capture behavioral, structural, and temporal patterns associated with the automated behavior of the accounts. Specifically, the following estimators were generated:
All the designed features, along with the original features selected in the previous stage, are summarized in
Table 2, which presents the final set of variables used for training and evaluating the machine learning models.
word_count_description: captures descriptive behavior patterns and has been associated with user profiling features [
20].
followers_to_following_ratio: commonly used indicator of non-organic account behavior [
20].
credentials_null: reflects incomplete or automated profile characteristics [
25].
MaxMinFollowing: captures imbalance in follower–following relationships [
22].
creation_time: provides temporal information related to account activity patterns [
16].
3.3.4. Data Balancing
The original TwiBot-22 dataset contains approximately one million records. After applying the filtering process described in
Section 3.3.1, a subset of 57,000 instances with complete and valid information was obtained. The resulting distribution showed a class imbalance, with approximately 70% human accounts and 30% bot accounts.
To avoid bias in the classification models toward the majority class, a stratified random subsampling strategy was applied. This approach is consistent with previous work on social bot detection and ensures an equitable representation of both classes, while also reducing the computational cost of training.
Formally, let
be the majority class with
instances and
be the minority class with
instances. A random sample of size
was drawn from the majority class, defined as
The resulting balanced dataset
was obtained by combining that sample with the minority class
The final balanced dataset consisted of 1000 labeled instances, with a 50% ratio of bots to human accounts (500 instances per class). This subset size was deliberately chosen for several reasons. First, the primary objective of this study is the comparative evaluation of four classification models under controlled and reproducible conditions, for which a balanced dataset of this size provides sufficient statistical power for five-fold stratified cross-validation, yielding 200 test instances per fold. Second, previous work in social bot detection has demonstrated that carefully engineered feature sets can achieve strong classification performance even on moderately sized datasets [
22], suggesting that dataset size alone is not the determining factor for model effectiveness. Third, the reduction in dataset size significantly lowers the computational cost of training and evaluation, enabling a systematic and fair comparison across all models under identical experimental conditions. Fourth, the use of a perfectly balanced subset eliminates the confounding effect of class imbalance on the comparative analysis, ensuring that observed performance differences reflect model behavior rather than class distribution artifacts. The use of a reduced, fully controlled dataset prioritizes experimental consistency over scale, enabling a more rigorous comparative analysis across models.
It is acknowledged that this reduction entails the loss of a portion of the original information and may limit the generalizability of the findings to larger and more heterogeneous populations. As a future line of work, we plan to evaluate the complete dataset using synthetic oversampling techniques such as SMOTE [
30] or class weighting schemes, which would allow the full training signal of the original TwiBot-22 dataset to be exploited without introducing class imbalance bias.
3.3.5. Data Normalization
Before training the machine learning models, all numerical variables were normalized using the minimum-maximum scaling method to ensure comparability among features with different ranges of magnitude. Normalization was performed according to the following expression:
This procedure transformed all variables into the interval , preventing features with high numerical values from dominating and ensuring compatibility with scale-sensitive algorithms, such as support vector machines and neural networks.
The balanced dataset was then split into 80% for training and 20% for validation. For the final evaluation of the models, five-fold stratified cross-validation (Stratified K-Fold) was used, ensuring that the class proportions were maintained in each partition. In each fold, the normalization parameters were adjusted exclusively on the training subset and subsequently applied to the validation subset, thereby preventing information leakage between partitions.
3.4. Design of the Machine Learning Model
In this study, four supervised classification models were implemented to detect social bots on the Twitter/X platform: a feedforward neural network, support vector machines (SVMs) with different kernels, a random forest classifier, and Extreme Gradient Boosting (XGBoost). The selection of these models was motivated by three criteria: interpretability, demonstrated performance in related tasks, and complementary learning paradigms. Random Forest and XGBoost are ensemble tree-based methods that have shown strong performance on structured tabular data and provide built-in feature importance mechanisms, making them suitable for explainable bot detection [
20]. The linear kernel SVM is one of the most interpretable classifiers available, as its decision boundary can be directly analyzed through its coefficients [
22]. The feedforward neural network was included as a representative of connectionist models capable of capturing nonlinear interactions among features. Together, these four models cover a broad spectrum of learning strategies, from linear to nonlinear, from single models to ensembles, enabling a comprehensive and fair comparative analysis. More complex architectures such as graph neural networks or transformer-based models were deliberately excluded, as they require access to the full social graph structure of the platform, which is not always available in real-world deployment scenarios.
The selected models collectively cover a broad range of learning paradigms, enabling a balanced evaluation of linear separability, nonlinear interactions, and ensemble-based decision boundaries.
3.4.1. Feedforward Neural Network with Backpropagation
A feedforward artificial neural network (multi-layer perceptron) was implemented and trained using the backpropagation algorithm. The architecture of the neural network was determined through a systematic empirical experimentation process. An initial configuration with a larger number of hidden layers alternating ReLU and Tanh activation functions was evaluated; however, it exhibited overfitting.
The architecture was progressively simplified by reducing both the number of layers and the number of neurons per layer. The final configuration was selected as it provided the best balance between predictive performance and generalization capability across the five-fold cross-validation. The network consisted of:
Forward propagation is defined as
The loss function used was binary cross-entropy, which is suitable for binary classification problems
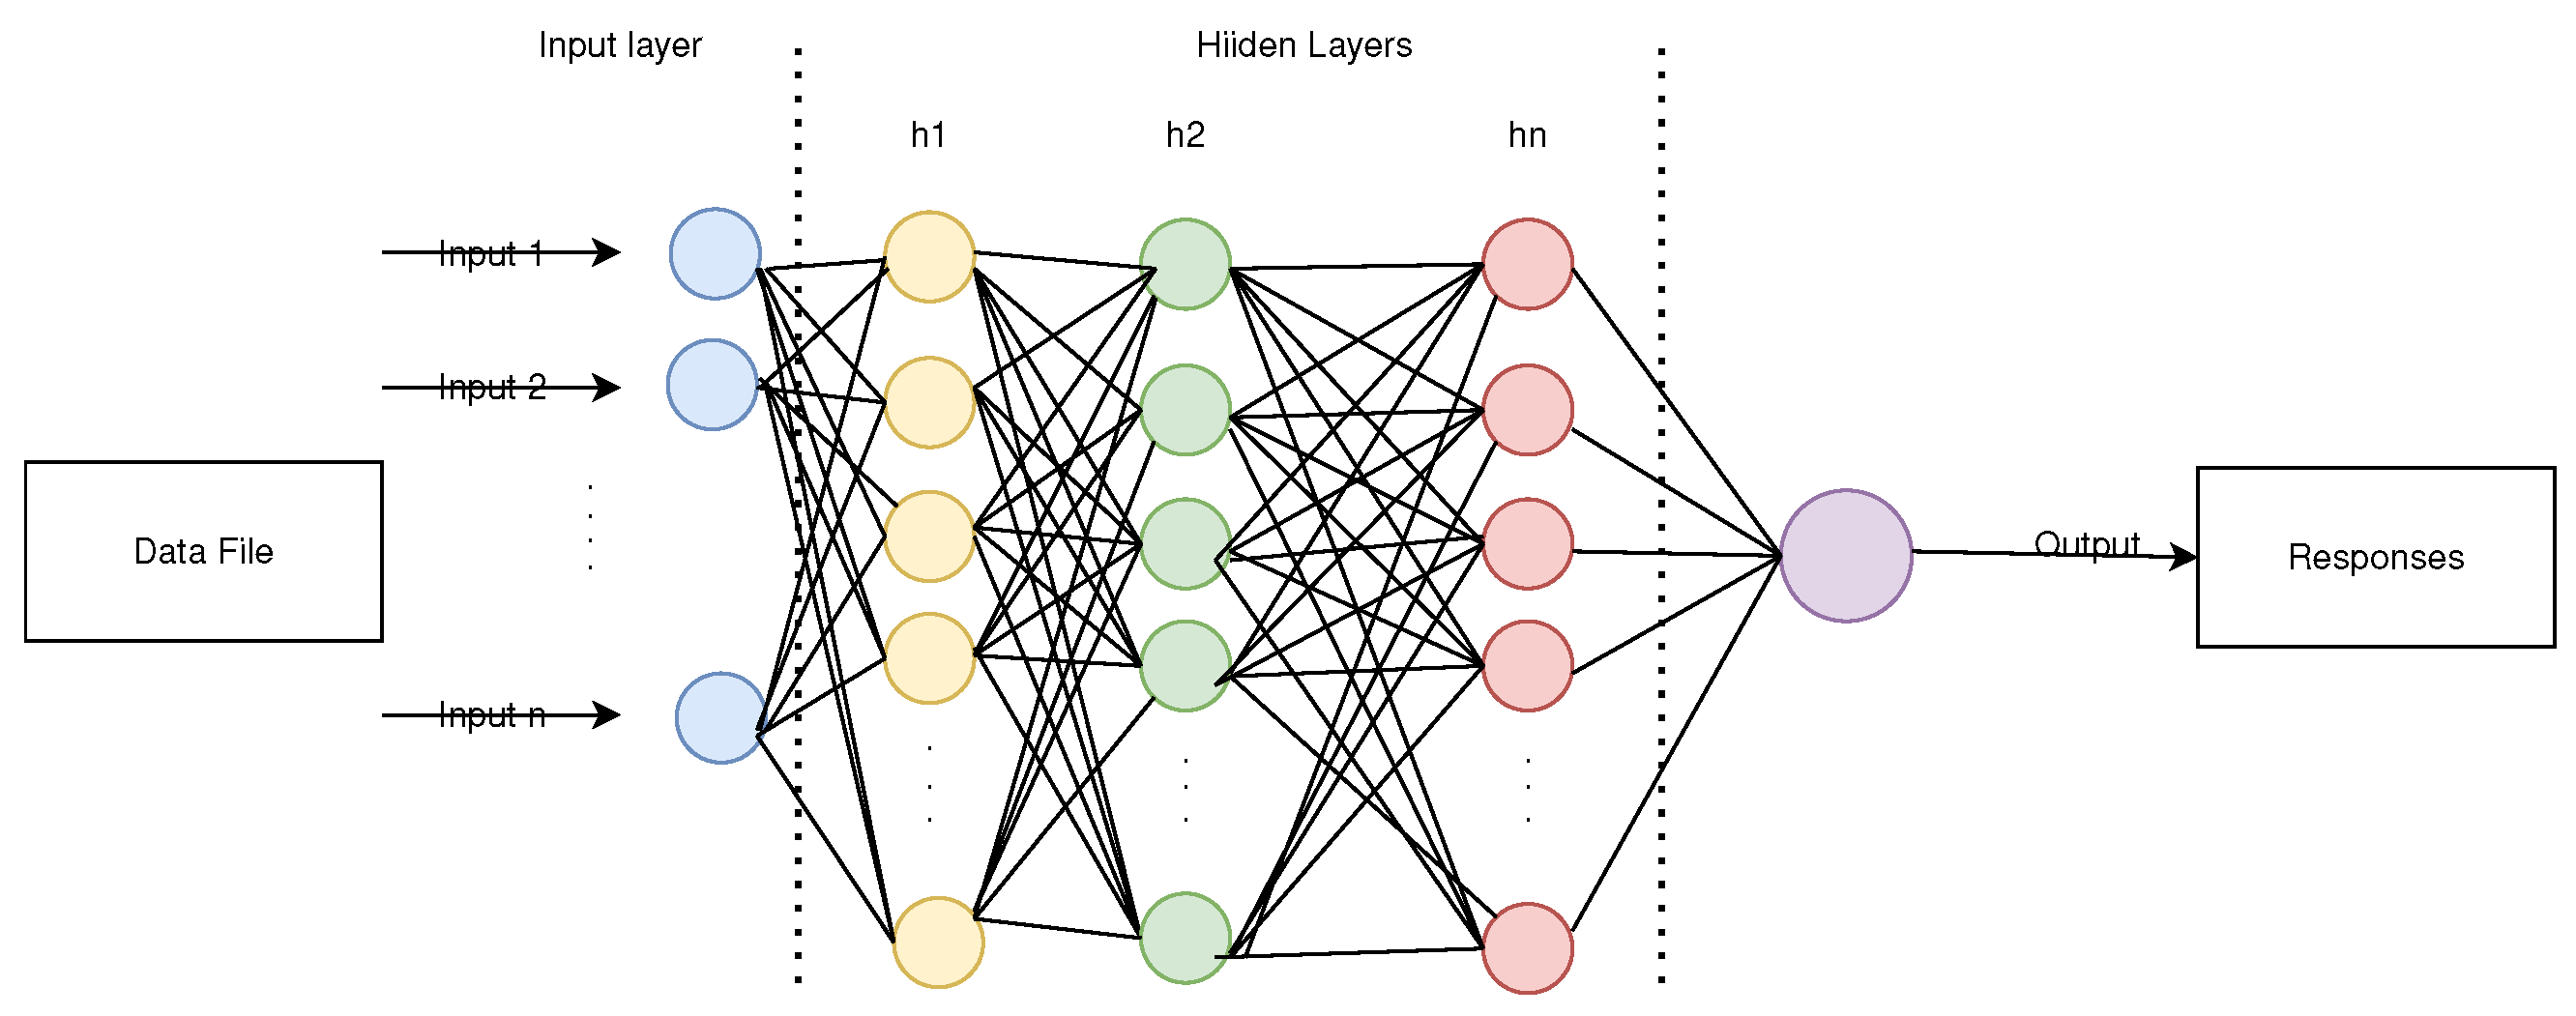
The model was trained using the Adam optimizer. To reduce overfitting, dropout layers were incorporated and early stopping was applied, monitoring the validation loss with a patience of 20 epochs. Training was performed with a batch size of 32 and a maximum of 500 epochs. The architecture was determined through empirical experimentation. An initial deeper configuration consisting of 11 hidden layers alternating ReLU and Tanh activation functions was evaluated first; however, this architecture exhibited signs of overfitting, with high training accuracy but reduced generalization on the validation subsets. The architecture was progressively simplified until the current three-layer configuration (64-32-16 neurons) was identified as the most effective, achieving a better balance between performance and generalizability while maintaining stable results across all five cross-validation folds. The resulting architecture is illustrated in
Figure 1.
3.4.2. Support Vector Machines Design
Support vector machines were implemented using four kernel functions: linear, polynomial, radial (RBF), and sigmoid. The optimization objective for SVM is to minimize the hinge loss with L2 regularization
Each kernel allows for the capture of different types of relationships between features, making it possible to assess their impact on bot detection. In particular, the linear kernel offers greater interpretability, while nonlinear kernels allow for the modeling of more complex relationships.
3.4.3. Random Forest Classifier Design
The Random Forest classifier is based on a set of decision trees trained using bootstrap sampling. Each tree makes an independent prediction, and the final decision is reached by majority vote. The clustering criteria used were the Gini index and entropy, defined as
The model’s overall prediction is expressed as
This model was selected for its robustness against overfitting and its ability to handle structured data with nonlinear interactions.
3.4.4. Extreme Gradient Boosting (XGBoost) Classifier
XGBoost is an ensemble learning method based on gradient boosting, which sequentially trains decision trees to minimize a differentiable loss function. The model’s objective function is defined as
where
represents the logistic loss function used for binary classification and
is a regularization term that penalizes the model’s complexity.
To mitigate the impact of class imbalance, the
scale_pos_weight parameter was set to the ratio of negative to positive instances in the training set. The hyperparameters were selected through empirical experimentation, combining literature-recommended default values [
31] with iterative adjustments to obtain stable and comparable performance across models. The number of trees was set to 100 to balance ensemble diversity and computational cost. A maximum depth of 6 was chosen to capture nonlinear relationships while mitigating overfitting. The learning rate (0.1) was used to introduce shrinkage and improve generalization. A subsample ratio of 0.8 was applied to reduce variance during training.
These hyperparameters were selected through empirical experimentation guided by commonly recommended default ranges in the XGBoost literature [
31]. Specifically: the number of trees (100) was set to provide sufficient ensemble diversity without excessive computational cost; the maximum depth of 6 prevents individual trees from overfitting while capturing nonlinear interactions; the learning rate of 0.1 follows the widely adopted convention of using shrinkage to improve generalization; and subsampling values of 0.8 for both instances and features introduce stochasticity that reduces variance and improves robustness on the balanced dataset used.
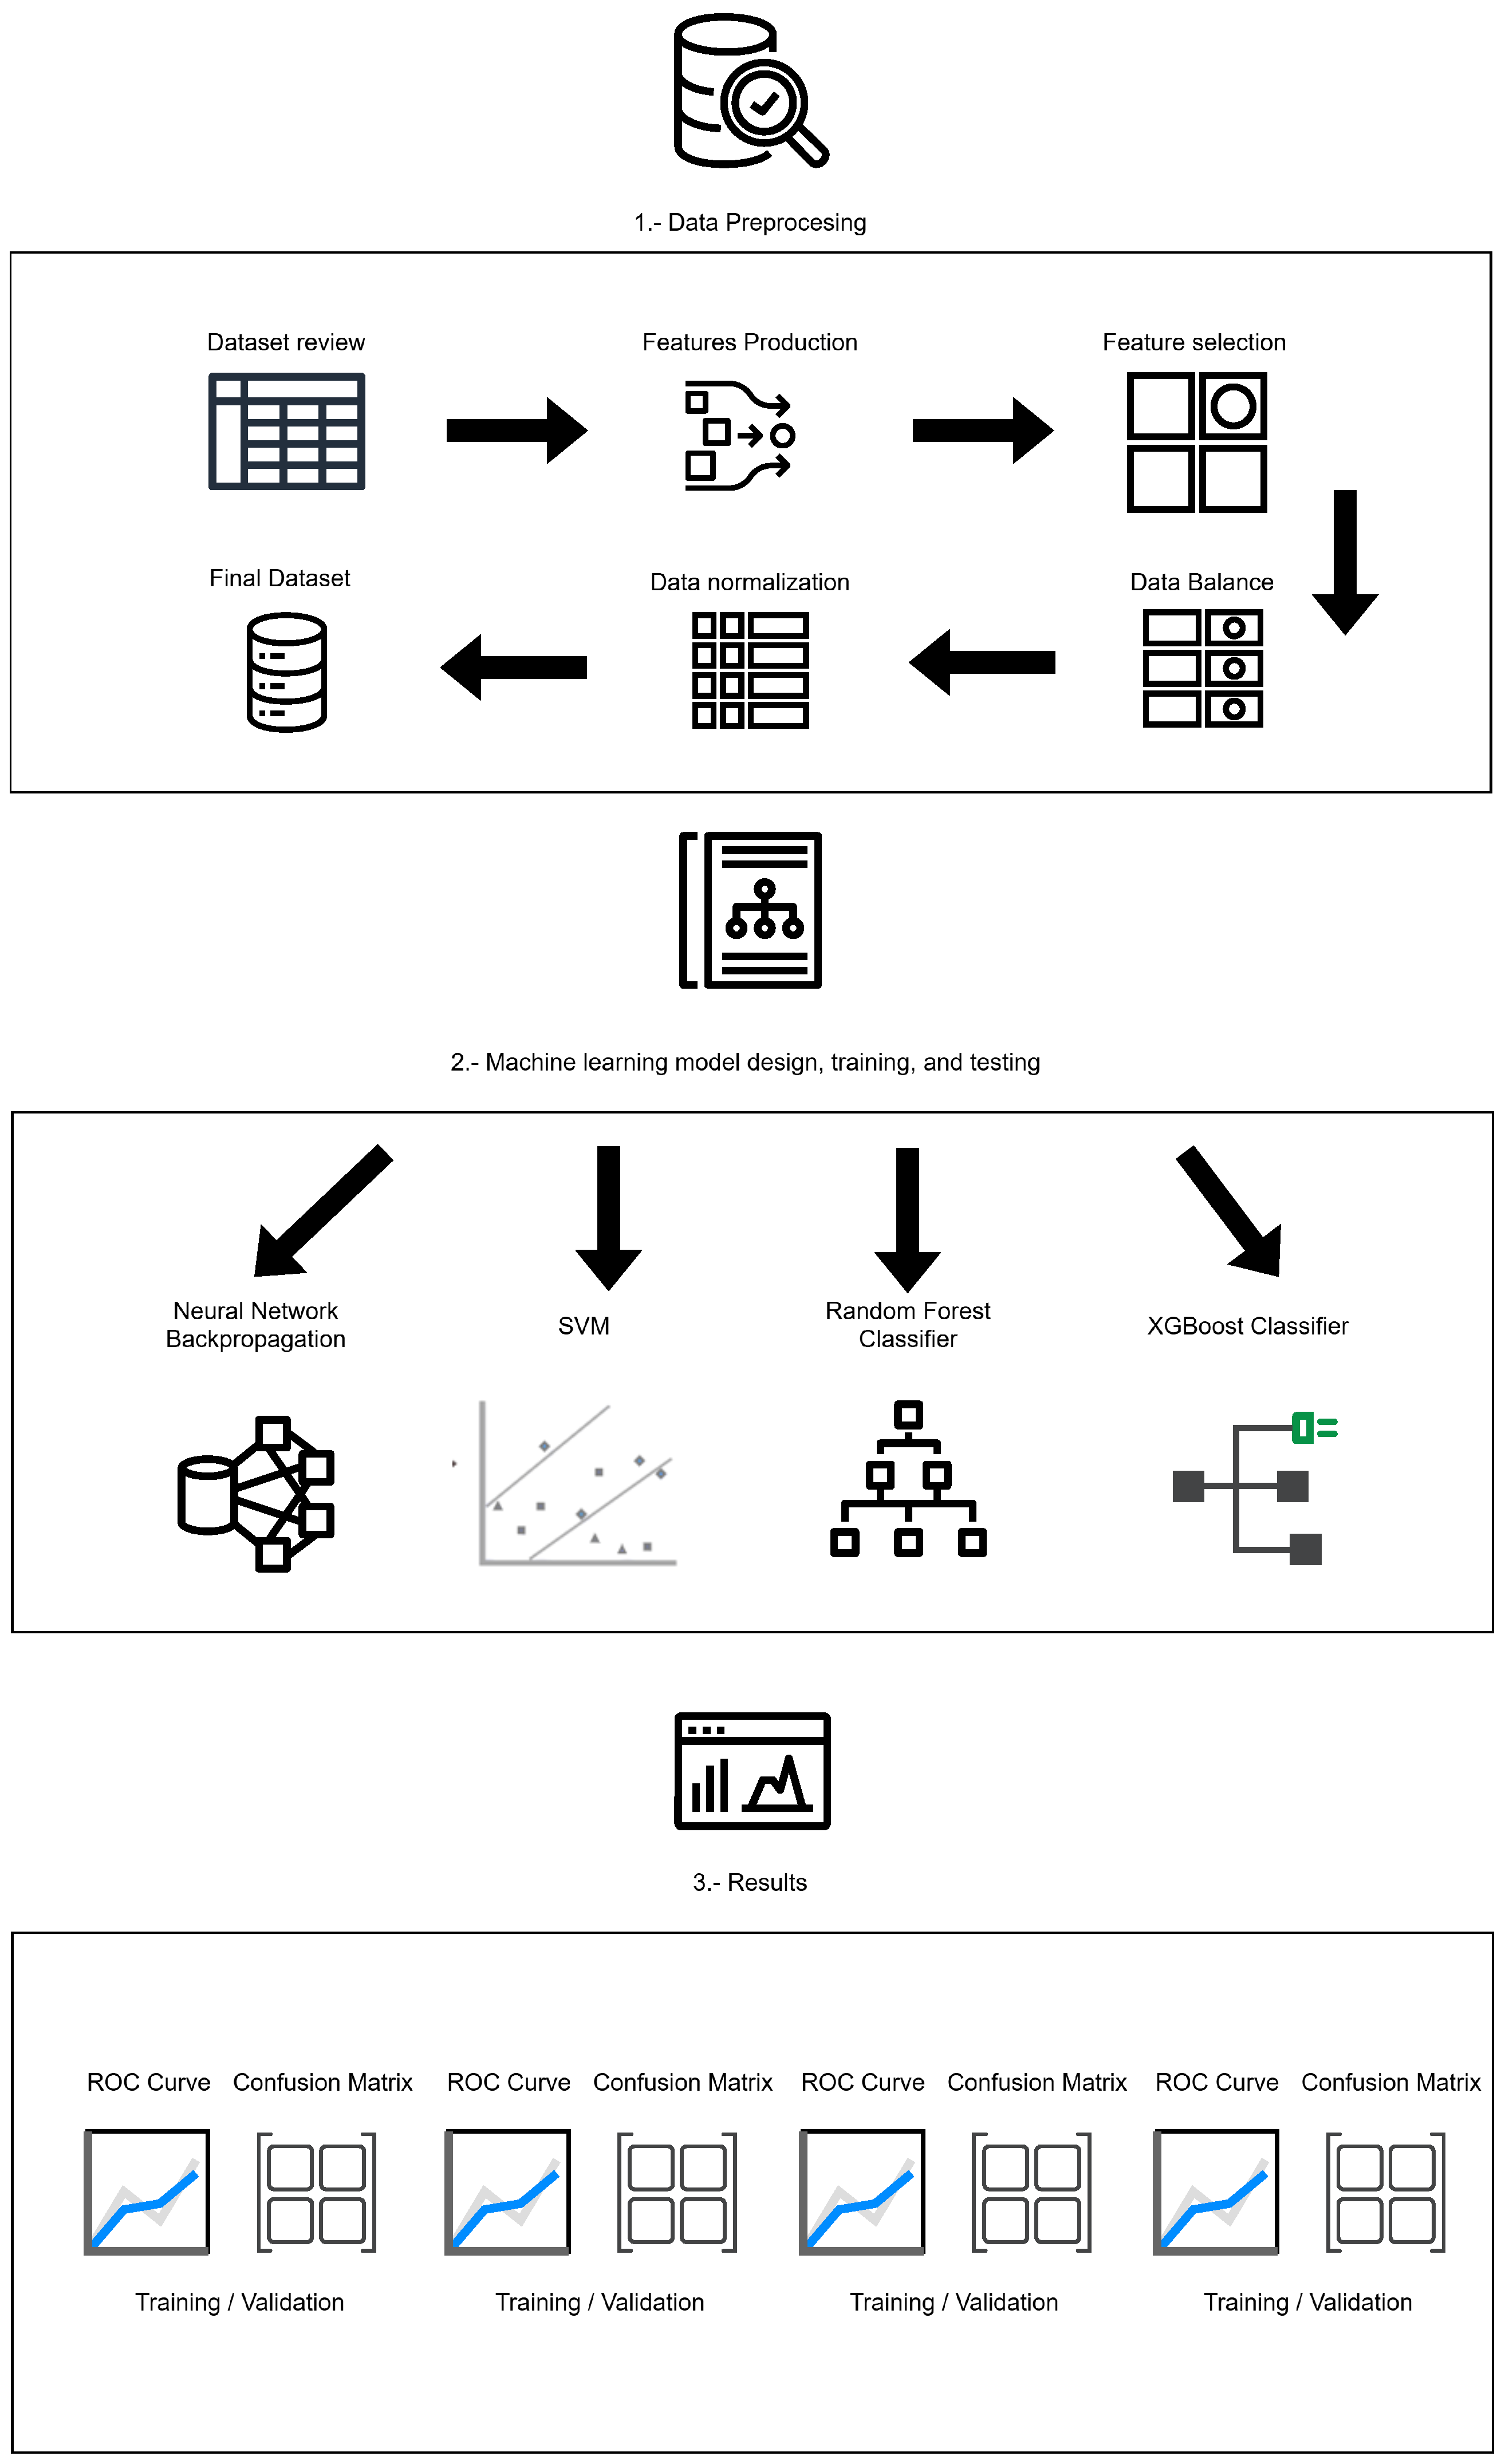
Figure 2 schematically describes the complete methodological workflow of the study, from the acquisition of the original dataset and the stages of preprocessing, feature selection, and feature engineering to the construction of the final dataset used in the experiments. It also presents the experimental setup, including the machine learning models implemented and the validation scheme, along with the metrics used for the systematic evaluation of the classification models’ performance.
3.5. Model Interpretability
Interpretability is a key aspect of social bot detection systems, as it allows for the analysis of classification model behavior, the evaluation of the relative contribution of the variables used, and increased confidence in the results obtained. In this study, interpretability is approached from an analytical perspective, considering both inherently interpretable models and complex models that offer mechanisms for approximate explainability.
3.5.1. Interpretability in Random Forest
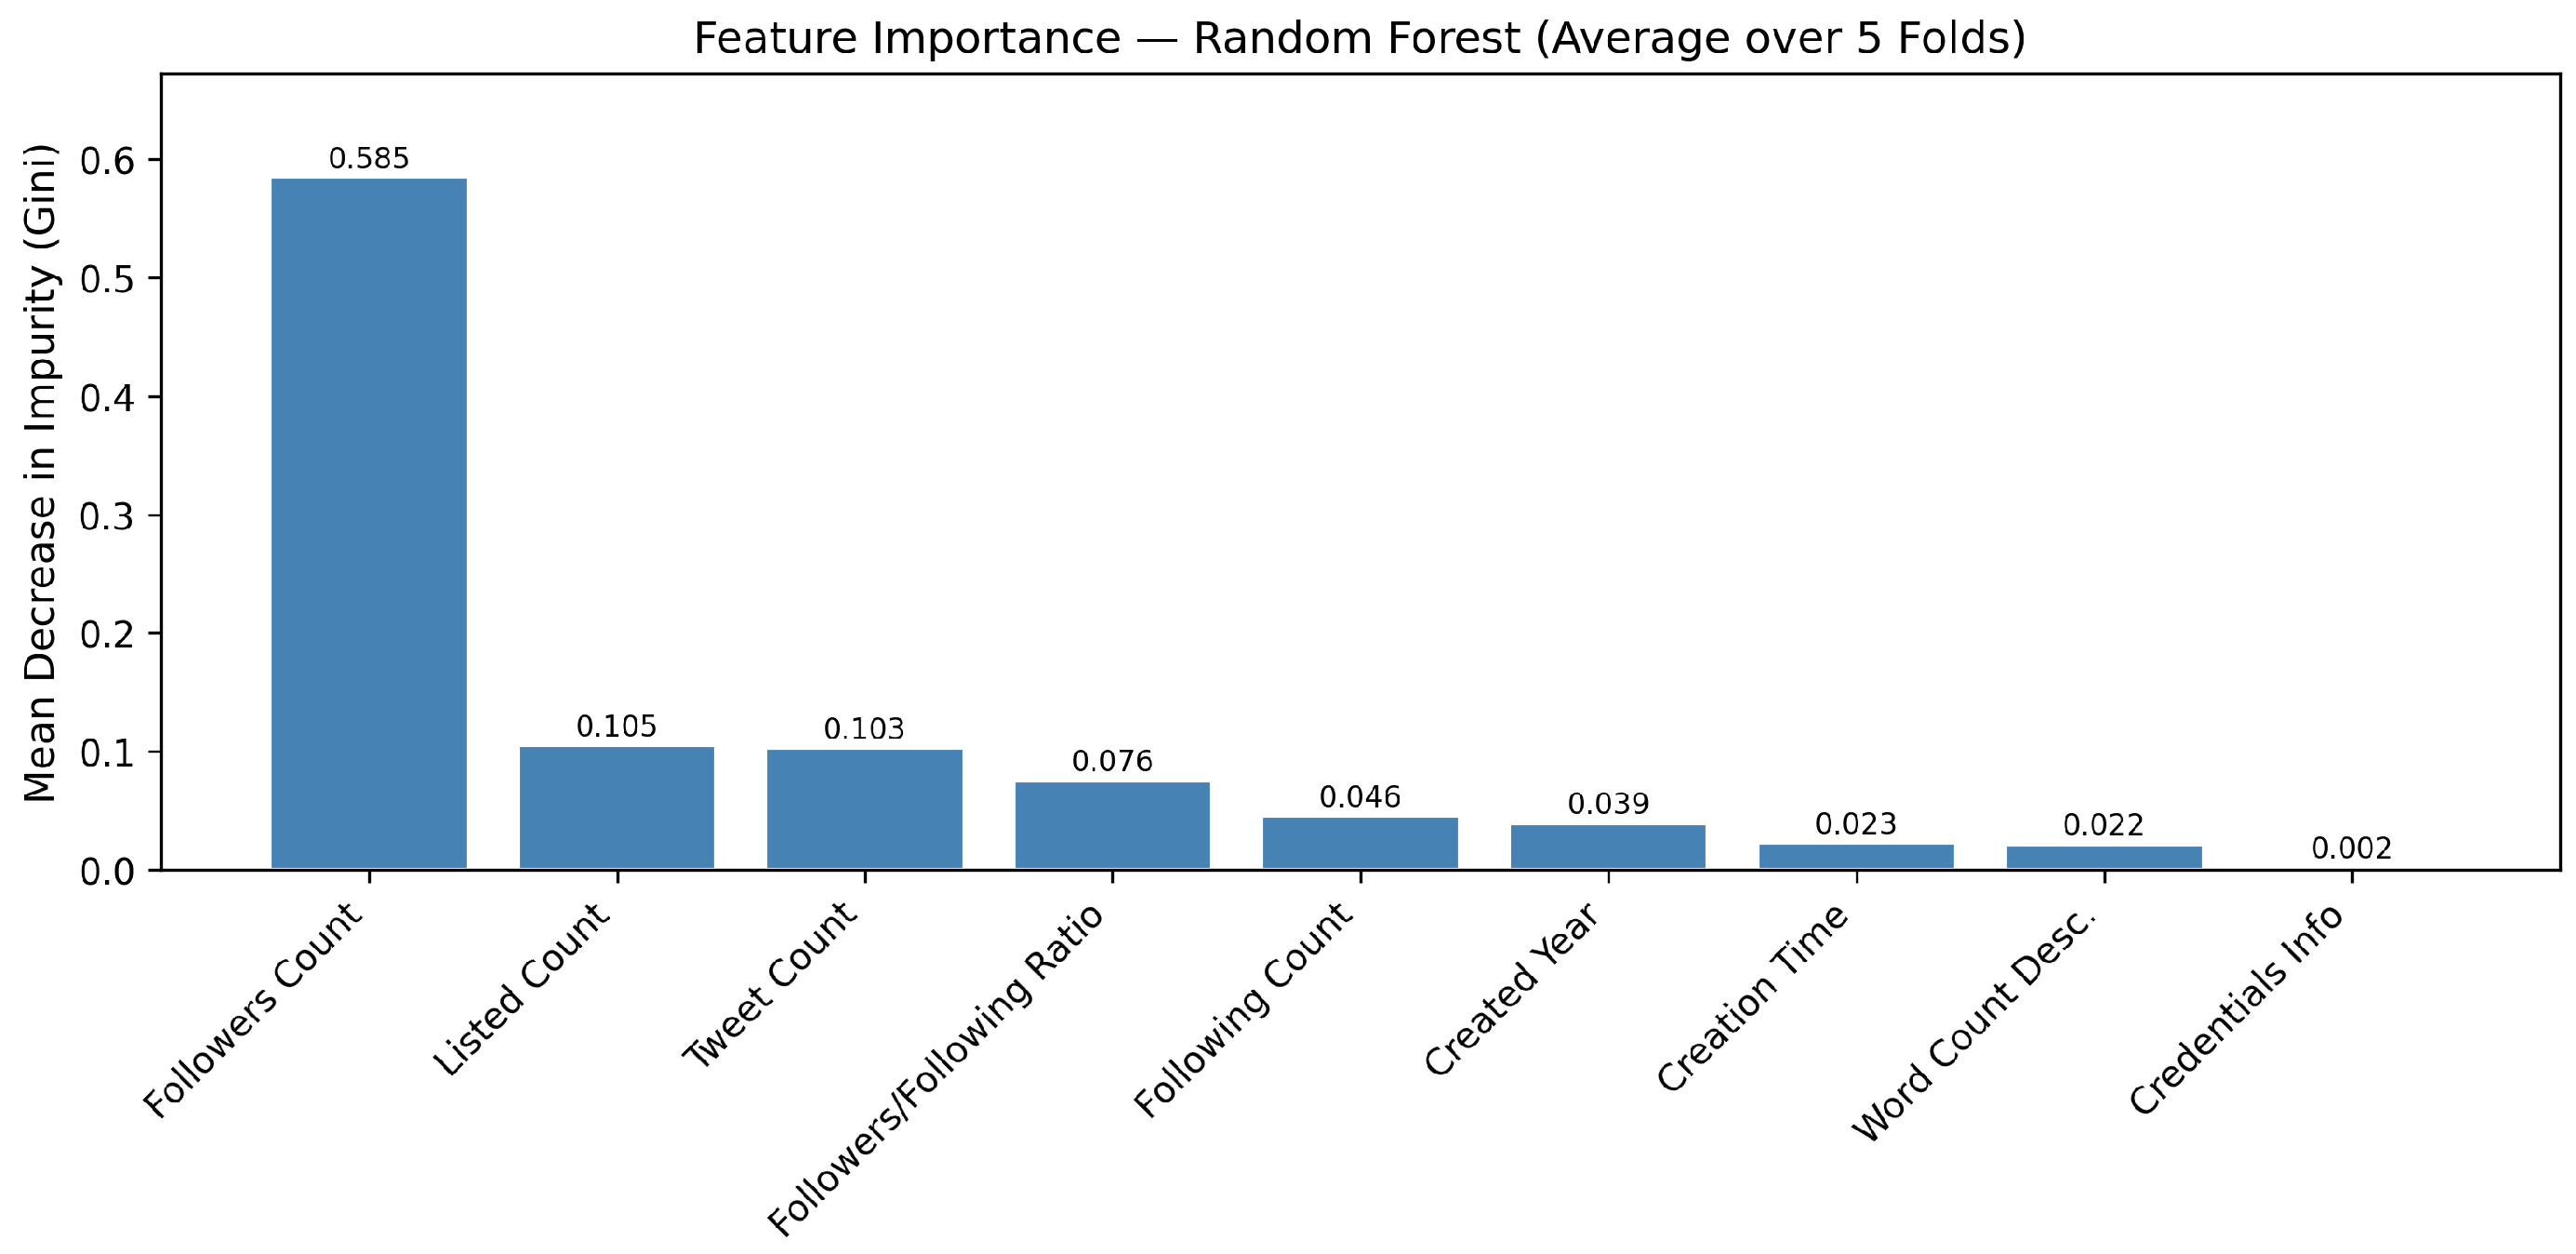
The Random Forest algorithm provides built-in interpretability mechanisms by calculating feature importance, derived from metrics used for splitting nodes in the trees, such as the Gini index or entropy. These measures make it possible to identify which variables contribute most significantly to reducing impurity during the training process.
Furthermore, the structure of the individual trees that make up the ensemble facilitates the inspection of local decision rules, allowing for the analysis of specific patterns associated with the classification of human accounts and bots. In this study, features such as Word_count_description, Credentials_info, MaxMinFollowing, and followers_to_following_ratio can be directly evaluated in terms of their relative contribution to model performance, providing a comprehensible interpretation of the classification process.
However, while Random Forest offers a higher degree of interpretability than black-box models, the overall interpretation of the complete set of trees should be considered in aggregate and not as a direct causal explanation.
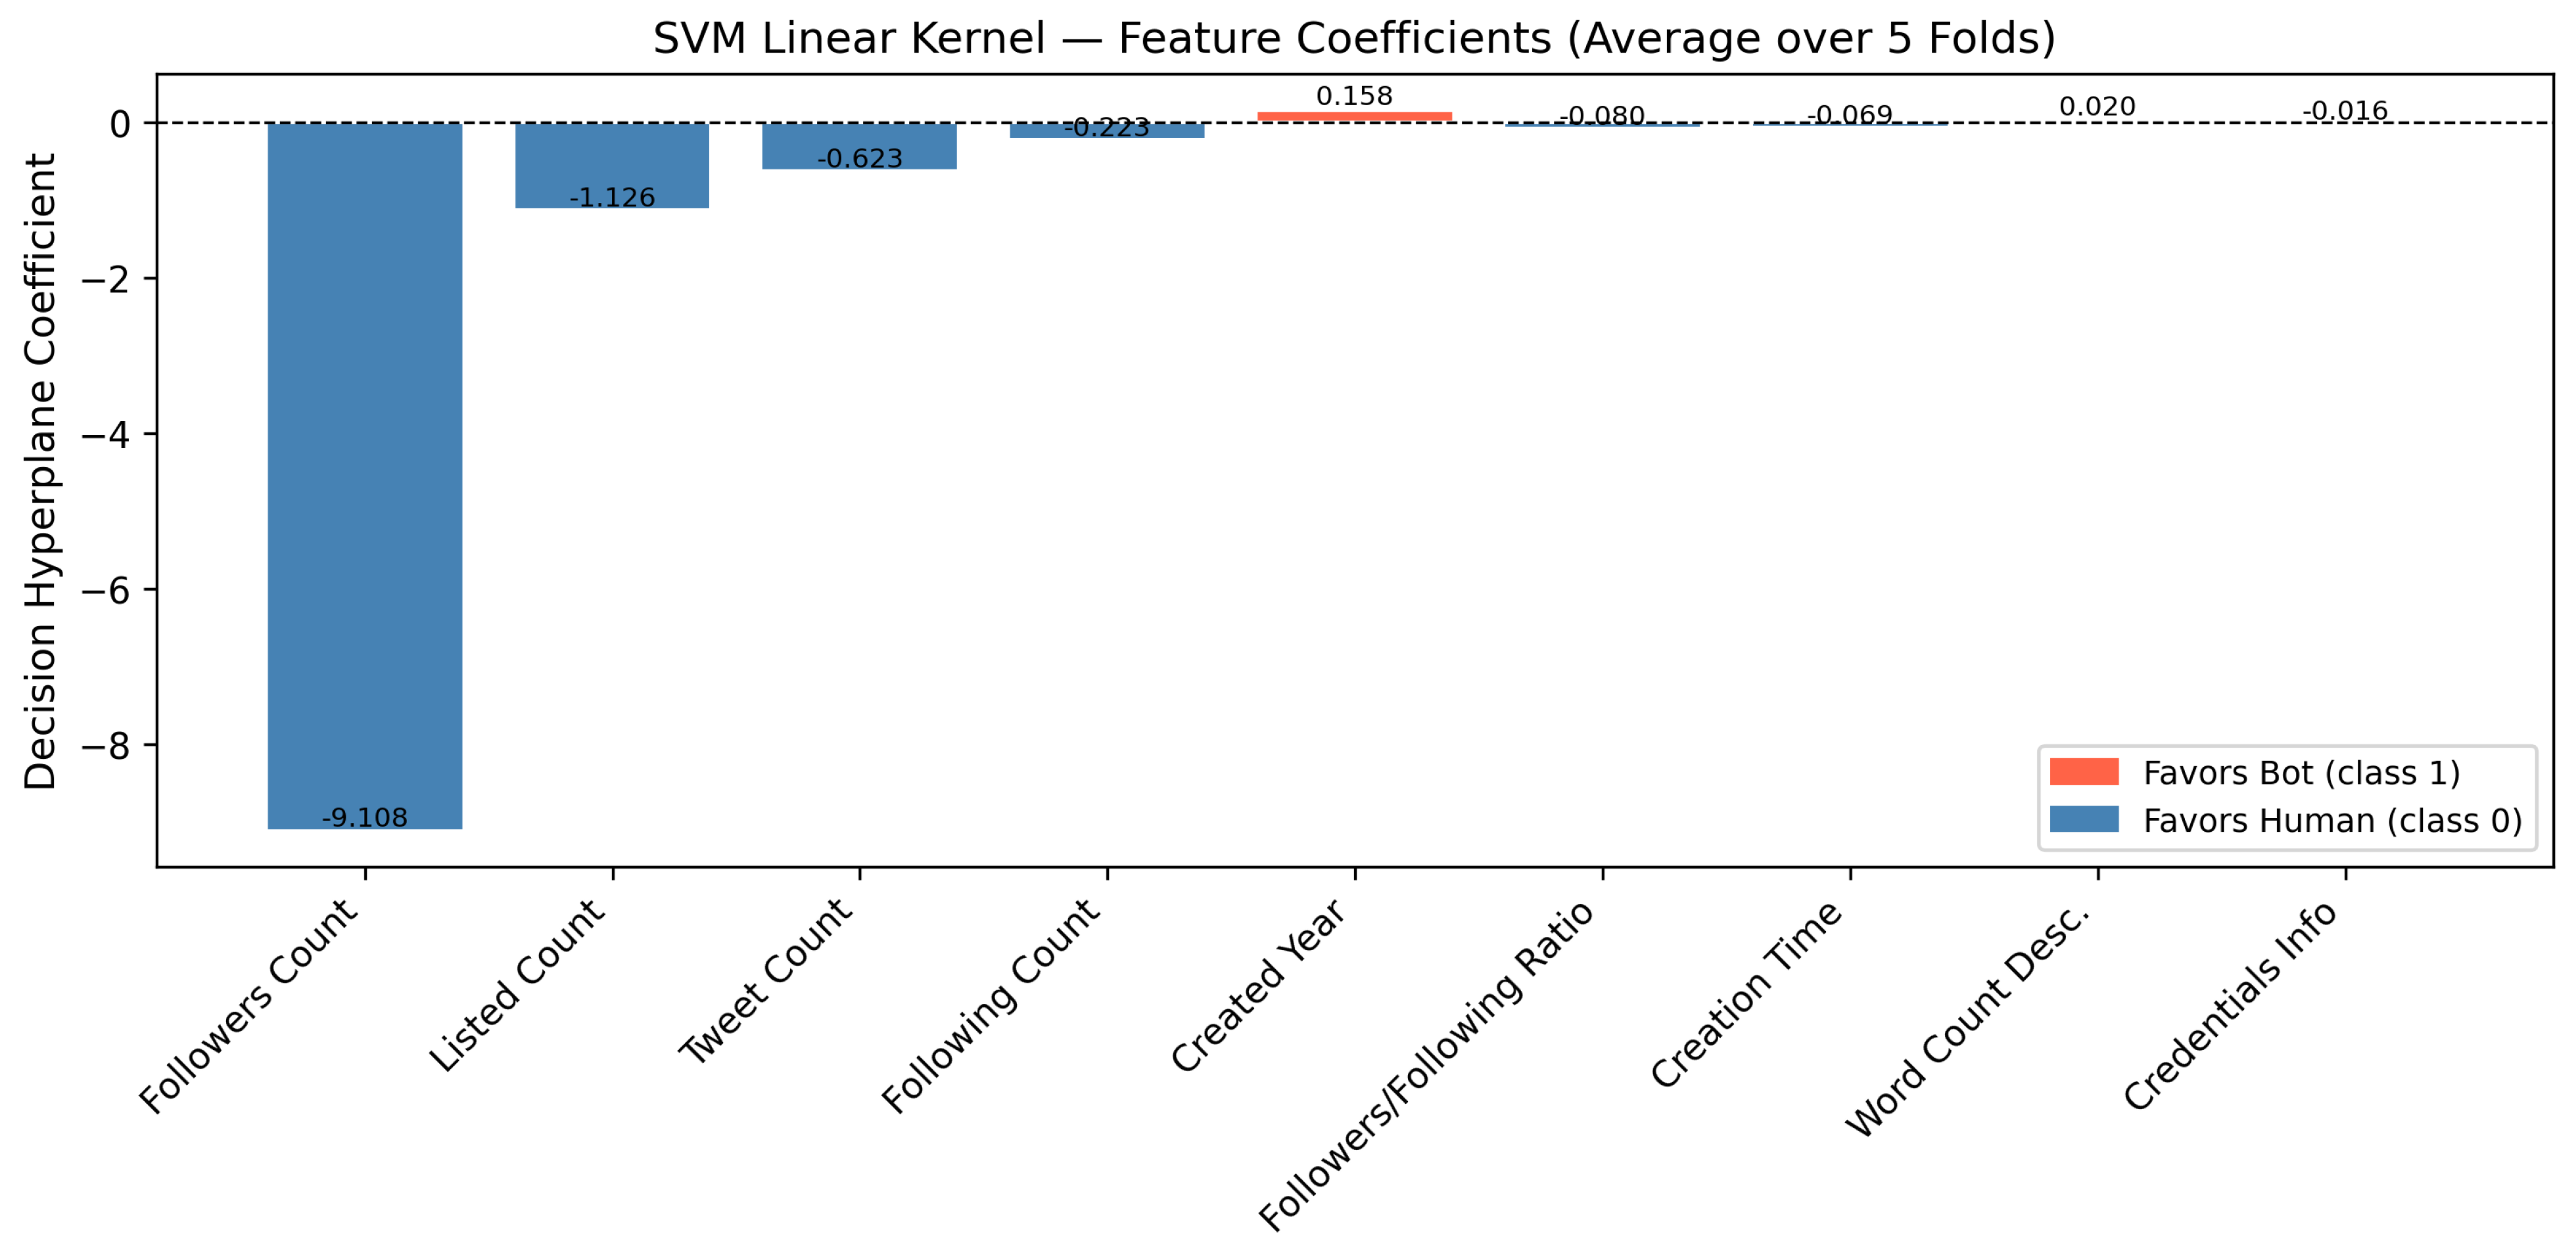
3.5.2. Interpretability in Linear Kernel SVMs
Linear kernel support vector machines are among the most interpretable models included in this study. In this case, interpretability stems directly from the coefficients of the decision hyperplane, which represent the magnitude and direction of each feature’s contribution to the classification process.
Higher absolute values in the coefficients indicate a more significant influence of the corresponding variable on the model’s decision, while the sign of the coefficient allows us to identify whether the feature favors classification as a human account or as a bot. This property makes the linear SVM a mathematically transparent model and particularly suitable for scenarios where traceability and rigorous analysis of the impact of the variables used are required.
3.5.3. Interpretability in XGBoost
XGBoost is an ensemble learning model based on decision trees and gradient boosting techniques. Although it is not inherently interpretable, it provides mechanisms for approximate explainability through feature importance metrics. This model allows for the evaluation of the contribution of variables using metrics such as weight (frequency of use in splits), cover (number of affected instances) and gain (average improvement in loss function reduction).
In this study, the gain metric was used to analyze the relative contribution of each feature to the classification process, as it directly reflects the average impact of a variable on the improvement of the model’s performance. This analysis allows us to identify which features are most relevant for distinguishing between human accounts and bots; however, these metrics should not be interpreted as causal explanations, but rather as indicators of the model’s internal behavior during training.
3.5.4. Scope and Relevance of Interpretability
Incorporating models with varying levels of interpretability allows for a complementary analysis of the classification process. While models such as linear SVMs offer direct interpretability, tree-based algorithms, such as Random Forest and XGBoost, provide more flexible—albeit approximate—analysis mechanisms.
This balanced approach between performance and explainability allows us to evaluate the impact of the variables used, strengthen our understanding of the model, and support the validity of the results obtained. It also provides a solid foundation for designing future improvements in feature engineering and for developing bot detection systems that are more reliable, verifiable, and applicable in real-world security and social media analysis contexts.
4. Results
This section presents the results obtained from the evaluation of the models applied. The evaluation was performed using five-fold stratified cross-validation, considering standard classification metrics: accuracy, precision, recall, F1 score, and area under the ROC curve (AUC). Class 0 corresponds to human accounts and class 1 to bot accounts.
Overall, ensemble-based methods (Random Forest and XGBoost) consistently outperform other models, suggesting that the feature space contains non-linear relationships that benefit from hierarchical decision structures.
4.1. Neural Network
Table 3 presents the performance of the feedforward neural network. The model demonstrated balanced performance across both classes, with an average accuracy of
and a Macro F1 score of
, indicating strong generalization ability.
For the human class, the model achieved high recall, suggesting a high ability to correctly identify legitimate accounts. In the case of the bot class, the combination of high precision and recall reflects a low number of false positives and adequate recognition of automated accounts. Taken together, these results indicate that the architecture optimized with regularization and early stopping was effective for this classification problem.
A closer examination of the per-class metrics reveals an asymmetry between precision and recall: the human class achieved high recall (0.992) but lower precision (0.926), while the bot class showed the opposite pattern, high precision (0.994) but lower recall (0.922). This asymmetry indicates that the model tends to classify ambiguous instances as human, resulting in a small number of undetected bots (false negatives). In practical terms, this behavior may be acceptable in scenarios where minimizing false accusations against legitimate users is prioritized. The low variance across folds (±0.006) confirms that this pattern is consistent and not an artifact of a particular data partition.
4.2. Support Vector Machines (SVM)
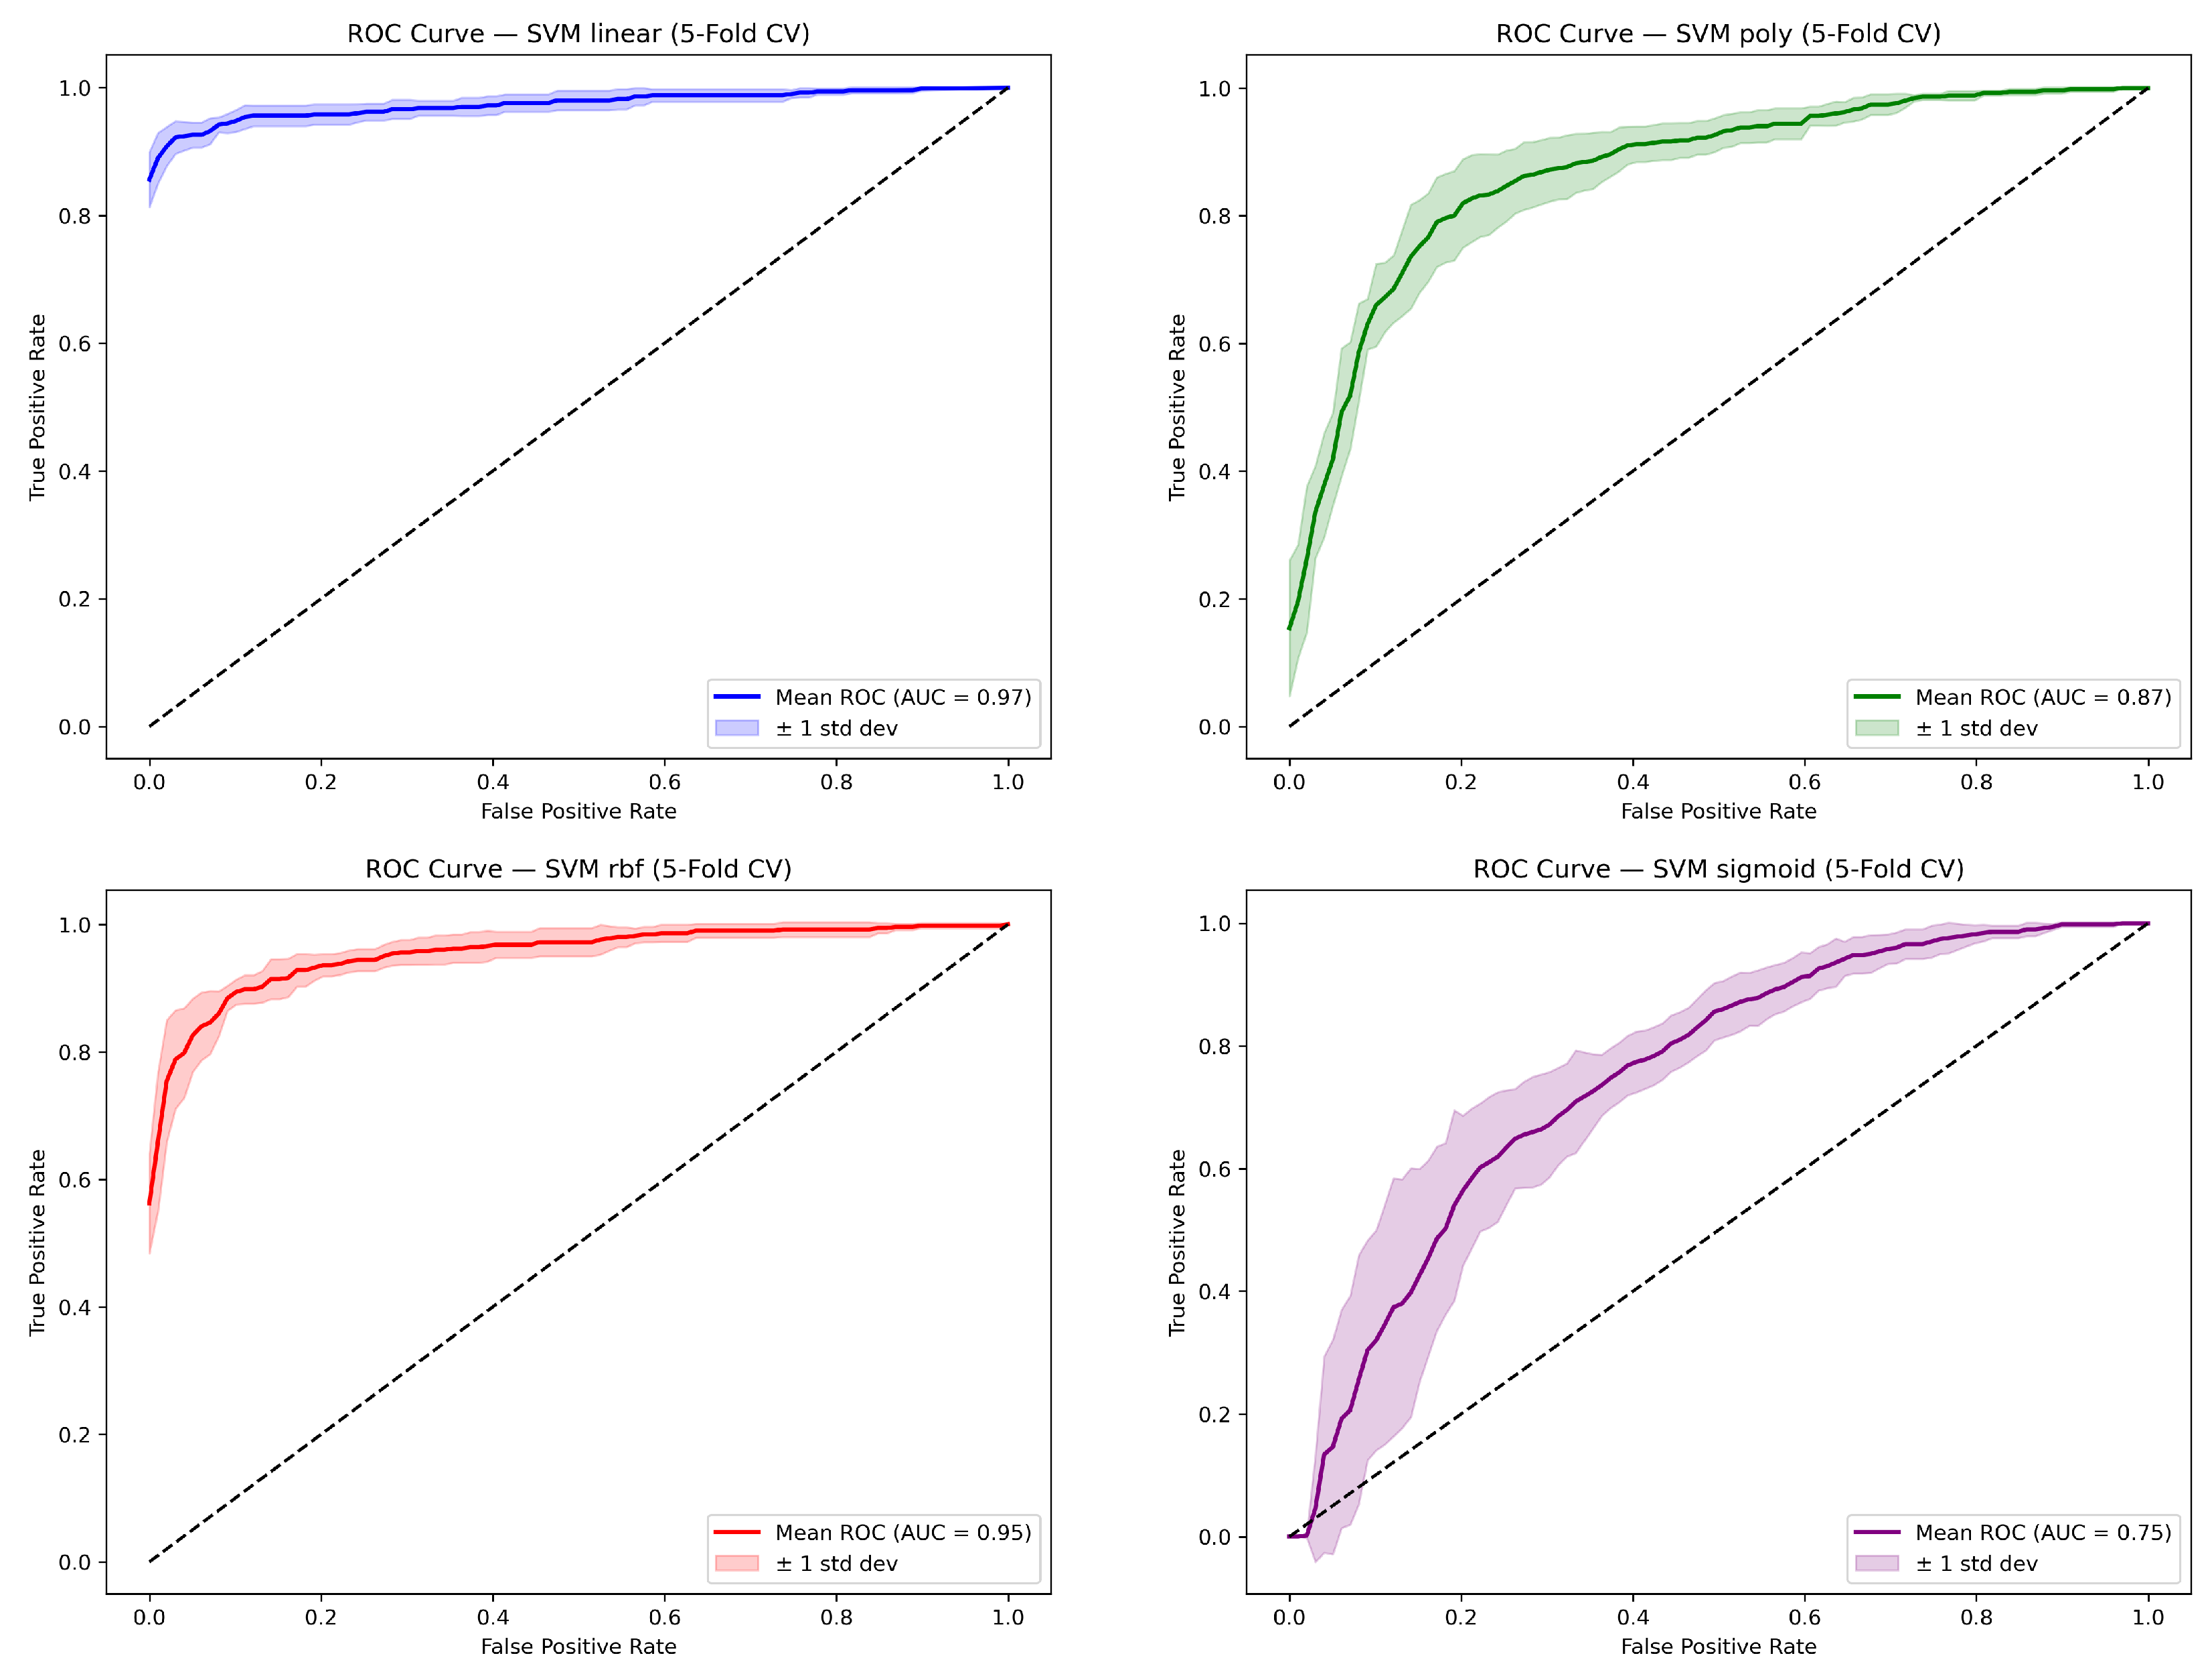
Table 4 summarizes the obtained results by SVM using linear (a), polynomial (b), RBF (c), and sigmoidal (d) kernels. The linear kernel performed best within this family of models, with an average accuracy of
and an equivalent Macro F1 score, demonstrating an adequate balance between classes and moderate variance across folds. The RBF kernel achieved intermediate performance, while the polynomial and sigmoid kernels showed notably lower performance and greater instability. These results suggest that, for the feature set used, a linear model is more suitable than a more complex nonlinear approach.
The performance gap between the linear kernel (0.941) and the nonlinear kernels, particularly the sigmoid (0.695), suggests that the engineered features used in this study exhibit a largely linear separability pattern. This is consistent with the nature of the behavioral features designed, such as followers_to_following_ratio and word_count_description, which tend to show clear distributional differences between human and bot accounts without requiring complex nonlinear transformations.
4.3. Random Forest Classifier
Table 5 presents the results of the Random Forest classifier. This model achieved an average accuracy of
and an AUC of
, the highest value among all the models evaluated. The observed balance between precision and recall in both classes indicates stable classification, with low variance across folds. These results confirm the Random Forest’s ability to handle nonlinear interactions among features and maintain good generalization under cross-validation.
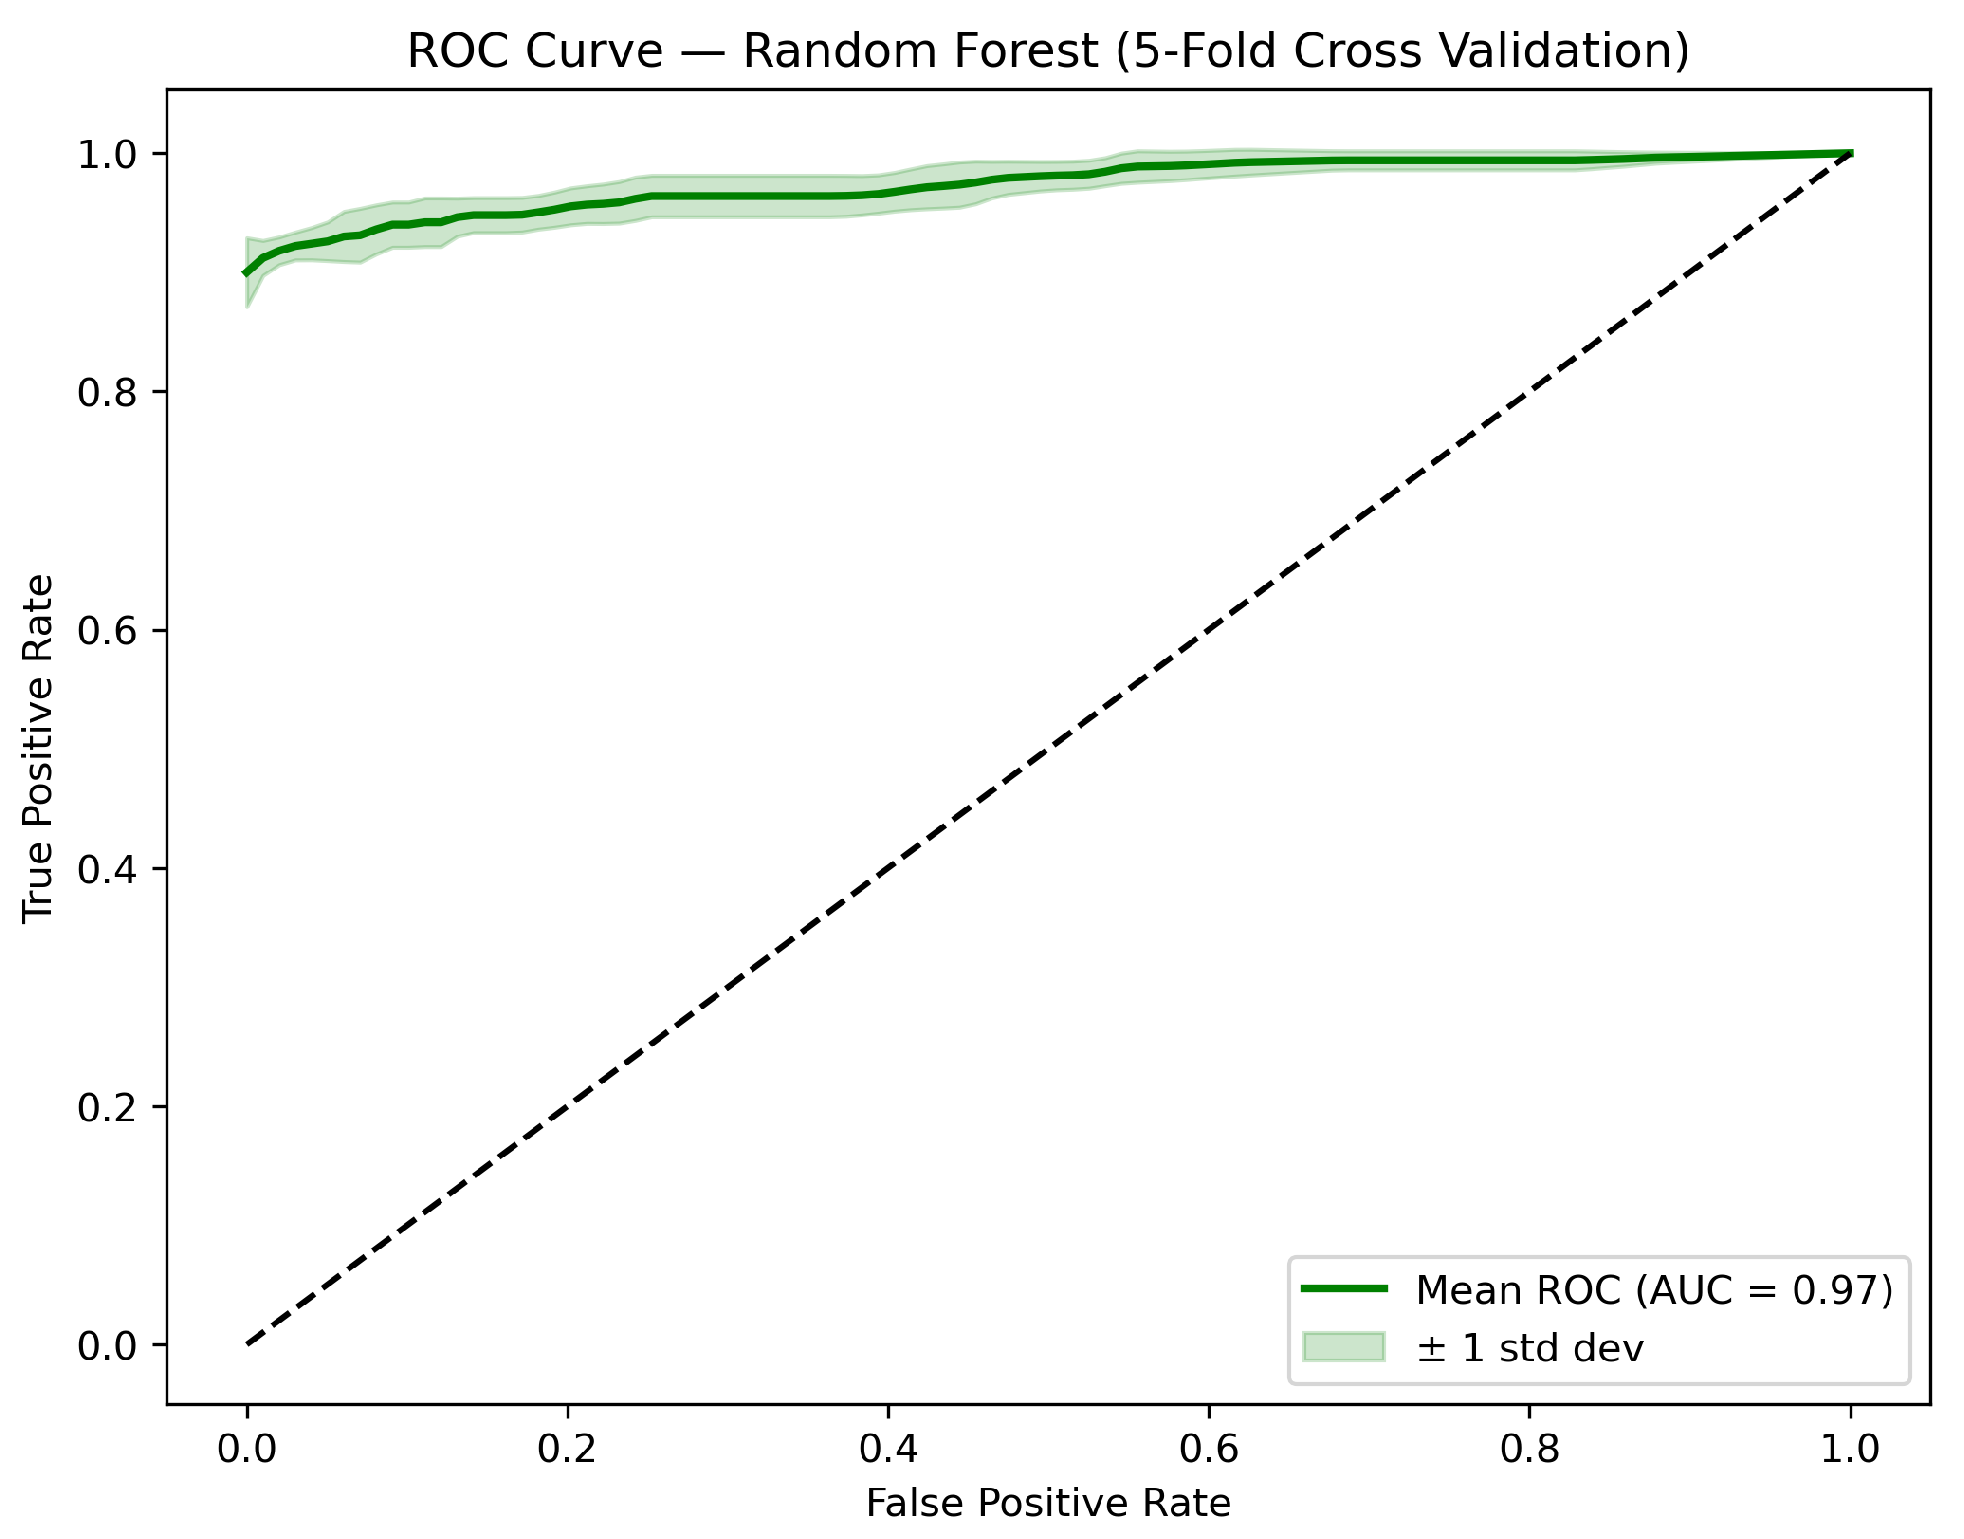
Unlike the neural network, the Random Forest exhibited perfectly symmetric precision and recall for both classes (0.920 and 0.980 respectively), suggesting a more balanced decision boundary. The highest AUC value among all models (0.974 ± 0.009) indicates superior discriminatory power, meaning the model maintains strong separation between classes across all possible classification thresholds. This is particularly relevant in bot detection scenarios where the operating threshold may need to be adjusted depending on the tolerance for false positives or false negatives.
4.4. Extreme Gradient Boosting Classifier
Table 6 shows the performance of the XGBoost model. The classifier achieved an average accuracy of
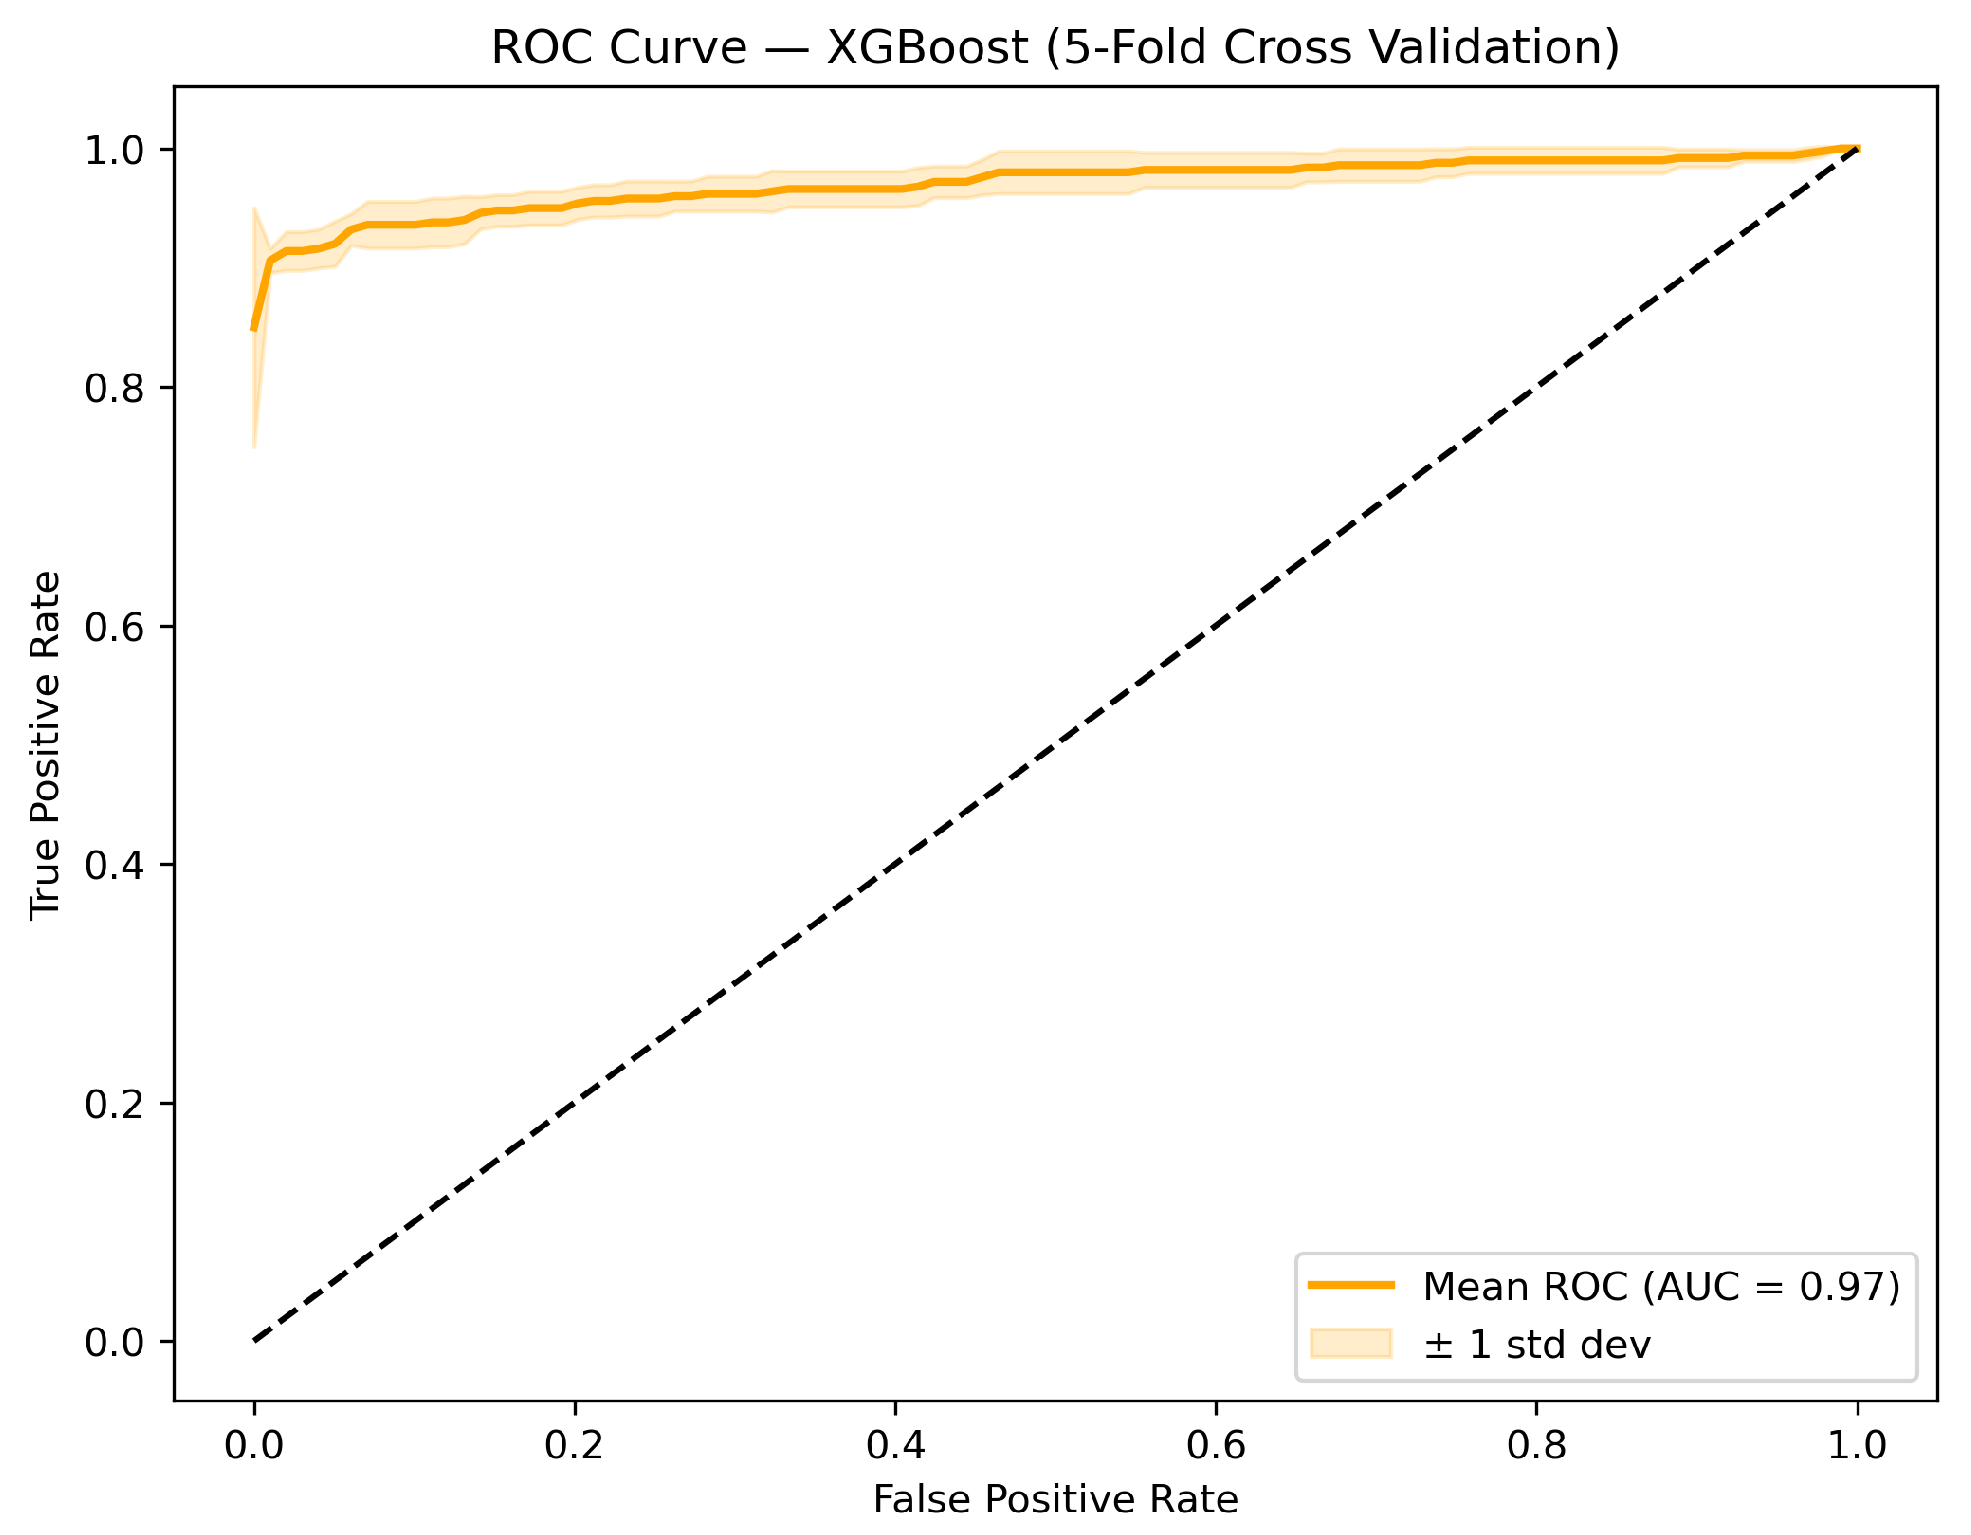
and an equivalent Macro F1 score, with an AUC of
. Although its performance was competitive, the model exhibited slightly higher variance across folds compared to the neural network and Random Forest.
This behavior suggests that, while XGBoost is effective for structured data, its performance may be more sensitive to the composition of the training subsets in this specific scenario.
The slightly higher variance of XGBoost across folds (±0.011 in accuracy vs ±0.006 for the neural network and Random Forest) may be attributed to its sensitivity to the specific composition of each training subset, a known characteristic of gradient boosting methods when applied to small balanced datasets. Despite this, the model achieved a competitive AUC of 0.970 ± 0.012, confirming its strong discriminatory capacity. The combination of high AUC with moderate variance suggests that XGBoost remains a reliable option when explainability through feature importance metrics is prioritized over stability.
These results suggest that feature engineering plays a more critical role than model complexity in the detection of social bots using profile-based data.
The strong performance observed across multiple models indicates that the selected features provide a highly discriminative representation of bot behavior.
4.5. ROC Curves
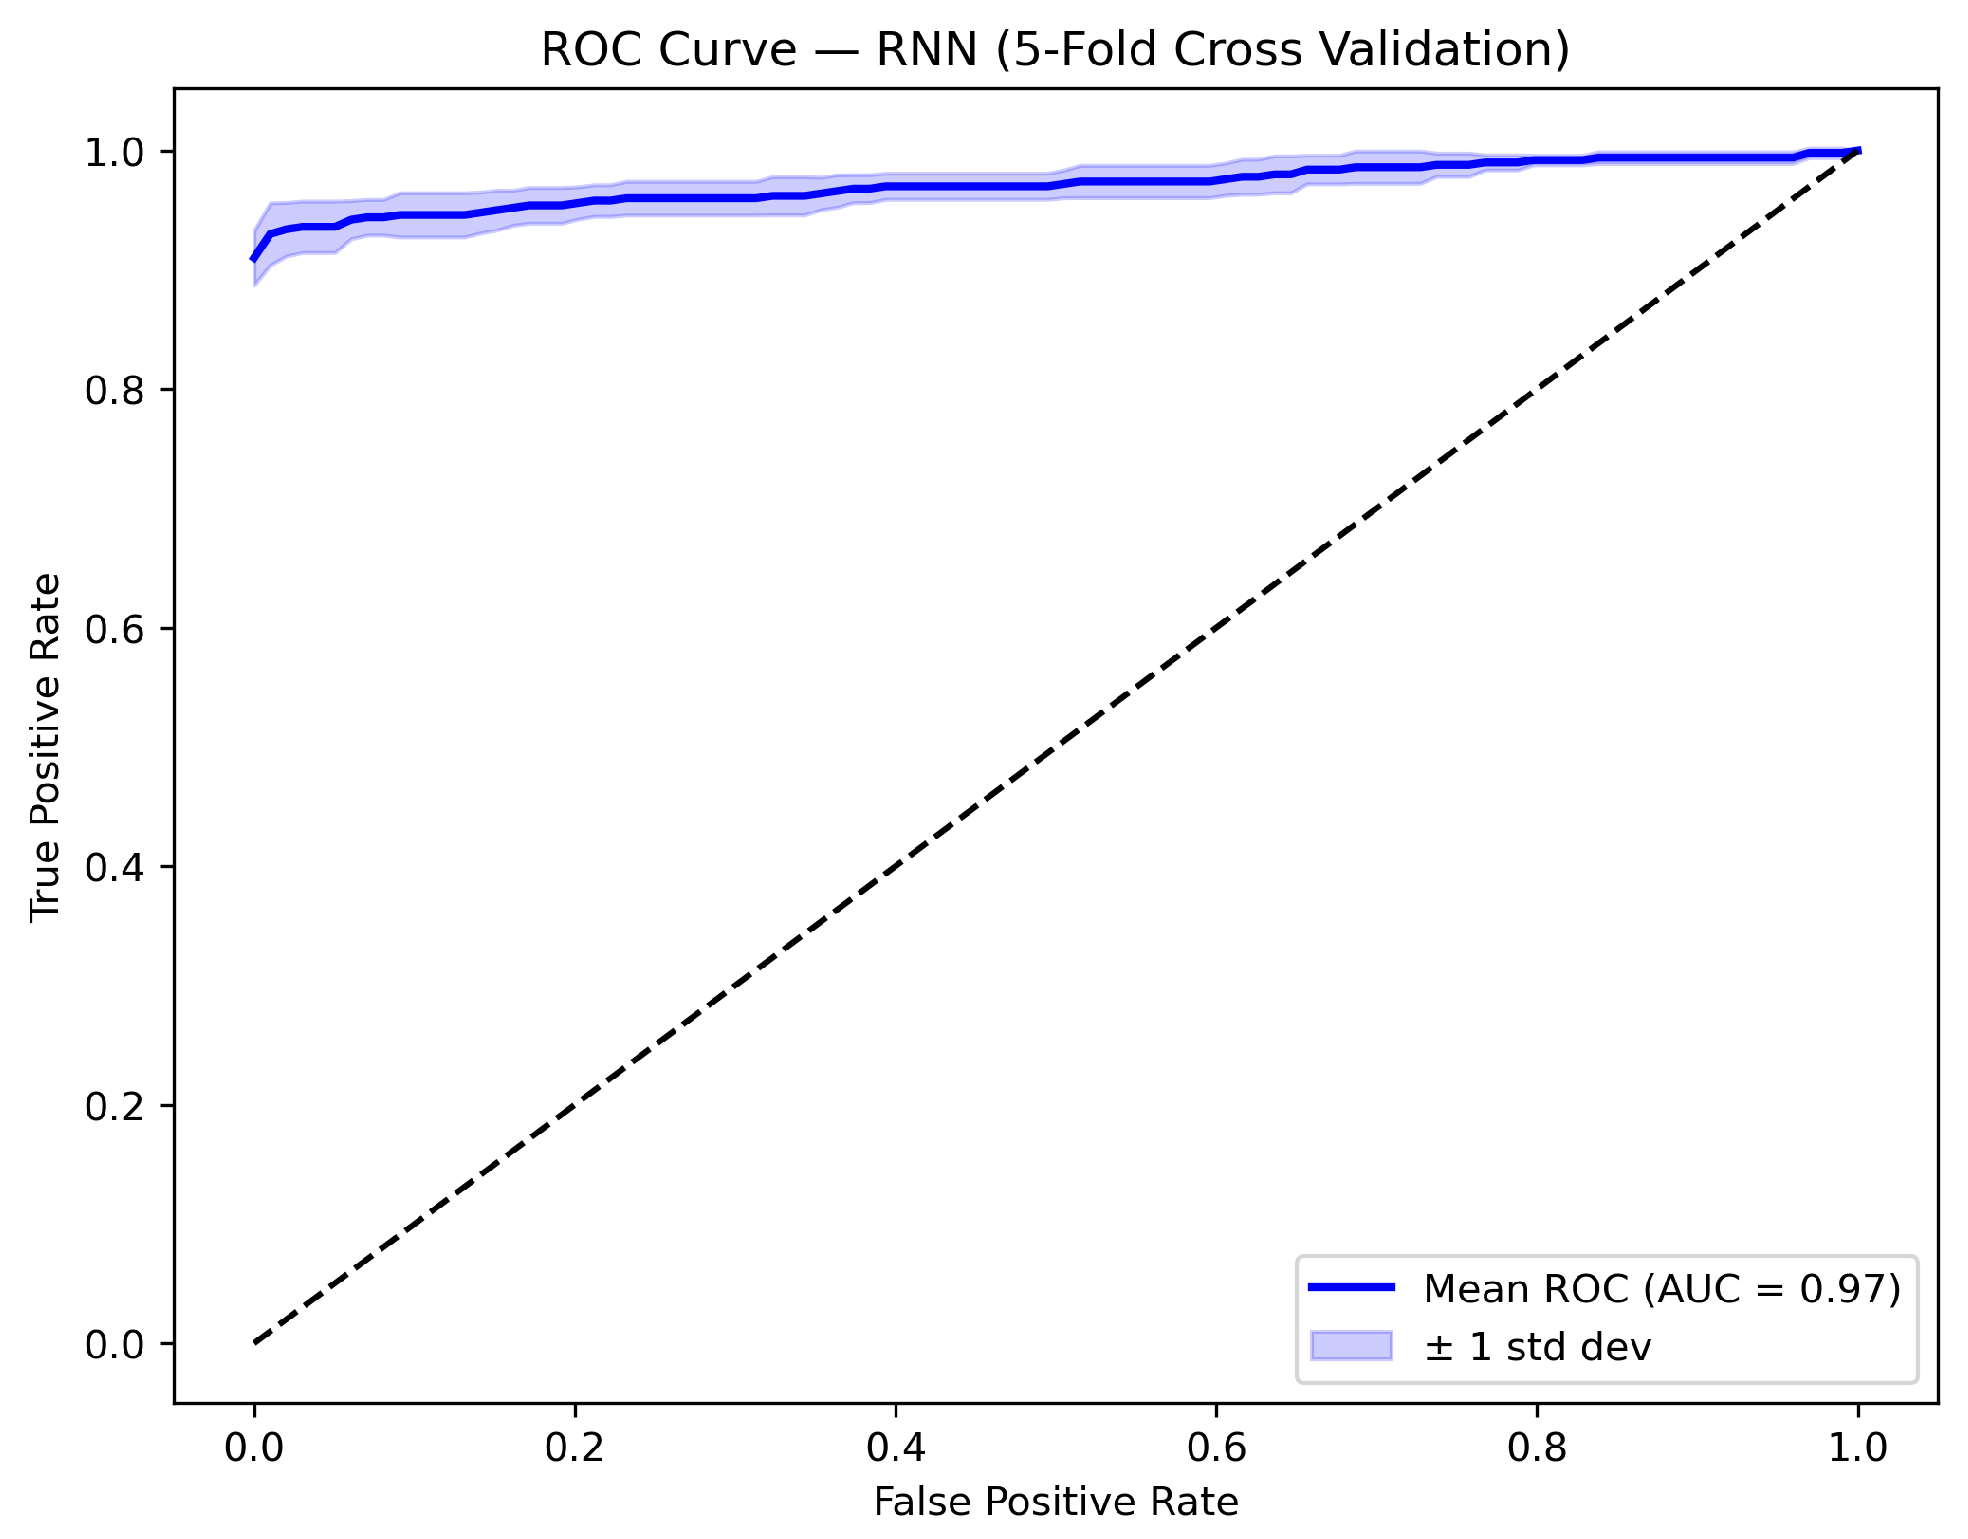
Figure 3,
Figure 4,
Figure 5 and
Figure 6 show the ROC curves for the evaluated models. The neural network and Random Forest models exhibit curves clustered near the top-left quadrant, reflecting high discriminatory power. The SVM with a linear kernel and the XGBoost model also show high AUC values, although with slight variations across folds. In contrast, the SVM’s polynomial and sigmoid kernels exhibit clearly inferior curves, which is consistent with their lower performance observed in global metrics. The analysis of ROC curves reinforces the quantitative results reported in the previous sections.
4.6. Explainability Results
This section presents the results of the interpretability analysis applied to the three most competitive models: Random Forest, XGBoost, and the linear kernel SVM. The analysis aims to identify which features contribute most significantly to the classification of social bots and human accounts.
4.6.1. Random Forest Feature Importance
Figure 7 presents the mean feature importance values derived from the Gini impurity criterion, averaged across the five cross-validation folds. The results indicate that
followers_count and
followers_to_following_ratio are the most discriminative features, followed by
creation_time and
tweet_count. In contrast,
credentials_null and
listed_count exhibit relatively low importance, suggesting that profile completeness alone is insufficient to distinguish automated accounts from human users. These results are consistent across folds, confirming the stability of the feature ranking under the stratified cross-validation scheme.
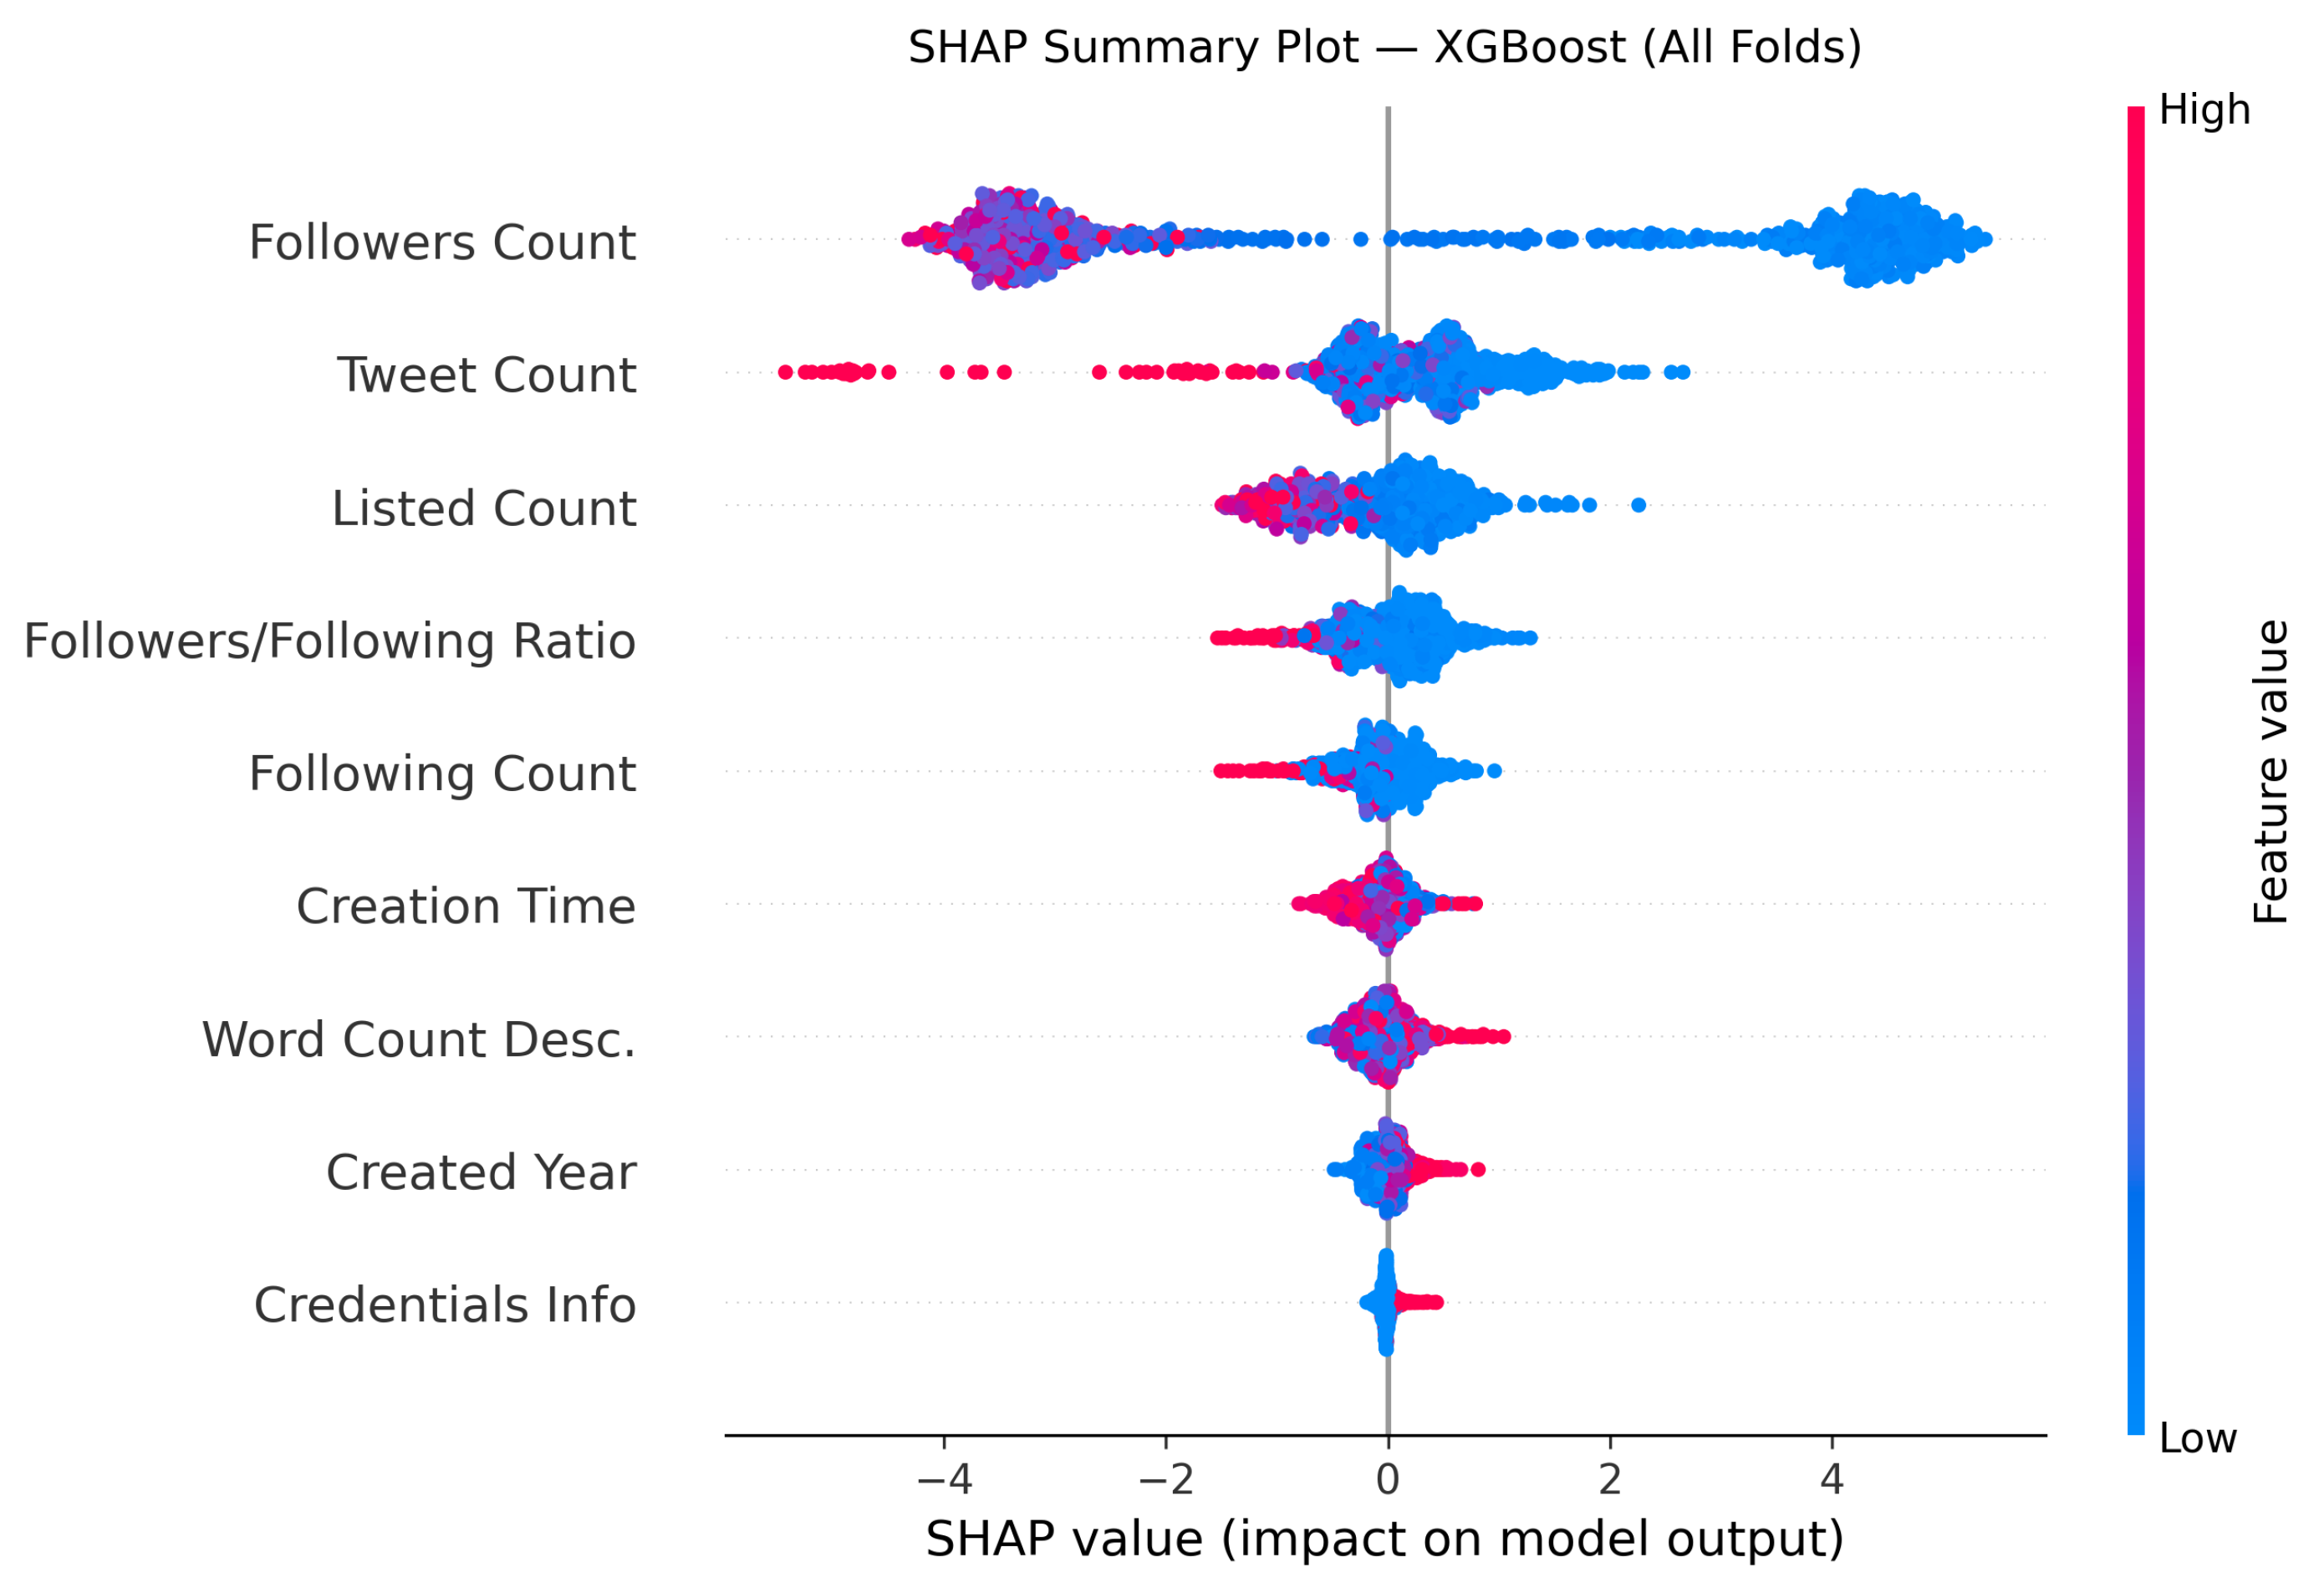
4.6.2. XGBoost SHAP Analysis
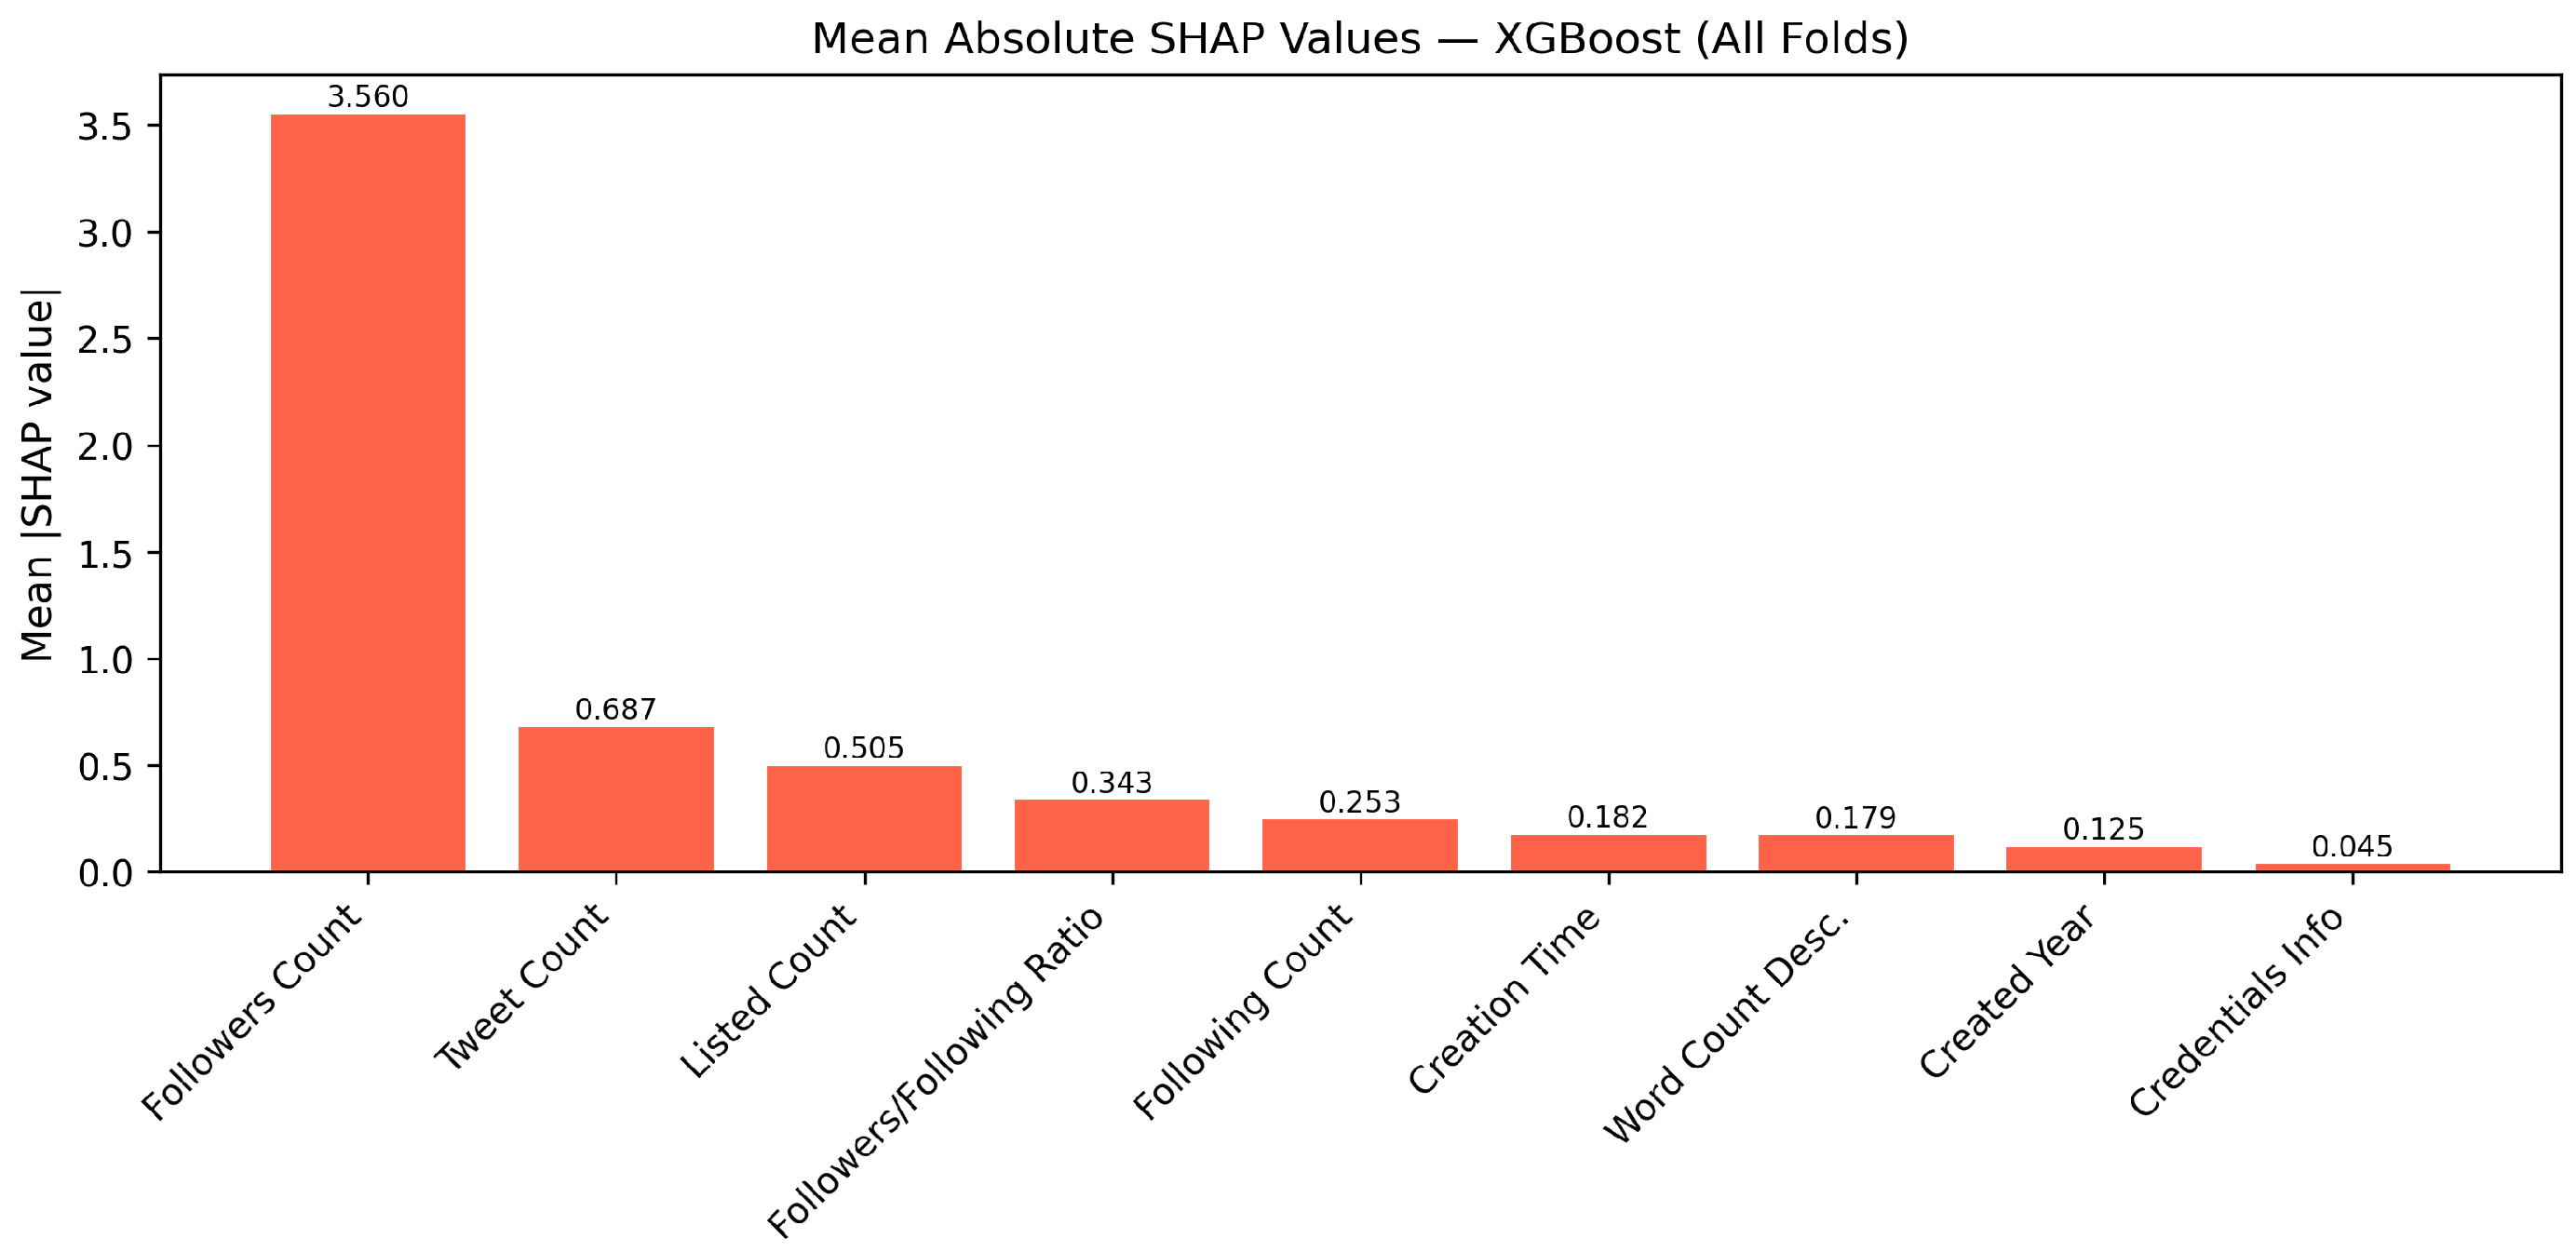
To provide a more theoretically grounded explanation of the XGBoost model’s decisions, SHAP (SHapley Additive exPlanations) values were computed for all validation instances across the five folds.
Figure 8 presents the mean absolute SHAP values per feature, confirming that
followers_count and
followers_to_following_ratio are the dominant predictors.
Figure 9 shows the SHAP summary plot, which additionally reveals the direction of each feature’s influence: high values of
followers_to_following_ratio push the model toward classifying an account as human, while low values of
word_count_description are strongly associated with bot classification. This is consistent with the known behavioral pattern of automated accounts, which typically have sparse or empty profile descriptions. Unlike simple feature importance metrics, SHAP values provide both global and instance-level explanations, offering a more complete picture of model behavior.
4.6.3. SVM Linear Kernel Coefficients
For the linear kernel SVM, interpretability is obtained directly from the coefficients of the decision hyperplane, averaged across the five folds.
Figure 10 shows the magnitude and sign of each coefficient. Positive coefficients indicate features that push the classification toward the bot class, while negative coefficients favor the human class. The results show that
following_count and
tweet_count have the largest positive influence on bot classification, whereas
followers_to_following_ratio is the strongest indicator of human accounts. This finding aligns with the known behavior of bot accounts, which tend to follow large numbers of users indiscriminately while accumulating few genuine followers.
The consistency observed across different explainability methods confirms the robustness of the selected features. In particular, followers_count and followers_to_following_ratio emerge as the most influential variables across all models. This agreement between model-specific and model-agnostic interpretability techniques provides strong evidence that the classification decisions are driven by meaningful and stable feature relationships.
4.6.4. Statistical Significance of Performance Differences
To assess whether the observed differences in accuracy among the evaluated models are statistically significant, pairwise Wilcoxon signed-rank tests were conducted on the per-fold accuracy scores obtained from the five-fold cross-validation process. (
Table 7) presents all pairwise comparisons among the four evaluated models (Neural Network, Random Forest, XGBoost, and Linear SVM) (
Table 7). The results indicate that no statistically significant differences were observed between any pair of models at the significance level
= 0.05. This finding suggests that all evaluated classifiers achieved statistically comparable predictive performance under the experimental conditions of this study. Consequently, model selection may be guided by factors such as interpretability, computational efficiency, robustness, and ease of deployment rather than by marginal differences in predictive accuracy alone.
Pairwise Wilcoxon signed-rank tests were conducted using the per-fold accuracy values obtained from the five-fold cross-validation process. This non-parametric test was selected due to the small sample size and the absence of normality assumptions.
The complete pairwise Wilcoxon signed-rank analysis, including all six possible pairwise comparisons among the four evaluated models, indicated that no statistically significant differences were found at a significance level of = 0.05, suggesting comparable performance across classifiers.
4.7. Overall Comparison Models
Table 8 summarizes the performance of all the evaluated models. In terms of accuracy, the neural network achieved the highest score, while Random Forest and linear SVM had the highest AUC values. XGBoost demonstrated competitive performance, albeit with greater variability. Overall, the results indicate that the evaluated models perform well in detecting social bots, with the neural network and Random Forest being the most stable options under the validation scheme used.
To assess whether these differences are statistically significant, pairwise Wilcoxon signed-rank tests were conducted using the per-fold accuracy scores obtained from cross-validation. The Wilcoxon signed-rank test was selected due to its suitability for comparing paired samples without assuming normality of the data distributions.
The results indicate that no statistically significant differences were found between the models at a significance level of = 0.05. This suggests that the observed differences in accuracy are not sufficient to conclude that any model consistently outperforms the others. Therefore, model selection should consider additional factors such as interpretability, computational efficiency, and ease of implementation, rather than relying solely on marginal accuracy differences. These findings suggest that feature engineering plays a more critical role than model complexity in this classification task.
5. Discussion
The results obtained through five-fold stratified cross-validation allow for a rigorous comparison of the performance of machine learning models applied to the detection of social bots. In particular, the feedforward neural network achieved the highest average accuracy (), followed by Random Forest (), SVM with a linear kernel (), and XGBoost (). These differences in performance, although moderate, reveal consistent trends that can be explained by the combination of model architecture, the quality of the features used, and the validation strategy employed.
Compared to previous work, the results obtained in this study outperform many approaches reported in the literature. Kouvela et al. [
20] achieved an accuracy of nearly 85% using Random Forest combined with crowdsourcing techniques applied to a dataset of Twitter accounts, relying primarily on metadata features without behavioral engineering. In contrast, the present study achieves 95.0% accuracy with Random Forest alone, suggesting that the incorporation of engineered behavioral features such as
followers_to_following_ratio and
word_count_description provides a substantial improvement over raw metadata. Martin-Gutierrez et al. [
21] reported accuracies of around 77% using hybrid CNN-Transformer architectures on Twitter data, highlighting that increased model complexity does not automatically translate into better performance when the underlying feature set is not sufficiently discriminative. More recently, Sanchez-Corcuera et al. [
18] applied deep learning for early bot detection in IEEE Transactions on Computational Social Systems, achieving strong results but requiring temporal sequences of user activity—a requirement that limits applicability in scenarios where only static profile data is available. The present study addresses this limitation by relying exclusively on static profile and behavioral features, achieving competitive performance with greater practical deployability.
While transformer-based methods leverage complex architectures and temporal or relational data, they typically require greater computational resources and data availability. In contrast, the proposed approach prioritizes interpretability and efficiency, demonstrating that competitive performance can be achieved using only static profile features.
One of the most significant findings of this study is the positive impact of feature engineering on model performance. Preliminary tests conducted with the original features showed limited performance, whereas the incorporation of engineered variables such as
Word_count_description,
Credentials_info,
MaxMinFollowing, and
followers_to_following_ratio—consistently improved classification metrics. This result is consistent with the findings reported by [
25], who demonstrated that enriching datasets with variables correlated with user behavior and account interactions significantly increases the discriminatory power of classification models. Their work on TwiBot-20 established that behavioral features capture patterns of automated activity that profile-only features cannot, a principle directly applied in the present study through the design of estimators such as
MaxMinFollowing and
credentials_null. Similarly, ref. [
24] recently confirmed on TwiBot-22 that multimodal feature combinations consistently outperform single-modality approaches, further validating the feature engineering strategy adopted here.
Furthermore, the outstanding performance of the linear kernel SVM reinforces the idea that simpler models can be highly competitive when well-defined discriminative variables are used. This behavior is consistent with the findings of [
22], who reported an accuracy of nearly 97% using logistic regression supported by highly discriminative features, underscoring that feature relevance may be more decisive than classifier complexity. This principle is further supported by the results of the present study, where the linear kernel SVM—one of the simplest classifiers evaluated—achieved 94.1% accuracy, outperforming more complex nonlinear kernels. Taken together, these findings suggest that investment in feature engineering yields greater returns than investment in model complexity for profile-based bot detection tasks.
In the case of Random Forest and XGBoost, both tree-based models demonstrated high discriminatory power, as reflected in AUC values close to 0.97. However, XGBoost exhibited greater variability across folds, suggesting a higher sensitivity to the composition of the training set. This behavior is consistent with findings from other studies indicating that gradient boosting methods, while powerful, may be more susceptible to data variations when working with small, balanced datasets.
From an interpretability perspective, the results support the use of a combined approach. While the neural network and XGBoost offer high predictive performance, models such as SVM with a linear kernel and Random Forest provide more accessible mechanisms for analyzing the relative contribution of features. This balance between performance and explainability is particularly relevant in contexts where bot detection has implications for security, content moderation, and behavioral analysis on social media.
Overall, the results of this study confirm that the effective detection of social bots depends largely on the quality, diversity, and representativeness of the features used, rather than on the adoption of highly complex architectures. The main contribution of this work lies in the combination of a systematic feature engineering process, a robust validation methodology, and a comprehensive comparison of different types of models, which enables the development of an accurate, stable, and interpretable detection system. This approach provides a solid foundation for the development of future social bot detection systems that are more reliable and generalizable. In addition to classical machine learning approaches, recent state-of-the-art methods based on graph neural networks, transformer architectures, and multimodal frameworks have demonstrated strong performance in social bot detection.
However, a direct experimental comparison with these methods on the same dataset was not conducted, as many of these approaches require additional data such as graph structures or temporal information. Instead, this study provides a comparative discussion based on reported results in the literature, highlighting differences in data requirements, model complexity, and interpretability.
The proposed approach is positioned as a lightweight and interpretable alternative that achieves competitive performance using only static profile and behavioral features.
This study presents several methodological limitations. First, the use of a reduced dataset of 1000 instances may limit the generalizability of the results. Second, the analysis relies exclusively on static profile and behavioral features, without incorporating tweet content, temporal patterns, or interaction-based information. Third, the study focuses on a single platform (Twitter/X) and a specific time period, which may not fully capture evolving bot behaviors, including those driven by recent advances in AI. Finally, the statistical significance analysis is based on a limited number of cross-validation folds, which may affect the robustness of the comparisons. Future work will address these limitations by extending the dataset, incorporating richer feature representations, and applying more extensive validation protocols.
6. Conclusions
This study presented a machine learning approach for detecting social bots on the Twitter/X platform, systematically integrating feature engineering, data balancing, and a comparative evaluation of different classification models. The results obtained through stratified cross-validation demonstrated that a feedforward neural network with an optimized architecture achieved the highest overall performance, followed by tree-based models and support vector machines with a linear kernel.
Beyond the performance of the classifiers, the findings highlight that the quality and representativeness of the designed features play a decisive role in the effectiveness of bot detection systems. The incorporation of behavioral, structural, and temporal variables allowed for the capture of relevant patterns of automated behavior, consistently contributing to the improvement of classification metrics across all evaluated models.
Likewise, the results confirm that moderately complex models, when supported by appropriate variable selection and a robust validation methodology, can match or surpass the performance of more complex architectures. This finding aligns with previous observations in the literature and reinforces the idea that model complexity alone is not a determining factor for effective social bot detection.
From a practical perspective, the proposed approach offers a favorable balance between accuracy, stability, and interpretability. While neural networks and ensemble methods provide high predictive power, models such as linear kernel SVM and Random Forest allow for the analysis of the relative contribution of features, which is particularly relevant in contexts where transparency and decision traceability are key aspects.
As future lines of work, we propose extending the evaluation to the entire dataset using synthetic oversampling techniques or class weighting schemes, as well as incorporating contextual and dynamic information, such as the textual content of tweets or the temporal evolution of interactions. These extensions will allow us to evaluate the generalization ability of the proposed approach in more complex scenarios that are closer to the real-world environment of social media.
Limitations
Despite the promising results obtained, this study presents several methodological limitations that should be acknowledged. First, the experimental evaluation was conducted on a subset of 1000 instances drawn from the TwiBot-22 dataset, which, while balanced and reproducible, may limit the generalizability of the findings to larger and more heterogeneous populations. The reduced dataset size was deliberately chosen to enable a controlled and fair comparison across models, but future work should evaluate the proposed approach on the complete dataset using synthetic oversampling techniques such as SMOTE [
30] or class weighting schemes.
Second, the feature set used in this study is based exclusively on static user profile attributes and behavioral estimators derived from metadata. Dynamic features such as the temporal evolution of posting activity, the textual content of tweets, or the structural properties of the social graph were not incorporated. These features have been shown to provide additional discriminative power in recent studies [
18,
24], and their inclusion represents a natural extension of the present work.
Third, the classification models evaluated in this study were trained and tested on data from a single platform (Twitter/X) and a single time period. The generalizability of the proposed approach to other social media platforms or to more recent bot populations which may exhibit different behavioral patterns due to advances in generative AI has not been assessed and remains an open research question.
Fourth, while the Wilcoxon signed-rank tests confirmed that performance differences among models are not statistically significant at the level, this result should be interpreted with caution given the relatively small number of cross-validation folds (k = 5), which limits the statistical power of the test.
These limitations highlight the trade-off between experimental control and real-world applicability, which remains a central challenge in social bot detection research.




 ,
,