Article

An Empirical Evaluation of Large Language Models Applying Software Architectural Patterns

by
Christos Hadjichristofi
1,*,
Michail Tsilimigkounakis
1,
Georgios Sotiropoulos
1 and
Vassilios Vescoukis
1,2,*
1
Software Engineering Laboratory, School of Electrical and Computer Engineering, National Technical University of Athens, 15773 Athens, Greece
2
School of Rural, Surveying and Geoinformatics Engineering, National Technical University of Athens, 15773 Athens, Greece
*
Authors to whom correspondence should be addressed.
AI 2026, 7(6), 195; https://doi.org/10.3390/ai7060195
Submission received: 18 March 2026 / Revised: 15 May 2026 / Accepted: 23 May 2026 / Published: 27 May 2026
(This article belongs to the Topic Applications of NLP, AI, and ML in Software Engineering)

Abstract

Beyond code generation, large language models (LLMs) are increasingly explored in software architectural tasks. However, it remains unclear to what extent LLMs can apply explicitly requested architectural patterns when provided with user-defined requirements. In this paper, we empirically evaluate the ability of multiple LLMs to generate specific architectural styles under controlled conditions. Models are prompted with specific requirements expressed in different ways and are instructed to generate architectures in four typical styles using the same single prompt and execution strategy. The authors assess the generated architectures with respect to specific evaluation criteria. The results show that, while LLMs can correctly apply simpler architectural patterns, performance decreases as architectural complexity and problem size increase. Model size and requirement representation appear to influence pattern adherence, whereas retrieval-augmented generation (RAG) produces mixed effects. The findings contribute empirical evidence regarding prompting strategies, requirement representations, RAG configurations, and diagram-as-code (DaC) representations for LLM-generated software architectures. The study also introduces a reusable experimental workflow intended to support future benchmarking and comparative evaluation in software architecture generation tasks.

1. Introduction

Software architecture defines the high-level structure of a system by organizing its components, their responsibilities, and their interactions [1,2]. Architectural patterns such as client–server, three-tier, model–view–controller (MVC), and microservices provide reusable solutions to recurring design problems and are widely adopted in industrial practice. Correctly applying such patterns requires interpreting requirements and translating them into coherent structural decisions that satisfy functional and non-functional constraints.
Recent advances in large language models (LLMs) have demonstrated strong capabilities in source code generation [3,4], documentation synthesis [5], and various software engineering tasks [6,7]. As a result, LLMs are increasingly being explored as assistants in higher-level design activities, including architectural modeling. While recent studies explore the use of LLMs for generating software design artifacts and architectural models from natural language prompts [8,9], systematic evaluation of their ability to correctly apply explicitly requested architectural patterns that satisfy specific user-provided requirements remains limited.
Understanding this capability is essential before LLMs can be trusted for more autonomous or complex architectural design tasks. In particular, it is important to evaluate whether LLMs can (i) adhere to the constraints of specific architectural patterns, (ii) achieve complete requirement coverage, and (iii) produce structurally coherent designs under different prompting and model configurations.
In this paper, we empirically evaluate the ability of LLMs to apply explicitly requested software architectural patterns without addressing the underlying mechanisms within LLMs. We conduct controlled experiments in which multiple LLMs are prompted with problem descriptions expressed at different levels of structure, ranging from semi-structured requirement lists to complete software requirement specification (SRS) documents. The models are instructed to generate architectures using a single self-contained prompt executed once to ensure a controlled and directly comparable evaluation setting under fixed prompting conditions. Variability across repeated executions was not investigated in this study and is discussed as a limitation in Section 5.
The authors evaluate the generated architectures with respect to structural correctness, requirement coverage, and adherence to the requested architectural patterns in order to assess how model size, model family, requirement representation, and retrieval-augmented generation (RAG) influence architectural pattern application.
To guide our investigation, we address the following research questions:
  • To what extent can LLMs correctly apply explicitly requested software architectural patterns by creating specific architectural diagrams?
  • How does requirement representation affect the ability of LLMs to apply architectural patterns?
  • How does RAG affect the quality of LLM-generated diagrams?
  • Can LLMs calculate reliable quantitative metrics regarding the diagrams they generate?

2. Related Work

The automatic generation of software design models from textual descriptions has gained significant attention in recent years, driven by advances in LLMs. Earlier attempts relied largely on NLP pipelines supported by heuristic rules or ontology-based mappings, which enabled partial automation but required highly structured input and frequent manual intervention. These methods commonly struggled with ambiguity in requirement statements, resulting in incomplete or inconsistent models. Recent work therefore examines whether modern LLMs can interpret natural-language requirements and generate structured representations that approximate architectural intent.
Eisenreich, Speth, and Wagner proposed a structured six-step process for deriving software architectures from textual requirements [10]. Their framework begins with automatically generating a domain model and use-case scenarios, followed by manual refinement and the automatic derivation and evaluation of multiple architecture candidates. Their exploratory analysis using LLaMA2-70B and GPT-3.5 showed that, although LLMs can identify domain concepts, they often misunderstand prompts and struggle to produce correct structured representations, such as PlantUML, highlighting the sensitivity of such approaches to prompt formulation and the continued need for human supervision.
At the level of UML extraction and diagram generation, several studies report similar limitations. Yang and Sahraoui [11] proposed a pipeline combining sentence classification with pattern-based fragment assembly and observed substantial semantic loss when transforming natural-language specifications into structured models. Subsequent empirical evaluations of LLM-generated UML artifacts further highlight these challenges. Cámara et al. [12] identified scalability issues and semantic inaccuracies in class diagrams enriched with OCL constraints. De Bari [13] found that, despite comparable syntactic quality, semantic errors were significantly more frequent in LLM-generated diagrams than in human-produced ones. Similar findings were reported by Al-Ahmad et al. [14], who observed moderate correctness levels and variability across different UML diagram types in student-centered evaluations, and by Krishnan et al. [15], who identified frequent syntactic and semantic errors, including incorrect relationship mappings and hallucinated elements, in the context of automated use-case diagram generation. Collectively, these results indicate that, while LLMs can assist in diagram generation, semantic reliability remains a persistent challenge.
Beyond diagram generation, recent work has explored whether LLMs can support architectural reasoning. Dhar et al. [16] investigated the automatic generation of architectural design decisions and found that GPT-4 can produce coherent decisions but still falls short of human quality, while smaller fine-tuned models achieve comparable performance. Schindler and Rausch [17] addressed the inverse task of inferring architectural rules from code-level dependencies, showing that symbolic learners outperform LLMs, which tend to generate syntactically correct but semantically inconsistent rules when contextual cues are limited.
Recent studies have begun examining the use of LLMs in software architecture practice more broadly. Jahić and Sami [18] report that, although LLMs are increasingly adopted for architectural tasks, practitioners note recurring issues, such as non-reproducible outputs, shallow architectural reasoning, hallucinations, and limited ability to justify design choices, indicating that current models offer only partial support for architectural design activities. Ferrari and Spoletini [19], focusing on requirement engineering, warn that LLM-generated artifacts raise concerns of correctness and trustworthiness unless supported by formal specification and verification techniques. Although situated at the RE level, their arguments highlight the broader need for a careful evaluation of LLM-generated technical artifacts, including architectural models.
At the time of writing, research on the use of LLMs in software architecture is still developing. A recent systematic literature review identifies a relatively small number of studies addressing architectural tasks, such as design decision support, pattern detection, and architecture generation from requirements [20]. While these works explore the potential of LLMs, they have different takes in the architectural tasks they address, as well as in how their results are evaluated, which limits systematic comparison across models and approaches.
When it comes to comparing LLM performance, although benchmarking frameworks are well established for code generation, they remain underdeveloped for software architecture. Recent studies highlight that architectural tasks are under-specified and difficult to compare across models due to the absence of consistent evaluation protocols [21]. In response, recent work has begun to introduce dedicated benchmarks and requirement datasets for architecture-related tasks [21,22]; however, these efforts are still limited in scope and do not yet constitute a widely accepted standard for systematic evaluation. Furthermore, evaluating software architecture and related automation remains inherently challenging as it often relies on the subjective judgment of stakeholders and context-dependent assessment rather than strictly objective criteria [23].
These limitations amplify the absence of a generally accepted benchmark for the systematic comparison of LLMs and prompting approaches in software architecture generation; more specifically:
  • There is limited empirical evidence on how different requirement representations influence the ability of LLMs to correctly apply architectural patterns.
  • There is no consensus on the most appropriate representation of generated architectures, whether as diagram-as-code (DaC), images, XML-based formats, or architecture-as-code approaches.
  • There is no established set of qualitative and quantitative evaluation dimensions for assessing generated architectures.
  • There is no commonly adopted dataset or benchmark that enables reproducible comparison of LLMs and prompting strategies across architectural problems of varying complexity.
In this context, the present study examines how LLMs transform textual requirements into architectural structures across varying prompt formats and complexity levels. Unlike prior work that primarily evaluates diagrammatic quality or artifact-level correctness, this study focuses on the controlled application of explicitly requested architectural patterns. We examine whether LLM outputs adhere to defined structural constraints, apply the intended architectural logic, and satisfy user-provided functional and non-functional requirements across varying input representations and model configurations. This work contributes to addressing the identified gaps in the following ways:
  • It investigates prompting strategies using alternative representations of requirements, including both structured requirement descriptions and RAG, in order to assess their impact on architectural pattern application.
  • It demonstrates the suitability of DaC for representing the generated architectures, enabling structured and consistent outputs.
  • It investigates the definition and application of qualitative and quantitative criteria for the systematic evaluation of generated architectures.
  • It proposes a reusable experimental workflow for systematically investigating how different requirement representations, model configurations, and retrieval settings influence LLM-generated software architectures.
This work does not introduce a finalized benchmark suite for software architecture generation. Instead, the reusable empirical workflow and the results of the experiments executed are intended to support future benchmarking efforts and reproducible comparative studies in this emerging area.

3. Experimental Design

Our experimental investigation was organized as a two-phase study on the ability of LLMs to generate widely adopted software architectures, represented as UML class diagrams, that conform to predefined architectural patterns. Phase 1 examined three common architectural styles of increasing complexity in the context of a small “toy” application, while Phase 2 focused on a more complex architecture for a modular application intended for deployment as a software-as-a-service system.
Given that architectural patterns may be interpreted differently across practitioners, this study adopts a simplified and operational interpretation of each pattern for evaluation purposes. In the client–server pattern, data management is assigned to the server, while business logic is either concentrated on the client (thick client) or partially delegated to the server (thin client with application services). The three-tier architecture separates responsibilities into presentation, business logic, and data layers, with no direct interaction between the presentation and data layers and no business logic executed in the presentation layer. In the MVC pattern, the model is responsible for business logic and data management, the view for presentation, and the controller for mediating interactions between them. Finally, the microservices pattern distributes functionality across independent services, each responsible for its own logic and data, communicating through well-defined interfaces, often involving asynchronous interactions and coordination mechanisms. These interpretations are consistent with commonly described forms of the respective patterns in the literature and are used here to provide a consistent basis for evaluating generated architectures.
In all cases, the same single self-contained prompt was used. The prompt was not iteratively refined, no corrective feedback was provided, and was executed once. The rationale for taking this approach is summarized as follows:
  • Comparability: Interactive guidance, prompt engineering, or any other technique that would result in a per-experiment multi-step dialog with the LLM would limit the comparability of each model’s ability to interpret a fixed problem specification and produce an architectural design.
  • Controlled stochastic variability: Repeated executions of the same prompt may generate different outputs due to the stochastic behavior of LLMs. Analyzing such variability would require repeated sampling and statistical aggregation procedures across multiple runs, introducing an additional experimental dimension beyond the scope of the present study.
  • Scope of investigation: Studying variability across repeated executions requires a different experimental setup based on repeated sampling and statistical analysis of established quantitative measures to assess generated outputs. It also introduces additional design considerations, such as the number of repetitions and execution conditions (e.g., whether executions are performed within the same interaction context or across independent runs), which can significantly influence the results and is out of the scope of this work.
This strategy ensured that all the executions were fully automated and directly comparable, allowing us to examine how different inputs and model configurations impact the quality of generated architectures when provided with the same information.
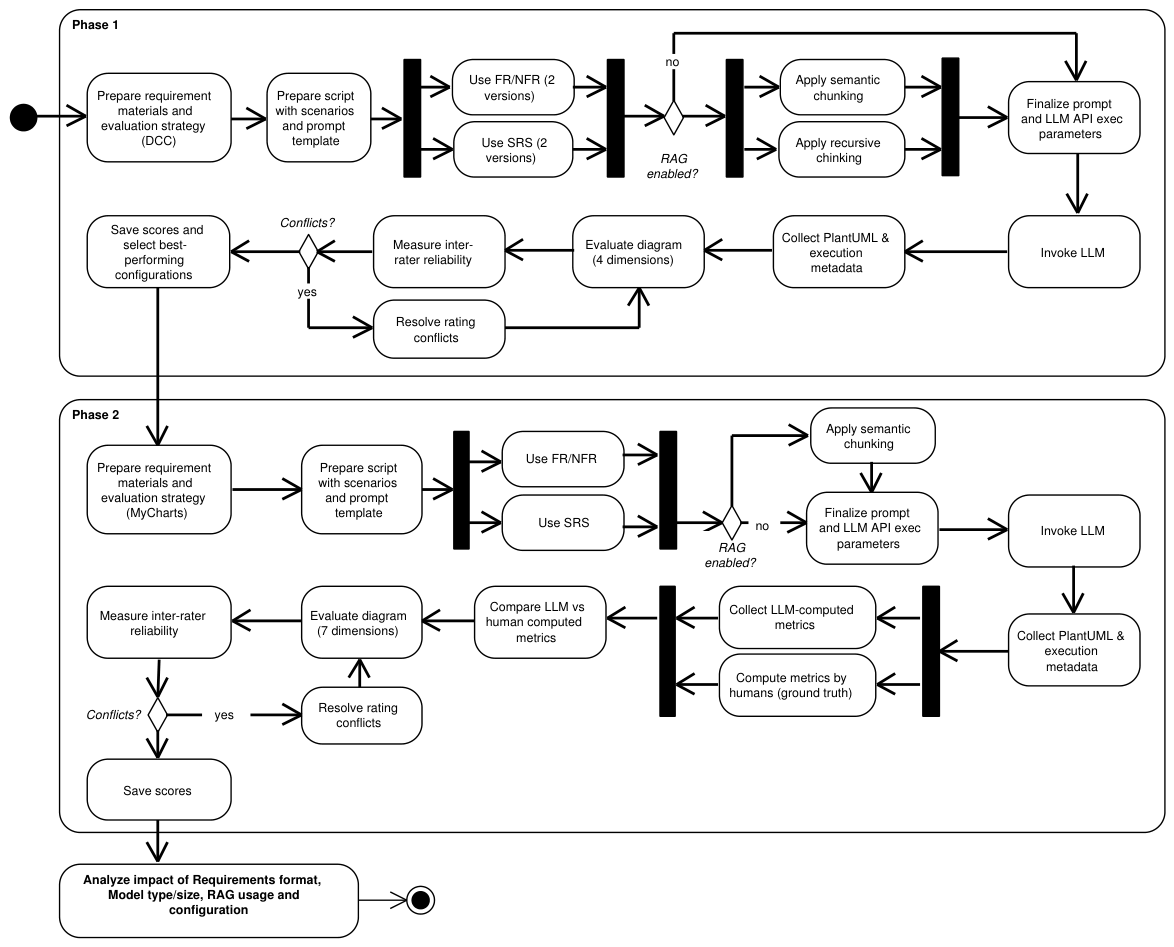
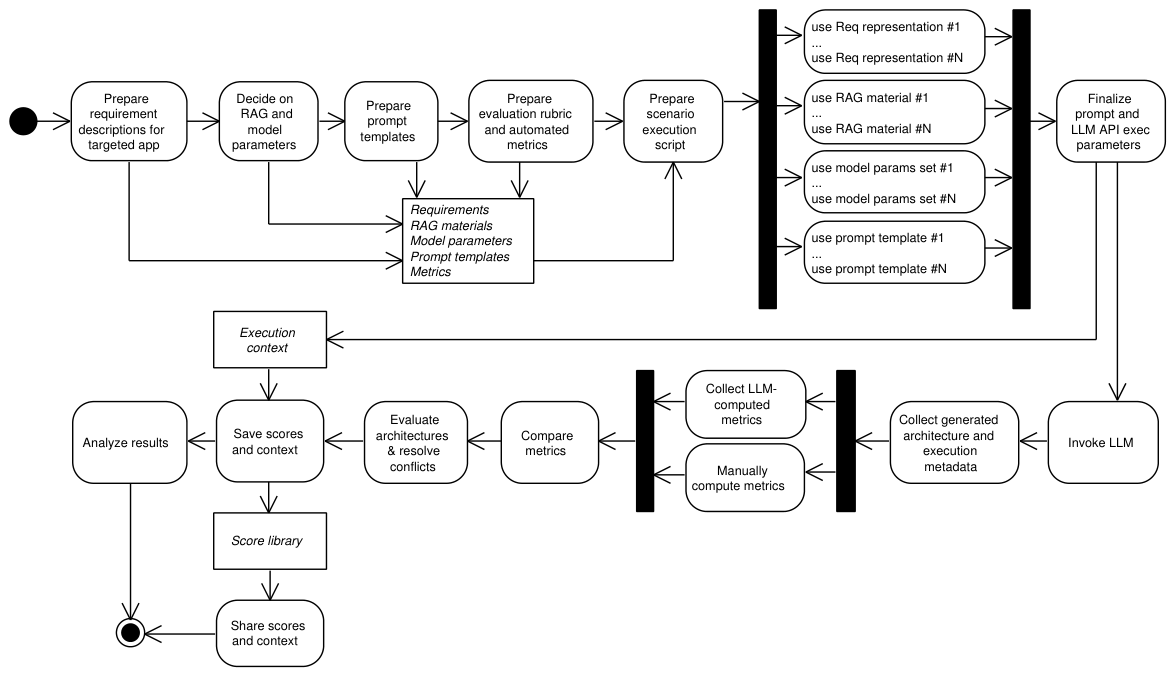
An overview of the experimental design and workflow is depicted in Figure 1 and analyzed in Section 3.2 and Section 3.3. The two experimental phases mentioned above follow a similar structure: requirements and prompt templates are prepared, experimental configurations are set, LLMs generate architectures, and the resulting outputs are evaluated. When RAG is enabled, retrieved architectural context is incorporated into the prompt before generation. The evaluation uses the rubric described in Section 3.4, with inter-rater agreement measured to assess consistency. In Phase 2, the workflow is extended to include the computation and comparison of architectural metrics, while RAG only uses semantic chunking. The main experimental variables are summarized as follows:
  • Requirement format: functional and non-functional requirements expressed either as textual lists (two variants) or as an SRS document, also in two variants, as discussed below.
  • Model type and size: locally executed models with varying numbers of parameters, as well as publicly available commercial models.
  • Use of RAG: enabled or disabled.
  • RAG source material: architectural reference material obtained either from academic textbooks or curated web-based descriptions of architectural patterns.
  • Embedding and retrieval configuration: embedding model, chunking strategy, and retrieval parameters used in the RAG pipeline.
A key question was the representation of architectures that LLMs were tasked to generate. ISO/IEC/IEEE 42010:2022 [1] specifies requirements for an architecture description framework, an architecture description language, architecture viewpoints and model kinds for architecture descriptions without specifying any format for recording the architecture description itself. UML is a standardized notation for representing, at any level of abstraction, all static and dynamic aspects of software systems, with large space for interpretations and high expressive power. The C4 model [24] uses predefined abstraction levels, often used to represent high-level architectures that can be communicated to both technical and non-technical users. UML has been around since the early 90s, is more widely adopted, and, even if practitioners do not use it extensively, it remains the main standardized reference for representing software systems.
Working in uncharted territory, we chose to ask LLMs to focus on the structural representation of architectures using UML diagrams that contain the components that constitute a software system, with their responsibilities regarding data and operations, expressed at the level of detail consistent with the requirement description that would be provided as input; except for the static structure, this representation also contains semantics regarding the dynamic aspects of an architecture in terms of responsibilities and collaboration without the details available in UML communication and sequence diagrams. In terms of abstraction, this would be equivalent to the “component diagram” of the C4 model. A UML representation of this would be a component diagram.
To instruct LLMs to generate architectures in a structured and machine-readable form, we requested the diagrams in DaC format. After experimenting with several such formats, we selected PlantUML as a more mature text-based representation of such diagrams, which expresses UML using a concise textual syntax that can be generated directly by language models and rendered into a graphical representation using open-source tools. Compared to XML-based UML formats, such as XMI, which supports the full expression power of UML, PlantUML provides a simpler textual representation that is easier for LLMs to generate and for researchers to inspect. At the same time, compared to other text-based diagram notations, such as Mermaid, PlantUML offers broader UML support and a more mature ecosystem of tools and documentation. UML class diagrams were selected as the architectural representation since PlantUML does not offer adequate support for the more generic UML component diagrams, which would be the expected representation of architectures, as discussed above. Still, class diagrams are suitable for this investigation as they provide a way of describing the structural organization of software systems, with semantics for roles, responsibilities, and relationships between classes, which, in our context, may represent any kind of component. Intentionally, we did not consider asking LLMs to produce diagrams in the form of images.
All materials used in the experiments, including prompt templates, requirement documents, RAG sources, and all generated outputs (PlantUML diagrams and metadata), are publicly available in an online repository to support reproducibility (https://github.com/ntua/ai4softwarearch/tree/main, accessed on 30 April 2026).

3.1. Execution of Experiments

Local models were executed through the Ollama platform, which allows LLMs to run locally on the experimental hardware. A Python 3-based pipeline implemented with LangChain was used to construct prompts, invoke models, and optionally integrate RAG. When RAG was enabled, requirement documents and reference materials were first segmented into textual chunks, from which vector embeddings were generated and stored in the Chroma vector database. These embeddings were then used to retrieve relevant context for each prompt according to a consistent retrieval strategy. While the overall retrieval pipeline remained consistent across experiments, certain configuration parameters, such as chunking strategy, were explored during Phase 1 and subsequently fixed for Phase 2, which included the values that reflect the best results. All experimental scenarios were defined in a table, where each row represented a single scenario, defined by the architectural pattern, the requirement materials, the prompt template, the model configuration (including RAG settings and embedding model), and the output path for generated artifacts. A Python script iterated over this table to automatically execute all scenarios, log execution metadata, and store the raw LLM responses, including the generated PlantUML diagrams.

3.2. Phase 1: Dummy Coordinate Converter

Phase 1 experiments asked LLMs to produce the architecture of “Dummy Coordinate Converter (DCC)” [25], a small application that manages point coordinates in Cartesian and polar form. DCC supports conversion, storage, retrieval, modification, and deletion of points. The system is intentionally simple to allow the experiments to focus on how LLMs respond to variations in requirement representation and architectural pattern selection. Before running the experiments, we implemented DCC in Java using the same architectural patterns (client–server, 3-tier, and MVC) and produced the corresponding UML class diagrams. These diagrams served as reference material. Exact replication by the LLMs was not required; however, the generated architectures were expected to adhere to the primary responsibilities and structural rules associated with each architectural pattern.
For the requirement representations, we prepared two sets of functional requirements (FRs) and two sets of non-functional requirements (NFRs) describing the same system at different levels of granularity. The first set (FR1) is user-oriented and grouped by high-level features, such as creation, storage, and deletion, with internal logic left implicit. The second set (FR2) is implementation-oriented and organized by logic, data operations, and user interactions, with explicit descriptions of operations, conversion steps, and display updates. For NFRs, the first set specifies basic technology choices, while the second introduces explicit object-oriented design guidelines. We paired FR1 with NFR1 and FR2 with NFR2 to form two requirement bundles with different levels of structural detail.
To study the effect of richer specification documents, we also prepared two variants of an SRS. The concise variant (SRS1) covers the system scope and main use cases, while SRS2 follows the structure recommended by IEEE 29148 [26] standard and additionally includes business context, user roles, constraints, suggested technologies, and assumptions. Both SRS versions include supporting PlantUML diagrams. In all cases, the surrounding prompt structure remained fixed so that differences in outputs could be attributed only to the requirement representation, model configuration, and model behavior.
A prompt template was used for the DCC experiments (DCC Prompt template with FR/NFR (https://github.com/ntua/ai4softwarearch/tree/main/DCC/fr-nfr/data/prompts/prompt1.txt, accessed on 30 April 2026); DCC Prompt template with SRS (https://github.com/ntua/ai4softwarearch/tree/main/DCC/srs/data/prompts/prompt_plantuml.txt, accessed on 30 April 2026)) to specify the task, the target architectural pattern, the system description with either FR/NFR or SRS content, and explicit instructions for producing architectures as UML class diagrams in PlantUML, including attributes, methods, associations, and basic package structure. The prompt remained unchanged across runs.
We evaluated a set of local and online LLMs with different parameter counts. Local models, hosted via Ollama and quantized to Q4_0 where applicable, included Llama 3.1 (8 B), DeepSeek-R1 (70 B), Command-R, Gemma2 (27 B), Mixtral (8 × 7 B), and Phi-3 Medium (128 K). Online models included Claude Sonnet 3.7, DeepSeek-R1, Gemini 2.0 Flash, GPT-4o, and several variants of OpenAI o-series models. For RAG experiments, we used two embedding models: nomic-embed-text-v1.5 and text-embedding-3-large. Three RAG configurations were used in the DCC phase: (1) an academic source derived from the architecture chapters of Sommerville’s software engineering textbook [2], (2) the same material split into pattern-specific files designed to emphasize the requested architecture, and (3) a composite reference document constructed from curated web-based descriptions of MVC, 3-tier, and client–server architectures obtained from practitioner-oriented sources.
During corpus preprocessing, we utilized two alternative chunking strategies. The first is a recursive character-based chunking approach, which uses hierarchical splitting based on typical textual separators (paragraphs, line breaks, and spaces). The splitter attempts to preserve natural text boundaries by first segmenting at higher-level separators and recursively refining splits only when resulting segments exceed a predefined maximum chunk size. The second strategy is semantic chunking, where chunk boundaries are determined dynamically based on embedding similarity using a percentile-based breakpoint threshold to group semantically coherent text spans. This method applies the same embedding model used during retrieval to ensure alignment between chunk formation and similarity search. At query time, the user requirement prompt was used as the retrieval query against the Chroma vector store. For each scenario, the pipeline retrieved the top five most similar chunks using Chroma’s similarity_search_with_score function. The retrieved chunks were concatenated using an explicit separator and inserted into the prompt before the actual generation task so that the model first received the architectural context and then the requirement-specific question. The prompt instructed the model to use the retrieved context as supporting information, along with its own architectural knowledge. For recursive character-based chunking, the maximum chunk size was set through the experimental configuration, with a fixed overlap of 100 characters between consecutive chunks. For semantic chunking, implemented using LangChain’s SemanticChunker, chunk boundaries were not fixed by length; instead, they were determined using embedding-based similarity with the library’s default percentile-based breakpoint threshold. Thus, both chunking methods used the same top-k retrieval setting (k = 5) but differed in how candidate text units were constructed before indexing.
For each architectural pattern, we varied the requirement bundle, model, RAG configuration, and embedding choice, resulting in approximately five hundred experimental scenarios. Each generated diagram was subsequently evaluated following the procedure described in Section 3.4. All materials used in the RAG corpus are archived in the online replication package.

3.3. Phase 2: MyCharts App

Phase 2 extended the study to a more complex, yet still experimental, software app, MyCharts [27], a web-based service that allows non-expert users to create, manage, and download charts in different formats. The application includes multiple modules and data flows, making it suitable for architectural design using a microservice pattern. Before conducting the experiments, we designed a reference microservice architecture based on established microservice design principles. A corresponding UML class diagram was created to serve as a reference during the evaluation process. Exact replication by the LLMs was not required; instead, the reference architecture was used to assess whether the generated diagrams respected key structural properties of microservice systems, such as service decomposition, data ownership, and inter-service communication.
As in Phase 1, we used both FR/NFR requirement bundles and a complete SRS document as inputs. The FR/NFR inputs describe system functionality, inter-service communication, and deployment constraints in list form, while the SRS provides a consolidated specification including functional behavior, non-functional requirements, and contextual constraints. Equivalent prompt templates were used for the two requirement representations (MyCharts Prompt template with FR/NFR (https://github.com/ntua/ai4softwarearch/tree/main/MyCharts/fr-nfr/data/prompts/prompt_plantuml.txt, accessed on 30 April 2026); MyCharts Prompt template with SRS (https://github.com/ntua/ai4softwarearch/tree/main/MyCharts/srs/data/prompts/prompt_plantuml.txt, accessed on 30 April 2026)). Both templates explicitly required a microservice architecture, summarized the MyCharts system, provided design guidelines, such as loose coupling and independent deployment, and requested UML class diagrams in PlantUML format. In addition to generating architectural diagrams, the models were asked to compute a set of quantitative architecture metrics derived from their own diagrams. The rationale was that, since the architecture was generated by the models themselves, computing structural metrics from that representation should be straightforward. These metrics are described in Section 3.5.
Based on the results of Phase 1, the model set for Phase 2 was restricted to configurations that demonstrated stronger architectural performance. The local models included larger variants, such as Llama 3.3, DeepSeek-R1 (70 B), Gemma2 (27 B), Mixtral (8 × 22 B), and a smaller Mistral model, all quantized to Q4_0. The online models included current at the time versions of Claude Sonnet 3.7, DeepSeek-R1, Gemini 2.0 Flash, GPT-4o, several OpenAI o-series models, a hosted Mistral model, and Grok.
For RAG, we used two focused sources on microservice architecture patterns: a textbook chapter by Richardson [28], which provides conceptual and pattern-level guidance, and a practitioner-oriented book by Malhotra [29], which summarizes practical design rules. These materials were embedded and retrieved using the same Chroma-based pipeline described in Phase 1. Based on the results of Phase 1, the chunking configuration for Phase 2 was restricted to the semantic chunking approach as it was observed to provide more coherent retrieval context compared to recursive character-based splitting. Experimental scenarios were constructed by varying the requirement representation, model configuration, RAG setting, and the presence of the metric-related prompt component. Each generated architecture was subsequently evaluated according to the procedure described in Section 3.4.

3.4. Qualitative Evaluation Dimensions

The final step of our experiment involved a qualitative assessment of the generated diagrams. The architectures were evaluated independently by the four authors using a predefined rubric. Each evaluator assigned scores on a 0–5 ordinal scale, where 0 indicates that the criterion is not satisfied and 5 indicates full satisfaction. All evaluators were instructed to apply the consistent architectural interpretations defined in Section 3 to reduce subjectivity and ensure alignment in the assessment of architectural patterns. The complete scoring guides for the DCC and MyCharts evaluations are provided in Appendix A, Table A1 and Table A2, respectively.
The evaluation dimensions differed between the two experimental phases, reflecting the distinct architectural complexity of the systems under study.
  • Phase 1 Evaluation Criteria
Phase 1 focused on client–server, 3-tier, and MVC architectures. The evaluation rubric therefore included four architectural dimensions:
  • Adherence to architecture: whether the LLM-generated diagram respects the structural principles of the requested architectural pattern and assigns responsibilities to appropriate components.
  • Correctness of class relationships: whether associations, dependencies, and directions of interaction between classes are appropriate.
  • Cohesion and coupling: whether related responsibilities are grouped within appropriate components while unnecessary inter-class dependencies are avoided.
  • Consistency with requirements: whether the generated architecture satisfies the specific in-context functional and non-functional requirements described in the input.
  • Phase 2 Evaluation Criteria
Phase 2 examined microservice architectures for a more complex system. The four Phase 1 dimensions were insufficient to capture microservice-specific design concerns. Therefore, the evaluation rubric was expanded to include the following seven dimensions:
  • Functional alignment and responsibility distribution: whether each microservice corresponds to a bounded context and implements a focused set of functionalities.
  • Coupling and deployment independence: whether services are loosely coupled and designed for independent deployment.
  • Cohesion: whether each service maintains strong internal cohesion and whether use cases involve the appropriate set of services.
  • Data management: whether each service owns and manages its own data rather than relying on shared databases.
  • Data consistency: whether the design includes mechanisms for maintaining data consistency across services, such as through events or transactions.
  • Communication and flow control: whether service interactions are implemented using appropriate coordination mechanisms, such as choreography, orchestration, messaging systems, or API gateways.
  • Non-functional requirements: whether the architecture satisfies the system-level non-functional requirements described in the input specification.
  • Inter-rater agreement
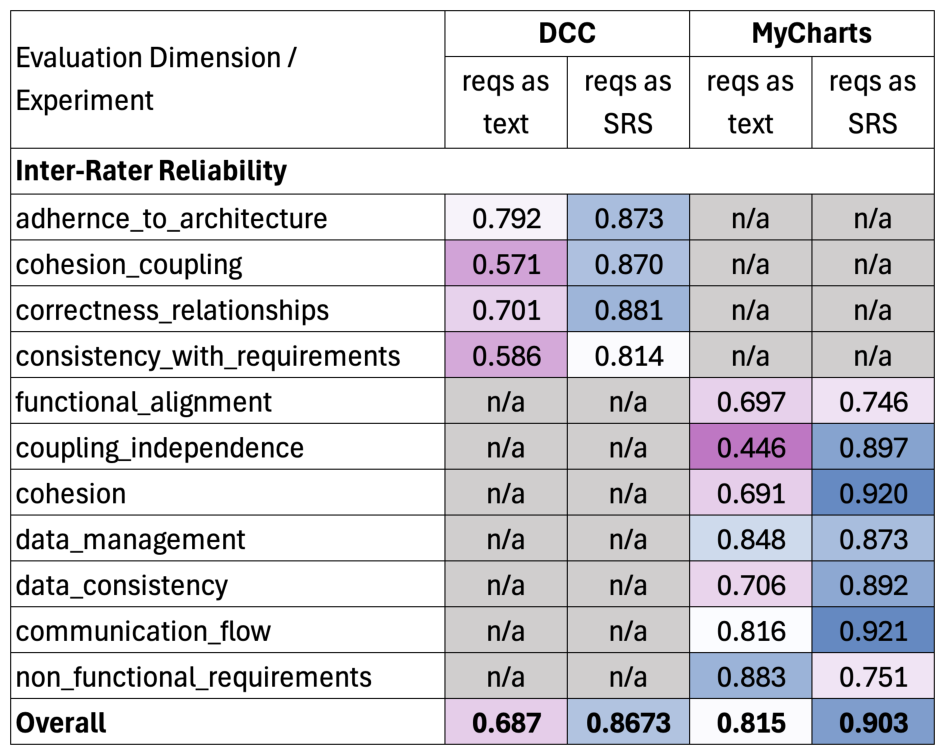
Inter-rater reliability was measured across all dimensions and configurations, as shown in Figure 2. Agreement is generally moderate to high, with most values above 0.7 and several exceeding 0.8. Lower agreement is observed in dimensions such as cohesion and coupling, which involve more subjective judgment. Given that architectural evaluation inherently involves subjective interpretation, both in assessing the generated architecture and in interpreting the characteristics of the target architectural pattern, some variability is expected. Overall, a satisfactory level of consistency among evaluators was observed; however, in cases of substantial scoring disagreement, evaluators revisited the rubric definitions and jointly reviewed the generated architecture to ensure consistent interpretation of the evaluation dimensions. All the final reported scores are calculated as the average of the independent evaluator ratings.

3.5. Quantitative Metrics for Microservices

To complement the qualitative evaluation, we used a set of quantitative metrics introduced in prior research on microservice architecture [30,31,32].
Since the architecture diagrams were generated by the LLMs themselves, the prompt explicitly requested the models to compute these metrics from the diagrams they produced. This setup allowed us to examine whether the models were able not only to construct a microservice architecture but also to identify its structural properties. Because the architectures were generated within the same response, computing relatively simple structural metrics from that representation was expected to be a straightforward task for the models. Most of the evaluated LLMs also supported sufficiently large context windows; therefore prompt length was not expected to prevent the models from performing this additional reasoning step. To ensure reliable measurements, the same metrics were also independently computed by the authors by inspecting the generated diagrams. These manually derived values were used as the ground truth for the quantitative analysis and for comparison with the values reported by the models. The architecture-level and service-level metrics used in this study are summarized in Table 1.
These metrics were used to assist the interpretation of qualitative ratings. In particular, SIC relates to functional alignment and cohesion; SI, AIS, and ADS capture aspects of coupling and deployment independence; DOC reflects data ownership principles; and SST relates to the presence of consistency mechanisms.
Certain architectural properties, such as communication style or satisfaction of non-functional requirements, could not be reliably quantified and were therefore assessed exclusively through qualitative evaluation.

4. Results

This section presents the results of both experimental phases and answers the research questions introduced in Section 1. The analysis draws on the qualitative evaluation dimensions described in Section 3.4, the quantitative microservice metrics defined in Section 3.5, and the observed behavior of the models during the experiments. The results include both visual and quantitative representations of the generated architectures. Several PlantUML class diagrams produced by the LLMs are presented as illustrative examples, accompanied by figures summarizing the overall evaluation outcomes, in the sections to follow.

4.1. Examples of Generated UML Diagrams

This subsection presents selected UML class diagrams generated by the evaluated LLMs in PlantUML format. The models produced PlantUML code as part of their responses, which we rendered into UML diagrams. The selected examples show typical outputs produced by the models and are discussed further in Section 4.2.
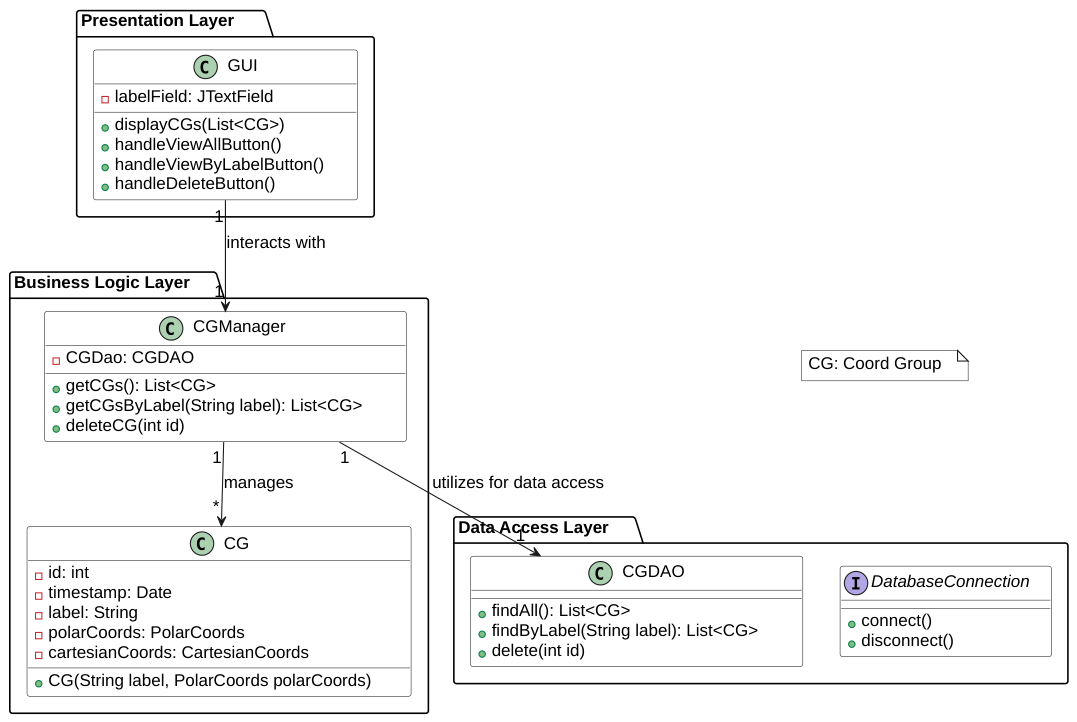
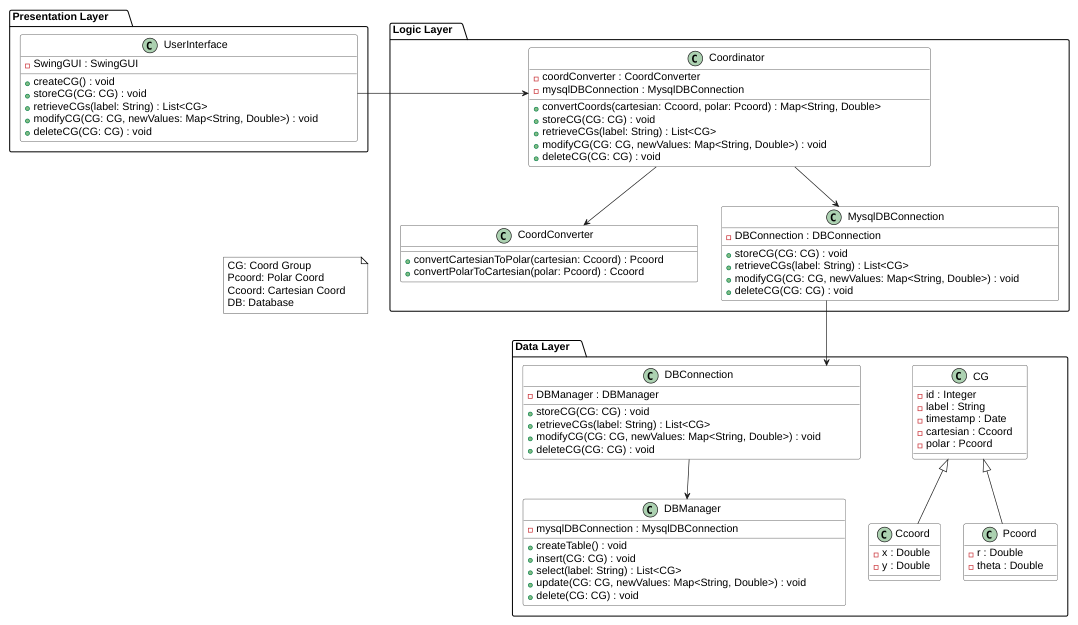
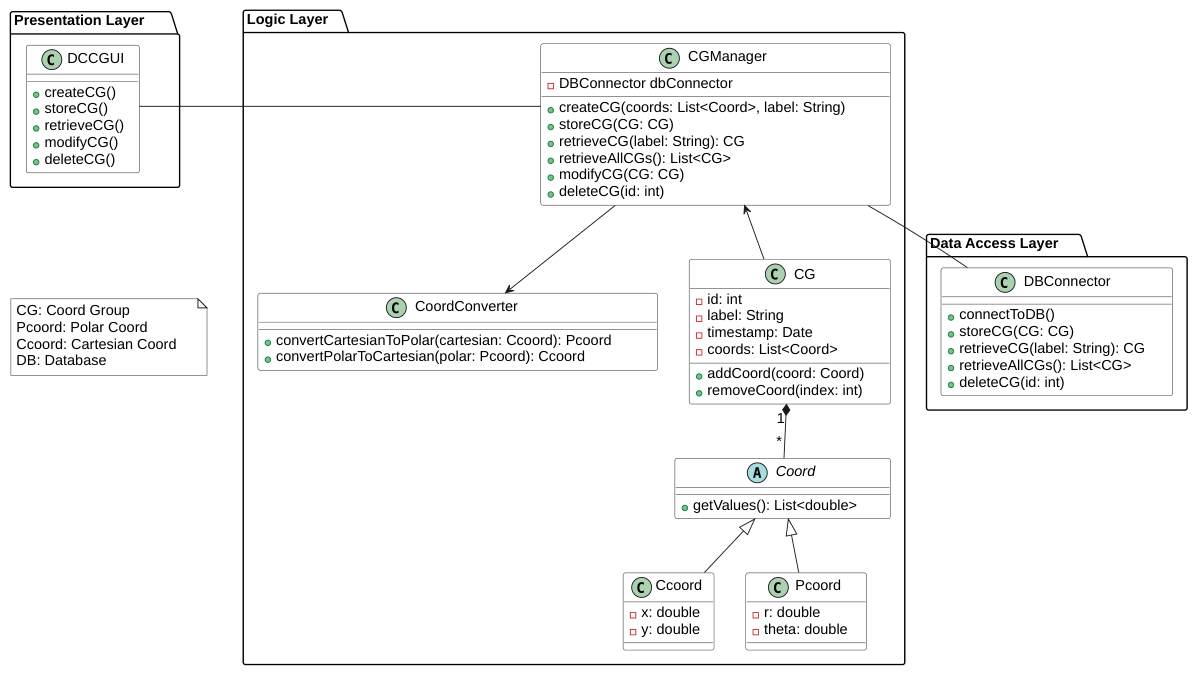
Figure 3 shows an example of a correctly generated three-tier architecture of the DCC system. The diagram clearly separates the presentation, logic, and data-access layers and includes appropriate classes within each layer.
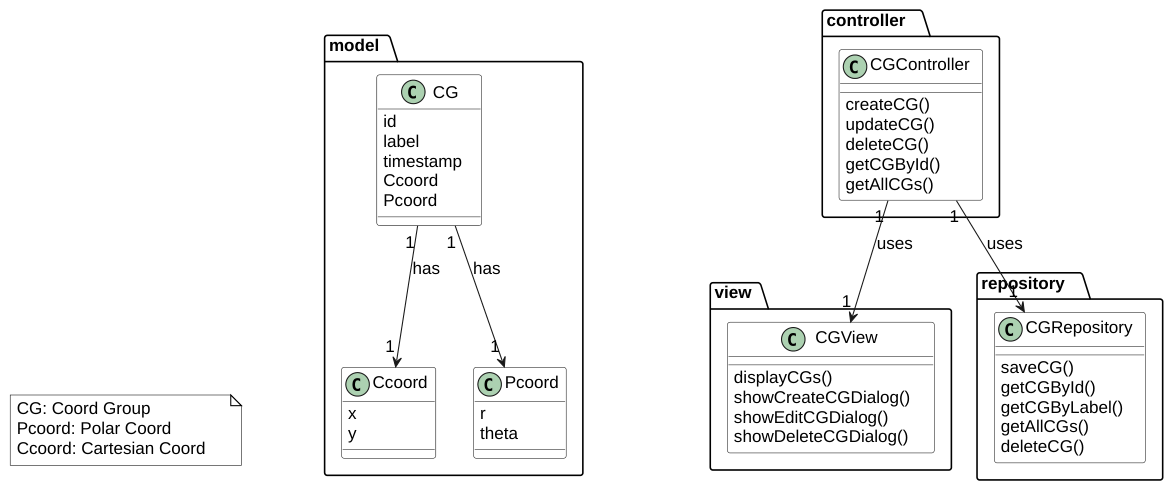
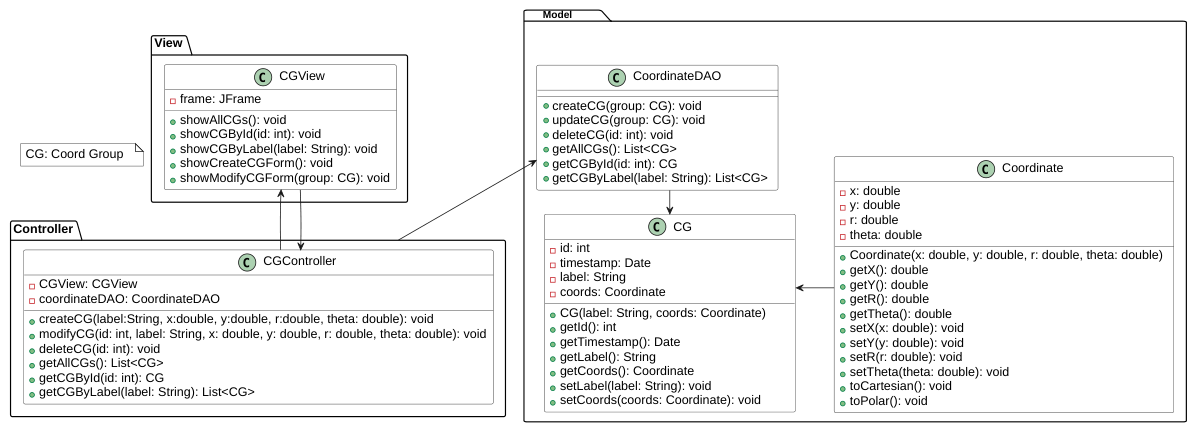
Figure 4 and Figure 5 illustrate how requirement representation can influence the generated architecture. When prompted with the requirement lists, the commercial model produced an incomplete and structurally inconsistent MVC diagram (Figure 4). When prompted with the SRS, the same model generated a more coherent architecture (Figure 5).
Figure 6 and Figure 7 illustrate a case where the SRS representation resulted in a weaker architectural output for a local model. When using the SRS input, the generated diagram contains fewer methods and omits functionality (e.g., absence of conversion logic) expected from the target architecture (Figure 6). In contrast, the FR/NFR-based prompt produced a more detailed and structurally complete diagram (Figure 7).
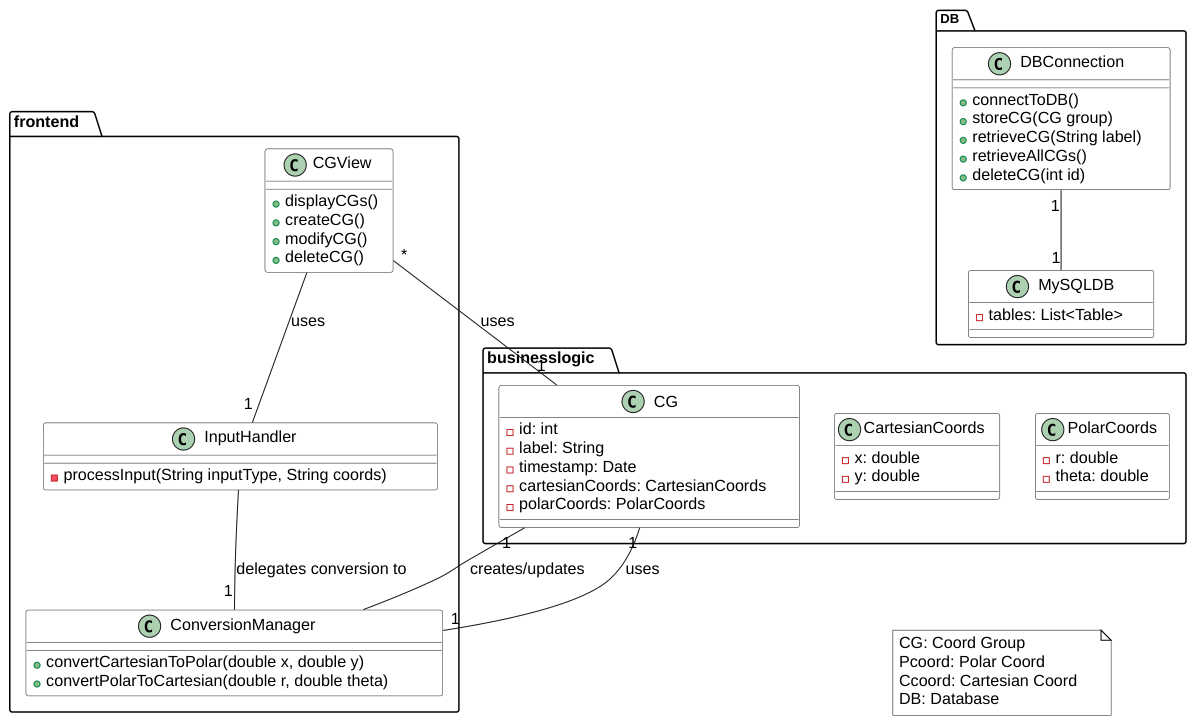
Finally, Figure 7 and Figure 8 show the effect of RAG for the same model and prompt configuration. When RAG is applied, the generated diagram correctly instantiates the three-tier architecture with proper layer separation (Figure 7). Without RAG, the model confuses responsibilities between layers and misrepresents several class relationships (Figure 8).

4.2. Answers to Research Questions

  • RQ1: To what extent can LLMs correctly apply explicitly requested software architectural patterns by creating specific architectural diagrams?
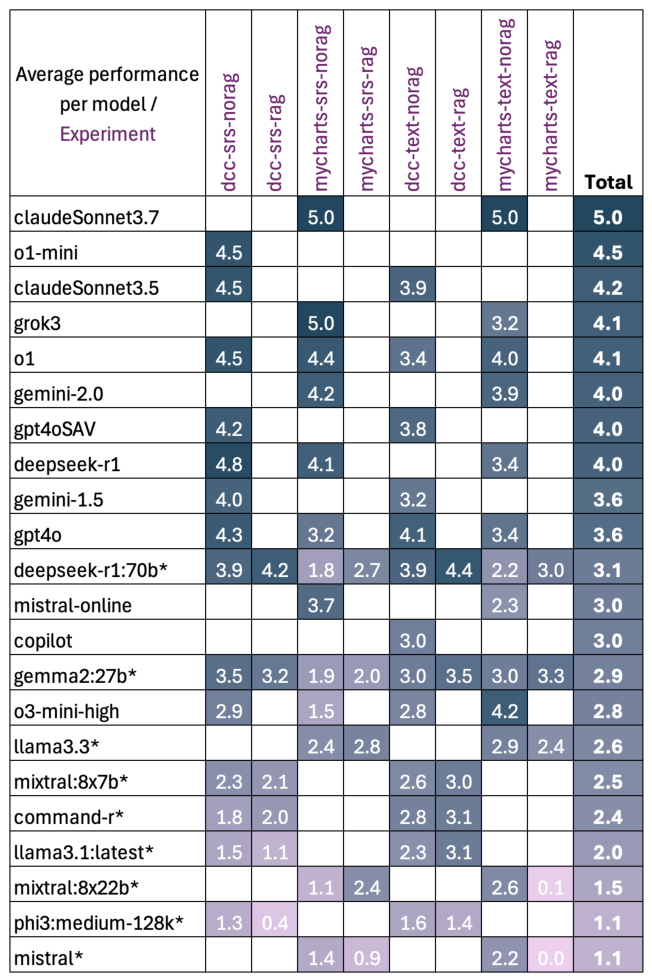
Figure 9 summarizes the average architectural evaluation scores achieved by each model across all the experiments. Across both experimental phases, the models attempted to generate UML class diagrams that followed the requested architectural style. For the simpler “toy” system (DCC), most models produced diagrams that matched the general outline of the requested client–server, three-tier, or MVC patterns (DCC FR-NFR client–server ID = 3 (https://github.com/ntua/ai4softwarearch/tree/main/DCC/fr-nfr/results/cs111/diagrams/3.png), accessed on 30 April 2026; DCC SRS client–server ID = 67 (https://github.com/ntua/ai4softwarearch/tree/main/DCC/srs/results/cs111/diagrams/67.png, accessed on 30 April 2026)). Even smaller and medium-sized models were generally able to apply these simpler patterns with reasonable structural alignment, particularly when provided with concise FR/NFR-based prompts (as illustrated in Figure 3). However, structural issues were common, including misplaced responsibilities (e.g., business logic within presentation layers), unnecessary tiers or classes, unclear separation of concerns, and inconsistencies with the requested pattern constraints. These deviations did not always break the overall architectural shape, but they required improvement to fully comply with the requested pattern.
For the more demanding microservice architecture (MyCharts), correctness degraded noticeably. Only larger models, both commercial and large open-source, consistently preserved key microservice properties, such as service-level data ownership, API-based loose coupling, and clear responsibility boundaries (MyCharts FR-NFR msa ID = 16 (https://github.com/ntua/ai4softwarearch/tree/main/MyCharts/fr-nfr/results/ms111/diagrams/16.svg, accessed on 30 April 2026)). Smaller and medium-sized models frequently defaulted to centralized data storage, blurred service boundaries, or introduced structural inconsistencies, particularly when input complexity increased (e.g., SRS-based prompts) (MyCharts SRS msa ID = 12 (https://github.com/ntua/ai4softwarearch/tree/main/MyCharts/srs/results/ms111/diagrams/12.png, accessed on 30 April 2026)).
Overall, LLMs were able to generate the high-level structure of well-known architectural patterns. However, the correct and in-context application of the desired architectural pattern varies by the complexity of the pattern itself and, of course, the model capacity: larger models maintained structural integrity and pattern adherence more reliably, while smaller models exhibited increased degradation as architectural demands and input length increased.
  • RQ2: How does requirement representation affect the ability of LLMs to apply architectural patterns?
Requirement representation significantly influenced pattern application behavior. Structured FR/NFR lists were generally sufficient for simpler architectures such as the DCC system and often guided LLMs to achieve clearer pattern alignment (DCC FR-NFR client–server ID = 539 (https://github.com/ntua/ai4softwarearch/tree/main/DCC/fr-nfr/results/cs221/diagrams/539.png, accessed on 30 April 2026); DCC FR-NFR three-tier ID = 85 (https://github.com/ntua/ai4softwarearch/tree/main/DCC/fr-nfr/results/tt111/diagrams/85.png, accessed on 30 April 2026)). However, the internal organization of requirements text can also influence the final result apart from the form of problem description. The user-oriented FR1/NFR1 set, organized around high-level features such as creation and storage, did not implicitly guide LLMs to any specific architecture and therefore tended to produce more unbiased outputs across patterns.
In contrast, the implementation-oriented FR2/NFR2 set, which structures requirements by logic, data operations, and user interactions, introduced a noticeable bias: diagrams produced from FR2/NFR2 frequently applied three-tier architectures, even when a different pattern was requested. In this example (DCC FR-NFR MVC ID = 296 (https://github.com/ntua/ai4softwarearch/tree/main/DCC/fr-nfr/results/mvc221/diagrams/296.png, accessed on 30 April 2026)), the generated diagram follows a clear three-layer structure despite the prompt requesting an MVC architecture, likely influenced by the way the requirements are organized. This implies that, in the context of this experiment, LLMs did not even attempt to satisfy the request to apply an explicit architectural pattern.
For more complex architectures, such as in the MyCharts system, however, FR/NFR lists still enabled large models to try to create a microservice design as requested, but the resulting architecture often lacked clear and well-defined service boundaries.
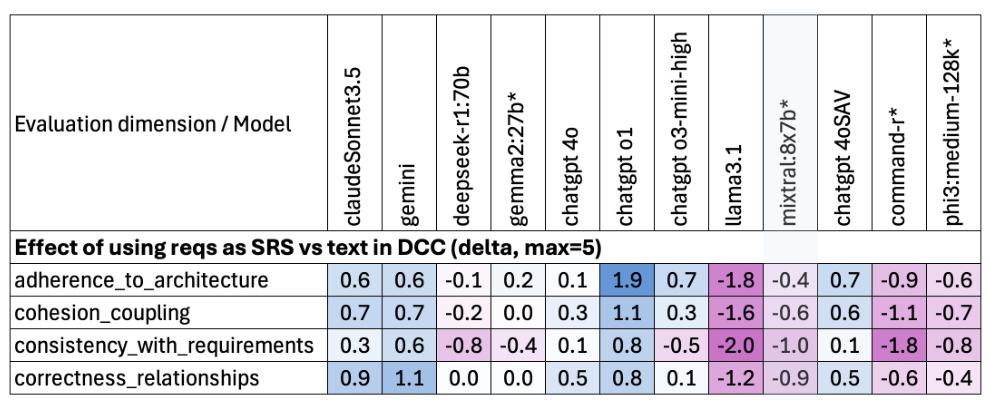
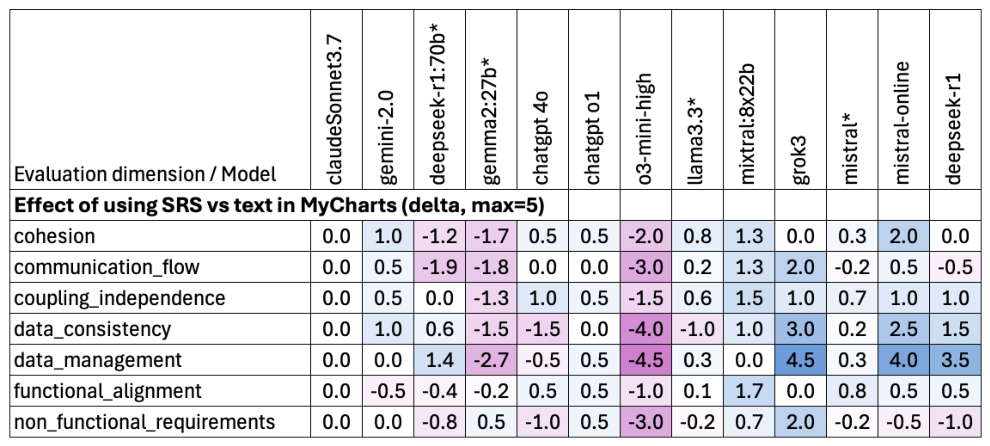
The effect of SRS documents that follow specific structures according to standards also differed based on model capability. Even in the simple DCC experiment, only large online commercial models consistently produced better diagrams when given an SRS instead of freely structured text, as depicted in Figure 10. We observed more complete coverage of the functional behavior and better targeting of the requested architecture by these LLMs (see Figure 4 and Figure 5). For these models, the additional context and standardized semantics in the SRS, including DaC UML diagrams, were beneficial. In contrast, for local models, both small and large, the effect was neutral or even negative. With SRS inputs, these models often produced diagrams that neglected important elements or introduced inconsistencies that were less frequent with plain text, likely due to the substantial increase in prompt length. This suggests that, for such models, the extra size and complexity inherent in the SRS can minimize the benefit of the additional semantics.
In the MyCharts experiment, as shown in Figure 11, a similar pattern was observed: large models were able to exploit the SRS to improve the generated microservice architecture (MyCharts FR-NFR msa ID = 17 (https://github.com/ntua/ai4softwarearch/tree/main/MyCharts/fr-nfr/results/ms111/diagrams/17.png, accessed on 30 April 2026); MyCharts SRS msa ID = 17 (https://github.com/ntua/ai4softwarearch/tree/main/MyCharts/srs/results/ms111/diagrams/17.png, accessed on 30 April 2026)). Most smaller models, however, degraded when moving to the SRS, generating architectures with more confusion in service boundaries and data responsibilities (MyCharts FR-NFR msa ID = 10 (https://github.com/ntua/ai4softwarearch/tree/main/MyCharts/fr-nfr/results/ms111/diagrams/10.png, accessed on 30 April 2026); MyCharts SRS msa ID = 10 (https://github.com/ntua/ai4softwarearch/tree/main/MyCharts/srs/results/ms111/diagrams/10.png, accessed on 30 April 2026)). In this case, specific examples further highlight the model’s capacity role: mixtral:8x22B, a very large local model, coped well with the SRS, whereas the smaller online model o3-mini-high performed worse. In summary, structured SRS documents help models that can cope with longer inputs and richer context, but they are not universally beneficial. For smaller models, a concise and well-structured requirement in plain text appeared more effective than an SRS.
  • RQ3: How does RAG affect the quality of the LLM-generated diagrams?
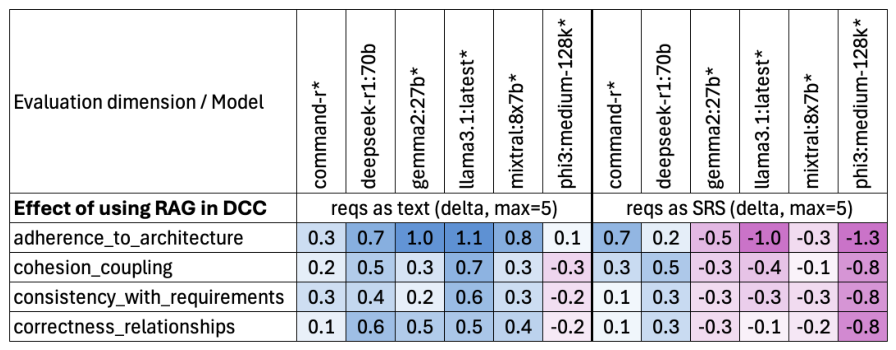
In both experiments, RAG generally improved the quality of the architectures produced by local models, but the effect was not uniform or consistent and depended on the input format and the model’s capacity. Figure 12 shows the effect of RAG in the DCC experiment. When using FR/NFR input, most local models produced clearer architectures with better pattern alignment when RAG was enabled. Models such as command-r, llama3.1:latest, mixtral:8x7b, and gemma2:27b produced diagrams that followed the requested patterns more closely when additional contextual information was provided through RAG (see Figure 7 and Figure 8). One exception was phi3:medium-128k, which showed a small decrease, indicating difficulty in integrating the additional information.
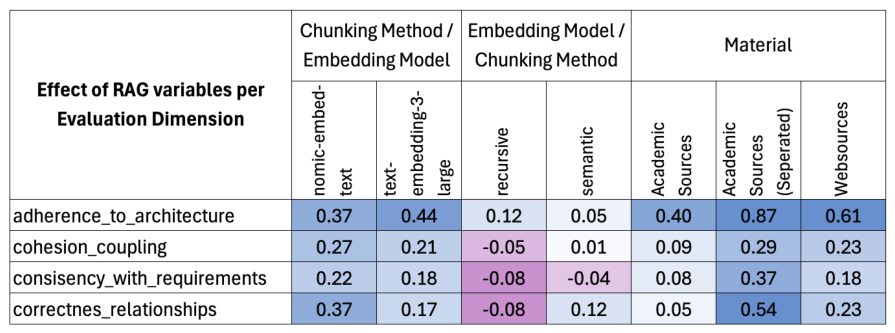
The effect of RAG was influenced by parameter choice, as discussed in Section 3.2 and shown in Figure 13. Among the chunking configurations, the semantic method consistently produced better results in terms of diagram quality compared to recursive character-based splitting. For both embedding models, semantic chunking provided a systematic advantage over the recursive approach. This suggests that semantically coherent chunks offer more meaningful architectural context, which is reflected in diagrams that more accurately preserve the intended pattern structure. By contrast, a comparison between embedding models revealed smaller and less consistent differences. This indicates that the choice of embedding model between the open-source nomic-embed-text and the commercial text-embedding-3-large had a weaker influence than the chunking strategy in this setting. The largest differences were observed with respect to the source material. Pattern-separated academic sources produced the strongest positive effect across all the evaluation dimensions, particularly for adherence to architecture and correctness of relationships. Web-based and non-separated academic sources also improved the results but to a lesser extent. Overall, these findings indicate that RAG most reliably improves diagram quality when the retrieved context is both semantically well structured and closely aligned with the target architectural pattern.
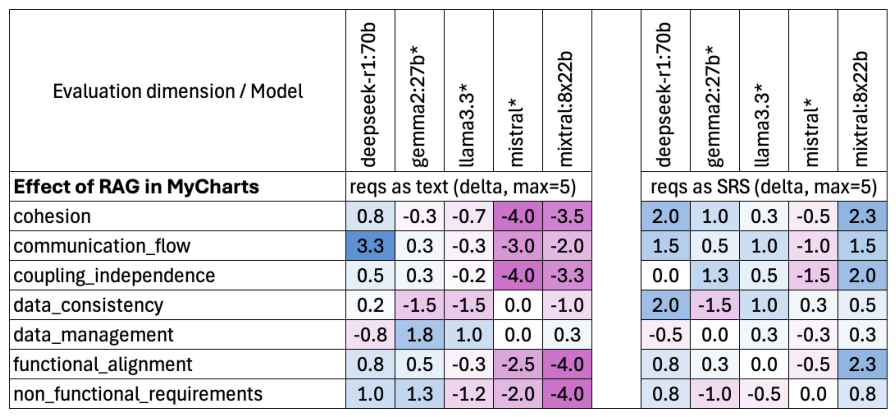
When RAG was applied together with SRS documents, the outcome was less favorable. The SRS inputs already increased the cognitive load for smaller models, and the added retrieval material sometimes amplified this effect. In these cases, RAG did not reliably improve the results and at times even reduced clarity. Figure 14 presents the effect of RAG in the MyCharts experiment. Only the deepseek-r1:70B model, the largest local model tested, showed clear and consistent improvement with RAG for both input types. For the other local models, the effect of RAG was inconsistent. This variability is due to the higher complexity of microservice architectures compared to simpler patterns, the smaller sample size for this configuration, and the limited ability of local models to process larger prompts.
The main empirical finding from the DCC experiment still holds. RAG can improve performance when the combined length of the base input and the retrieved context remains within the model’s effective processing capacity. In MyCharts, this condition was met only by the largest local model. This indicates that, when specific conditions are met, even local models can be productive in architectural design tasks.
  • RQ4: Can LLMs calculate reliable quantitative metrics regarding the diagrams they generate?
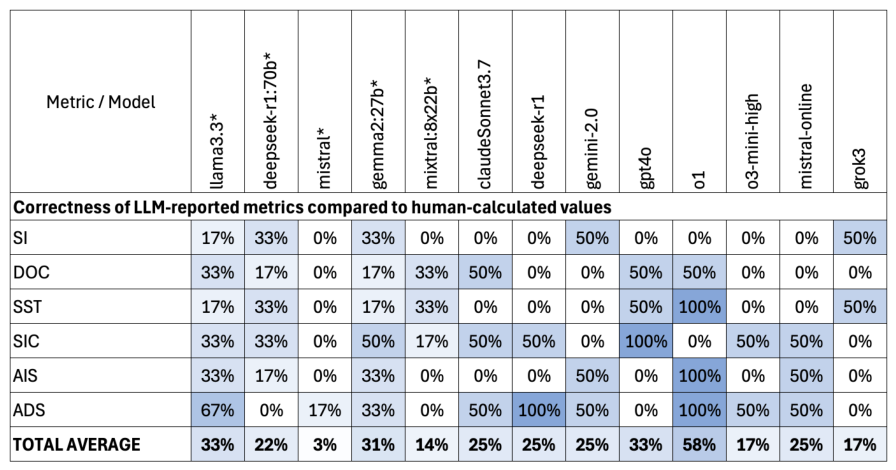
Architectural metrics, as mentioned in Section 3.5, were introduced explicitly only in the MyCharts microservice experiment, where the prompts described a set of microservice-related metrics and asked the models to compute these values in addition to generating the architecture. The metric values returned by the models themselves were often incorrect, indicating hallucinations or result “fabrication”, as shown in Figure 15, which presents the success rate of metric computation, defined as the frequency with which the LLMs accurately computed the metric, where the values they produced matched those obtained through our manual calculations.
These inconsistencies appeared across most LLM types, but their extent varied. Some larger LLMs produced metric values that were closer to the truth, obtained by manual calculation, while others exhibited substantial divergence. In several cases, LLMs seemed to extract and report metric values from general documentation about microservices rather than from the elements they had actually just produced. Our experiments indicate that self-reported architectural metrics from LLMs should be treated with caution given that nearly all the models exhibited success rates below 50%. Even when the generated diagram is structurally reasonable, the accompanying metrics may be hallucinated and may not correspond to the actual diagram. At present, reliable use of metrics requires external computation, human validation, and further investigation.

5. Threats to Validity

As with any empirical study, several factors may affect the validity of the results. Below, we discuss potential threats in terms of internal, construct, and external validity.

5.1. Internal Validity

5.1.1. Subjectivity of Expert Evaluation

The architectural quality assessment relied on the authors’ judgment. Four evaluators (two graduate engineers, one PhD researcher, and one experienced software architect, Professor of Software Engineering) independently scored each generated diagram. To reduce evaluation bias, a 0 to 5 ordinal scale with explicit anchors was provided for each evaluation criterion. A value of 0 indicates that the architecture totally fails to satisfy the criterion, whereas 5 indicates total satisfaction. The evaluators performed their assessments independently, and final scores were computed as the average of their ratings. Although this procedure reduces individual bias, the evaluation of software architectures inherently involves a substantial degree of subjective interpretation. This is partially mitigated through the use of multiple independent evaluators and the aggregation of scores across reviewers. In all cases, the objective is to ensure that the results remain comparable across LLMs.

5.1.2. Single-Run Executions

As discussed in Section 3, each experimental configuration (model × prompt type × RAG setting) was executed once under fixed prompting conditions. Since LLM outputs are inherently stochastic, repeated executions of the same configuration may therefore produce different architectural diagrams. This study does not attempt to characterize variability across repeated executions or perform statistical analysis of generated outputs.
Instead, the objective of this work is to investigate comparative behavior across models, requirement representations, architectural patterns, and RAG configurations under controlled and directly comparable conditions. Architectural generation was treated as a single-step task without iterative prompt refinement or corrective interaction, allowing all the evaluated configurations to be assessed using the same experimental process shown in Figure 1. This design choice limits the ability to analyze the stochastic consistency of LLMs. The results should be interpreted as observations regarding comparative architectural behavior under fixed execution settings rather than as a statistical characterization of model variability.
All the generated outputs are publicly available in the online repository to support transparency and reproducibility. The proposed generalized workflow, as shown in Figure 16, is compatible with future repeated-execution studies and statistical evaluation protocols, which could further investigate output variance across repeated runs.

5.2. Construct Validity

Architectural Representation

The study evaluates generated architectures using UML class diagrams expressed in PlantUML. Class diagrams primarily capture static structural relationships and do not represent dynamic behavior, deployment topology, or runtime process views. Architectural frameworks such as the 4 + 1 view model emphasize the importance of multiple complementary views in architectural description. This limits the representational completeness of the evaluated architectures. However, the goal of this study is not to assess full architectural documentation or multi-view architectural reasoning. Instead, the objective is to evaluate whether LLMs can correctly instantiate explicitly requested structural architectural patterns. For the architectural styles considered in this study, client–server, three-tier, MVC, and microservices, core architectural properties such as separation of concerns, layering constraints, service boundaries, and data ownership are primarily reflected in static structural relationships. UML class diagrams therefore provide a sufficient, controlled and comparable medium for assessing structural adherence to architectural patterns.

5.3. External Validity

5.3.1. Model Selection

The study evaluated a range of LLMs, including both commercial and open-source models available during the experiments, spanning multiple parameter scales. The goal was not exhaustive coverage of all existing LLMs but representation across different model families and sizes. Consequently, the results primarily generalize to models with similar capabilities and parameter scales rather than to all existing or future LLMs. As the LLM ecosystem evolves rapidly, newly released models may exhibit different architectural reasoning capabilities.

5.3.2. Problem Scope and Architectural Patterns

The study evaluates LLMs using two experimental systems that represent commonly used architectural patterns: client–server, three-tier, MVC, and microservices. Although these patterns are well established and widely documented in the software architecture literature, they do not cover the full spectrum of architectural paradigms encountered in industrial systems. More complex architectures, such as distributed event-driven systems, domain-driven architectures, or highly domain-specific platforms, may introduce additional challenges that are not captured in this evaluation. The benchmark systems used in the experiments (DCC and MyCharts) were intentionally designed to provide controlled and interpretable evaluation scenarios. While this design enables systematic analysis of how LLMs interpret and instantiate architectural patterns, the systems are smaller and more constrained than typical industrial software systems. Consequently, the findings may not fully generalize to large-scale applications with complex domain constraints.
Future research should therefore extend the evaluation to larger real-world systems, more diverse architectural styles, as well as other LLMs. The findings presented in this work are limited to the LLMs and architectural patterns examined. According to these findings, only more capable LLMs are expected to efficiently handle more complex architectural patterns, such as event-driven systems, domain-driven design, or message-oriented architectures. Nevertheless, the same approach can be followed to investigate the performance of any LLM in generating any architecture.

6. Conclusions

This study investigated the ability of LLMs to generate software architectures from user-provided textual requirements by applying explicitly requested architectural patterns. Through two experimental phases covering both simpler architectural styles (client–server, three-tier, and MVC) and the more complex microservice architecture, we evaluated how requirement representation, model capacity, and RAG influence the quality of the generated architectures. Deliberately, a single-shot executed-once approach was taken to support comparability and reduce the “moving parts” of the experiment due to the stochastic variability of LLMs. This approach aims to satisfy software practitioners’ need to understand the capabilities and limitations of LLMs in non-code-related tasks within a fair set of assumptions. This could also support practitioners to consider using locally hosted open-source LLMs for supporting architectural decisions without sharing proprietary software artifacts, such as requirement specifications, with public LLMs. Our findings indicate that this could be possible under certain conditions.
The results indicate that LLMs are able to produce architectural designs by applying well-known architectural patterns, particularly for simpler software systems. However, within a fair margin of confidence based on the inter-rater agreement, as discussed in Section 3.4, the correctness and structural consistency of these architectures relate to both the capacity of the model and the structure of the input requirements. Larger models generally satisfied architectural constraints more consistently, whereas smaller models exhibited increasing degradation as architectural complexity and prompt size increased. Requirement representation also influenced the results: concise lists of functional and non-functional requirements often produced clearer outputs for smaller models, while richer SRS documents primarily benefited models that are capable of processing longer and more complex inputs. Although RAG was applied with a limited number of materials, there are indications that it can improve the performance of small LLMs within certain limitations, such as the size of the LLM-supported context window and prompt length.
Taken together, these findings highlight a broader implication: many of the longstanding challenges of requirement engineering and architectural design are reflected in LLM-based architectural generation. Requirement documents often vary in structure, completeness, and semantics, and architectural patterns themselves allow multiple valid interpretations. These variations are also present in the training data of LLMs and are likely to contribute to the diversity and inconsistency observed in the architectures they generate. Beyond architectural generation itself, the study also examined whether LLMs can compute some architectural metrics based on the diagrams they generate for only one of the examined architectures. While metrics calculated externally from the produced architectures proved useful for analyzing the structural properties of architectures, the metrics reported directly by the models were frequently incorrect and often inconsistent with the generated diagrams. This observation suggests that LLM-generated architectural artifacts should be interpreted cautiously and that automated evaluation of architectural properties still requires external verification mechanisms. It also indicates that requesting both architecture generation and metric computation in a single prompt may not be the best approach. Future work could therefore explore staged approaches in which architectural models are generated first and established structural metrics are subsequently derived through separate analysis steps or external tools that accept an architectural representation as input, which would be suitable for static analysis and metric calculation.
Although different perspectives to the above may be suggested, this work contributes to the investigation of prompting strategies, alternative representations of requirements, use of RAG, generated architecture representation using DaC, as well as qualitative and quantitative measures for the evaluation of LLM-generated architectures.
A reusable description of the experimental workflow followed in this work is illustrated in Figure 16. The figure abstracts the key steps of the study, including requirement preparation, model configuration, architecture generation, and evaluation, into a reusable workflow that can support systematic assessment of LLMs in software architecture tasks, with the collection of relevant metadata for analysis and evaluation. This workflow can support future studies that examine additional models and context parameters.
Several directions for future work follow from this study. First, DaC representations proved to be a practical format for interacting with LLMs, both for providing architectural context and requesting structured outputs. Although UML was used in this work due to its widespread adoption and established semantics, other approaches, such as the C4 model, may provide simpler and more architecture-oriented representations that could be better suited to LLM-based workflows. Similarly, evaluating additional DaC options beyond PlantUML may help to identify representations that influence LLM reasoning more effectively. Further investigation is needed to determine whether other representations of architecture, possibly including source code, could improve model behavior. Another important direction is the investigation of more complex and demanding architectures, such as domain-specific, event-driven or message-oriented ones.
Another direction would be the use of XMI as a standardized machine-readable representation of UML models. In principle, XMI should be able to support semantically rich, structured, and interoperable exchange of UML content [33]. In practice, however, our experiments showed that LLMs struggle to produce syntactically valid and semantically correct XMI representations, a difficulty also observed in recent studies [34]. Further research is required to determine which approach or tool, if any, could make XMI usable in LLM-driven architectural workflows, assuming that XMI is still relevant.
A related research direction is the exploration of architecture-as-code approaches, in which software architectures are described directly using programming languages or executable specifications [35]. Such representations may provide clearer semantics and allow architectural metrics to be extracted automatically through static code analysis tools. Investigating whether LLMs can more efficiently generate architecture-as-code representations may provide an alternative to diagram-based architectural modeling. The source code produced, especially in strongly typed languages, could be easily reverse-engineered to create any diagrammatic representation and metrics.
Finally, our experience emphasizes the need for a common benchmark for evaluating LLMs in software architecture generation. Current studies employ different systems, requirement descriptions, evaluation criteria, and prompting strategies, making it difficult to compare results across experiments, especially considering that LLMs evolve day by day. Establishing a shared benchmark consisting of representative architectural problems, requirement specifications, and agreed evaluation dimensions would support more systematic progress in this research area. The experimental setup and artifacts produced in this study aim to contribute towards this direction by providing an initial empirical foundation for understanding how requirement representation, model capacity, and retrieval mechanisms influence the ability of LLMs to generate software architectures.

Author Contributions

Conceptualization, C.H. and V.V.; methodology, C.H. and V.V.; software, C.H., M.T. and G.S.; validation, C.H., M.T. and G.S.; formal analysis, C.H., M.T. and G.S.; investigation, C.H., M.T. and G.S.; data curation, C.H.; writing—original draft preparation, C.H.; writing—review and editing, C.H., M.T., G.S. and V.V.; visualization, C.H.; supervision, V.V.; project administration, V.V. All authors have read and agreed to the published version of the manuscript.

Funding

This research received no external funding.

Institutional Review Board Statement

Not applicable.

Informed Consent Statement

Not applicable.

Data Availability Statement

The data and materials supporting the results of this study are publicly available on GitHub at https://github.com/ntua/ai4softwarearch/tree/main (accessed on 30 April 2026) and are distributed under a Creative Commons license.

Conflicts of Interest

The authors declare no conflicts of interest.

Appendix A. Evaluation Rubric

Appendix A.1. Dummy Coordinate Converter

Table A1. Phase 1 evaluation rubric: Dummy Coordinate Converter (DCC).
ScoreViolation/ConditionQualitative Descriptor
1. Adherence to Architecture
5No violations. Correct pattern applied with full layer/role separation.The diagram is a textbook instantiation of the requested pattern. All structural rules (e.g., no direct presentation-to-data link in 3-tier, controller mediates in MVC, and server owns data in client–server) are satisfied without exception. All requirements are satisfied.
4Minor misplacement: one class assigned to a slightly incorrect layer/role.The pattern is clearly recognizable and largely correct. A single component sits in the wrong layer (e.g., a utility class placed in the data layer), but this does not alter the overall structural logic. All requirements are satisfied.
3Moderate misplacement: noticeable responsibility or dependency violations across two layers/roles.The intended pattern is still identifiable, but there is a clear responsibility violation. For example, conversion logic is implemented inside the view or a data-access method exposed by the presentation tier. Few requirements are not satisfied.
2Major structural deviation: multiple responsibilities assigned to wrong layers.The pattern shape is present in name only; the responsibilities are largely misallocated. A reviewer can identify the intended pattern with effort but would not accept the design as compliant. Few requirements are satisfied.
1Pattern barely recognizable: structural rules largely ignored; only superficial labeling matches.Layer or role labels are present, but the underlying structure does not respect their semantics. Most components ignore the pattern’s constraints. Few requirements may be implicitly satisfied.
0No meaningful adherence: wrong pattern applied or no discernible pattern structure.The diagram either applies a completely different pattern from the one requested or shows no pattern awareness whatsoever. The output cannot be evaluated against the target pattern.
2. Correctness of Class Relationships
5No violations. All associations, dependencies, and directions are correct and consistent.Every relationship type (association, dependency, inheritance, etc.) and its direction are appropriate for the pattern and the system. No redundant or missing links.
4One or two incorrect or missing relationships (e.g., wrong direction or wrong relationship type).All major structural links are present. One or two edges are misdirected or use the wrong UML relationship type (e.g., dependency instead of association), but the impact on readability is minimal.
3Three to four relationship errors, or one fundamentally wrong dependency between key components.The diagram is still interpretable, but a noticeable number of links are wrong or missing. A human reviewer would need to mentally correct these to understand the design intent.
2Multiple wrong relationships that obscure the data or service flow.Incorrect or missing relationships are pervasive enough to make it difficult to trace the system’s primary sharing of responsibilities. Understanding the architecture requires significant inference beyond what is shown.
1Widespread incorrect or missing relationships throughout the diagram.Almost all inter-class links are wrong, missing, or contradictory. The diagram’s relationship structure provides little useful information about the system.
0Relationships are absent or completely wrong across the entire diagram.No meaningful relationship structure exists. Classes appear as isolated boxes, or all relationships are fundamentally incorrect (e.g., all arrows reversed; wrong or hallucinated types throughout).
3. Cohesion and Coupling
5No violations. Related responsibilities correctly grouped; no unnecessary inter-class dependencies.Each class has a single well-defined responsibility. No unnecessary coupling between unrelated components is present. The design minimizes dependencies while keeping related logic together.
4One class with slightly mixed responsibilities, or one unnecessary coupling between two components.The design is clean overall. One minor cohesion issue exists (e.g., a class that handles both data formatting and persistence), but it does not affect the overall structural quality.
3One class with clearly confused responsibilities, OR two unnecessary couplings between logically unrelated components.A clear but isolated cohesion or coupling problem is present. The affected component is identifiable and would need refactoring, but the rest of the diagram is sound.
2Two or more classes with mixed responsibilities, or excessive coupling between several unrelated components.Cohesion and coupling issues are widespread enough to compromise the principles of the design. The architecture shows signs of a “god class” or excessive cross-cutting dependencies.
1Widespread responsibility mixing or coupling that fundamentally breaks the pattern’s modularity.The design has almost no meaningful separation of concerns. Responsibilities are scattered arbitrarily, no respect for SRP principle, and coupling is pervasive. The pattern’s modularity intent is not achieved.
0No meaningful cohesion; all classes entangled with unrelated responsibilities.Every class mixes unrelated responsibilities, and the diagram shows no attempt at separation of concerns. The coupling structure makes the design uninterpretable.
4. Consistency with Requirements
5No violations. All functional requirements addressed in the architecture.Every stated functional requirement (e.g., coordinate creation, storage, retrieval, conversion, and deletion) is reflected in the generated classes and relationships.
4One minor functional requirement not satisfied or only partially present.The architecture covers the system comprehensively. One secondary operation (e.g., label-based retrieval) is absent or implied rather than explicitly modeled.
3One important functional requirement missing.A meaningful gap exists. For example, conversion logic is not represented in any class, or other key operations are missing.
2Two or more functional requirements missing, OR a design constraint violated.Multiple required capabilities are absent. An evaluator comparing the diagram against the requirement list would find several uncovered items.
1Core system functionality absent from the architecture.The architecture is missing fundamental capabilities. For example, no storage layer, no conversion logic, or no user interaction classes despite these being central to the described system.
0Architecture does not address the described system at all.The generated diagram is generic, unrelated to the requirements, or so incomplete that no meaningful coverage assessment is possible.

Appendix A.2. MyCharts

Table A2. Phase 2 evaluation rubric: MyCharts.
ScoreViolation/ConditionQualitative Descriptor
1. Functional Alignment and Responsibility Distribution
5No violations. Each service maps to a clearly defined bounded context with focused non-overlapping responsibilities.The decomposition is principled: every microservice corresponds to a distinct business capability (e.g., chart management, user management, or export), with no overlapping or duplicated responsibilities across services. Orchestration is clear.
4One service has a slightly broad or ill-defined scope.The decomposition is generally sound, and orchestration is visible. One service is marginally overloaded or its boundary is slightly ambiguous (e.g., it handles two closely related but distinguishable functions), but the overall design intent is clear.
3One service merges two distinct bounded contexts, or one core function is missing from any service.A meaningful decomposition error is present. Either two separate business capabilities are merged into one service or one significant system function has no corresponding service in the diagram.
2Multiple services with unclear or overlapping functional boundaries.Service boundaries are poorly defined in several places. An evaluator cannot unambiguously understand assigned responsibilities to individual services. The decomposition appears driven by technical rather than business concerns.
1Services defined primarily by technical layer rather than business capability (monolith in disguise).Services are named and structured like technical tiers (e.g., “DataService” and “LogicService”), clearly violating the microservice principles. The design replicates a layered monolith rather than a microservice decomposition.
0No meaningful functional decomposition into independent services.The diagram does not decompose the system into functionally distinct services. All functionality is lumped into one or two units, or the services shown are entirely arbitrary.
2. Coupling and Deployment Independence
5No violations. Services communicate via well-defined interfaces (APIs/events); each is independently deployable.All inter-service interactions are mediated through explicit well-defined interfaces. No service depends on the internal implementation of another. Each service could be deployed, scaled, and updated independently without affecting others. Orchestration is clearly recognizable.
4One unnecessary direct call or tight dependency between two services.One pair of services is more tightly coupled than necessary (e.g., a direct method invocation where a message-based call was expected), but the rest of the architecture preserves independence.
3Two tight inter-service dependencies, OR shared mutable state between two services.Two coupling violations are present, or two services share mutable state (e.g., a partially shared table). Independent deployment of at least one service is compromised.
2Multiple services share a single database or common runtime components.The shared-database anti-pattern is present: two or more services read and write to the same datastore without ownership boundaries. Deployment independence is significantly undermined.
1All services share infrastructure or cannot be independently deployed.The architecture provides no meaningful deployment independence. Services share all runtime dependencies and would need to be deployed as a unit.
0No deployment independence; architecture is at best effectively monolithic.There is no evidence of service isolation or independent deployability. The diagram describes a monolithic system regardless of how the components are labeled.
3. Cohesion
5No violations. Each service has strong internal cohesion; use cases involve the correct and minimal set of services.Every service groups tightly related operations and data. Use cases are realized by the minimal necessary set of services, with no unnecessary service involvement in any workflow.
4One service contains one slightly unrelated operation.The architecture is cohesive overall. One operation in one service does not fully belong there (e.g., a notification method in a chart service), but the deviation is minor and localized.
3One service is clearly overloaded with unrelated responsibilities.A single service acts as a catch-all for unrelated functions. The service is identifiably a cohesion problem, but the rest of the architecture is reasonably well structured.
2Multiple services with mixed responsibilities.Cohesion problems appear in several services. Common workflows involve more services than necessary, indicating poor responsibility assignment across the board.
1Widespread mixed responsibilities; cohesion principle largely absent from the design.Almost no service has a coherent focused responsibility. Operations are distributed across services without a discernible organizing principle.
0No cohesion; responsibilities distributed arbitrarily across services.Responsibilities appear to be assigned randomly. There is no evidence of any deliberate cohesion principle in the decomposition.
4. Data Management
5No violations. Each service owns and manages its own dedicated datastore; no shared databases.Every service that requires persistence has its own dedicated datastore (e.g., its own DB schema or instance), and no service accesses another service’s datastore directly. Data ownership is clear and enforced structurally.
4One service accesses another service’s datastore directly (single violation).One cross-service data access exists where inter-service API calls should be used instead. The violation is isolated; all other services manage their data independently.
3Two data ownership violations, OR one service has no datastore despite requiring persistence.Two instances of improper cross-service data access exist, or a service that clearly needs persistence (e.g., a chart repository service) has no corresponding datastore.
2Multiple services share a database, OR a centralized data layer is present.The shared-database anti-pattern is clearly present. Two or more services operate on the same datastore, making independent evolution of those services impossible.
1Most services lack dedicated datastores; data ownership is not addressed.The vast majority of services have no ownership of data. Persistence is either centralized or entirely absent, suggesting total absence of data isolation.
0Single shared datastore for all services, or no data management present.Either one monolithic datastore serves all services (full anti-pattern) or the diagram contains no datastore elements at all, making it impossible to assess data ownership.
5. Data Consistency
5Explicit cross-service consistency mechanisms present (e.g., events, sagas, and distributed transactions).The diagram explicitly models mechanisms for maintaining data consistency across services, such as an event bus, a saga orchestrator, or transaction-aware service interactions, as appropriate to the system’s requirements.
4Consistency mechanism implied but not explicitly modeled (e.g., event-driven hints in method names only).There is evidence of consistency awareness (e.g., method names like publishEvent or rollback), but the mechanism itself (event bus, saga class, etc.) is not present as a first-class element in the diagram.
3Consistency mechanism partially modeled for some services only.A consistency mechanism exists in the diagram, but it covers only part of the system. Some cross-service interactions that require consistency guarantees are left unaddressed.
2No consistency mechanism present despite the pattern requiring cross-service coordination.Services interact across boundaries in ways that require consistency guarantees (e.g., a chart creation flow that touches multiple services), but no consistency mechanism of any kind is included.
1Consistency explicitly violated.The design actively uses an anti-pattern as its implicit consistency strategy, for instance having services share a database to avoid distributed consistency, which defeats the purpose of microservices.
0Data consistency completely absent and the architecture makes it structurally impossible.The architecture has no consistency mechanism, and its structural choices (e.g., no events, no messaging layer, and all services fully isolated with no coordination) preclude adding one without redesign.
6. Communication and Flow Control
5Appropriate coordination mechanisms modeled (choreography, orchestration, messaging, and API gateway).The diagram includes explicit appropriate inter-service communication mechanisms. Synchronous and asynchronous interactions are distinguished where relevant. An API gateway or equivalent entry point may be present.
4Communication mechanism present but one interaction uses an inappropriate style.The overall communication structure is sound. One inter-service call uses the wrong style, but this is isolated.
3Two inappropriate interactions, OR coordination mechanism absent for one significant flow.Two communication style violations exist, or one important workflow (e.g., chart export pipeline) has no coordination mechanism, leaving the flow control implicit.
2No API gateway or orchestration; ad hoc direct coupling throughout.Services communicate through direct ad hoc calls with no gateway, broker, or orchestrator. The communication structure does not reflect microservice best practices and would not scale.
1Communication between services is undefined or modeled as direct in-process calls.Services appear to call each other as if they share a process (e.g., direct method calls with no network boundary). The inter-service communication model is absent or fundamentally incorrect.
0No inter-service communication present.Services appear in isolation with no connections between them. It is impossible to determine how the system would function as a whole.
7. Non-Functional Requirements
5Architecture clearly satisfies all NFRs (scalability, security, availability, and technology constraints).Structural decisions in the diagram are visibly informed by the stated NFRs. For example, stateless services support horizontal scalability; security components (auth service and gateway) are present.
4One NFR partially addressed, or one technology constraint overlooked.The architecture satisfies almost all NFRs. One constraint is absent or only implicitly addressed. For example, authentication is implied by a method name but no dedicated auth component is modeled.
3Two NFRs unaddressed, OR one critical NFR (e.g., security or scalability) ignored.A significant NFR gap exists. Either multiple minor NFRs are missing or one critical quality attribute that the requirements explicitly call out has no structural representation in the diagram.
2Multiple NFRs absent; architecture does not account for operational concerns.The diagram reflects only the functional structure of the system. Operational NFRs are not reflected in any structural decision, suggesting they were not considered.
1NFRs almost entirely absent from structural decisions.The architecture is functionally oriented with essentially no NFR-driven decisions. An architect reviewing the diagram would need to redesign significant portions to address the stated quality attributes.
0NFRs completely ignored; no NFR-driven structural decision is visible.The generated architecture makes no accommodation for any non-functional requirement and would need to be fundamentally reconsidered.

References

  1. ISO/IEC/IEEE 42010:2022; Software, Systems and Enterprise-Architecture Description. International Organization for Standardization: Geneva, Switzerland, 2022.
  2. Sommerville, I. Software Engineering, 10th ed.; Global Edition; Pearson Education Limited: Harlow, UK, 2016. [Google Scholar]
  3. Chen, M.; Tworek, J.; Jun, H.; Yuan, Q.; de Oliveira Pinto, H.P.; Kaplan, J.; Edwards, H.; Burda, Y.; Joseph, N.; Brockman, G.; et al. Evaluating Large Language Models Trained on Code. arXiv 2021, arXiv:2107.03374. [Google Scholar] [CrossRef] [Scilit]
  4. Wang, J.; Chen, Y. A Review on Code Generation with LLMs: Application and Evaluation. In Proceedings of the 2023 IEEE International Conference on Medical Artificial Intelligence (MedAI), Beijing, China, 18–19 November 2023; pp. 284–289. [Google Scholar] [CrossRef] [Scilit]
  5. Naimi, L.; Bouziane, E.M.; Jakimi, A.; Saadane, R.; Chehri, A. Automating Software Documentation: Employing LLMs for Precise Use Case Description. Procedia Comput. Sci. 2024, 246, 1346–1354. [Google Scholar] [CrossRef] [Scilit]
  6. Eramo, R.; Said, B.; Oriol, M.; Bruneliere, H.; Morales, S. An architecture for model-based and intelligent automation in DevOps. J. Syst. Softw. 2024, 217, 112180. [Google Scholar] [CrossRef] [Scilit]
  7. Bouzenia, I.; Devanbu, P.; Pradel, M. RepairAgent: An Autonomous, LLM-Based Agent for Program Repair. In Proceedings of the 2025 IEEE/ACM 47th International Conference on Software Engineering (ICSE), Ottawa, ON, Canada, 26 April–6 May 2025; pp. 2188–2200. [Google Scholar] [CrossRef] [Scilit]
  8. Ferrari, A.; Abualhaija, S.; Arora, C. Model Generation with LLMs: From Requirements to UML Sequence Diagrams. In Proceedings of the 2024 IEEE 32nd International Requirements Engineering Conference Workshops (REW), Reykjavik, Iceland, 24–25 June 2024; pp. 291–300. [Google Scholar] [CrossRef] [Scilit]
  9. Gheorghita, S.; Irimia, C.I.; Iftene, A. Automating Software Diagram Generation with Large Language Models. Procedia Comput. Sci. 2025, 270, 713–722. [Google Scholar] [CrossRef] [Scilit]
  10. Eisenreich, T.; Speth, S.; Wagner, S. From Requirements to Architecture: An AI-Based Journey to Semi-Automatically Generate Software Architectures. In Proceedings of the 1st International Workshop on Designing Software, Lisbon, Portugal, 14–15 April 2024; Designing ’24, pp. 52–55. [Google Scholar] [CrossRef] [Scilit]
  11. Yang, S.; Sahraoui, H. Towards automatically extracting UML class diagrams from natural language specifications. In Proceedings of the 25th International Conference on Model Driven Engineering Languages and Systems: Companion Proceedings, Montreal, QC, Canada, 23–28 October 2022; MODELS ’22, pp. 396–403. [Google Scholar] [CrossRef] [Scilit]
  12. Cámara, J.; Troya, J.; Burgueño, L.; Vallecillo, A. On the assessment of generative AI in modeling tasks: An experience report with ChatGPT and UML. Softw. Syst. Model. 2023, 22, 781–793. [Google Scholar] [CrossRef] [Scilit]
  13. De Bari, D.; Garaccione, G.; Coppola, R.; Torchiano, M.; Ardito, L. Evaluating Large Language Models in Exercises of UML Class Diagram Modeling. In Proceedings of the 18th ACM/IEEE International Symposium on Empirical Software Engineering and Measurement, Barcelona, Spain, 24–25 October 2024; ESEM ’24, pp. 393–399. [Google Scholar] [CrossRef] [Scilit]
  14. Al-Ahmad, B.; Alsobeh, A.; Meqdadi, O.; Shaikh, N. A Student-Centric Evaluation Survey to Explore the Impact of LLMs on UML Modeling. Information 2025, 16, 565. [Google Scholar] [CrossRef] [Scilit]
  15. Nikhil Krishnan, G.S.; Ambadi, S.; Thushara, M.G. Comparative Analysis of Large Language Models for Automated Use Case Diagram Generation. In Proceedings of the 3rd International Conference on Futuristic Technology—Volume 2: INCOFT. INSTICC; SciTePress: Setúbal, Portugal, 2025; pp. 465–471. [Google Scholar] [CrossRef] [Scilit]
  16. Dhar, R.; Vaidhyanathan, K.; Varma, V. Can LLMs Generate Architectural Design Decisions?—An Exploratory Empirical Study. In Proceedings of the 2024 IEEE 21st International Conference on Software Architecture (ICSA), Hyderabad, India, 4–8 June 2024; pp. 79–89. [Google Scholar] [CrossRef] [Scilit]
  17. Schindler, C.; Rausch, A. Formal Software Architecture Rule Learning: A Comparative Investigation between Large Language Models and Inductive Techniques. Electronics 2024, 13, 816. [Google Scholar] [CrossRef] [Scilit]
  18. Jahić, J.; Sami, A. State of Practice: LLMs in Software Engineering and Software Architecture. In Proceedings of the 2024 IEEE 21st International Conference on Software Architecture Companion (ICSA-C), Hyderabad, India, 4–8 June 2024; pp. 311–318. [Google Scholar] [CrossRef] [Scilit]
  19. Ferrari, A.; Spoletini, P. Formal requirements engineering and large language models: A two-way roadmap. Inf. Softw. Technol. 2025, 181, 107697. [Google Scholar] [CrossRef] [Scilit]
  20. Schmid, L.; Hey, T.; Armbruster, M.; Corallo, S.; Fuchß, D.; Keim, J.; Liu, H.; Koziolek, A. Software Architecture Meets LLMs: A Systematic Literature Review. arXiv 2025, arXiv:2505.16697. [Google Scholar] [CrossRef] [Scilit]
  21. Adnan, B.; Gupta, A.; Akshathala, S.; Vaidhyanathan, K. ArchBench: Benchmarking Generative-AI for Software Architecture Tasks. arXiv 2026, arXiv:2603.17833. [Google Scholar]
  22. Li, M.; Yan, S.; Zhang, L.; Liu, Y.; Liu, F. Benchmarking Requirement-to-Architecture Generation with Hybrid Evaluation. arXiv 2026, arXiv:2604.06683. [Google Scholar]
  23. Ivers, J.; Ozkaya, I. Will Generative AI Fill the Automation Gap in Software Architecting? In Proceedings of the 2025 IEEE 22nd International Conference on Software Architecture Companion (ICSA-C), Odense, Denmark, 31 March–4 April 2025; pp. 41–45. [Google Scholar] [CrossRef] [Scilit]
  24. Brown, S. The C4 Model: Visualizing Software Architecture; O’Reilly Media: Newton, MA, USA, 2026. [Google Scholar]
  25. Tsilimigkounakis, M. Exploring the Utilization of LLM Tools in Software Architecture. Master’s Thesis, School of Electrical and Computer Engineering, National Technical University of Athens, Athens, Greece, 2024. [Google Scholar]
  26. ISO/IEC/IEEE 29148:2018; Systems and Software Engineering-Life Cycle Processes-Requirements Engineering. International Organization for Standardization: Geneva, Switzerland, 2018.
  27. Sotiropoulos, G. Investigation of AI Tools Performance in the Definition of Microservices Software Architectures. Master’s Thesis, School of Electrical and Computer Engineering, National Technical University of Athens, Athens, Greece, 2025. [Google Scholar]
  28. Richardson, C. Microservices Patterns: With Examples in Java; Manning Publications: Shelter Island, NY, USA, 2019. [Google Scholar]
  29. Malhotra, N. Microservices Design Patterns; ValueLabs: Hyderabad, India, 2023. [Google Scholar]
  30. Engel, T.; Langermeier, M.; Bauer, B.; Hofmann, A. Evaluation of Microservice Architectures: A Metric and Tool-Based Approach. In Proceedings of the Information Systems in the Big Data Era; Springer: Cham, Switzerland, 2018; pp. 74–89. [Google Scholar] [CrossRef] [Scilit]
  31. Bogner, J.; Wagner, S.; Zimmermann, A. Towards a practical maintainability quality model for service-and microservice-based systems. In Proceedings of the 11th European Conference on Software Architecture: Companion Proceedings, Canterbury, UK, 11–15 September 2017; ECSA ’17, pp. 195–198. [Google Scholar] [CrossRef] [Scilit]
  32. Bogner, J.; Wagner, S.; Zimmermann, A. Automatically measuring the maintainability of service- and microservice-based systems: A literature review. In Proceedings of the 27th International Workshop on Software Measurement and 12th International Conference on Software Process and Product Measurement, Gothenburg, Sweden, 25–27 October 2017; IWSM Mensura ’17; pp. 107–115. [Google Scholar] [CrossRef] [Scilit]
  33. Object Management Group. XML Metadata Interchange (XMI) Specification; Version 2.5.1, Technical Report; OMG: Needham, MA, USA, 2015. [Google Scholar]
  34. Pan, F.; Petrovic, N.; Zolfaghari, V.; Wen, L.; Knoll, A. LLM-enabled Instance Model Generation. arXiv 2025, arXiv:2503.22587. [Google Scholar] [CrossRef] [Scilit]
  35. Bucaioni, A.; Di Salle, A.; Iovino, L.; Pelliccione, P.; Raimondi, F. Architecture as Code. In Proceedings of the 2025 IEEE 22nd International Conference on Software Architecture (ICSA), Odense, Denmark, 31 March–4 April 2025; pp. 187–198. [Google Scholar] [CrossRef] [Scilit]
Figure 1. Workflow of executed experiments.
Ai 07 00195 g001
Figure 2. Inter-rater reliability per evaluation dimension and experimental configuration.
Ai 07 00195 g002
Figure 3. Example of a correct 3-tier architecture generated by Llama3.1 using FR1/NFR1 requirements. Available at: DCC FR-NFR 3-tier ID = 85 (https://github.com/ntua/ai4softwarearch/tree/main/DCC/fr-nfr/results/tt111/diagrams/85.png, accessed on 30 April 2026).
Ai 07 00195 g003
Figure 4. Example of an incorrect MVC architecture generated by Gemini using FR1/NFR1 requirements. Available at: DCC FR-NFR MVC ID = 234 (https://github.com/ntua/ai4softwarearch/tree/main/DCC/fr-nfr/results/mvc111/diagrams/234.png, accessed on 30 April 2026).
Ai 07 00195 g004
Figure 5. Example of a more coherent MVC architecture generated by Gemini using SRS1 requirements. Available at: DCC SRS MVC ID = 69 (https://github.com/ntua/ai4softwarearch/tree/main/DCC/srs/results/mvc111/diagrams/69.png, accessed on 30 April 2026).
Ai 07 00195 g005
Figure 6. Example of a weaker 3-tier architecture generated by Gemma2:27b using SRS1 requirements with RAG enabled. Available at: DCC SRS 3-tier ID = 10 (https://github.com/ntua/ai4softwarearch/tree/main/DCC/srs/results/tt111/diagrams/10.png, accessed on 30 April 2026).
Ai 07 00195 g006
Figure 7. Example of a correct 3-tier architecture generated by Gemma2:27b using FR1/NFR1 requirements with RAG enabled. Available at: DCC FR-NFR 3-tier ID = 23 (https://github.com/ntua/ai4softwarearch/tree/main/DCC/fr-nfr/results/tt111/diagrams/23.png, accessed on 30 April 2026).
Ai 07 00195 g007
Figure 8. Example of an incorrect 3-tier architecture generated by Gemma2:27b using FR1/NFR1 requirements without RAG. Available at: DCC FR-NFR 3-tier ID = 21 (https://github.com/ntua/ai4softwarearch/tree/main/DCC/fr-nfr/results/tt111/diagrams/21.png, accessed on 30 April 2026).
Ai 07 00195 g008
Figure 9. Average performance per model across all experiments. Asterisk indicates local LLMs.
Ai 07 00195 g009
Figure 10. Effect of using SRS vs text in DCC ( Δ = SRS − text). Asterisk indicates local LLMs.
Ai 07 00195 g010
Figure 11. Effect of using SRS vs text in MyCharts ( Δ = SRS − text). Asterisk indicates local LLMs.
Ai 07 00195 g011
Figure 12. Effect of using RAG in DCC across input types ( Δ = average scores with RAG applied − average scores with no RAG applied). Asterisk indicates local LLMs.
Ai 07 00195 g012
Figure 13. Effect of RAG configurations and chunking strategies on evaluation dimensions in Phase 1.
Ai 07 00195 g013
Figure 14. Effect of RAG in MyCharts across input types ( Δ = average scores with RAG applied − average scores with no RAG applied). Asterisk indicates local LLMs.
Ai 07 00195 g014
Figure 15. Correctness of LLM-reported metrics compared to human-calculated values. Asterisk indicates local LLMs.
Ai 07 00195 g015
Figure 16. Reusable experimental workflow for evaluating LLM-generated software architectures.
Ai 07 00195 g016
Table 1. Architecture-level and service-level metrics.
LevelMetricDefinition
Architecture  Statelessness index S I = # stateless services total services
Data ownership coverage D O C = # services with own datastore total services
Service transaction share S S T = # transaction - aware services total services
ServiceService interface complexity S I C ( S ) = # operations of service S
Afferent service coupling A I S ( S ) = # services invoking S
Efferent service coupling A D S ( S ) = # services invoked by S
Disclaimer/Publisher’s Note: The statements, opinions and data contained in all publications are solely those of the individual author(s) and contributor(s) and not of MDPI and/or the editor(s). MDPI and/or the editor(s) disclaim responsibility for any injury to people or property resulting from any ideas, methods, instructions or products referred to in the content.