1. Introduction
This article evaluates the attraction and suitability of an urban environment based on human responses. The human body is used as a measuring instrument that integrates obvious response features with several subtle channels of informational communication. Based on the processed information, a user reacts by making decisions on everyday actions, such as movement along a street. Incoming information is strongly biased toward the visual channel because informational input to the brain is predominantly visual. For this reason, we expect reasonably accurate results when using photos in a survey. Of course, a photo cannot replace the actual site because it lacks the real-time experience of other channels of sensory information (sound, smell, and touch).
Beneath this apparently simple diagnostic tool lies a methodological and philosophical approach to urban design that we make explicit in this paper. We follow the work of Christopher Alexander [
1,
2] in accepting that the physical environment shapes human physiological states and, consequently, people’s behavior. Yet this influence is in large part subconscious. For this reason, trying to judge urban design by means of standard criteria is limiting at best, since there are so many other factors that contribute to a user’s experience of the built environment. This line of reasoning, originally deemed contrary to abstract urban design based on formalist principles, is now supported by recent experimental measurements based on neurophysiology. Wang et al. [
3] offer a clear introduction to neuro-architecture, a branch of neuroscience that examines how the human brain responds to and interacts with the built environment, along with its limitations. Karakas and Yildiz [
4] recently proposed a survey that systematically examined the corresponding emerging concepts at the intersection of architecture and neuroscience. Other authors proposed surveys of neuroarchitecture assessment, such as Ghamari et al. [
5] or Higuera-Trujillo et al. [
6]. One aim of the present study is to make readers aware of this work by other researchers who are establishing the neurophysiological basis for how the body reacts to urban geometry and all its visual components.
The human body reacts instinctively to every piece of information presented in its immediate environment: built structures, changes of level, vegetation, street furniture, wall surfaces, and enveloping geometries both horizontally (curved walls and entrances) and vertically (overhangs) [
5,
6]. In an urban setting, kinetic information of moving vehicles and other pedestrians adds to evaluating the place for the observer’s own safety. For example, the presence of bollards lining the street can make a sidewalk feel instinctively safer, even though the user does not notice the reason immediately. We can understand all of those reactions, acting unconsciously, because the body reacts to evolved neurocircuits that developed for human (and animal) survival in natural environments. Geometrical and other information from the environments determines bodily states and influences decisions unconsciously. People find positive valence reactions from natural settings, a topic that is now being investigated in the context of nature-induced healing, such as Seresinhe et al. [
7], who investigate the features that make outdoor spaces aesthetically pleasing and explore whether places perceived as beautiful differ from those that are simply natural. It is worth pointing out that traditional healthcare included the influence of natural settings in promoting well-being, while new experiments establish a strong nature-health correlation.
Historically, personal surveys and questionnaires were the standard means of assessing user reactions to urban environments, whether related to geometry or other features of usability. However, that method fails to separate opinion (due to socio-cultural norms) from actual physiological responses. Nowadays artificial intelligence (AI) is rapidly replacing humans for many evaluative assessments, as it proves easier to disentangle pure body reactions from learned preferences. One aim of this paper is to compare how humans and AI—specifically, Large Language Models (LLMs)—can evaluate an urban setting for its attractiveness to users. This work is focused on the user feeling at ease and is not directed towards any aesthetic or “design” goal. The results are compelling and are intended to provoke further research.
A key aim of this investigative comparison is to establish criteria by which a large-scale survey could be duplicated by the clever use of LLMs. The reason is that statistically significant public surveys depend upon a large number of participants. This makes them both cumbersome and expensive to set up and administer. By contrast, LLMs can be used immediately with the appropriate set of prompts. The result is instantly available and infinitely repeatable. Although LLM simulation of human subjects is not yet developed to a sufficiently high level, promising developments in AI will make this an increasingly approachable research goal. At some point in the future, therefore, we expect to be able to evaluate the human-centered qualities of urban environments using Large Language Models. That is, to use generative AI to predict how humans will react to a built environment based upon their human, emotional sensing. Once this goal is achieved, opportunities for both research and applied design become apparent. Several authors have already applied LLMs to evaluate the “human” qualities of urban environments, with unexpected success. Some points for investigation can be listed here:
Recursion in evaluating streetscapes and open urban space can identify features to be improved and also test possible solutions virtually for their efficacy. Feedback is almost immediate.
Urban designs can be evaluated by presenting a spectrum of variations, while an LLM selects from among them. The process of variation and selection can be repeated indefinitely, leading to convergence on an ideal human-centered design solution.
It would be useful to develop an evaluative tool that requires little overhead and can be applied recursively without costs. We draw the analogy with traditional urban design features that developed over generations of trial and error, paralleling the classic model of organismic evolutionary development through trial selection. The drastic difference is that historical urban fabric evolved towards optimal form over years and centuries, whereas we hope to duplicate this process through AI acting on the very short time scale of a standard design project.
Investigations of LLMs for urban planning from street view pictures are recent: their applications range from the analysis of road safety, comparison of walkability preferences from pairwise images, perception of streetscape changes, saliency modeling, and architectural aesthetics or urban attractiveness. On the application of road safety, Zhang et al. [
8] input two street view images simultaneously into an LLM to determine which image is perceived as safer, Tang et al. [
9] unveiled road safety factors with LLM, whereas Cheng et al. [
10] proposed to integrate LLM for safety within a digital twin framework. Wedyan et al. [
11] used ChatGPT to compare pairs of images to rank walkability preference. Xiao et al. [
12] as well as Liang et al. [
13] investigate how LLMs perceive changes in streetscapes, assessing whether they interpret these transformations as improvement or deterioration. Other authors, such as Zhu et al. [
14] or Zhang et al. [
15,
16], proposed methods for saliency prediction. In a more holistic approach, Malekzadeh et al. [
17] assessed the performance of ChatGPT when scoring urban attractiveness from a single street view image, while Zhou et al. [
18] proposed to use ChatGPT to rank a set of images based on attractiveness and accessibility.
The possibilities of applying AI to urban planning are endless, as described by Laurini [
19]. They comprise distinct tools at very different scales. On the scale of a city, distinct overlapping flow networks can be optimized through AI. Here, the focus is on the human dimensions of urban space and, in particular, street space. Analyzing the emotional responses of pedestrians on a sidewalk gives a much clearer picture of which urban design elements contribute towards—versus which detract from—the urban experience. Again, we emphasize our focus on emotional and physical well-being, as opposed to being concerned strictly with the mechanical efficiency of urban functions that is now standard, as described by Mouratidis [
20].
In contrast to top-down urban planning, where streets are drawn on a plan to optimize some traffic functions, the physical and emotional experience of a street setting is shaped by complex visual and spatial interactions that are not yet part of standard planning practice. These interactions of the human body with the geometry of the environment occur on a much more intimate range of scales: these are defined by the physical scales of the human body, from its immediate reach to its height to its components (arm, hand, and eye, etc.). Here, we observe the principle of welcoming space: pedestrian use will increase only where people feel an emotionally welcoming atmosphere. Among the major factors contributing towards this positive state, the complex geometry of the environment plays an important, though often neglected, role. This is what we try to measure in this paper.
Attempting to assess the users’ reaction to a multitude of informational signals in real time proves to be an impossible task in physical situations. Nevertheless, recent technical tools such as portable sensors and virtual reality dynamic analysis in the laboratory make such measurements feasible. We hope to use image analysis carried out by Large Language Models to approximate human reactions to the urban information field. Towards this goal, the prompts to the LLM are phrased in terms of human emotions, not abstract geometrical concepts. Since the training base for LLMs covers open-source data on how humans react to a multitude of urban elements and settings, the LLM can indeed gather distributed information to give an accurate answer.
An analysis of AI-simulated cognition is proposed: not just testing an LLM’s language skills, but its ability to integrate a visual stimulus with an adopted point of view to produce a subjective response that mimics human perception. The following two research questions (RQ) can be formulated:
RQ1: Can an AI agent’s evidence-based rating be used as a substitute for human subjective perception? More precisely, we measure how closely the subjective perceptions simulated by Gemini and ChatGPT align with the median subjective perceptions of a sample of human participants when evaluating an urban environment.
RQ2: In the subjective assessment of an urban environment, which multimodal Large Language Model—Gemini or ChatGPT—demonstrates a higher degree of correlation with the average subjective ratings of human participants across statements requiring a mix of objective visual analysis and simulated aesthetic and emotional perception? The second research question is about the performance differences between ChatGPT and Gemini when tackling a subjective, visual perception task. How do the ratings differ when comparing human raters, Gemini, and ChatGPT on a 5-point Likert-scale assessment of specific aesthetic, safety, and functional attributes of a visual urban environment?
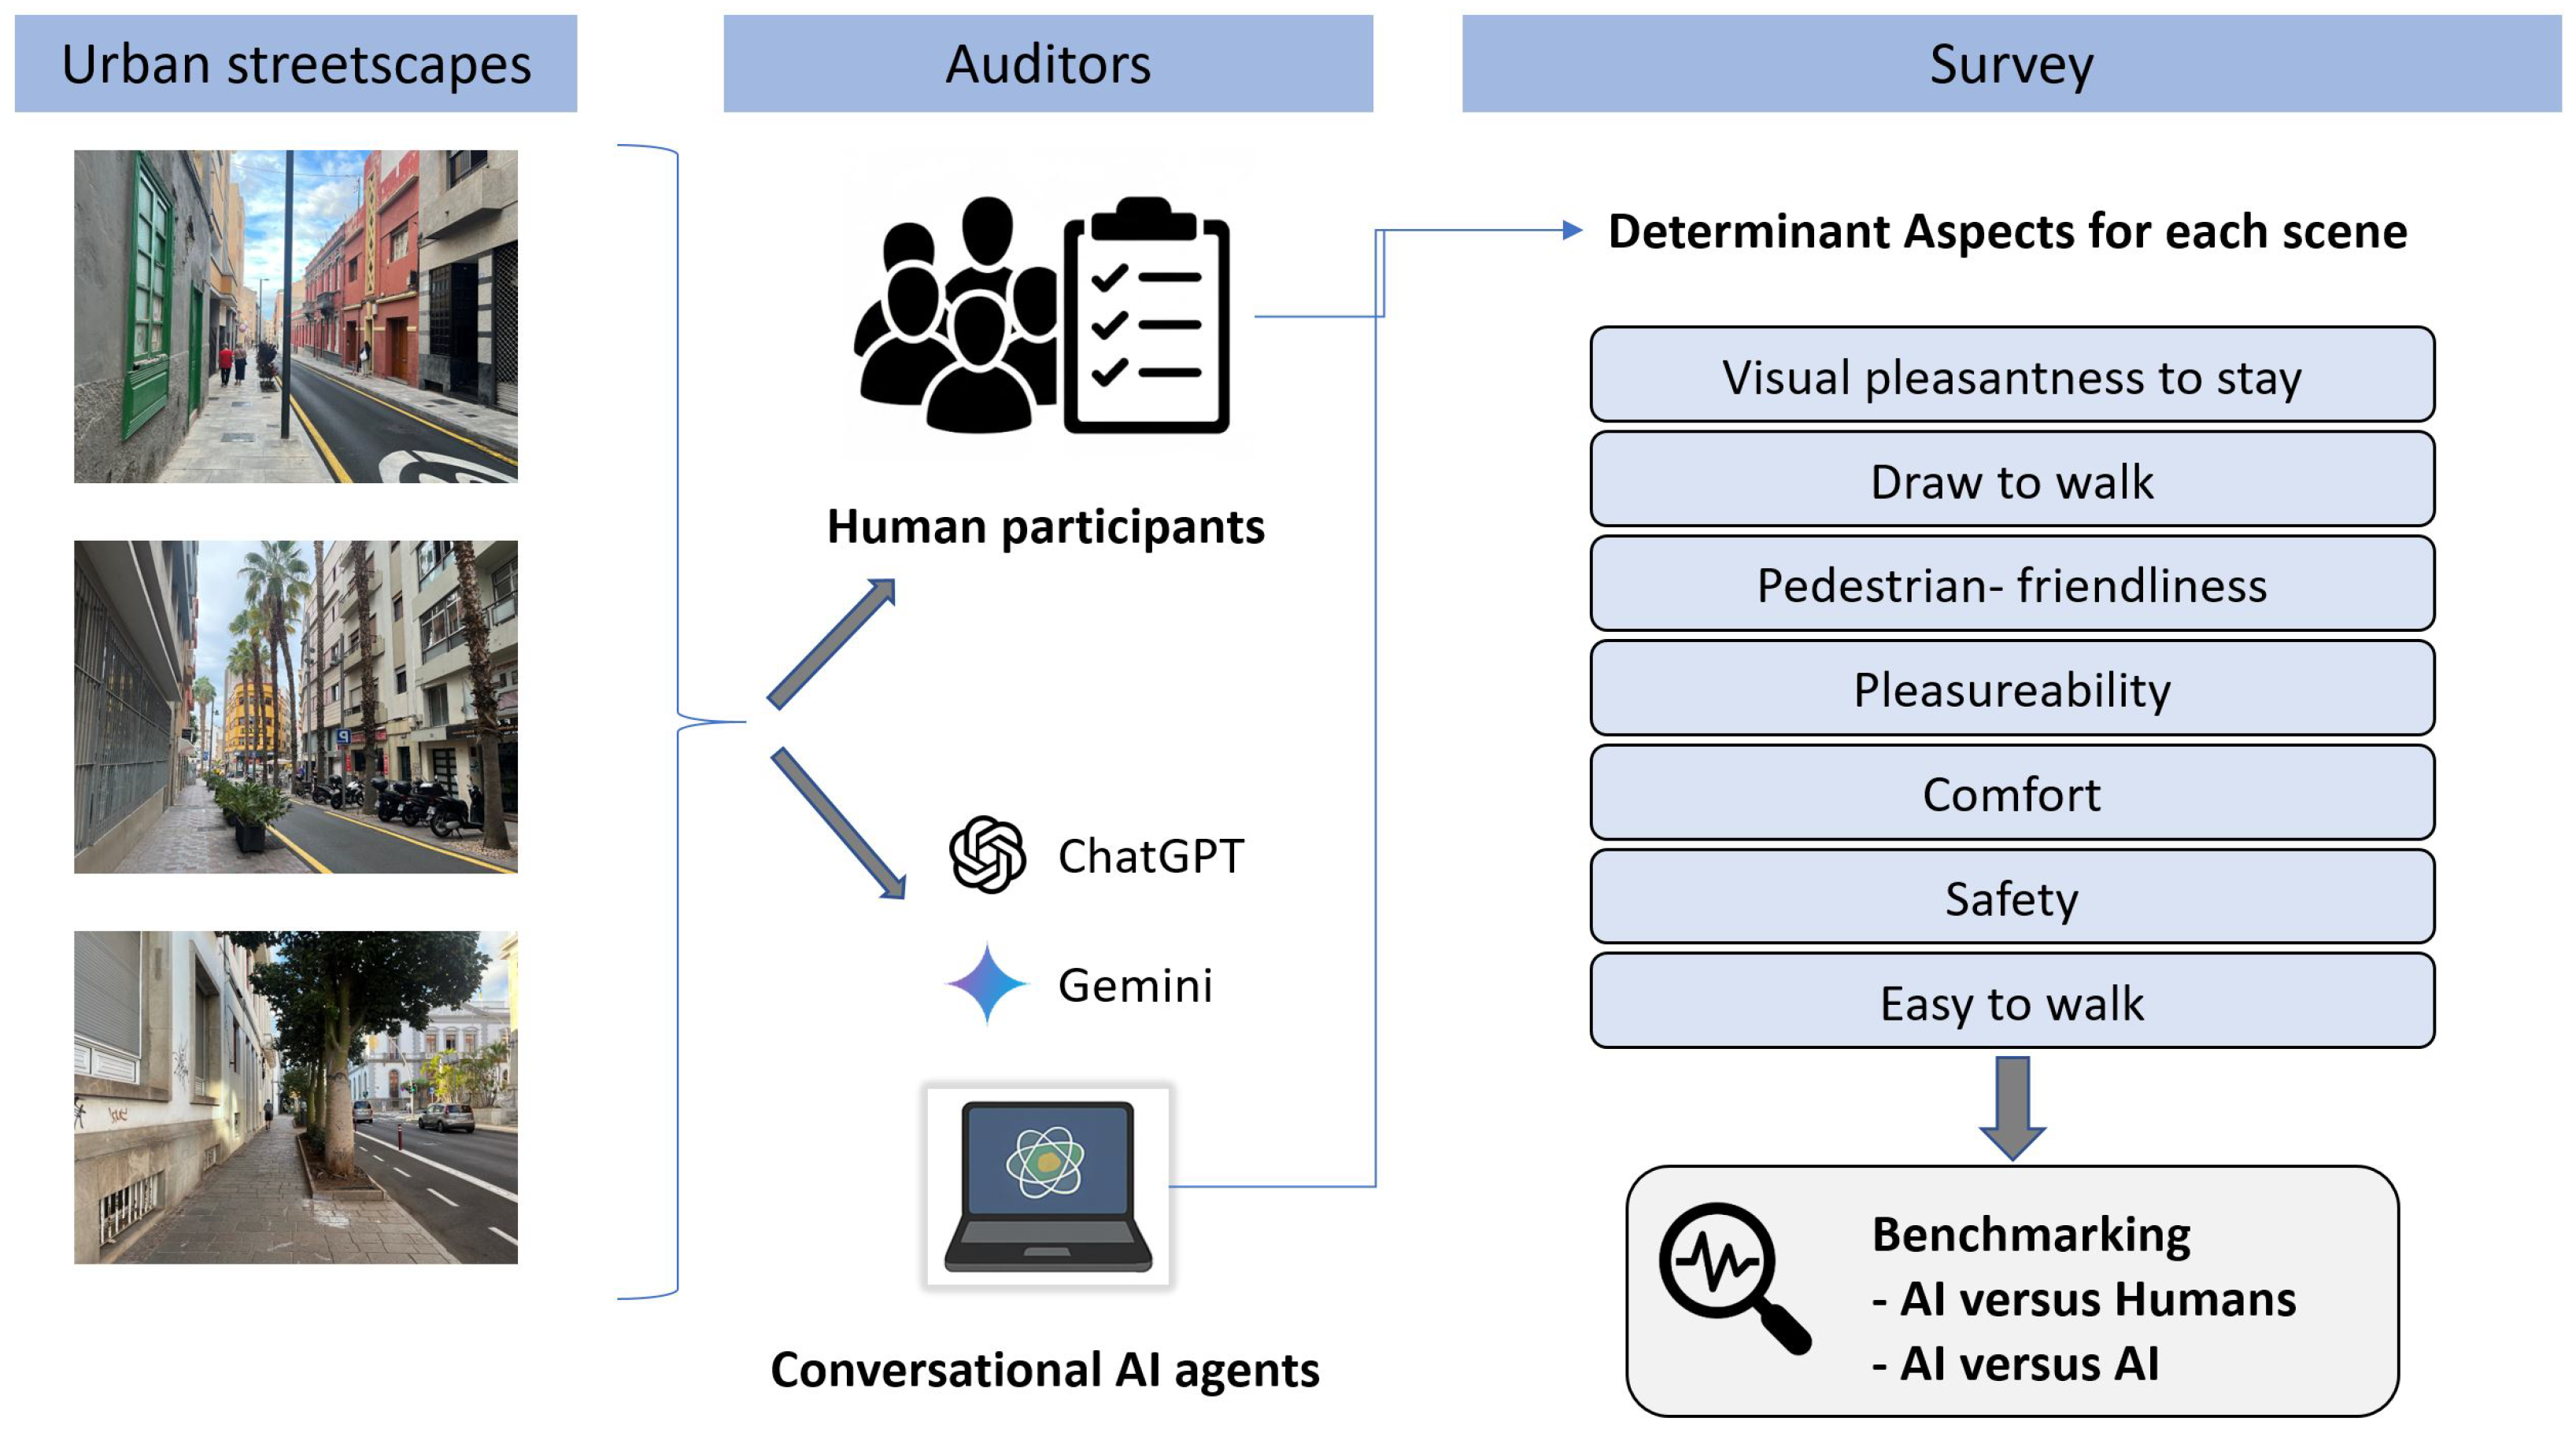
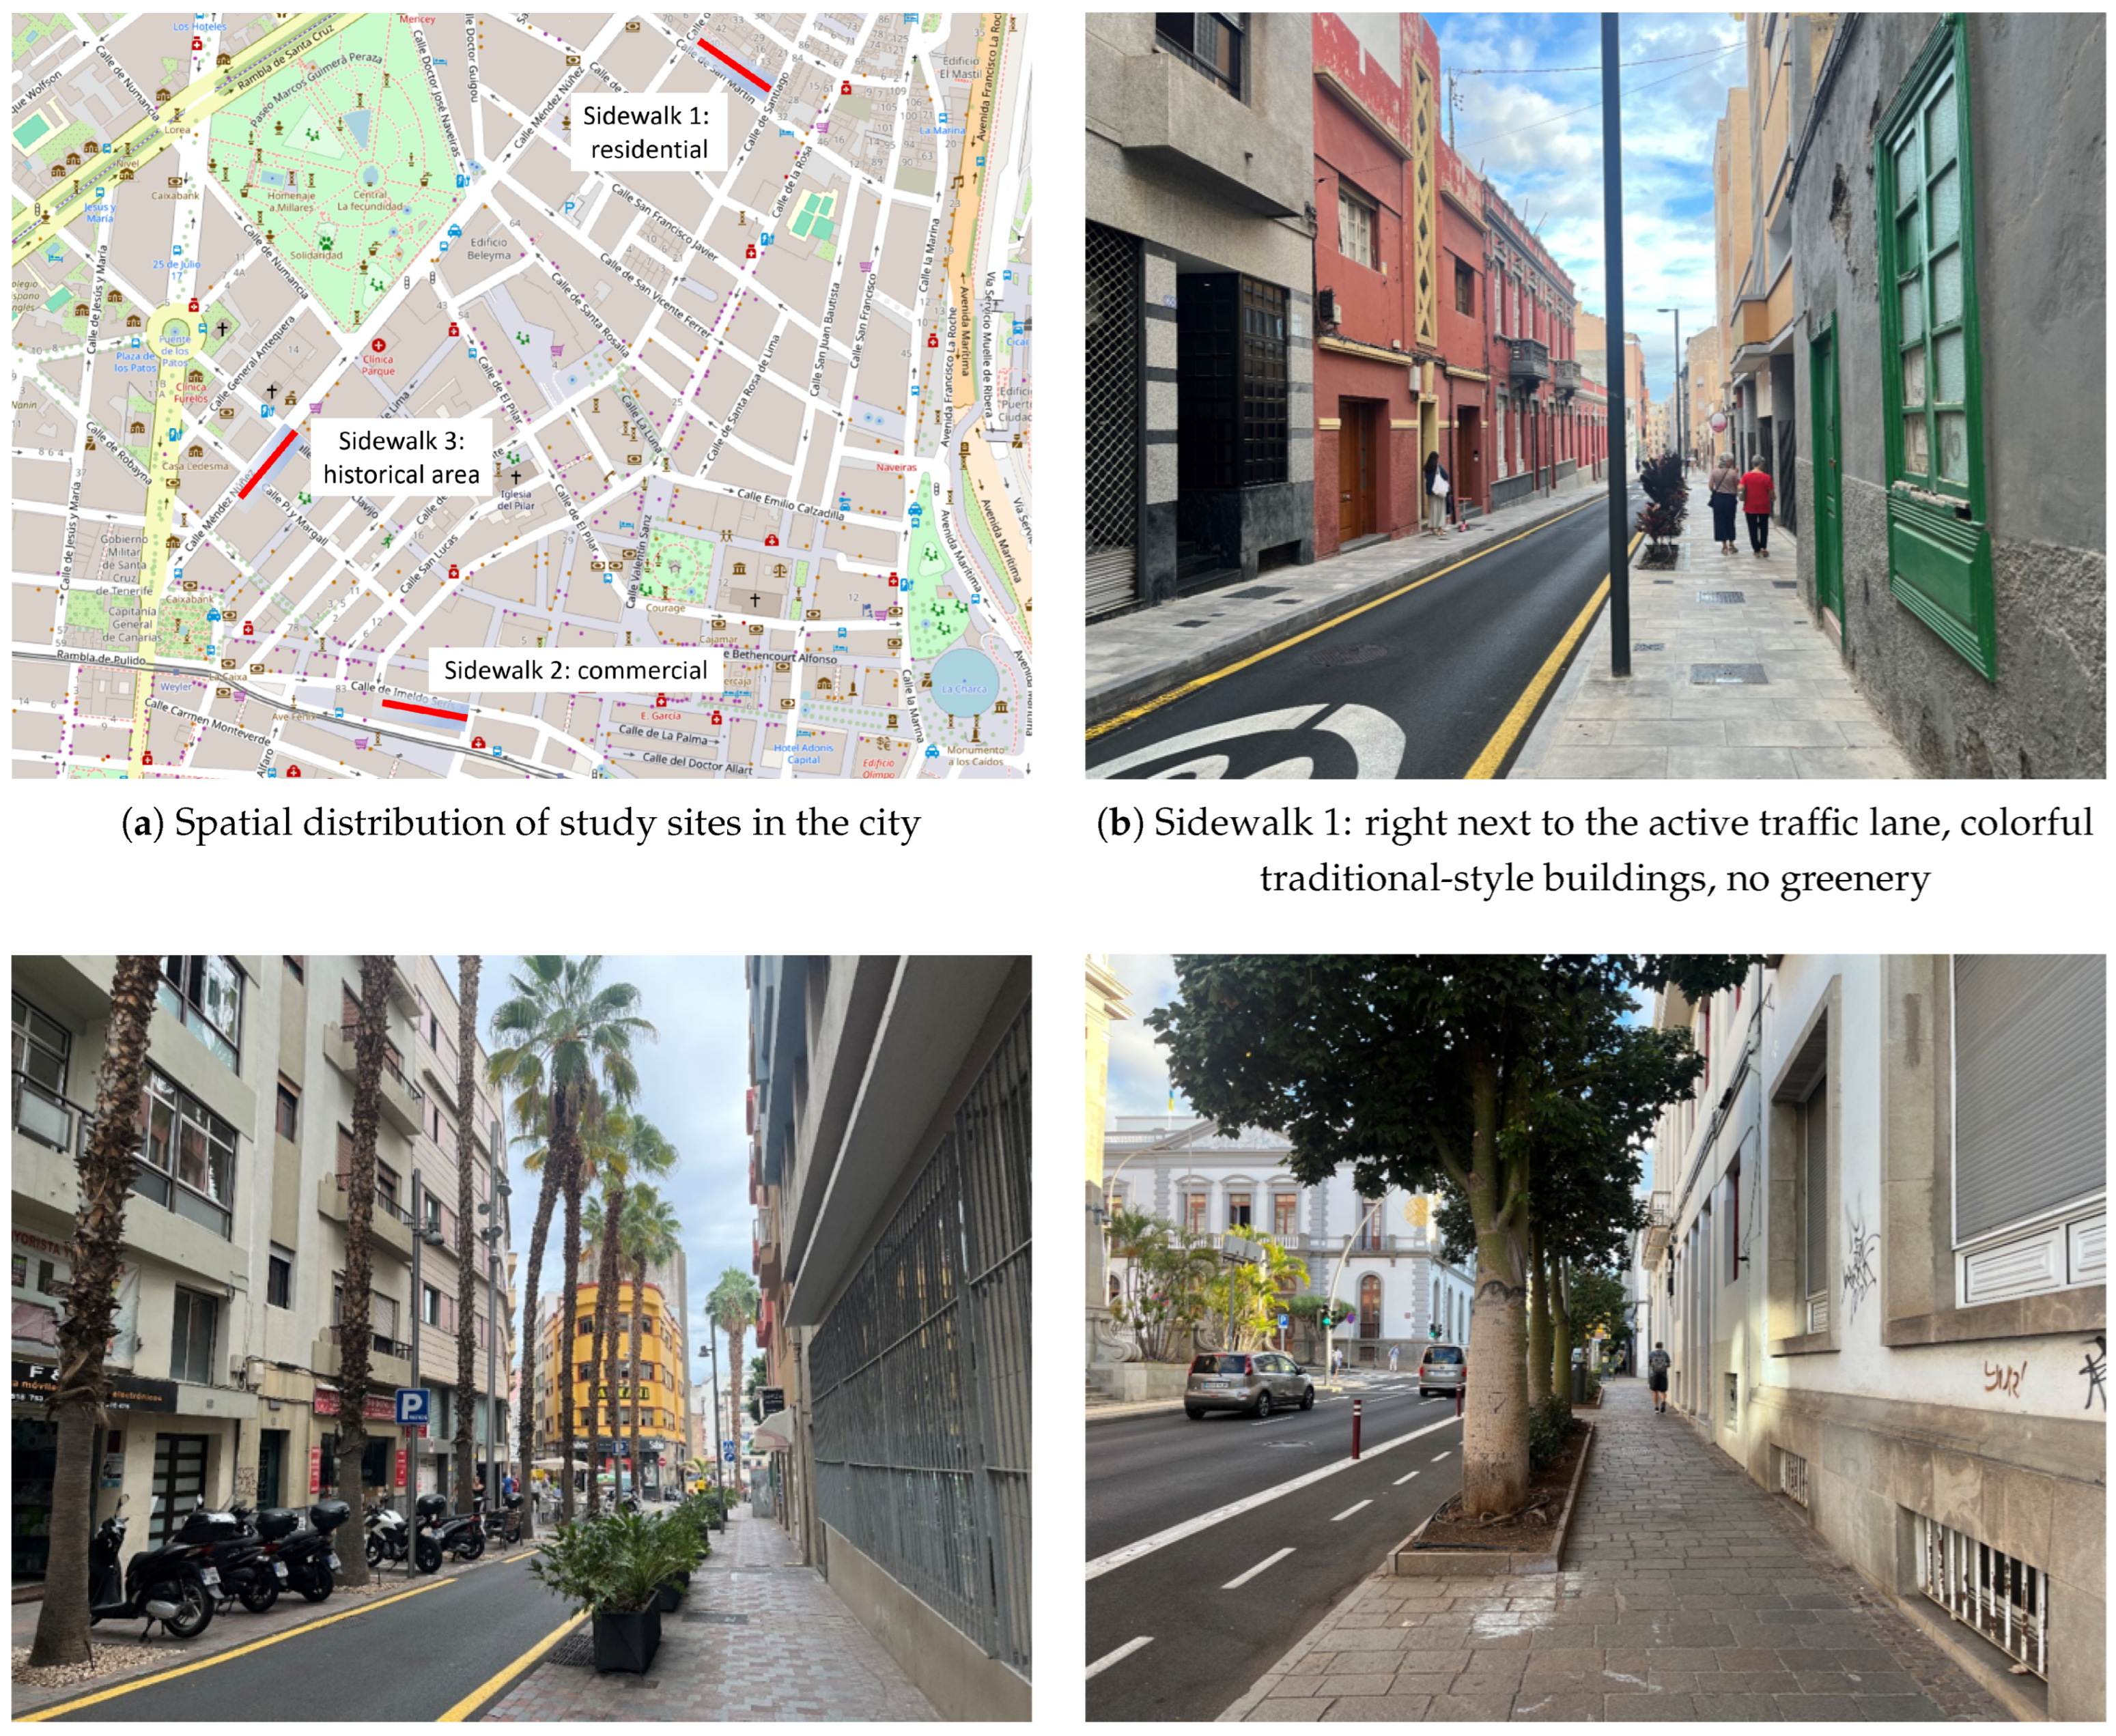
In this study, our research question focuses on the analysis of an urban environment by two AIs, based on photographs of the city of Santa Cruz, Spain. First, we analyze four factors of Alfonzo’s hierarchy of walking needs [
21] related to the urban form. For each of these walking needs, human raters and the AI chatbots assessed a statement selected from the protocol proposed by Lindelow et al. [
22]. Second, we evaluate a more global descriptor of the overall feeling of the urban scenes following a methodology previously proposed in the literature. Third, we analyze the auditing of two factors related to the influence of the built environment on well-being.
This investigation is designed as a pilot study to test the feasibility of using multimodal LLMs in urban auditing. Rather than providing an exhaustive technical standard, this exploratory research utilizes a small-scale experiment to evaluate the nuances of AI-human alignment within a highly controlled setting. While the results must be interpreted with caution due to the focused selection of three illustrative cases, by prioritizing the depth of consensus and the qualitative mechanisms of agreement over a large representative corpus, this work serves as a starting point for determining how AI might eventually supplement human auditors in the field. This targeted approach ensures that the human participants could provide the high level of attention required for detailed inspections, thereby establishing a high-fidelity baseline for this preliminary comparison.
Human-led urban auditing is a bottleneck for creating healthy cities, and AI “simulated cognition” is a necessary solution. Traditional urban audits require physical site visits or manual surveys. This makes it impossible to audit entire cities or compare thousands of street-level designs in real-time. Without scalable tools, urban planning remains reactive rather than proactive. Poorly designed environments lead to lower well-being and reduced walkability, but we lack the “eyes” to evaluate every street. The present research is not just a test; it is a preliminary validation of AI tools that could theoretically audit a million street views in hours, using a psychologically grounded framework. Current automated systems excel at objective feature extraction but lack the capacity for subjective appraisal—the simulated cognition required to evaluate an environment’s influence on well-being and safety. Recent approaches testing the use of an LLM remain on a holistic assessment level (general safety or visual appeal), failing to capture the subjective lived experience that determines whether people actually choose to walk, linger, or avoid a place. Without scalable methods to evaluate this experiential dimension, urban design risks remaining optimized for vehicles and abstract efficiency—rather than for human comfort, safety, and joy. This research represents an initial step in investigating whether emerging LLMs might eventually bridge the gap between automated data collection and subjective human experience. By testing AI-simulated perceptions against human consensus in this focused context, we offer a preliminary exploration into the feasibility of more scalable, psychologically informed urban auditing.
The novelty of the approach is that we adopt a specific human centric lens (e.g., a pedestrian) to analyze visual stimuli, testing the AI’s ability to bridge low level visual features with high level cognitive appraisals. But instead of general image tagging, we propose a prompting framework based on environmental psychology theory. We map AI responses to three distinct psychological dimensions: functional hierarchy (accessibility, safety, and comfort) based on Alfonzo’s Walking Needs, holistic synthesis representing an overall streetscape perception, and affective well-being (place and distance) measuring the environment’s emotional draw. We thus provide an empirical test of Alfonzo’s walking needs hierarchy within the context of LLMs. We also identify the specific urban attributes where AI intuition fails compared to human lived experience, highlighting the current limits of LLM visual reasoning in environmental psychology, on selected, specific conditions. We examine which model architecture more effectively correlates with the average human observer when the task requires an affective rather than a purely descriptive response.
The comparative analysis of this exploratory research rests upon four fundamental evidentiary pillars: median-based measures of central tendency, interquartile range for repeatability assessment, violin and boxplot distribution visualizations, and intraclass correlation coefficients. This analysis goes beyond simple correlation and addresses the stochastic nature of AI outputs. Median values provide a robust consensus measure for subjective Likert data, the interquartile range serves as a measure of intra-model stability and the spread among human ratings, identifying which factors are the most subjective and less likely to be captured by the AI. Violin plots are employed to indicate the density of human and AI sentiments for each aspect that is measured, while the intraclass correlation coefficient provides a statistic descriptive of absolute agreement. These tools together provide a detailed and reproducible metric for determining how far a human audit can agree with an impartial AI prompt. These results are exploratory and context-dependent. They provide an illustrative foundation for the potential integration of AI tools in sidewalk assessments, paving the way for more extensive studies to validate these initial observations across diverse urban environments.
The remainder of this paper is structured as follows:
Section 2 describes the methods, audited aspects, and data used in the study.
Section 3 presents the experimental results obtained from the comparative analysis of human ratings and AI output.
Section 4 provides a framework for discussing the results, while
Section 5 outlines the limitations of the work. Finally,
Section 6 offers the conclusions and outlines directions for future research.
3. Experimental Results
This section reports the results obtained based on the proposed statements, broken down into the three categories of audited aspects: walking needs, overall impressions, and environmental aspects influencing well-being. Results are reported statement by statement. Based on visual comparisons of the rating distributions, the median rating differences and the statistical dispersion of the distribution are measured by the interquartile range. Finally, the reliability and agreement of each conversational AI agent with human raters are assessed using intraclass correlation, which provides a statistical descriptive measure of how interchangeable AI and humans are as raters. Summary statistics of ratings can be found in
Table A1 and
Table A2.
It is important to note that these findings represent an exploratory analysis of the three specific urban environments selected for this pilot study. The resulting claims should be viewed as illustrative rather than exhaustive: they are intended to provide an in-depth examination of these specific, well-defined contexts. The scope of these conclusions is inherently linked to the specific sidewalk characteristics investigated. Consequently, they serve as a methodological proof-of-concept that warrants further investigation across a broader range of urban settings.
3.1. Urban Form: Walking Needs
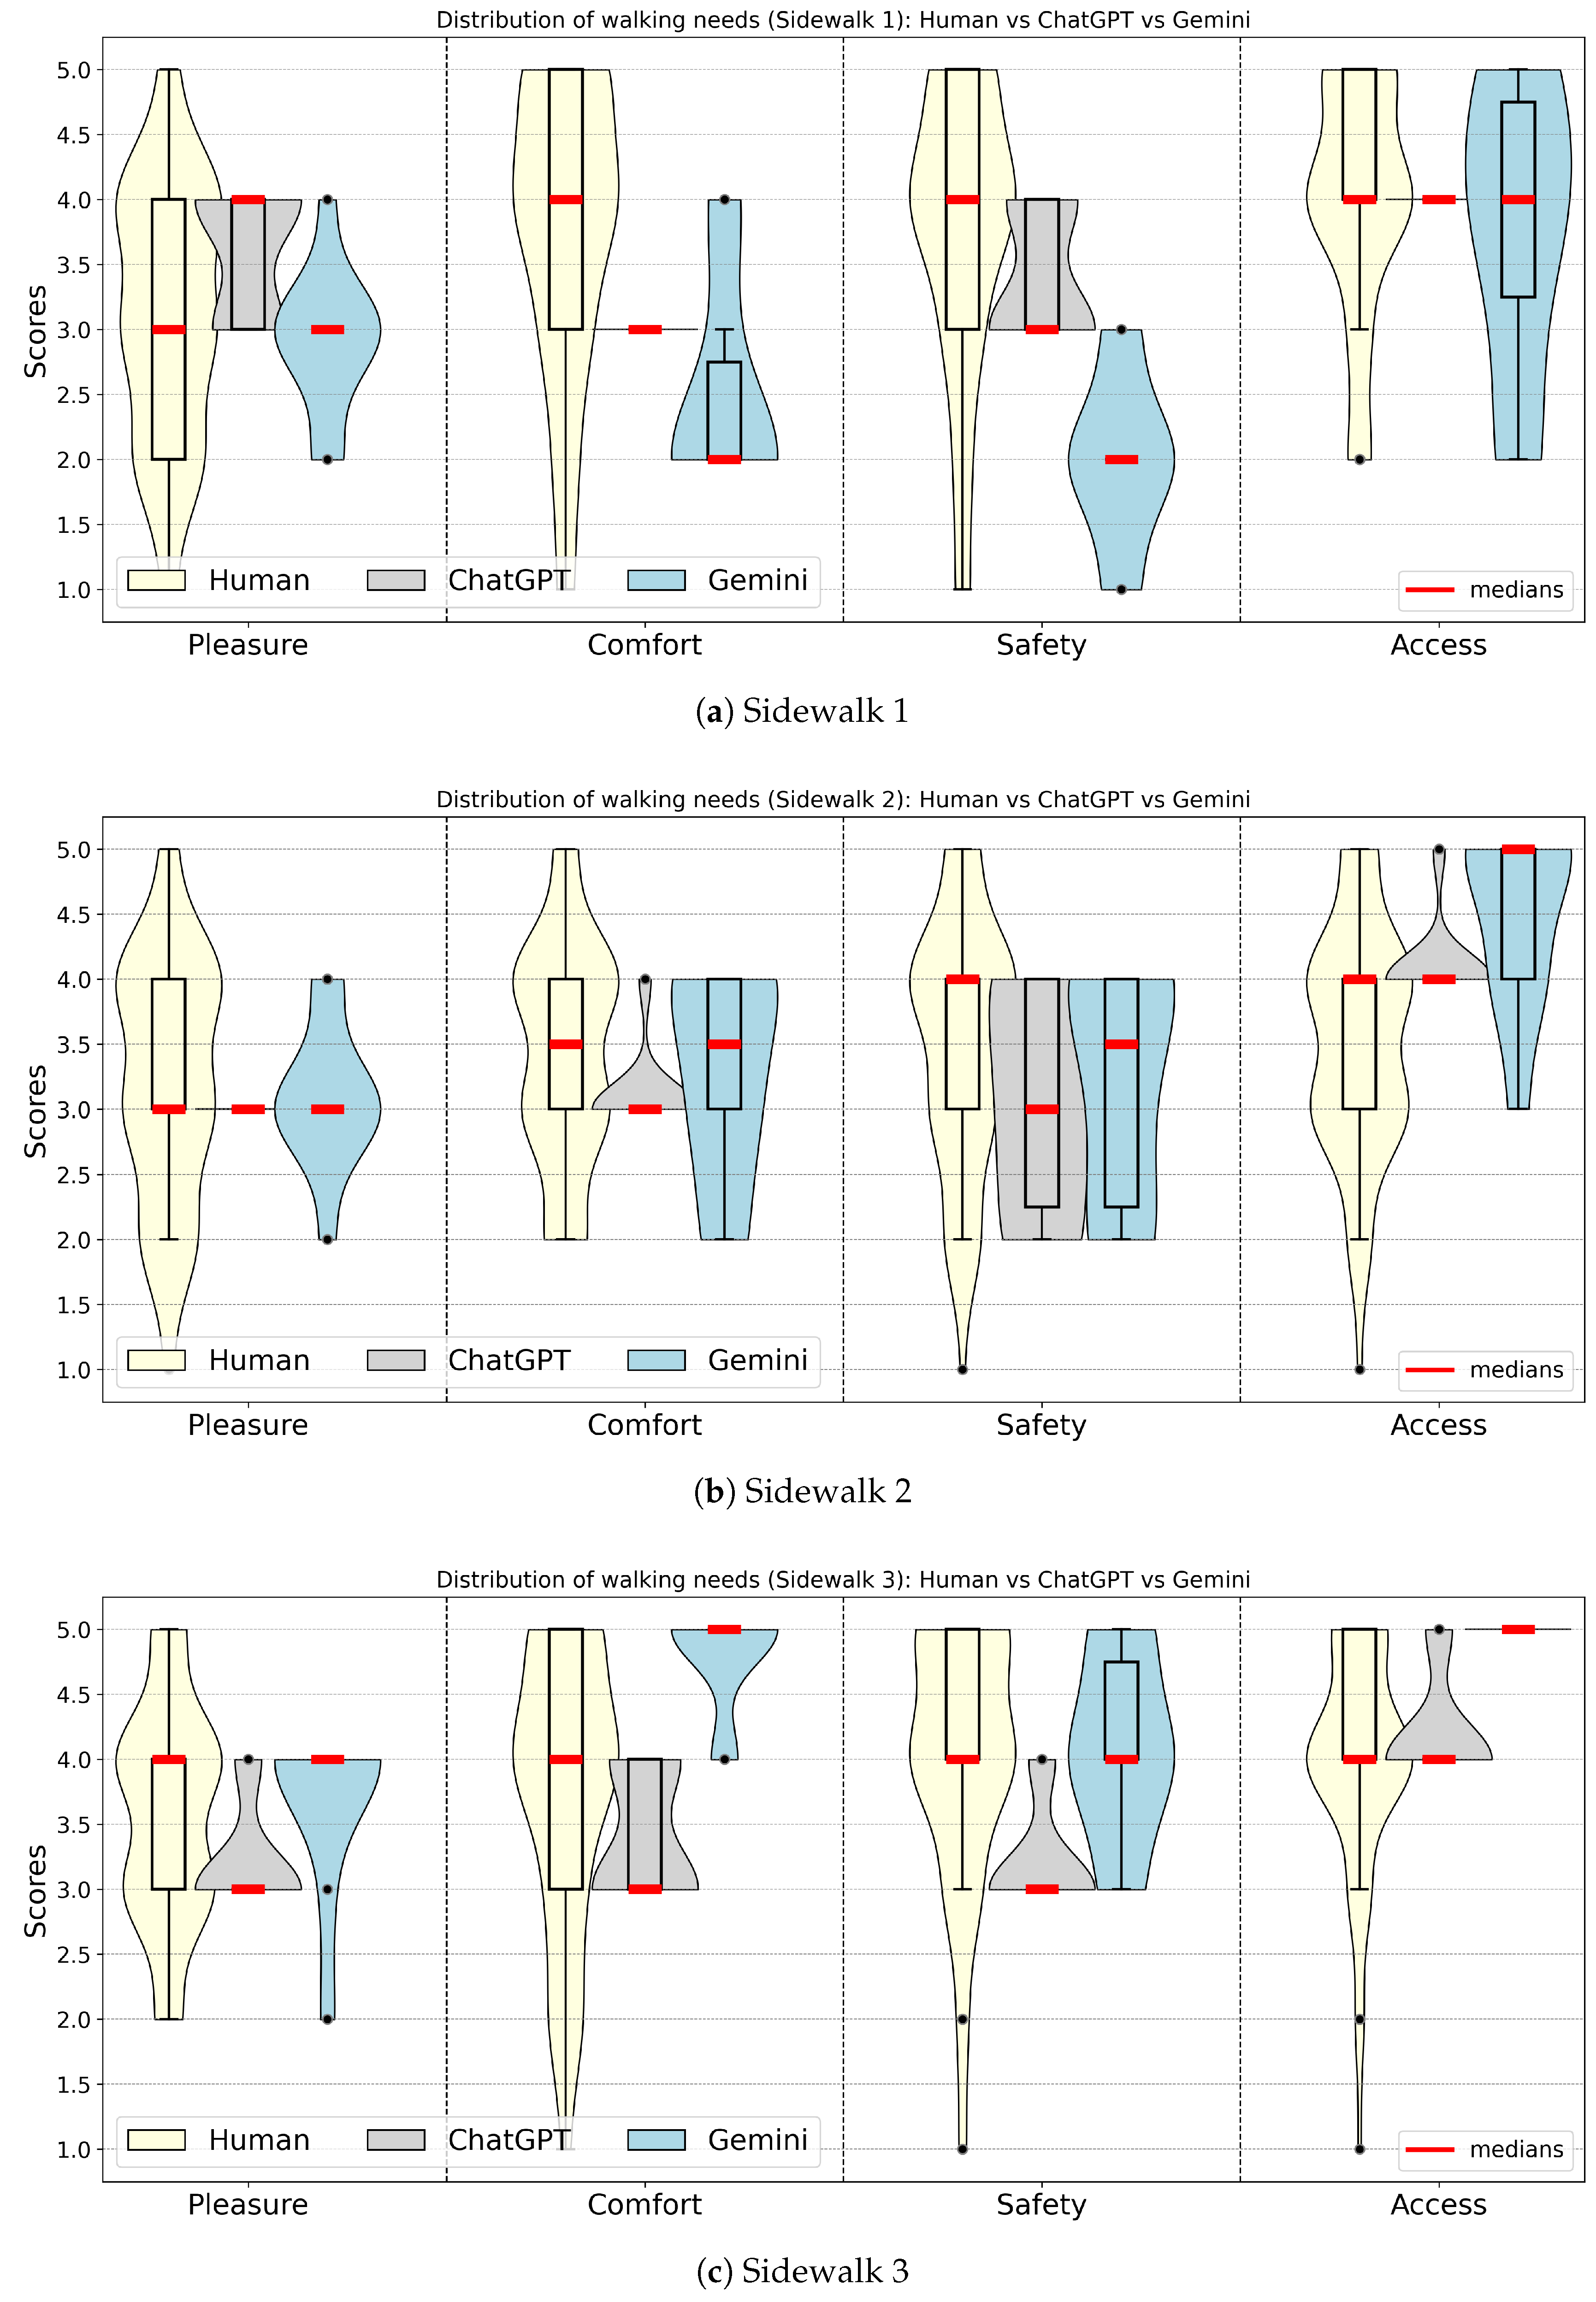
The yellow violin plots in
Figure 4 show the distribution of human ratings for the four criteria abbreviated as Pleasure, Comfort, Safety, and Access. The distribution of ChatGPT output for each criterion and each sidewalk is drawn in gray. For each case, the third distributions in light blue come from Gemini responses. Boxplots of each distribution are also drawn in order to show the interquartile range—the difference between the 75th and 25th percentiles of the data—as well as the spread of the data. The median of each distribution is the red segment. Comparing the location of this segment across the three groups for each image and each walking needs item is the most straightforward way to assess the central tendency of their ratings.
There are three sidewalks, and for each one, four aspects of walking needs are rated, resulting in twelve distributions for each rater. Out of twelve, four human rating distributions have an IQR = 2, which shows a large spread of opinions, while the remaining eight have an IQR = 1, which is a small spread in the opinions. Most of the cases of uncertainty are human opinions on a statement oscillating between neutral and agree or neutral/agree/strongly agree, with the notable exception of pleasurability of Sidewalks 1 and 2, for which the opinions showed three modes: disagree, neutral, and agree.
Eight out of twelve ChatGPT distributions, illustrated in gray in
Figure 4, have an IQR of 0, showing extreme confidence and repeatability in its output. Three ChatGPT distributions have an IQR = 1 for rulings oscillating between Neutral and Agreement within walking needs statements. Gemini is less confident or more nuanced with half of its distributions with an IQR = 0, and 4 out of 12 distributions with an IQR
1. Gemini also shows more outliers than ChatGPT, making it a little less consistent a priori.
To compare the three appraisers (human, ChatGPT, and Gemini), using the median of the responses is preferable to the mean for several reasons. Subjective rating data such as Likert-type scores are ordinal and not numerical intervals, they often contain outliers, and they frequently show unequal variance across raters. In particular, humans ratings are rarely normally distributed but mostly bimodal or trimodal, as seen in nearly all twelve yellow distributions of
Figure 4. Some respondents can be strict or lenient: the median is unaffected by extreme values, whereas the mean is pulled by them. The median therefore provides a more robust representation of the “typical” score of each appraiser, which is the gauge of interest in this study.
The first distribution in
Figure 4a shows a substantial variability in human ratings of the pleasurability need for Sidewalk 1: 30% judge it negatively, 30% neutrally, and 40% more positively. ChatGPT deemed this aspect as either neutral (4 runs out of 10) or positive (6 out of 10), whereas Gemini selected neutral most of the time. The median rating for both humans and Gemini is 3, so that the difference median (Gemini)—median (humans) is equal to zero, as reported in
Table 3. The median difference with ChatGPT is +1, since the median of ChatGPT ratings of pleasurability for Sidewalk 1 is equal to 4.
For this aspect of pleasurability evoked by Sidewalk 1, it is noteworthy that both LLMs can have comparable justifications when giving the same rating. ChatGPT explained its choice of neutral by assessing Sidewalk 1 as “The street has colorful, traditional-style buildings that add charm, but some facades appear worn and could use maintenance. It is visually interesting but not highly polished”. Gemini explained that “It is not “beautiful,” but it is not ugly either. The colorful buildings (like the red one) have some character, but other parts (like the gray wall on the right) look a bit worn down.”
ChatGPT ruled with a total confidence (IQR = 0) the aspect of comfort as neutral (rating = 3) and the aspect of accessibility as good (rating = 4), leading to a difference with human median ratings of these two aspects of +1 and zero, respectively. On the aspect of comfort, when rating Sidewalk 1 as neutral, ChatGPT stated, “There is a sidewalk, it is continuous, and the curb is well-defined. However, the sidewalk is narrow, and the pole in the middle further restricts the walking space. The street seems designed primarily for vehicles.” On the aspect of accessibility, ChatGPT used justifications such as “The route looks straightforward, flat, and continuous, making it practical for walking, though the limited sidewalk width might be inconvenient at times”.
Gemini justified its disagreement with the comfort statement (rating = 2) with the following explanation: “The sidewalk is a decent width, but there is a large pole placed right in the middle of it, which is a major obstacle. It forces me to walk around it and does not feel like a well-planned path”. Both LLMs detected the pole, but only Gemini deemed it as a major inconvenience. Comfort and safety of Sidewalk 1 were largely underestimated by Gemini, with a difference of −2 with human median ratings. On the aspect of safety, Gemini stated “The sidewalk is right next to the active traffic lane with no buffer at all—no parked cars, no grass strip, nothing. I would be very conscious of cars passing closely.”, while ChatGPT justified a ruling of safe sidewalk by declaring, “Traffic appears light, with only one lane for vehicles and a clear pedestrian zone. The narrow street likely limits vehicle speed, which helps safety.”
The close alignment of median ratings displayed on
Figure 4b indicates that Sidewalk 2 was fairly well modeled by the two AIs across the four criteria. However, the safety need statement was rated with low confidence by both AIs (IQR = 2), their judgments oscillating between 2 (disagree), 3 (neutral), and 4 (agree) across the 10 independent runs.
Figure 4c shows that, on the criterion of pleasurability, Sidewalk 3 was judged by humans either as beautiful and attractive (54%) or neutral (35%). The other three criteria were judged more positively, especially the accessibility with 80% of the raters considering Sidewalk 1 a practical path to walk. ChatGPT was less positive, judging pleasurability, comfort, and safety as mostly neutral. On accessibility, ChatGPT aligned with human raters, judging the sidewalk as a practical path to walk. Gemini was more positive on comfort and accessibility assigning ratings of 5 out of 5 with strong confidence. Pleasure assessment by Gemini aligns correctly with human perception. Gemini deemed the safety of Sidewalk 3 as neutral to very safe, while the humans expressed a strong sense of safety.
As reported in
Table 3, ChatGPT gives the same median rating as humans in one-third of the twelve walking needs statements (
ChatGPT = 0). In nearly all other cases, it underestimates human evaluation by one unit (
ChatGPT = −1), opting for a neutral assessment when humans are more positive about an aspect. ChatGPT is typically more conservative than Gemini but also more confident in its judgments, as reflected by its lower IQR values. Gemini matches the human median rating in half of the twelve cases (
Gemini = 0). It overestimates human evaluation by one unit (
Gemini =
) in 25% of the cases, strongly agreeing (rating = 5) with a statement when humans only agree to it (rating = 4). However, in two instances its output directly contradicts the human ratings (
Gemini =
), deeming Sidewalk 1 as uncomfortable and unsafe, when humans judged it safe and comfortable. Gemini is therefore more frequently aligned with human ratings than ChatGPT, but with a larger IQR, it is also more creative yet occasionally entirely off-target.
3.2. Pedestrian Friendliness
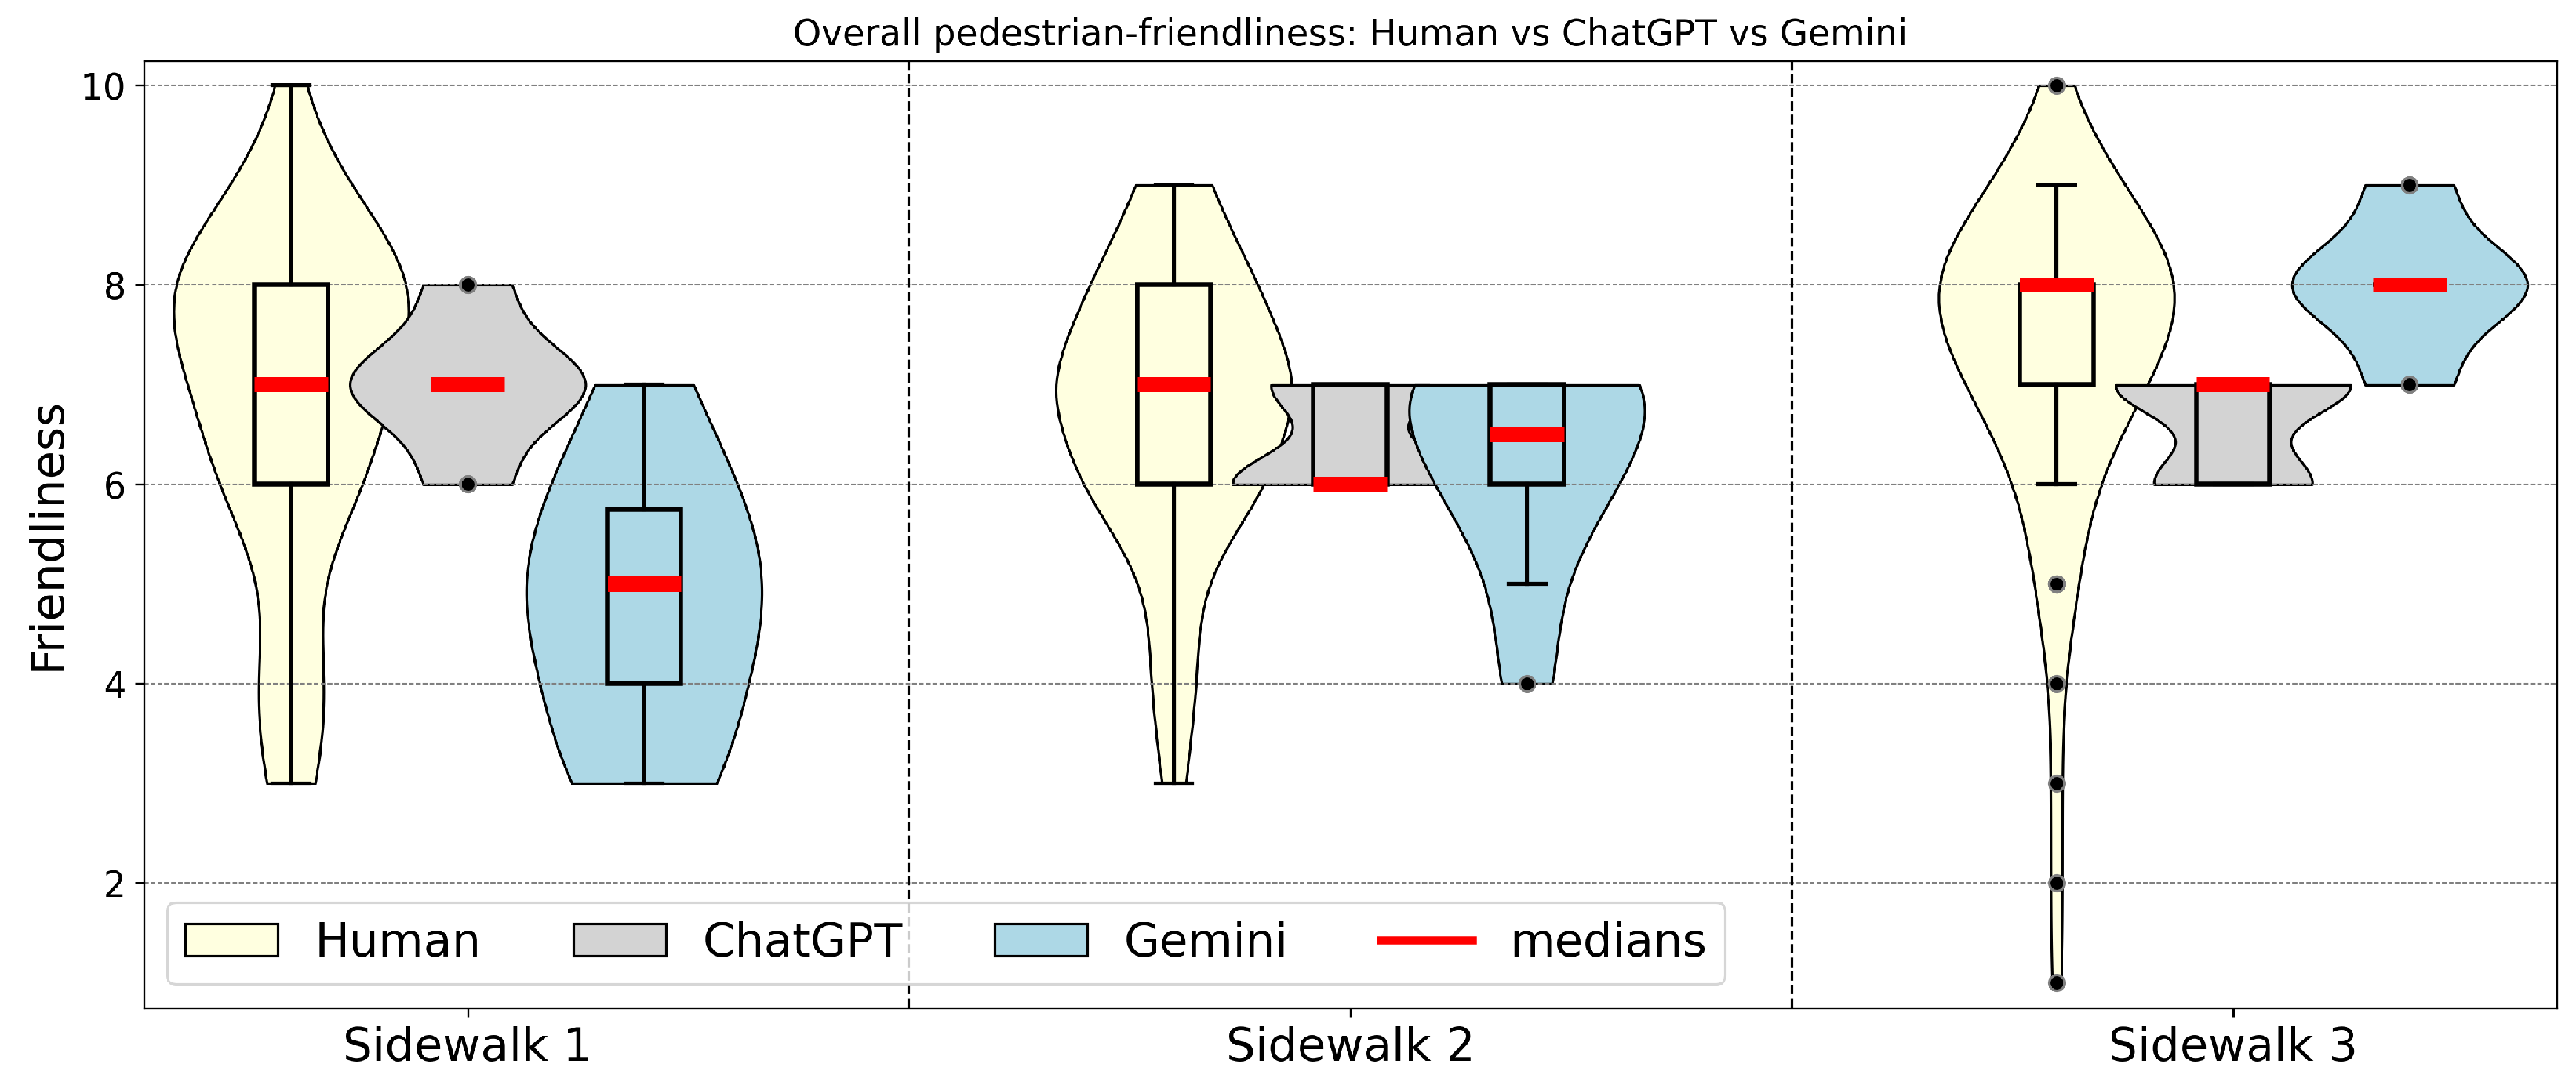
Figure 5 presents the distribution of ratings for the three sidewalks of interest. These scores reflect a streamlined evaluation using a single descriptor, “friendliness”, which gathers greater consensus than the walking needs statements. The legend remains the same as in previous figures, but the scale of the possible scores now ranges from 1 to 10: the human ratings are in yellow, ChatGPT’s ratings are in gray, and Gemini’s are in blue. All raters assigned relatively high scores, especially human ratings that concentrate in scores between 6 and 9: 80% of persons for Sidewalk 1, 85% for Sidewalk 2 and Sidewalk 3.
ChatGPT’s ratings are still consistent with IQR
1 for the three sidewalks, and a median scoring aligns closely with the human evaluations as reported in
Table 4. Gemini’s performance falls slightly below that of ChatGPT, especially because it underestimated the quality of Sidewalk 1, rating it with a median score of five out of ten. To justify such a low grading, Gemini invoked the lack of any buffer from moving traffic and the pole obstructing the middle of the street.
Interestingly, ChatGPT and Gemini produced almost identical median friendliness scores for Sidewalk 2, yet with opposite explanations. Gemini invoked the wide, flat sidewalk and the addition of greenery as beneficial features while noting the lack of a sufficient buffer from road traffic. ChatGPT, on the other hand, deemed the road fairly walkable and safe but pointed out that the sidewalk could be wider and include more greenery; the drawback was the prioritizing of parked scooters.
The separate arguments of the two AIs for judging Sidewalk 3 were complementary: Gemini underlined the safety and practicality of the walkway, whereas ChatGPT based its judgment on space constraints and some visual clutter.
3.3. Environmental Aspects Influencing Well-Being
Two descriptors were chosen to characterize the influence of the built environment on well-being: the attractiveness of the place and how the distant view draws a person toward forward motion. They reflect how the environment supports or discourages movement or makes one feel comfortable resting in place. This second factor underlies the success of all pedestrian environments, yet it is often insufficiently emphasized in mainstream planning. We called these descriptors place and distance:
Place characterizes that we feel comfortable standing for a period of time in that spot; hence, it is ultimately good for our psychological and physiological health.
Distance validates the entire street since it offers an attractive goal instead of discouraging us from moving forward along the street. This is our body reacting.
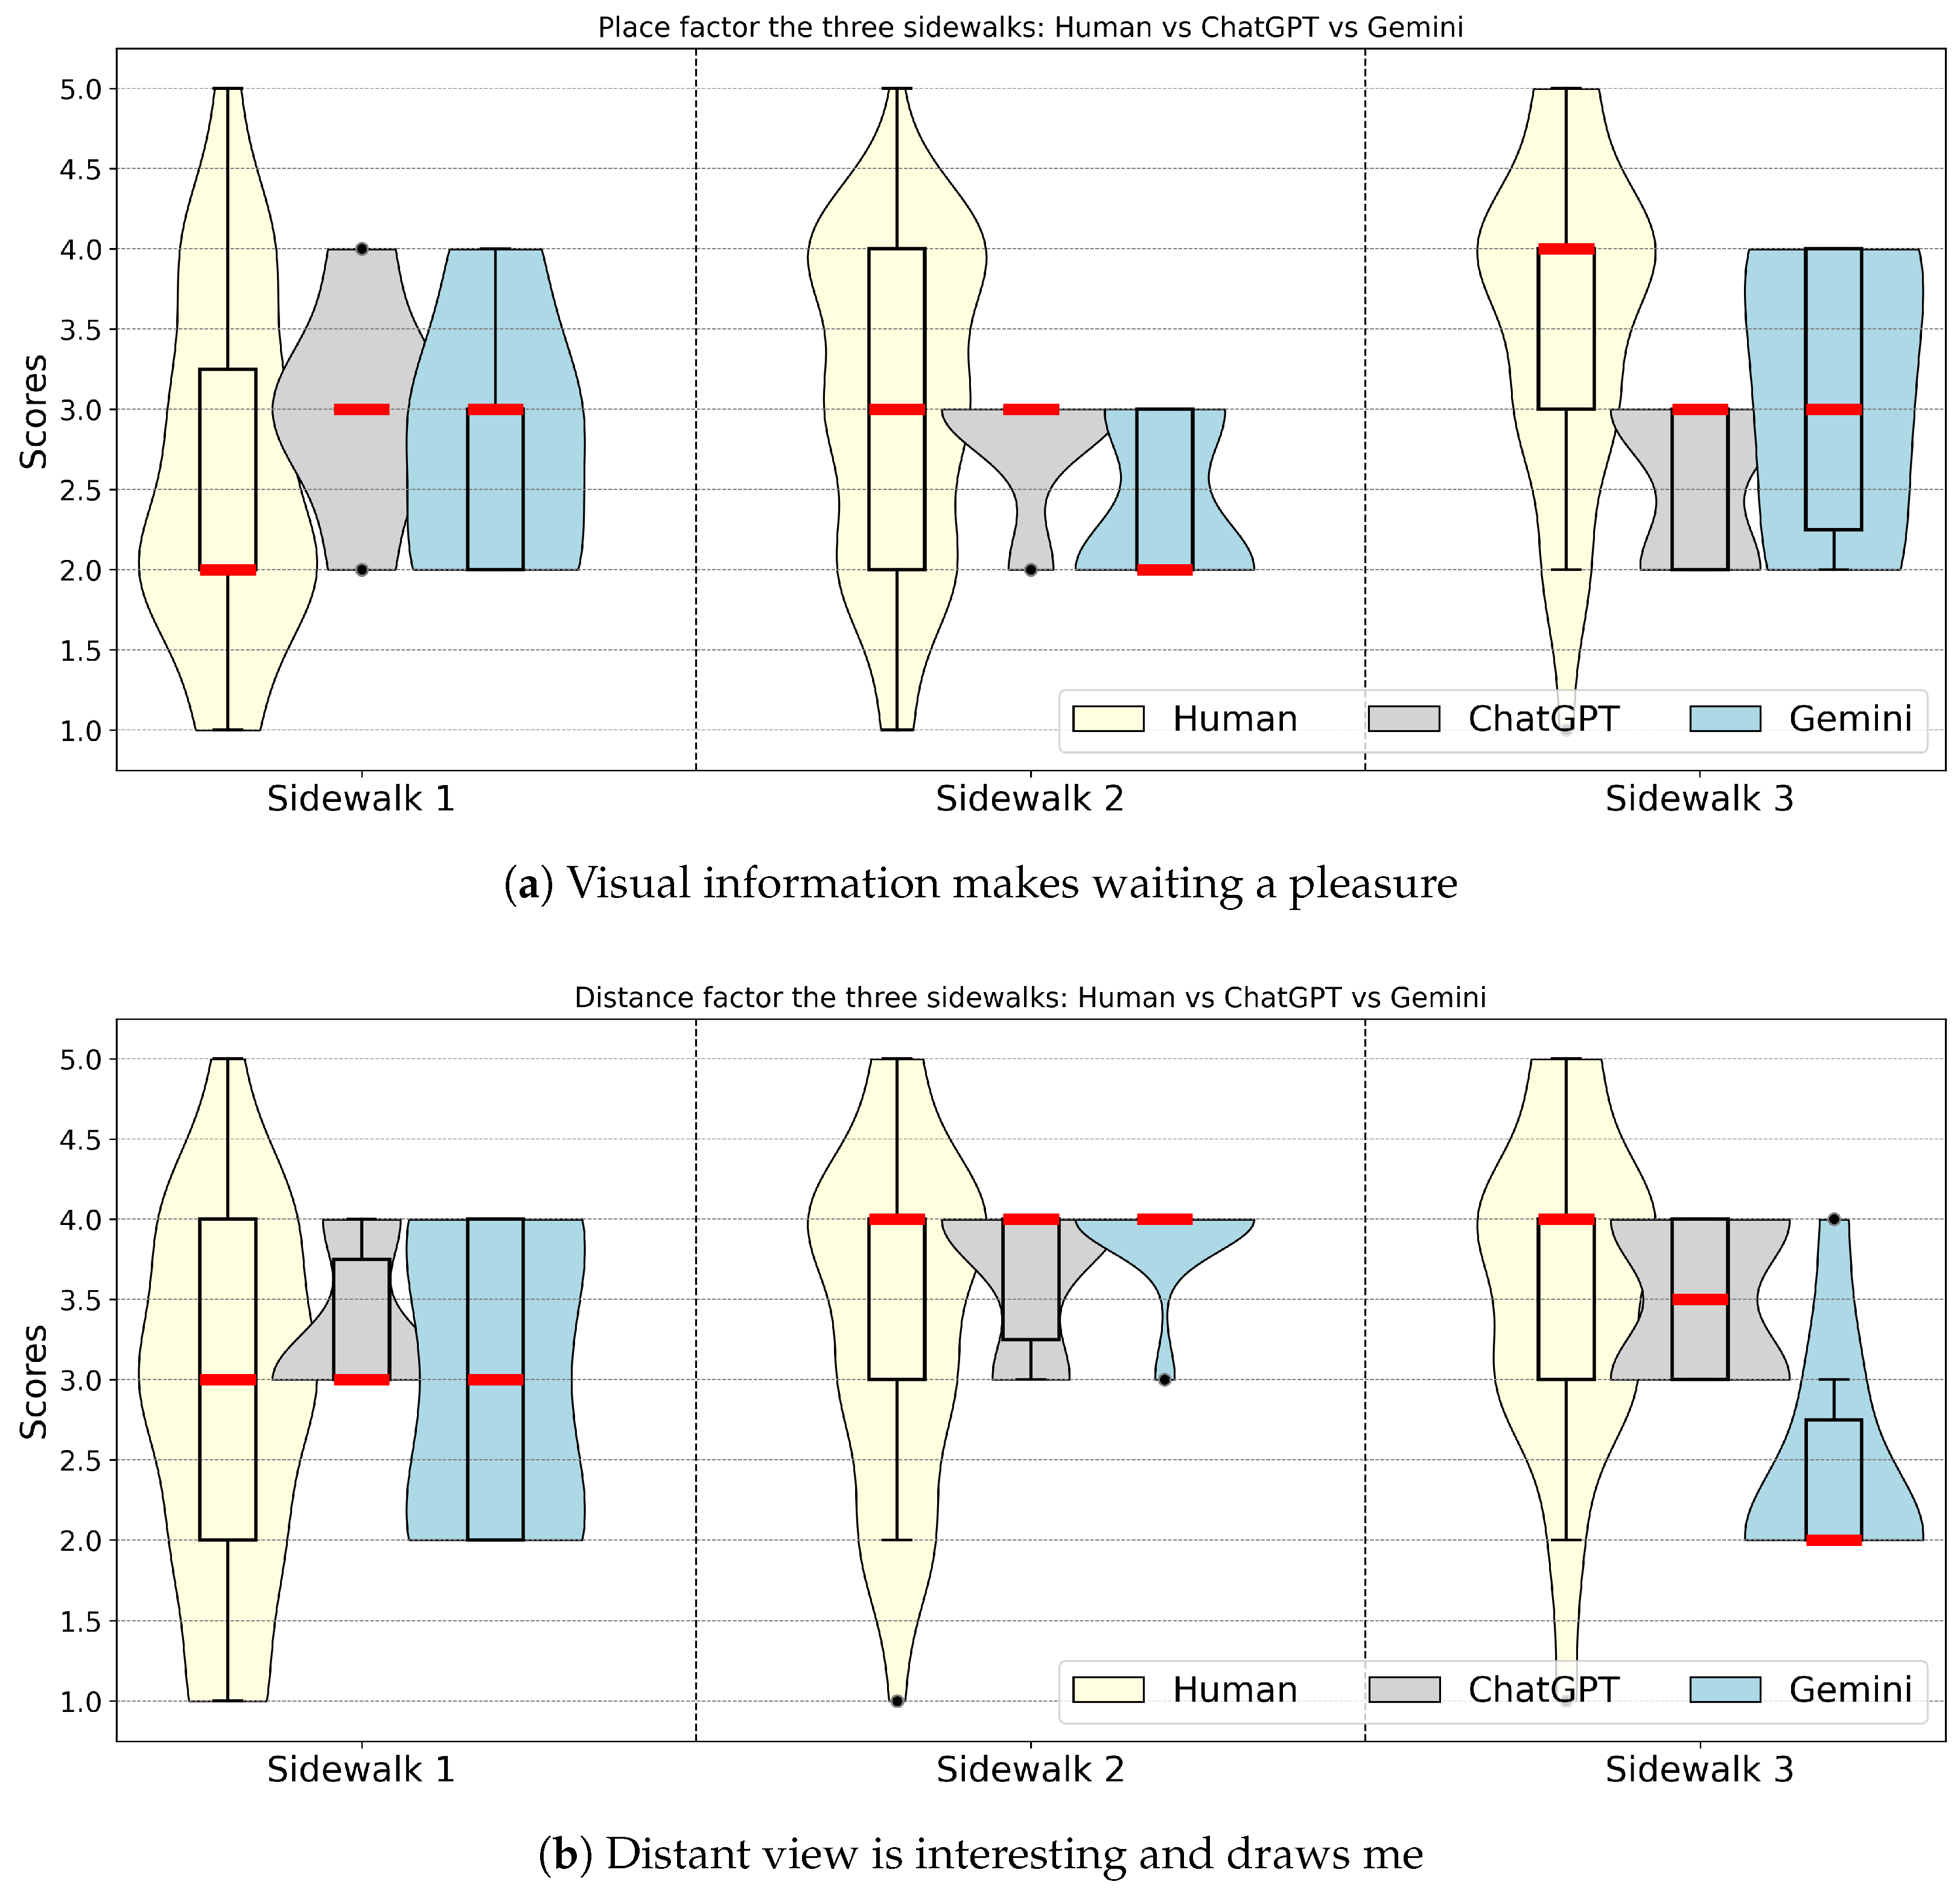
Figure 6a shows the distributions of ratings of the “Place” factor,
Figure 6b contains the results for the “Distance” factor.
According to human perception of the Place statement, Sidewalk 3 appears predominantly as a good place to stay and linger—probably due to the presence of historical features—while Sidewalk 2 was judged as good by 40% of voters but neutral or bad by 50% of them. Sidewalk 1 was the least popular, with 50% of human voters judging that its visual information does not make it a pleasure to have to wait there for someone, and the rest of the voters equally judging it as either a neutral or attractive place. As reported in
Table 5, ChatGPT ruled all three sidewalks as neutral regarding their visual attractiveness and propensity to be a nice spot to stay and linger (rating = 3). The place factor of Sidewalk 1 was rated as 2 by humans and slightly overestimated by ChatGPT and Gemini (rating = 3); meanwhile, Sidewalk 3 was underestimated by both AI with a rating of 3 against a human median rating of 4. On this aspect, compared to human ratings, Sidewalk 2 was correctly rated by ChatGPT and slightly underestimated by Gemini (rating = 2).
The statement to rate for evaluating the distance factor was “The distant view is interesting and draws me to walk in that direction”. Humans did not reach a consensus on this aspect for Sidewalk 1, according to the distribution illustrated in
Figure 6b, their votes being equally distributed between disagree, neutral, and agree, leading to a median score of 3. Sidewalks 2 and 3 were judged as more interesting to walk along due to the distant view, reaching a median score of 4. As reported in
Table 5, ChatGPT’s median scores of the distance factor align almost perfectly with those of humans for the three sidewalks. Gemini failed to align with the human rating on Sidewalk 3 for this criterion by underestimating it, rating it 2, meaning a bad walkway for movement, when the median rating of humans was 4—meaning that Sidewalk 3’s distant view was perceived as drawing the person to walk in that direction.
Without going into an exhaustive qualitative analysis of model reasoning, we can specify some elements on which the LLM based their decision. ChatGPT based its assessment of visual information on the presence of colorful façades, building textures, seating, greenery at eye level, shopfront displays, and public art, whereas negative scoring is based on the narrow sidewalk. Its assessment on the distance view is based on the clear linear perspective of the street, human-scale buildings, visible activity ahead, and the presence of people walking that create a sense of continuity and curiosity about what lies further along. Gemini indicated that staying in a place is favored by geometric details, historic charm, the presence of seating and visual interest at eye level such as shop windows or greenery, and disadvantaged by narrow sidewalks and visual obstructions such as a black utility pole in Sidewalk 1. For the distant view, Gemini also mentioned the other pedestrians further down the path, suggesting that the street leads to a more active area, as well as an urban canyon effect produced by the buildings framing the road, “combined with the light at the end of the corridor creates a strong sense of curiosity”. Low rating of Sidewalk 3 by Gemini comes from the transition from a sidewalk to a wider multilane roadway that can be “intimidating rather than inviting”, and also from the poor-looking facade with metal shutters and lack of windows, creating a boring effect that does not encourage someone to walk toward the distance.
3.4. Intraclass Correlation Analysis
When comparing how humans and conversational AI agents perceive an urban environment, it is important to know if they give similar ratings for each attribute, which can be done by comparing median ratings item by item, and how reliable the ratings are, which can be done by IQR analysis. But what matters most is whether the two types of raters are consistent in how they evaluate different scenes across multiple criteria: the question is about agreement between raters, not just similarity in central tendency. To address this question, one can use a statistical tool called the intraclass correlation coefficient (ICC), a measure of agreement among a set of ratings. The most specifically suited for this study is the ICC(2,1) model, also called the two-way random effects model for absolute agreement. It is two-way because it accounts for both the variance in the targets (the urban scene) and the variance in the raters (humans vs. AI). It is random effects because AI and the human group are treated as representative samples of a larger population of potential raters, suggesting that if the AI aligns well with humans on the case scenarios, it would align with them on other urban images. The 1 refers to a single measure, in this case the median of the 10 AI responses compared to the median of the 68 human responses, for the 21 items (3 images × 7 statements). The ICC(2,1) model estimates how much of the total variance in ratings is due to differences between the input stimulus—the sidewalk images and statements—versus differences between raters. The main question addressed is, “Are AI and humans interchangeable as raters?”. ICC(2,1) measurements indicate whether one could swap a human rater for an AI rater and expect similar evaluations, not just similar rankings, which Pearson’s r would be about. Median and IQR alone cannot tell whether two systems agree across multiple items: ICC aggregates agreement across all items and provides a single interpretable number between 0 and 1 that summarizes how well AI aligns with human judgment as a system, not just item by item or image by image.
Table 6 provides the intraclass correlation coefficients obtained when comparing the typical score of humans and the ones from the AI agents. ICC’s values range from 0 to 1: an ICC below 0.5 indicates poor reliability, between 0.5 and 0.75 moderate reliability, 0.75 to 0.9 good reliability, and excellent reliability results in an ICC above 0.9. For human vs. ChatGPT, the ICC value of 0.87 indicates a good to excellent reliability. With a 95% confidence interval starting at 0.67—fully above moderate agreement—and a highly significant
p-value, one can conclude that ChatGPT’s subjective perception aligns closely with the human median across all the conditions. This result indicates that the judgment of ChatGPT of urban scenes is largely interchangeable for the identified audited aspects. Gemini reaches an ICC of 0.76, which falls into the “Good” reliability range, though it sits at the lower end of that bracket as compared to ChatGPT. The significantly narrower Confidence Interval (CI) for ChatGPT indicates that ChatGPT’s alignment with humans is much more robust and statistically stable. The alignment of Gemini with humans varies strongly across the 21 distinct items with a 95% CI = [0.51, 0.90]. This is an effect of ICC(2,1) that penalizes consistently higher scores. ChatGPT’s ratings were substantially more aligned with aggregated human ratings than Gemini’s in terms of absolute agreement rather than just rank ordering. We will later indicates the items where Gemini used an incorrect logic to evaluate a score, leading to a low ICC.
Notice, however, that, as a preliminary study based on three illustrative cases, these findings should be viewed as context-dependent observations rather than a definitive technical standard. While these patterns are promising, they do not imply that AI can currently substitute for human auditors in a professional capacity. Instead, this empirical comparison serves as a focused starting point, demonstrating the feasibility of using specific LLMs as supplemental tools for identifying nuances in urban perception. Broader claims regarding the reliability of AI as a proxy for human sentiment would require a more extensive dataset to confirm these initial trends across a wider variety of environments.
3.5. Comparative Descriptive Statistics
While the ICC analysis focused on rater interchangeability, this section evaluates the global performance of Gemini and ChatGPT against the human rulings.
Table 7 summarizes the correlation
, reliability
, and agreement
coefficients for both models. Spearman’s Rank Correlation (
) characterizes ordinal trend, evaluating if the AI agrees with humans on the relative ranking of sidewalks. Weighted Cohen’s Kappa (
) characterizes categorical accuracy, how often the AI picks the exact same Likert category as the humans. It measures agreement beyond what would happen by random guessing. The weighted part gives partial credit for near misses, for instance, when the AI chooses agree when the human picks strongly agree. Krippendorff’s alpha (
) characterizes general reliability and is used to assess if the humans and the AI are in consensus.
determines if the variation in the scores comes from the actual differences between the sidewalks (signal) or from disagreement between the raters.
Table 7 reports the metrics computed by analyzing the distribution of ratings between the LMMs and human participants.
Both models show a strong, significant positive correlation (). Gemini () actually has a slightly better sense of order than ChatGPT () in this specific dataset. Both models are highly successful at ranking which sidewalk items are better or worse in a way that mirrors human trends. According to Krippendorff’s Alpha, ChatGPT () is in the highly reliable range (>0.80). Gemini () is in the tentatively reliable range (0.667–0.80). This metric penalizes the magnitude of disagreement: ChatGPT is more reliable as a scientific instrument because its deviations from the human ratings are smaller than Gemini’s. According to the quadratic weighted Kappa, both models achieve susbtantial agreement with within the range 0.61–0.80. ChatGPT () is very close to the “Almost Perfect” threshold (). This means that when ChatGPT disagrees with a human, it is almost always by only one point on the scale. Gemini’s slightly lower score () indicates some larger misses. While Gemini slightly outperformed ChatGPT in rank correlation (), its lower alpha score () suggests that its absolute ratings are more volatile when compared to the human baseline. ChatGPT demonstrates superior performance as a proxy for human consensus, achieving high reliability and substantial agreement, yet comparative analysis reveals that both AI models are significantly aligned with human judgment in terms of ranking sidewalk aspects ().
Also, a paired-samples
t-test was conducted to evaluate further the alignment between human consensus (
) and AI ratings across 21 street-walkability items: mean ratings for each item are listed in
Table A3. Both AI models yielded identical performance metrics when compared to humans. No significant difference was found between human normalized ratings (
), ChatGPT’s normalized ratings (
), and Gemini’s (
). Both LLMs demonstrated strong alignment with human consensus (
p > 0.05). A paired-samples
t-test revealed no significant systematic bias for ChatGPT (
) or Gemini (
). Notably, ChatGPT’s variability (
) closely mirrored human response patterns (
), while Gemini exhibited significantly higher variance (
), suggesting a more polarized evaluation of the urban features, avoiding the “middle ground” that humans and ChatGPT usually occupy. However, Gemini might be useful for identifying extreme architectural or environmental features that trigger strong positive or negative reactions if those reactions are exaggerated.
The degrees of freedom () are a direct result of the study’s focused design, where 21 distinct data points were generated from 3 highly detailed audits across 7 specific criteria, while the number of scenes is small, the number of evaluated items provides enough granularity for a meaningful exploratory analysis. These statistical outputs suggest that LLMs can accurately shadow human intuition in specific, well-defined contexts, the intent being to demonstrate the feasibility of the methodology rather than to establish a universal technical standard for AI-assisted auditing.
3.6. Comparison with Related Works
Directly benchmarking results across AI-driven visual evaluations of the built environment remains a significant challenge due to the high degree of heterogeneity in datasets and methodologies. Many existing studies utilize pairwise image comparisons as their primary input, which differs fundamentally from our approach. Furthermore, the specific research objectives and the nature of the inquiries—both for human participants and AI models—vary considerably. Additionally, as a pilot investigation, this work prioritizes the fine-grained examination of specific sidewalk environments, so the claims are limited to context-dependent cases. In contrast, more extensive datasets often prioritize volume at the potential expense of the cognitive engagement required for complex panoramic image assessments.
While some studies share thematic similarities with our work—such as Wedyan et al. [
11] regarding the hierarchy of walking needs, or Malekzadeh et al. [
17] and Zhou et al. [
18] regarding urban attractiveness—they operate under different parameters. A critical distinction lies in the image acquisition: most research employing Street View Imagery (SVI) utilizes road-level perspectives captured from vehicles, whereas our data are acquired directly from the sidewalk to better reflect the pedestrian experience. Other work, such as Xiao and Tang [
12], focuses on longitudinal changes over time rather than static quality assessment views to assess if the changes made a location worse, better, or stable. Despite these divergences,
Table 8 provides a comparative summary in which to situate our findings within the current literature as accurately as possible.
By comparison, Wedyan et al. [
11] assessed several walkability aspects across eight participant groups, with 6 to 38 participants per group. Their methodology employed a pairwise comparison where participants and ChatGPT rated two images describing different urban environments on a 1–10 scale. To evaluate alignment, the authors matched cases where both the AI and humans identified the same image as the “superior” one in a pair, excluding instances of disagreement from their statistical analysis. For the matched sets, their results showed no statistically significant difference between human and GPT-4o ratings for Image 1 (
) or Image 2 (
), suggesting the model’s ratings were generally consistent with human perception when their qualitative preferences aligned. In the present study, both LLMs demonstrated strong alignment with human consensus (
) across a broader range of 21 environmental items, without excluding instances of individual disagreement. Despite the inclusion of these potential outliers, our results similarly demonstrate no significant systematic bias for ChatGPT (
) or Gemini (
). When comparing these results, the t-values provide a metric for the closeness of the models to the human baseline. Wedyan et al.’s highest t-value (
) approached the threshold of significance (
), indicating a more pronounced, though still non-significant, deviation from human scores. In contrast, our findings for Gemini (
) and ChatGPT (
) yield lower t-values, suggesting an even closer alignment with the human mean within our experimental framework.
Wedyan et al. compare preferences (which image is better) while we compare consensus (the absolute score of an environment). Both studies agree that GPT models do not exhibit a systematic bias, which is the primary point of comparison. Another key distinction between the two studies lies in the granularity of the evaluation per aspect measured. In Wedyan et al. [
11], each walkability aspect was evaluated across eight pairs of images, providing a larger sample of visual stimuli per category. In contrast, our exploratory study evaluated each aspect across three representative images. The larger number of visual samples in Wedyan et al. allows for a more granular capture of AI-human drift across diverse urban contexts, which is reflected in their higher t-value (
) approaching significance. Our approach, by focusing on a smaller set of highly detailed audits, prioritizes the depth of consensus for specific environments. While both studies conclude that no systematic bias exists (
), the higher
p-values in our study (
and
) may be attributed to the stability of the AI’s mean when applied to a more focused set of stimuli.
In another recent study, Malekzadeh et al. [
17] compared ChatGPT’s ratings against a human cohort consisting of 13 local residents and 11 non-residents. Participants were tasked with evaluating the visual appeal and functionality of approximately 2000 panoramic street view images on a 1–7 scale, while the study provides a large-scale data set, it is worth noting that participants provided an average of 1014 ratings each. In the context of panoramic images—which require active interaction and significant cognitive load to inspect thoroughly—such an extensive task volume may introduce concerns regarding participant fatigue, potentially affecting the granularity of the human baseline. Another significant concern in the methodology of Malekzadeh et al. [
17] lies in the standardization of both human and AI ratings, while the authors justify this post-processing as a means to handle subjectivity and varying evaluator “scales”, this step potentially introduces a fundamental bias into the study. The authors state they standardized ratings but do not specify the mathematical transformation used. Without knowing the formula, it is impossible to determine if the transformation artificially compressed the variance of the GPT-4 responses to match the human distribution. This is particularly problematic given that LLMs are known to have centrist tendencies (clustering around the mean), whereas humans utilize the full scale. By adjusting the data across different evaluators and prompts before performing the
t-test, the authors may have inadvertently manufactured the very alignment they were testing for. In addition, their study relied on Google Street View imagery captured from a vehicle’s roof at a height of approximately 2.5 m, which lacks the ecological validity of a pedestrian’s eye-level perspective. By using a vast dataset of vehicle-centric images, their study risks measuring a visual appeal from a detached, bird’s-eye view.
Despite these precautions, their results indicated no significant differences between the groups, with p-values of () for residents and () for non-residents. This led the authors to conclude that GPT-4’s distributions align closely with human perception for broad aesthetic and functional audits. Comparing these findings to our own requires careful consideration of the differences in evaluation aspects, i.e., broad “visual appeal” vs. our seven specific walkability criteria, and sample density. However, the t-statistics offer a useful point of comparison regarding the centering of the AI models: Malekzadeh et al. reported t-values ( and ) that are remarkably similar to our result for Gemini (). Both studies show that the AI mean is positioned less than one standard error away from the human mean. This suggests that for general urban evaluation, LLMs tend to converge on a “middle-of-the-road” consensus that effectively mimics human averages. Malekzadeh et al. used a significantly larger number of images compared to our three representative locations. In statistics, a larger N typically increases the power to detect even small differences. The fact that their t-values remained low (<1.0) despite such a massive sample size strongly suggests that LLMs do not appear to have a systematic bias even when tested across thousands of varied environments. While the t-values are comparable, the interpretation of the human baseline differs. Because our participants rated only three images, we captured a high-depth consensus with lower risk of fatigue-induced noise. In contrast, the similarity in Malekzadeh et al.’s results—where residents and non-residents provided nearly identical t-scores relative to the AI—suggests that GPT-4 may be capturing a generic aesthetic standard that transcends local residency, a phenomenon we also observed in our models’ alignment with the general human consensus.
In a large-scale assessment of urban aesthetics, Zhou et al. [
18] utilized a pairwise comparison methodology to evaluate a subset of 1020 street-view images. Each image was paired with 50 randomly selected counterparts, with human evaluators and ChatGPT asked to identify which image is the more appealing in each instance. This process generated a cumulative relative score for each image, reflecting its aesthetic standing within the specific dataset. An image’s score of visual appeal is then its win rate against 50 other images. Their results demonstrated a strong correlation between GPT-4o and human rankings, yielding an
of 0.695, suggesting that GPT-4o is proficient at ranking urban beauty. While the pairwise comparison method used is designed to simplify the subjective task of aesthetic judgment, the scale of their implementation introduces a potential limitation regarding evaluator fatigue. Each auditor was tasked with assessing 100 images, with each image paired 50 times, resulting in a total of 5000 evaluations per auditor. Even though selecting the more attractive image in a pair is cognitively less demanding than assigning a precise numerical score to a single image, the repetitive nature of 5000 consecutive judgments raises several concerns: diminishing discriminatory power, vigilance, and engagement, especially in the case of panoramic images, which require some interactivity at each pair comparison.
Nevertheless, our results complement Zhou et al.’s findings by showing that the model is also capable of replicating the specific magnitude of that beauty, as evidenced by our low MAE and non-significant t-values (). While a direct numerical comparison between our results and Zhou et al. is limited by the differing nature of the data (relative ranking vs. absolute Likert ratings). Zhou et al. achieve a stable human baseline through the sheer volume of comparisons (51,000 pairs). In contrast, our study achieves stability through a high-depth audit of fewer images. The convergence of both studies—despite these vastly different scales—suggests that GPT-4o’s aesthetic “judgment” is not an artifact of specific dataset sizes but instead a robust reflection of average human preference. By reporting an near 0.70, Zhou et al. establish a high benchmark for AI-human correlation in aesthetics. Our findings complement this result by showing that even without the “corrective” power of massive pairwise datasets, the AI’s absolute ratings remain statistically indistinguishable from the human mean ( for ChatGPT).
4. Discussion
In
Figure 4,
Figure 5 and
Figure 6, each “violin” is a distribution plot that shows where the ratings for a given sidewalk are concentrated. Pleasure, comfort, safety, and access are plotted separately coming from humans (yellow), ChatGPT (gray), and Gemini (blue). The higher parts of the violin represent higher Likert scores. A wide “belly” around a score means that many respondents (or many model runs) produced that score. The violin shape gets wider where more responses pile up and narrower where few responses occur. A bulge where the violin gets noticeably wide marks a peak in the distribution. A tall and wide human violin rating usually means that humans disagree and responses are spread across several categories. A very thin AI violin rating typically means high repeatability across different runs. If ChatGPT’s red median sits above the human red median, then ChatGPT is rating that item more positively than humans on average (for that sidewalk). Different heights in the figures for the three sidewalks mean that the group is judging one sidewalk as more pleasant/comfortable/safer/more accessible than another. Modality is just the number of main piles of answers, which show as one, two, or three bulges in a violin diagram. In the unimodal case, most answers cluster around one main score. In the bimodal case, answers split into two main clusters. In the trimodal case, answers cluster into three main piles. One key point in this paper’s results is that humans can show bi- or tri-modality (different people genuinely experience the same sidewalk differently), whereas an LLM’s repeated runs often collapse to unimodality (it keeps giving essentially the same answer). Furthermore, the paper notes that ChatGPT distributions have high consistency, while Gemini is “less confident or more nuanced”, with more outliers.
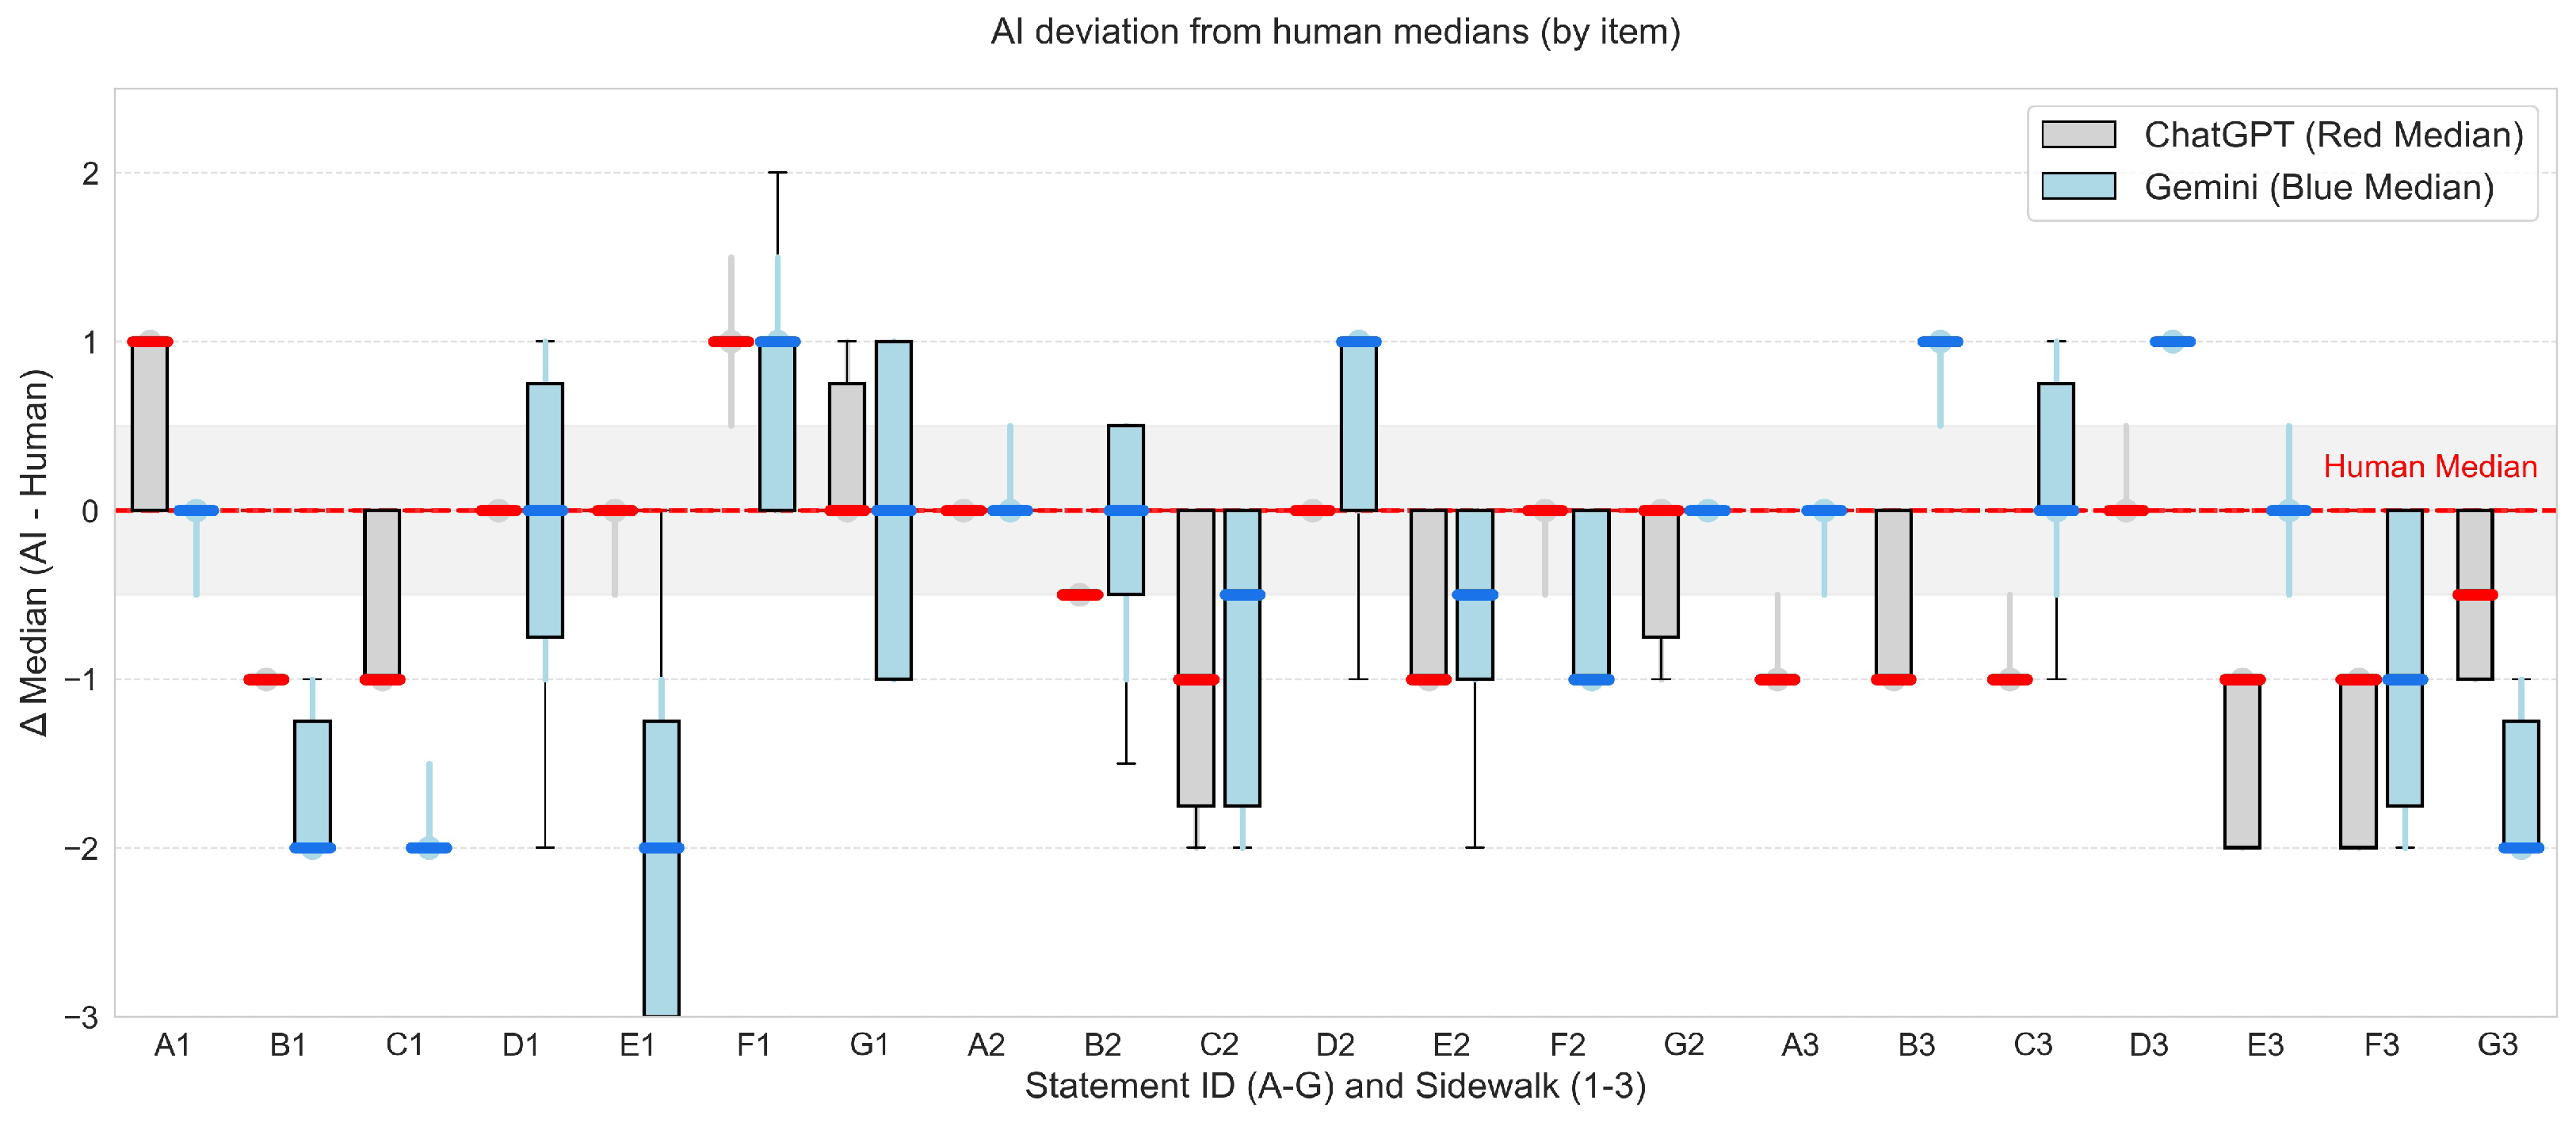
Figure 7 illustrates the value of the relative errors showing AI median minus human median: positive values mean that the AI rated higher and negative means lower ratings. Most boxes for both models fall below the 0 line (the red dashed human median). This suggests that both AIs tend to rate these statements more conservatively (lower) than the human sample. Gemini exhibits a much higher spread, especially for aspect E1 and G3; Gemini’s boxes are significantly taller and reach lower deviations (down to
) compared to ChatGPT’s more stable, narrower boxes. The gray shaded area (
) represents the zone of high human alignment. ChatGPT sits comfortably in this zone or exactly on the 0 line more frequently (e.g., D1, E1, G1, A2, B2, D2, F2, G2, D3, and G3). Significant disagreement occurs in aspects B1, C1, E1, and G3, where Gemini is much more critical than both humans and ChatGPT.
To quantify the performance of each model relative to the human baseline, the mean absolute error (MAE) was calculated by comparing the median of the 10 AI iterations against the human median for each of the 21 items.
Table A4 reports the MAE per sidewalk, showing how the context of the statements affected the AI’s accuracy. Sidewalk 2 yielded the highest alignment for both models, suggesting the phrasing in this section was the least controversial for the AI. Gemini struggled significantly with Sidewalk 1, while ChatGPT saw its largest error margin in Sidewalk 3.
Table A5 reports the MAE across the seven evaluated aspects: ChatGPT demonstrates superior alignment with the human baseline, achieving a lower MAE in five categories and reaching its peak precision in Aspect D (MAE = 0.10). In contrast, Gemini exhibits more specialized strengths, significantly outperforming ChatGPT in Aspect A (MAE = 0.30) and Aspect F, though it struggles with higher volatility and error margins exceeding 1.10 in Aspect C. Overall, while both models find Aspects C, ChatGPT’s narrower range of error suggests a more consistent cross-aspect performance, whereas Gemini’s accuracy is more sensitive to the specific nature of the statement being assessed.
To discuss the results in light of research questions RQ1 and RQ2, our analysis is based on the alignment of the human median ratings with the median computed from the two AI programs. We decided to sample the alignment according to three possibilities related to the difference
in medians: a median rating from an AI equal to a human rating plus or minus 0.5 is labeled as correct alignment; a difference of
in median ratings is labeled as fair alignment; and a
as incorrect alignment.
Table 9 summarizes the results obtained on the three sidewalks for the seven statements as evaluated. The use of specific thresholds for the difference between human and AI medians, i.e.,
, ±1, and ±2, is grounded in the resolution of the 5-point Likert scale and the statistical nature of central tendency in ordinal data. A difference of ±0.5 is defined as “Correct” alignment, as it represents the smallest possible step between an integer rating and a halfway point, indicating that the AI is effectively within the same perceptual category as the human majority. A difference of ±1 is classified as “Fair” alignment; while this represents a shift of one full Likert point (e.g., from “Agree” to “Neutral”), it remains within the same general half of the spectrum and often reflects the common variance found among human raters themselves. Finally, a difference of ±2 or more is categorized as “Incorrect”, as it signifies a fundamental shift in perception—moving from agreement to disagreement or from a strong sentiment to neutrality—thereby failing to capture the human contextual intent.
Globally, ChatGPT indicated a correct alignment with human ratings in 12 cases out of the 21 proposed statements and a fair alignment in the other 9 cases. Gemini was correct in 11 cases, fairly aligned in 6 cases, and incorrectly aligned in 4 cases out of 21. Overall, ChatGPT shows consistently moderate to strong agreement with human ratings, achieving either correct or fair alignment with no instances of incorrect alignment. Gemini demonstrates a more variable performance, less consistent due to the presence of misalignments across the evaluated statements. Sidewalk 2 was the best-modeled streetscape evaluated, with both LLMs showing correct alignment with human ratings for nearly all the criteria investigated. ChatGPT performed similarly on Sidewalk 1 and Sidewalk 3 with fair to correct alignments, whereas Gemini’s performance was notably poor on Sidewalk 1, with approximately half of the statements misjudged. Model performance is sensitive to the specific urban context: Sidewalk 2 seems to represent a well-defined case for pedestrian perception modeling. Both models can perform well under favorable conditions; however, ChatGPT generalizes more reliably across varying urban settings, whereas Gemini’s performance appears to be more context dependent. Regarding the experiential criteria investigated, ChatGPT demonstrated stronger coverage by perfectly modeling three out of seven factors: the accessibility, overall friendliness, and distant view impact on well-being factor (statements D, E, and F). Gemini was always in agreement only regarding the pleasurability factor (statement A).
The bottom line is that this focused experimentation establishes a methodological foundation for the following observations:
RQ1: AI is able to substitute for human subjective perception of a walking environment, to an extent ranging from Fair to Correct. AI can function as a reliable proxy for human perception when evaluating a visual stimulus based on subjective criteria but still requires human supervision.
RQ2: Across statements requiring a mix of objective visual analysis and simulated aesthetic and emotional perception, ChatGPT demonstrates a higher degree of correlation with the median subjective ratings of human participants. On average, ChatGPT 5.1 performs better than Gemini 2.5 Pro.
Indeed, both LLMs aligned well with human ratings in some environments but not uniformly across all streetscapes: Gemini showed weaknesses in more challenging or ambiguous environments, whereas ChatGPT demonstrated greater consistency across different sidewalks. Ultimately, while these findings are limited to the three illustrative cases, they demonstrate the feasibility of the methodology and provide an exploratory starting point for future research aimed at scaling AI-assisted sidewalk auditing.
5. Limitations of the Work
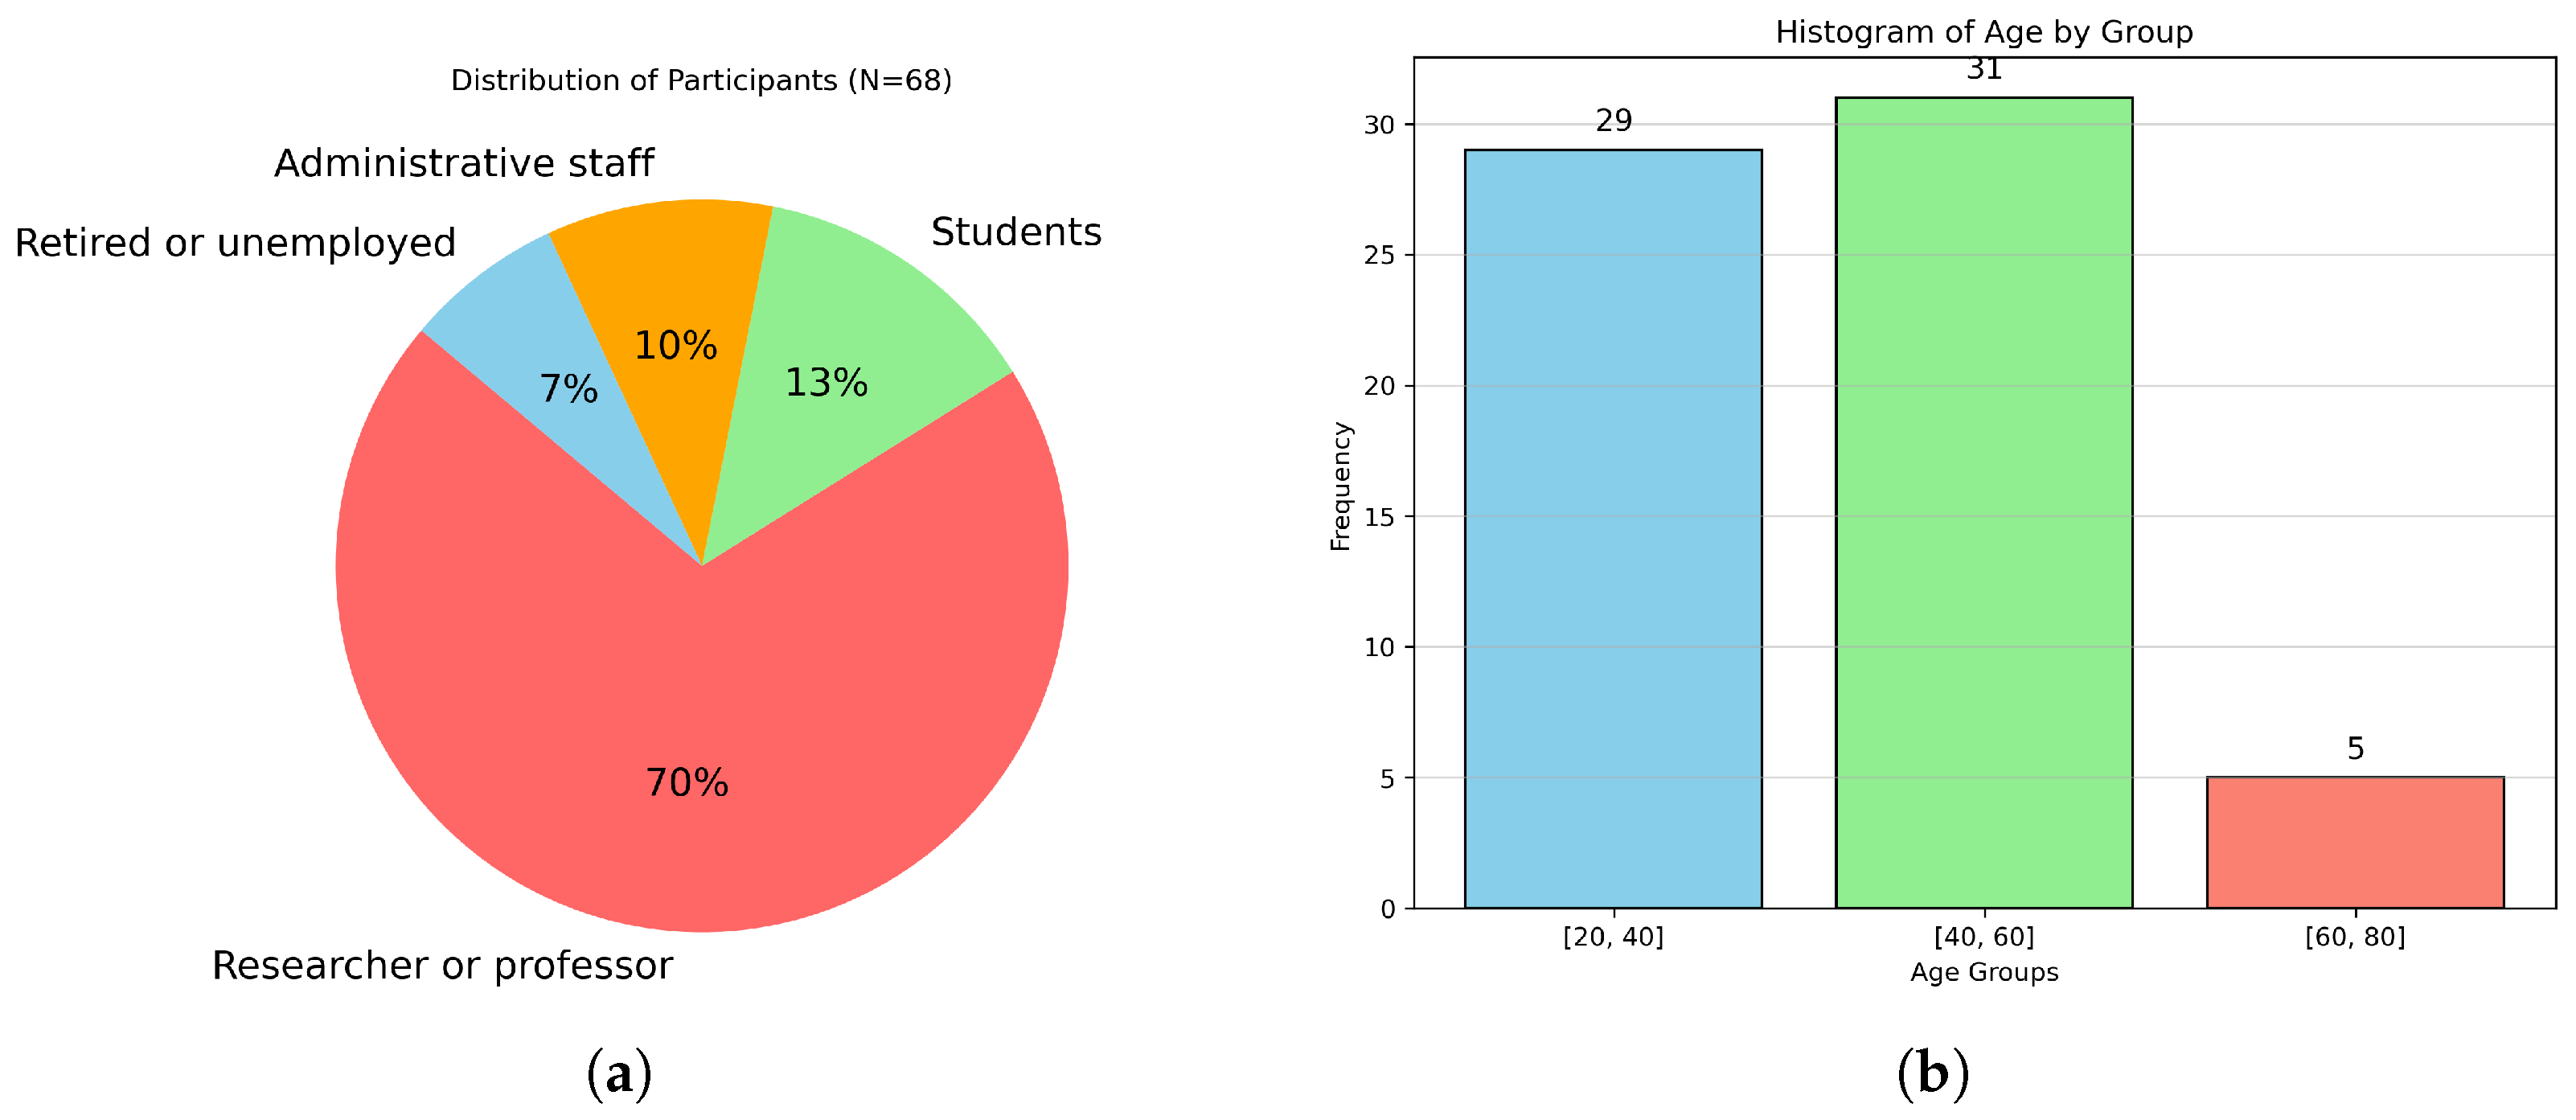
An important limitation of this research concerns the human corpus used, which is an academic population. The study is not an exploration of the university community, but it is common in research to rely on academic participants for reasons of feasibility: large-scale public surveys are costly, while students and staff are the most accessible population within a university setting. As for the occupation of the participants, the main inclusion criterion is self-selection to take part in the study. This is relevant for two reasons: professional practices and academic norms. The professional audit practices usually involve less than 20 people in public space auditing, recruited through self-selection, often adults engaged in community development and generally over 30 years old. Similarly, many academic studies draw conclusions on this type of experiment with a limited number of participants sharing similar occupations as in our study: student (bachelor’s/licence to master’s degree) or professor/researcher (including PhD students).
As for the age representation, our corpus is mainly composed of people between 20 and 60 years old. The older population (>70 years old) is a particularly interesting group to survey, as their walking needs are often not adequately met in today’s cities. However, they are also a difficult population to reach. We believe they deserve a separate dedicated study, as do people with disabilities. This outreach is beyond the scope of the present study. A more socio-demographically diverse sample might lead to different results: this study is exploratory and should therefore be interpreted with caution.
The number of case studies is relatively small, as only three sidewalks are investigated. It is a deliberate choice, one that allows for an in-depth, qualitative examination of how AI and human assessments compare to each other. Our goal was not to build a large and representative corpus but to explore the mechanisms and nuances of agreement and disagreement in specific, well-defined situations. Expanding the number of cases would have required a different study design and would have reduced the level of detail we could provide for each example. This is a preliminary study based on three illustrative cases, so broader claims would require a more extensive dataset.
Another factor that was not included in this study is the time of week or the time of day: it significantly alters the walkability of the spaces studied, but we stuck to the most common street view imagery, which is generally daytime imagery. Inclement weather (rain, sun, and snow) and the seasons also have a strong impact, a phenomenon that is exacerbated by climate change. Other potential confounding variables, such as lighting and shooting angles, were not controlled. Those factors may affect the evaluation, but future research could enhance the rigor of experimental control through standardized image processing.
Finally, we decided that an ablation study using the present data would not add any significant insight to our results. In the context of LLM evaluation, temperature settings influence the stochasticity of responses, and prompt engineering can significantly alter model performance, while we maintained fixed parameters to simulate a standardized professional use case, we acknowledge that from an AI-methodological perspective, the lack of an ablation study limits the generalizability of the findings. This follows from the relatively small number of human data points, but more importantly, it would deviate from the present focus on comparing the AI to the human results. This remains a critical area for future research, where the sensitivity of urban-perceptual outputs to specific hyperparameter tuning should be systematically mapped.
Ideally, a technical sensitivity analysis could increase the number of iterations of AI (20 runs, 50 runs, and 100 runs), run three temperatures (0.0, 0.5, and 1.0) on all sidewalks, and try two or three alternative prompt wordings or different prompt structures [
17], and present the results for each alternative to show what affects the performance.
We have not implemented them as new experiments for multiple reasons. We wanted to preserve the scope of the study, as stated by the two research questions RQ1 and RQ2, for a limited exploratory study: the core objective of this research is an empirical comparison of AI and human urban perception. Our current protocol (10 iterations at a fixed temperature) was established to provide a stable baseline for reliability. The signed deviation charts and the IQR analysis demonstrate that this 10-run distribution already provides a clear picture of models’ stability for a pilot study. As a pilot investigation, this work is only designed to test the feasibility of the methodology: the lack of sensitivity testing is a deliberate limitation, a necessary boundary to maintain a strict proportionality between the experimental scale and the resulting claims.
6. Conclusions and Perspectives
This study compares how two multimodal AI models and human participants evaluate subjective qualities of urban environments using identically image-based rating tasks. By collecting Likert-scale judgments about walkability needs, friendliness, and well-being across diverse sidewalk scenes, we established a human baseline and measured the degree to which LLM-generated perceptions align or not with human score distributions. This is a pilot study based on a small-scale dataset, so the statements implying that AI can substitute human auditors have to be moderated. The results are exploratory and context-dependent: AI’s opinion changes based on the specific data and prompt it is given, and its accuracy depends on the diversity of the content of the image. This is a preliminary study based on three illustrative cases: broader generalizations would necessitate a more extensive dataset to confirm these patterns across a wider variety of urban contexts.
The finding suggests that multimodal models may serve as consistent representatives for collective human sentiment when assessing visual urban scenes. The results point to a practical way of making streets more pleasant for pedestrians without relying upon large, expensive surveys every time. With the correct prompting, multimodal LLMs can come close to the typical (median) human judgment across multiple factors for walkability and well-being. LLM results are instantly repeatable; hence, “pedestrian comfort” can be estimated quickly, while at the same time alternatives are compared in real time. In other words, if a proposed change (more tree buffer, less clutter, better separation from traffic, fewer obstacles, and more interesting destination cues) consistently pushes the AI’s scores in the same direction as human preferences, that change is likely to increase the pleasurable walking experience.
More importantly, this paper suggests a design feedback loop that can directly improve the streetscape: generate multiple visual variations of a street (simulated alternatives), score them with the same human-centered prompts, and iterate until the design converges towards higher pedestrian pleasure. This “variation and selection” can run fast enough to fit inside a normal project timeline. Used in this way, the method proposed here does not just rate existing sidewalks; it becomes a quality control and optimization tool. Implementing this design approach will help to ensure that new proposals can evolve—virtually in the direction of what most people actually feel is welcoming and enjoyable at walking speed.
One novel feature of the present analysis is to apply recent, non-standard evaluators of pedestrian urban space. Departing from an industrial planning model that focuses on efficient structure and traffic flow, we instead asked specifically whether a standing spot on a pavement was perceived as inviting to stay in and linger. This quality is found in traditional parts of pedestrian urban fabric but no longer in built environments dating from the end of World War II, except for neotraditionalist and new urbanist developments today. Asking generative AI to estimate this essential human quality—which it readily and accurately did—comes as a welcome tool.
Another notable feature is to respect human emotional attraction above and beyond strict mechanical movement. That is, discover whether a person is drawn to walk along a sidewalk based on unconscious criteria—not because they have to to get to a destination, but because the visual prospect is attractive enough to explore. This is a primary force behind a tourist’s random pedestrian exploration for pleasure but a neglected factor in everyday movements and transactions. Gaining ambulatory pleasure from urban design contributes to long-term health. These two factors underlie the pedestrian urban experience, a missing basis for urban design because they were hitherto difficult to measure. Also, human responses to urban visual settings were thought to be entirely subjective, while our results reveal consistent objective effects.
This study focuses on walkability, environmental friendliness, and well-being, but many other experiential qualities can be inferred from urban photographs. Future studies could examine perceptions such as vibrancy, enclosure, or organized complexity using a similar comparative framework. Another perspective of this work is concerned with how human perceptions can vary depending on culture, age, and lived experience. By collecting ratings from diverse demographic groups, researchers can evaluate whether AI aligns more closely with certain populations than others. Future research can also compare different model architectures, training regimes, and prompting strategies to measure how much accuracy improves over time. For instance, LLM-as-a-judge seems to be a relevant technique to improve AI performance on assessing experiential qualities across diverse visual environments by checking one LLM against another.