1. Introduction
Pancreatic cancer constitutes a significant public health issue globally, and in 2023, 3% of all cancer diagnoses and 7% of all cancer deaths in the U.S., predominantly presenting as adenocarcinoma, which accounts for 90% of cases [
1,
2]. In spite of advances in medical treatments, surgical resection remains the principal potentially curative treatment for adenocarcinoma. Given the heterogeneity in treatment response and outcomes, there is a critical need for biomarkers that can better stratify patients and indicate the most beneficial treatments [
3,
4]. The field of epigenetics, particularly DNA methylation, offers new insights into cancer’s molecular underpinnings [
5,
6]. Dysregulated DNA methylation patterns, including both hypermethylation and hypomethylation, are widely observed in cancer and have been associated with tumor development and progression, making aberrant methylation patterns potentially valuable for cancer diagnosis and therapeutic targeting [
7,
8].
A consistent challenge in epigenetic and biomedical machine learning research is class imbalance, where bias toward majority classes increases the clinical risk of minority-class errors [
9]. Public cancer genomics repositories such as TCGA provide important molecular resources for pancreatic cancer research; however, the availability of normal tissue can be substantially lower than that of tumor tissue. Consequently, an important methodological question is whether computational correction of sample imbalance changes the biological features recovered from the same underlying methylation data. While resampling techniques are widely used to address class imbalance, prior work has primarily focused on improving predictive performance metrics such as accuracy or AUC [
10]. Within high-dimensional omics data, however, the primary goal is often not prediction alone, but the identification of biologically meaningful features [
11]. It remains unclear whether imbalance correction strategies preserve, distort, or enhance the biological relevance of selected gene signatures, particularly in epigenetic datasets such as DNA methylation [
12].
Importantly, resampling does not simply alter class proportions; it also changes the data from which feature importance and statistical associations are estimated. Random undersampling (RUS) achieves a more balanced class distribution by removing majority-class observations, but this process can discard informative samples and potentially reduce representation of heterogeneity within the majority class [
13,
14]. Random oversampling (ROS), in contrast, retains the original observations but repeatedly duplicates minority-class samples, which introduces no new biological information and may increase the risk of overfitting [
14]. Synthetic approaches modify the minority-class distribution more directly. Synthetic Minority Oversampling Technique (SMOTE) generates new observations by interpolating between neighboring minority-class samples, whereas Adaptive Synthetic (ADASYN) places greater emphasis on generating synthetic observations in regions that are more difficult to learn [
15,
16]. Although these approaches are designed primarily to improve learning from imbalanced data, modifying the composition or distribution of the training samples may also alter estimated feature importance, statistical associations, and the resulting ranking of molecular features. This distinction is particularly important for high-dimensional omics studies, where selected features are often interpreted as candidate biomarkers and subsequently subjected to pathway and functional enrichment analyses [
17]. Consequently, a resampling strategy that improves classification performance is not necessarily guaranteed to preserve the same biologically relevant feature-ranking structure as the original dataset.
This study aims to systematically evaluate how different class imbalance correction strategies influence the biological validity of feature selection in PDAC methylation data. Specifically, we investigate whether resampling methods improve the recovery, stability, and pathway-level coherence of biologically meaningful gene signatures, rather than merely altering feature counts. By integrating statistical testing, pancreatic ductal adenocarcinoma (PDAC)-associated gene enrichment, and pathway analysis, we demonstrate that imbalance correction is not simply a preprocessing step, but a critical factor shaping biological interpretation during high-dimensional omics analyses.
2. Previous Work
Machine-learning approaches have increasingly been applied to genome-wide DNA methylation data for cancer classification, prognosis, and biomarker discovery. These applications are particularly attractive because methylation arrays provide measurements at hundreds of thousands of CpG sites, creating a high-dimensional feature selection problem in which machine-learning methods can identify compact disease-associated signatures. However, the combination of high dimensionality, relatively small sample sizes, correlated CpG measurements, missing data, and unequal class distributions presents substantial methodological challenges [
18,
19,
20]. A systematic review of epigenome-wide cancer studies found considerable heterogeneity in machine-learning workflows and emphasized the need for comparative benchmarking of feature-selection strategies [
19].
Several studies have demonstrated the predictive potential of methylation profiles and we summarized them in
Table 1 below. Zheng and Xu developed a deep neural network using TCGA methylation profiles from 7339 patients representing 18 cancer origins, demonstrating that methylation signatures can accurately distinguish tissue of origin [
21]. Modhukur and colleagues subsequently evaluated 9303 methylomes from TCGA and GEO using Random Forest, support vector machine, Naive Bayes, and XGBoost classifiers and explicitly applied SMOTE to address unequal representation among cancer classes [
22]. Other studies have applied machine learning to methylation-based biomarker discovery in stomach cancer, oral cancer, medulloblastoma, sarcoma, and other malignancies [
23,
24,
25,
26]. These studies collectively demonstrate that machine learning can identify informative methylation signatures across diverse cancer types, but their primary objectives have generally been classification, subtype discrimination, or prognostic prediction.
Class imbalance has received increasing attention in methylation-based classification. Gomes et al. combined ANOVA and Random Forest feature selection with SMOTE before deep neural network classification of TCGA breast cancer methylation data [
27]. SMOTE was used to balance tumor and normal samples, and the resulting reduced CpG feature sets supported highly accurate classification. Similarly, Modhukur et al. reported improved classification performance after applying SMOTE to imbalanced pan-cancer methylation data [
22]. More broadly, Yang and Mirzaei compared multiple resampling techniques across TCGA breast, liver, and colon multi-omics datasets containing DNA methylation and found that resampling strategy influenced classification performance, with SMOTE performing strongly across their evaluated conditions [
10]. Recent methylation-based classifiers have likewise recognized severe class imbalance as an important consideration when evaluating tumor-versus-normal prediction [
28].
These studies establish the importance of addressing class imbalance but also reveal an important distinction between predictive performance and biological feature discovery. Resampling modifies the observations from which feature importance and statistical associations are estimated. Random undersampling removes majority-class observations and may therefore discard biological heterogeneity, whereas random oversampling reuses existing minority observations. Synthetic approaches such as SMOTE and ADASYN generate additional observations from the minority-class feature space. Consequently, resampling strategies that improve sensitivity, F1-score, or classification accuracy are not necessarily expected to preserve the same CpG rankings or downstream biological signatures.
This distinction is particularly relevant for methylation biomarker discovery. Existing methylation studies have used methods including ANOVA, Random Forest, LASSO, Cox regression, support vector machines, deep neural networks, and clustering to identify diagnostically or prognostically informative CpG loci [
23,
24,
27,
29]. Reviews of this literature have emphasized substantial variation in feature-selection workflows and the difficulty of evaluating biomarker robustness across analytical strategies [
19,
20]. Nevertheless, studies that apply resampling typically assess its benefit using predictive metrics rather than systematically examining whether different imbalance-correction methods alter the identity, stability, and biological relevance of selected methylation features.
The present study addresses this gap by treating class-imbalance correction as a factor that may influence biological discovery rather than solely as a classification preprocessing step. Using the highly imbalanced TCGA-PAAD tumor–normal methylation cohort, we compare oversampling, synthetic oversampling, undersampling, neighborhood-based cleaning, and a no-resampling baseline under a common feature-ranking framework. The resulting feature sets are evaluated not only according to their stability and cross-method agreement but also according to their recovery of literature-supported PDAC-associated genes and enrichment of biologically relevant pathways. This design allows us to determine whether resampling strategies that alter feature selection nevertheless converge on common higher-level pancreatic cancer biology.
3. Methods
3.1. Dataset
Genome-wide DNA methylation data were obtained from The Cancer Genome Atlas (TCGA) Pancreatic Adenocarcinoma (PAAD) project through the National Cancer Institute (NCI) Genomic Data Commons (GDC). Methylation profiles were generated using the Illumina HumanMethylation450 BeadChip platform, which quantifies methylation levels at approximately 450,000 CpG loci distributed across promoters, gene bodies, CpG islands, shores, shelves, and intergenic regions throughout the human genome [
30,
31].
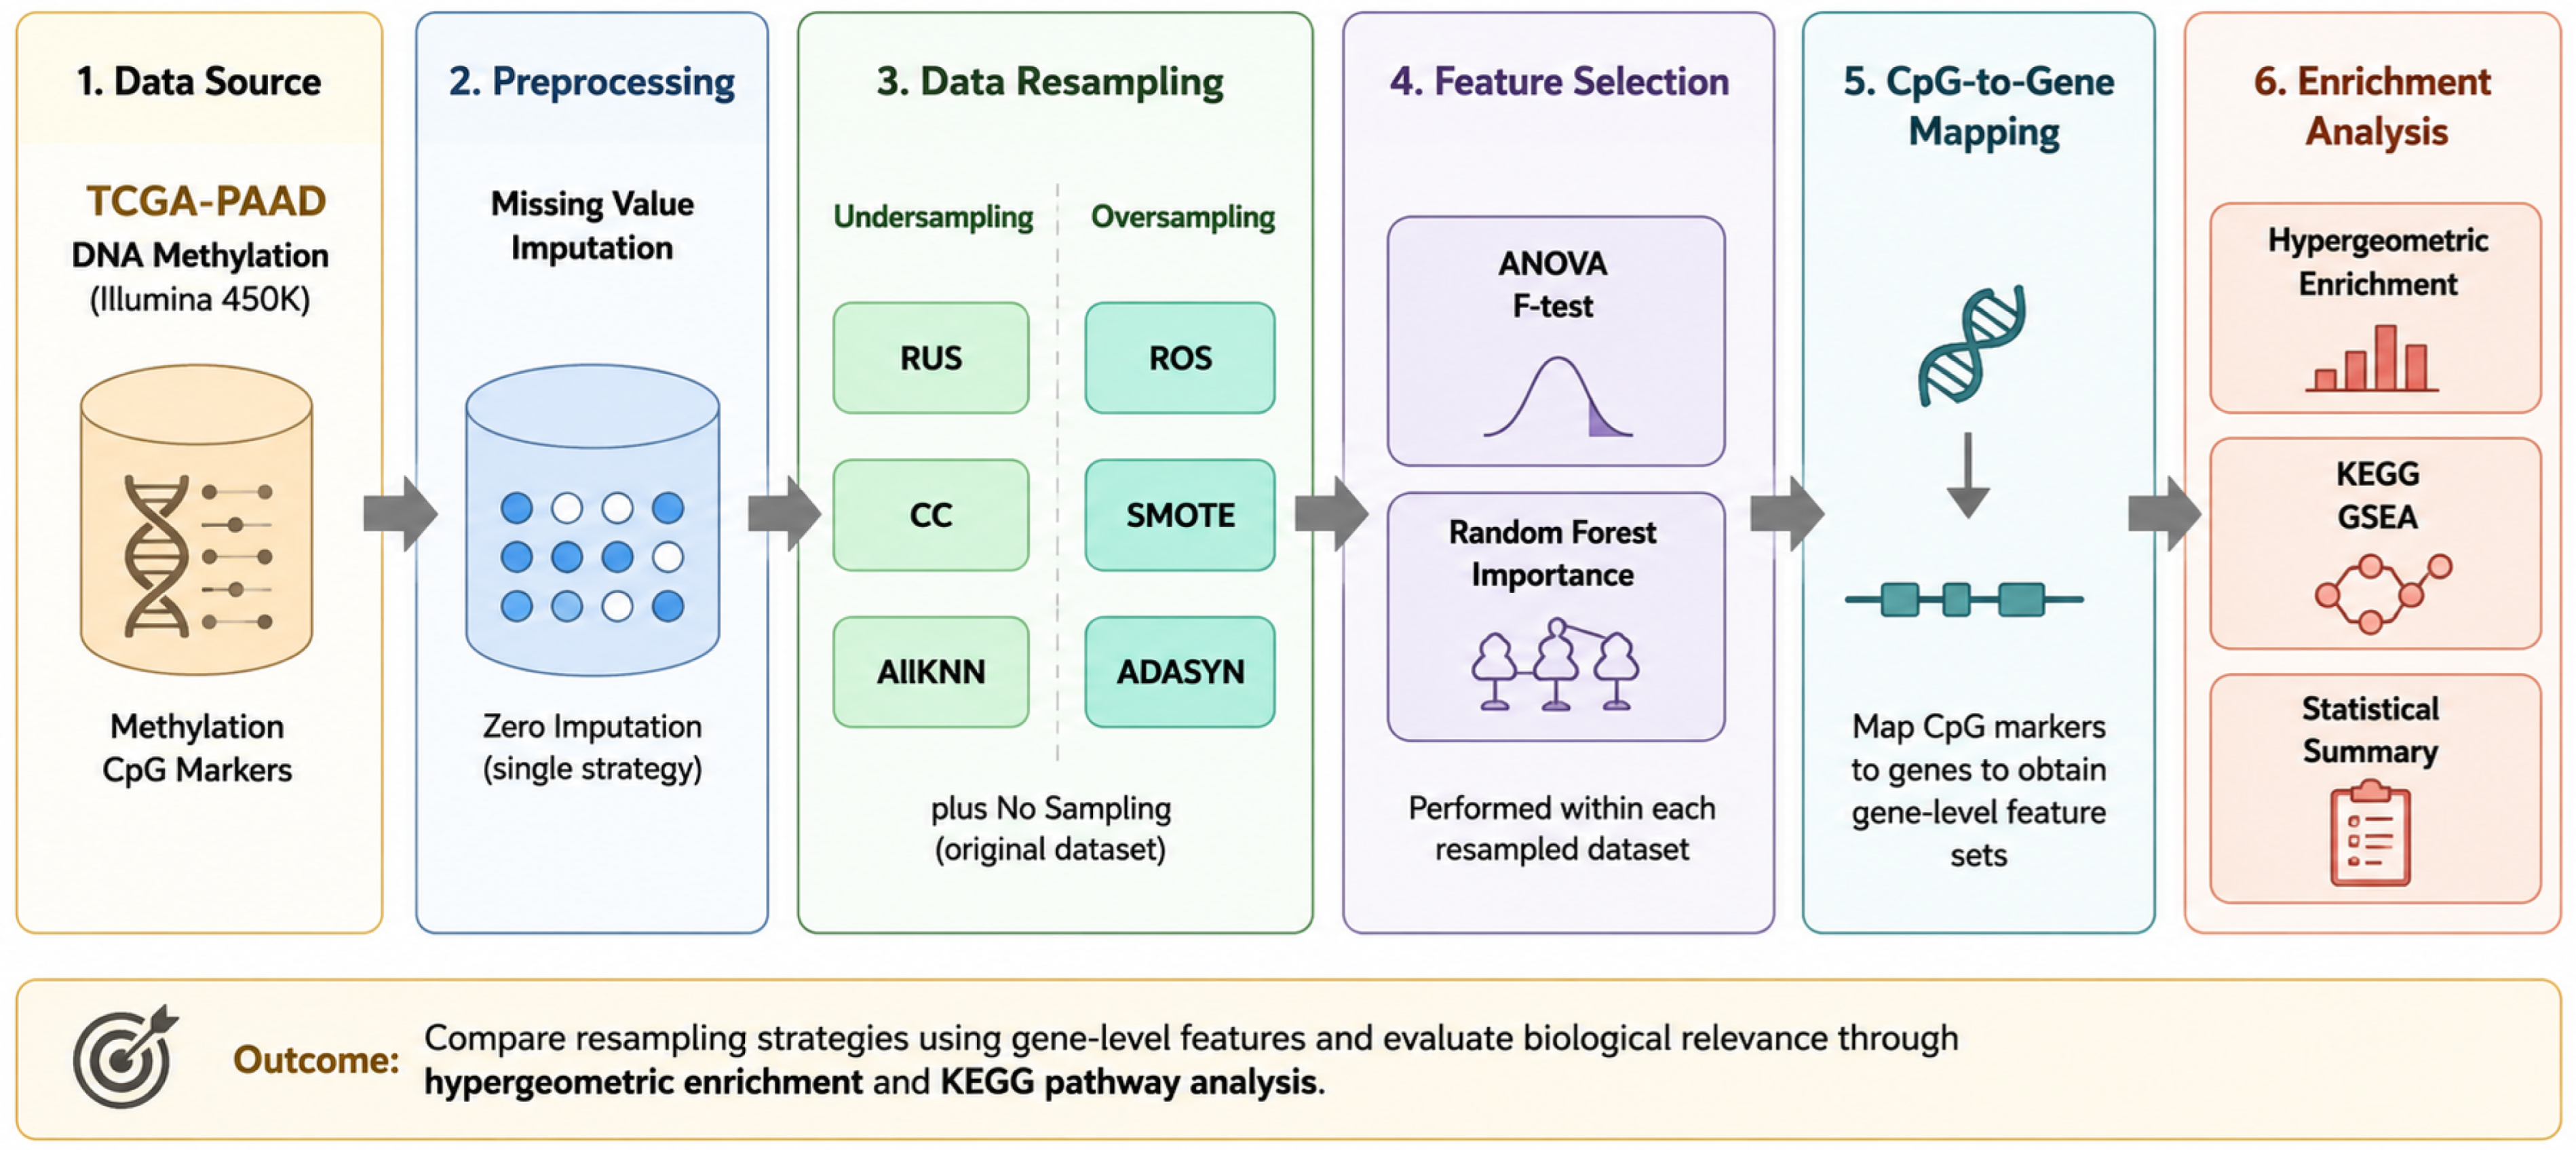
The downloaded dataset consisted of 195 methylation array files representing 184 unique donors, including 11 normal pancreatic tissue samples and 184 PDAC tumor samples. The initial methylation matrix contained 485,578 CpG probes prior to quality control and preprocessing. As expected for TCGA-PAAD, the dataset exhibited substantial class imbalance, with tumor samples greatly outnumbering normal controls. An overview of the complete analytical workflow is presented in
Figure 1. Beginning with TCGA methylation profiles, the pipeline consisted of data preprocessing, class imbalance correction, feature statistic computation, continuous feature ranking, gene-level enrichment analysis, and pathway-level biological validation. Each component of the workflow is described in the following sections.
3.2. Data Preprocessing
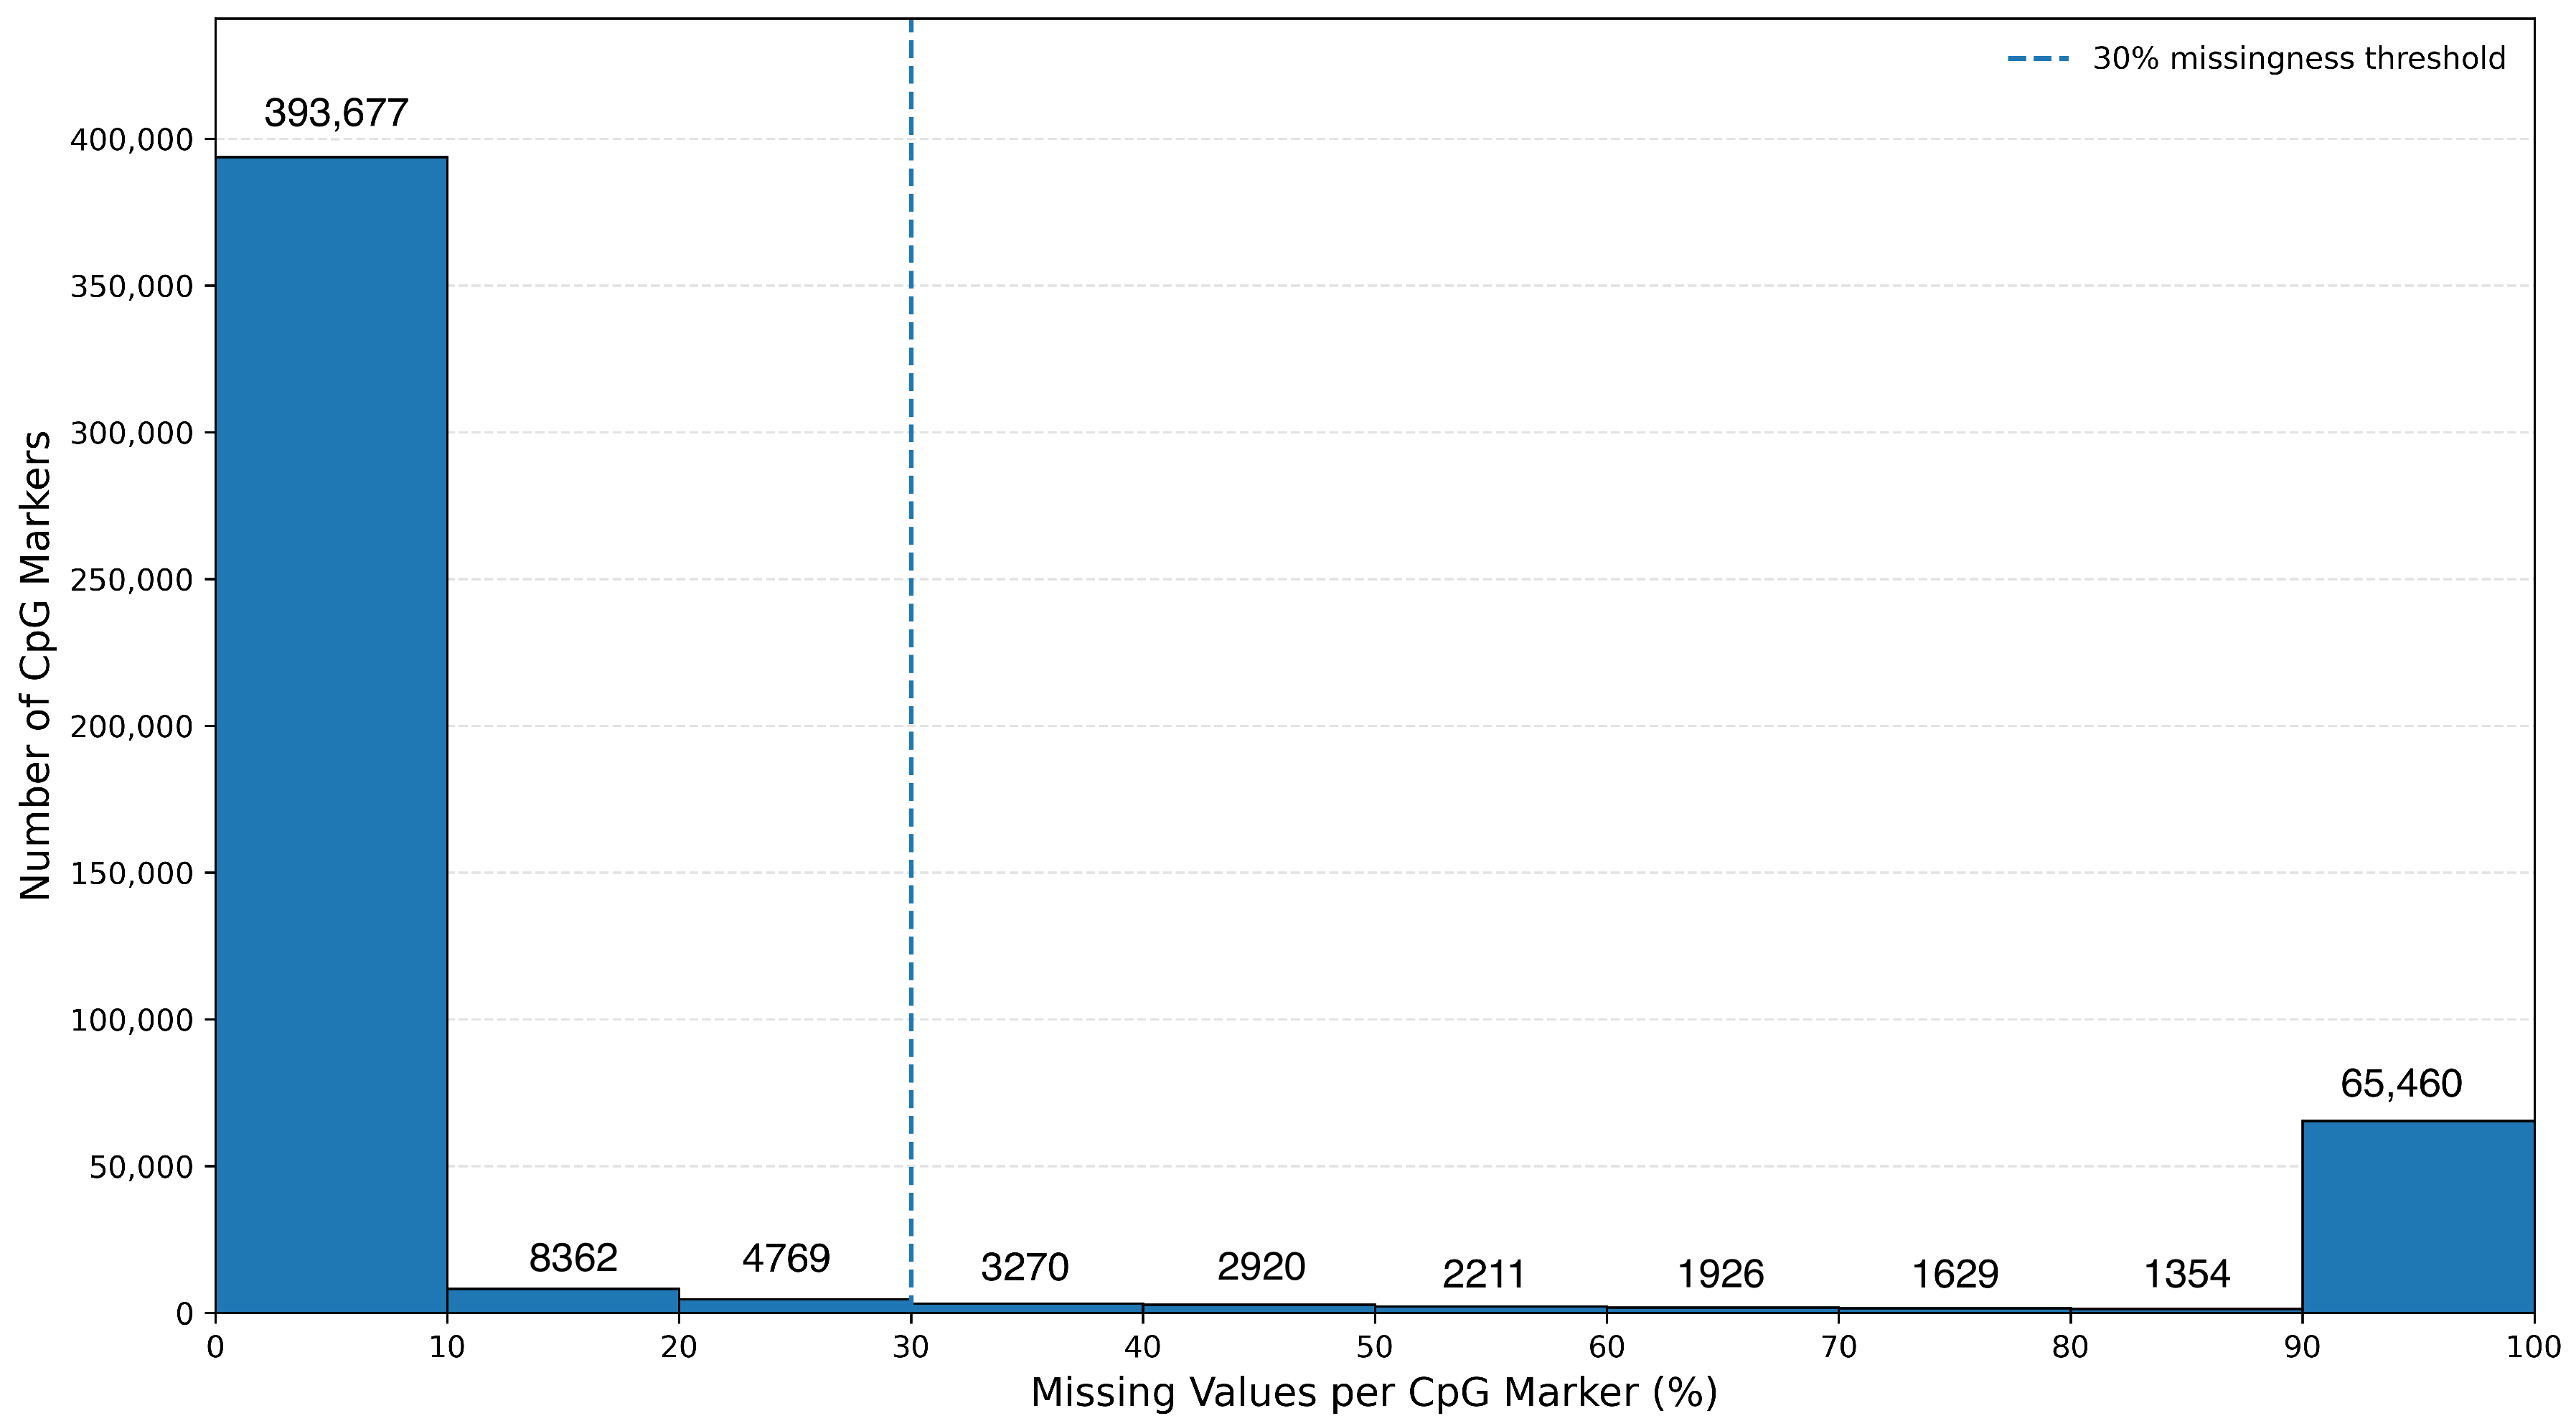
Raw DNA methylation data were subjected to a series of preprocessing steps prior to feature selection and biological analysis to improve data quality while preserving biologically meaningful variation. The initial methylation matrix contained 485,578 CpG probes measured across all TCGA-PAAD samples. Because high proportions of missing measurements can reduce statistical power and introduce bias into downstream analyses, CpG probes with more than 30% missing values were removed [
32], excluding 78,771 of the original 485,578 CpG markers and retaining 406,807 markers (83.78%) for downstream analysis. Missing values among the retained markers were subsequently imputed, and the same CpG feature space was used across the no-resampling baseline and all six class imbalance correction strategies. Missing values were imputed using three commonly employed imputation strategies: zero imputation, mean imputation, and k-nearest neighbor (kNN) imputation. The missing value distribution is shown in
Figure 2. Among the evaluated approaches, zero imputation produced the lowest reconstruction error and was therefore used for all subsequent analyses.
Rather than assuming a priori that one imputation strategy would perform best, all three methods were systematically evaluated using the reconstruction error framework developed in our previous work [
27]. We randomly masked known methylation values, reconstructed them using each imputation method, and compared the results with the original values to quantify reconstruction accuracy. The imputation strategy producing the lowest reconstruction error was selected for all subsequent analyses. This data-centric approach ensured that downstream feature selection and biological interpretation were based on the most reliable representation of the methylation landscape.
3.3. Class Imbalance Correction
The TCGA-PAAD methylation dataset exhibited substantial class imbalance, consisting of 184 tumor samples and only 11 normal pancreatic tissue samples. Such imbalance can bias statistical feature selection methods toward the majority class, potentially masking biologically informative methylation differences associated with the minority class. Seven experimental conditions were evaluated, consisting of six imbalance correction techniques and a no-resampling baseline. The oversampling approaches included ROS, SMOTE, and ADASYN, whereas the undersampling approaches consisted of RUS, ClusterCentroids, and All K-Nearest Neighbors (AllKNN). All methods were implemented using the imbalanced-learnlibrary [
33] in Python. AllKNN was treated separately from the fixed-ratio methods because it performs neighborhood-based data cleaning rather than resampling to a predetermined class ratio; consequently, its final class distribution was determined by the samples removed by the algorithm.
To ensure a consistent comparison across methods while avoiding excessive modification of the original data distribution, ROS, SMOTE, ADASYN, RUS, and ClusterCentroids were configured using a sampling ratio of 0.5, corresponding to a minority-to-majority ratio of 1:2 rather than complete class balance (1:1). The 0.5 sampling ratio was specified a priori and held constant across fixed-ratio resampling methods to provide a controlled comparison of resampling mechanisms rather than to optimize the class ratio separately for each method. The intermediate 1:2 minority-to-majority ratio substantially reduced the original imbalance while avoiding complete replacement of the observed class structure with an artificially balanced 1:1 distribution. This ratio is therefore used as a common experimental condition and is not intended to represent a universally optimal resampling ratio. Previous studies have also shown that aggressive oversampling may increase the likelihood of overfitting and introduce synthetic observations that do not accurately represent the underlying biological variability [
34]. The selected ratio therefore provided a compromise between reducing class imbalance and preserving the characteristics of the original methylation profiles.
Random Undersampling (RUS) reduced the majority class by randomly selecting 22 tumor samples from the original cohort to achieve the desired 1:2 ratio with the 11 normal samples. Because a single random subset may not adequately represent the biological heterogeneity of the tumor population, RUS was repeated across multiple independent random subsets, and feature selection results were aggregated across repeated analyses to reduce sampling bias.
ClusterCentroids performed majority-class reduction by clustering tumor samples and replacing groups of majority-class observations with their corresponding centroids to achieve the target sampling ratio. This approach attempts to preserve the overall structure of the majority class while substantially reducing the number of observations. AllKNN was implemented using three nearest neighbors. Unlike the other resampling strategies, AllKNN iteratively removes majority-class observations according to neighborhood disagreement rather than enforcing a predetermined final class ratio.
The three oversampling methods increased the representation of the minority class through different mechanisms. Random OverSampling (ROS) duplicated existing normal samples until the desired sampling ratio was achieved. SMOTE generated synthetic minority samples by interpolating between neighboring minority observations in feature space and was implemented using three nearest neighbors (). ADASYN similarly generated synthetic minority observations but adaptively emphasized regions in which minority samples were more difficult to learn; ADASYN was also implemented using three nearest neighbors. For stochastic resampling methods, analyses were repeated across 10 runs using run-specific random seeds.
Each resampling strategy produced a distinct methylation dataset that was subsequently analyzed independently using the same feature ranking and biological validation pipeline. This design enabled direct comparison of how different imbalance correction techniques influenced the selection of methylation biomarkers and the biological pathways identified during downstream analyses.
3.4. Continuous Feature Ranking Framework
Following class imbalance correction, for each resampled dataset, feature importance was evaluated using two independent statistical approaches. The first approach employed a Random Forest classifier consisting of 500 decision trees to estimate feature importance based on the cumulative reduction in node impurity contributed by each CpG probe across the forest. Random Forest importance captures nonlinear relationships and higher-order feature interactions that may not be detected using univariate statistical methods [
35,
36]. The second approach utilized a univariate Analysis of Variance (ANOVA) test to evaluate the statistical association between individual CpG methylation levels and disease status. ANOVA provides a complementary measure of feature significance by quantifying differences in mean methylation between normal and tumor samples while treating each CpG locus independently. A CpG marker was considered Random Forest-supported within an analysis run when its feature importance was greater than zero, whereas ANOVA support was defined as
p < 0.05.
CpG-level feature statistics were first mapped to gene symbols using the Illumina HumanMethylation450 annotation. When multiple CpG markers mapped to the same gene within an analysis run, the maximum Random Forest importance was retained as the gene-level Random Forest statistic, while the maximum ANOVA F-statistic and minimum ANOVA p-value were retained for that gene. This approach preserved strong locus-specific methylation signals associated with individual genes rather than averaging potentially heterogeneous signals across CpG sites.
Gene-level statistics were subsequently aggregated across repeated analyses. For Random Forest, the mean feature importance and the number of runs with nonzero importance were calculated for each gene. For ANOVA, the mean F-statistic, minimum p-value, and number of runs achieving (p < 0.05) were calculated. Random Forest analysis was repeated across 10 runs for all conditions because model fitting is stochastic. ANOVA was recalculated for each resampled dataset; for the no-resampling baseline, ANOVA was calculated once because it is deterministic when the underlying dataset is unchanged.
To integrate Random Forest and ANOVA evidence on comparable scales, the mean Random Forest importance and mean ANOVA F-statistic were independently transformed using
and standardized to z-scores within each imbalance correction strategy. For gene
g, the continuous consensus score was defined as
where
denotes the mean Random Forest importance across runs,
denotes the mean ANOVA F-statistic across available runs, and
denotes z-score standardization. Random Forest and ANOVA therefore contributed equally to the final score. Genes were ranked in descending order of
to generate the complete continuous consensus ranking for each imbalance correction strategy.
To assess the robustness of the proposed continuous feature ranking framework, several complementary analyses were performed following the generation of consensus feature rankings. These analyses evaluated differences in the number of identified genes, the distribution of continuous feature scores, and the level of agreement between Random Forest and ANOVA-derived evidence across the various resampling strategies. Additional robustness assessments included feature stability across repeated analyses, recurrence of highly ranked genes, pairwise similarity among identified gene sets, and consistency of pathway enrichment. The resulting feature summaries were evaluated using complementary biological validation approaches: discrete consensus gene sets supported by both Random Forest and ANOVA were used for PDAC reference-gene enrichment, whereas the complete continuous consensus rankings were used for preranked pathway enrichment analysis.
3.5. Gene-Level Biological Validation
For analyses requiring a discrete set of prioritized genes, a consensus selection criterion was applied independently of the continuous ranking score. A gene was included in the discrete consensus set if it exhibited nonzero Random Forest importance in at least one analysis run and ANOVA significance (p < 0.05) in at least one available run. These RF–ANOVA intersection sets are referred to throughout the manuscript as the discrete consensus gene sets or selected gene sets. Thus, discrete gene selection required evidence from both feature-evaluation approaches, whereas the continuous consensus ranking retained the complete gene-level feature landscape.
A reference set of 214 pancreatic cancer-associated genes was assembled from genes reported in the pancreatic cancer methylation analysis [
37,
38,
39,
40,
41] together with canonical PDAC-associated genes [
42,
43,
44]. After removal of duplicate gene symbols, the combined reference set contained 220 unique genes. Prior to enrichment testing, this reference set was intersected with the measured methylation-array gene universe. Of the 220 reference genes, 212 were represented in the background universe (
) and were therefore eligible for hypergeometric enrichment analysis. The enrichment background consisted of all unique gene symbols represented in the Illumina HumanMethylation450 annotation after CpG-to-gene mapping, yielding 35,555 unique annotated gene symbols (
). Both the consensus gene sets and the curated PDAC reference set were restricted to this measured universe prior to enrichment testing.
The statistical significance of the observed overlap was evaluated independently for each imbalance correction strategy using a one-sided hypergeometric test. For a consensus set containing
n genes and an observed overlap of
k PDAC-associated genes, the test evaluated the probability of observing at least
k reference genes by chance given
M = 35,555 and
. The expected overlap under random selection was calculated as
and fold enrichment was calculated as
In addition to the hypergeometric p-value, the number and proportion of recovered PDAC-associated genes, expected overlap, and fold enrichment were reported for each strategy. Because enrichment was evaluated independently across seven analysis strategies, Benjamini–Hochberg correction was applied across the seven hypergeometric tests to control the false discovery rate. Both raw and adjusted p-values are reported, with adjusted p < 0.05 considered statistically significant.
3.6. Pathway Enrichment Analysis
Although gene-level validation assesses the recovery of known pancreatic cancer-associated genes, biological processes are governed by coordinated interactions among multiple genes. Therefore, pathway enrichment analysis was performed to determine whether the genes prioritized by each resampling strategy converged on established molecular pathways associated with PDAC.
In contrast to the discrete consensus sets used for hypergeometric enrichment, pathway-level analysis used the complete gene-level continuous ranking for each imbalance correction strategy. For each method, all 32,771 valid mapped gene symbols and continuous consensus scores were ranked from highest to lowest according to
and supplied to the
prerank implementation in the
gseapy Python package [
45]. No filtering based on positive continuous scores or discrete RF–ANOVA consensus membership was applied before preranked GSEA. Pathway definitions were obtained from the KEGG_2021_Human gene-set library. KEGG was selected to provide a curated, pathway-level representation of biological processes while maintaining a sufficiently broad search space to evaluate biological convergence across resampling strategies. The analysis was not restricted to cancer-specific gene sets, allowing PDAC-associated pathways to emerge from the broader pathway collection rather than being imposed a priori.
Gene sets containing fewer than 10 or more than 500 genes were excluded to reduce instability associated with very small gene sets and to limit the influence of overly broad, nonspecific gene sets. These thresholds are consistent with commonly used gene-set size restrictions in preranked GSEA analyses. Enrichment significance was estimated using 1000 permutations with a fixed random seed of 42. Normalized enrichment scores (NES) and false discovery rate (FDR) q-values were calculated for each pathway, with FDR considered statistically significant.
For PDAC-focused interpretation, significant pathways were additionally screened for terms corresponding to established pancreatic cancer-associated processes, including MAPK, TGF-
/SMAD, Notch, Hedgehog, PI3K–Akt, focal adhesion, epithelial–mesenchymal transition, cell-cycle regulation, and DNA replication [
46,
47,
48,
49]. Enrichment patterns were subsequently compared across imbalance correction strategies to assess whether differences in gene-level prioritization altered recovery of established PDAC-associated biological processes. All statistical analyses were performed in Python 3.11. The complete source code and analysis pipeline used in this study are made available through a GitHub repository to facilitate reproducibility and reuse.
4. Results
4.1. Discrete Consensus Gene Sets Differ Across Resampling Strategies
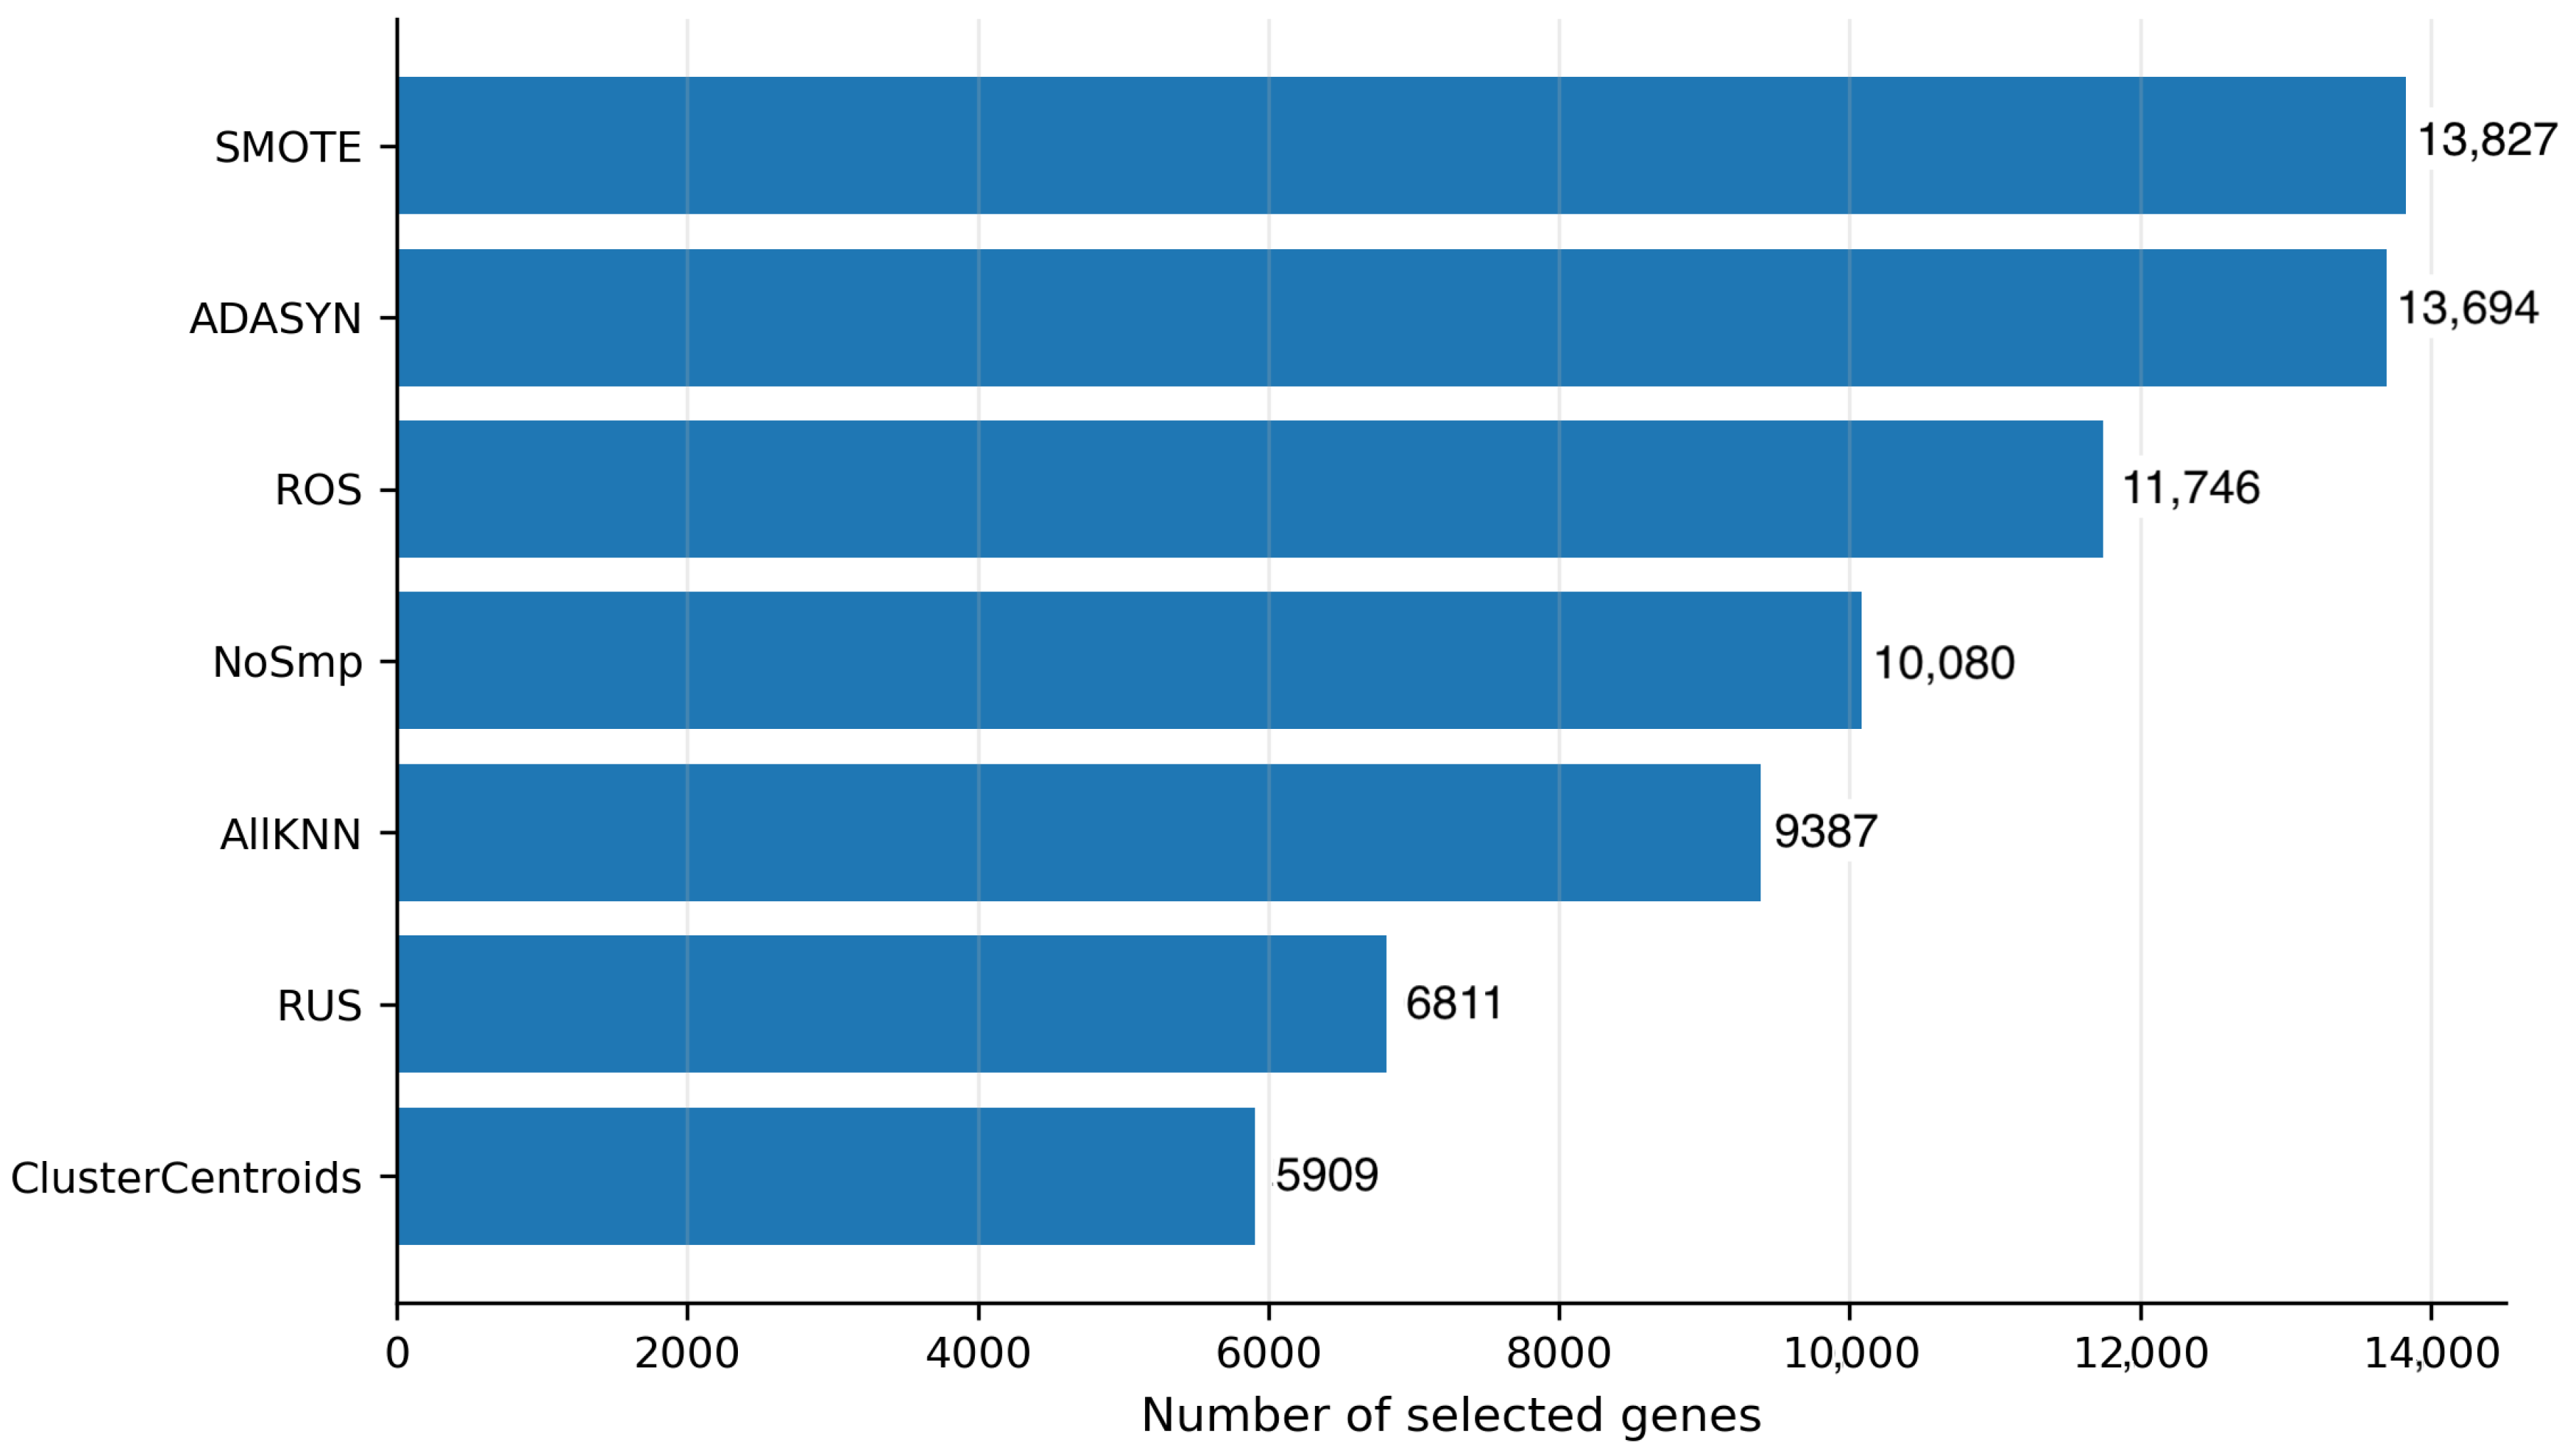
Application of the discrete RF–ANOVA consensus criterion revealed substantial differences in the number of genes selected under the various class imbalance correction strategies (
Figure 3). Although all methods were applied to the same TCGA-PAAD methylation dataset using an identical downstream analytical pipeline, the resulting consensus gene sets ranged from 5909 genes for ClusterCentroids to 13,827 genes for SMOTE, representing a 2.34-fold difference in biomarker recovery.
Among the oversampling approaches, SMOTE identified the most unique genes (13,827), followed by ADASYN (13,694) and ROS (11,746). The no-resampling baseline identified 10,080 genes despite the pronounced class imbalance present in the original dataset. For undersampling methods, we noticed considerably smaller consensus gene sets, with AllKNN identifying 9387 genes, RUS identifying 6811 genes, and ClusterCentroids identifying only 5909 genes.
These findings show that resampling methods influence not only class-distribution balance but also the biological features ultimately selected for downstream analysis. Larger feature sets may capture a broader spectrum of potentially relevant genes, whereas smaller feature sets may represent more conservative biomarker selection. However, the biological significance of these differences cannot be determined solely by gene count and therefore requires further evaluation through biological validation. The highest-ranked genes for each resampling strategy are shown in
Figure S1. Although the composition and ordering of the top-ranked genes varied among methods, several candidates appeared among the leading features under multiple imbalance correction strategies.
4.2. Continuous Feature Score Distributions Reveal Differences in Feature Prioritization
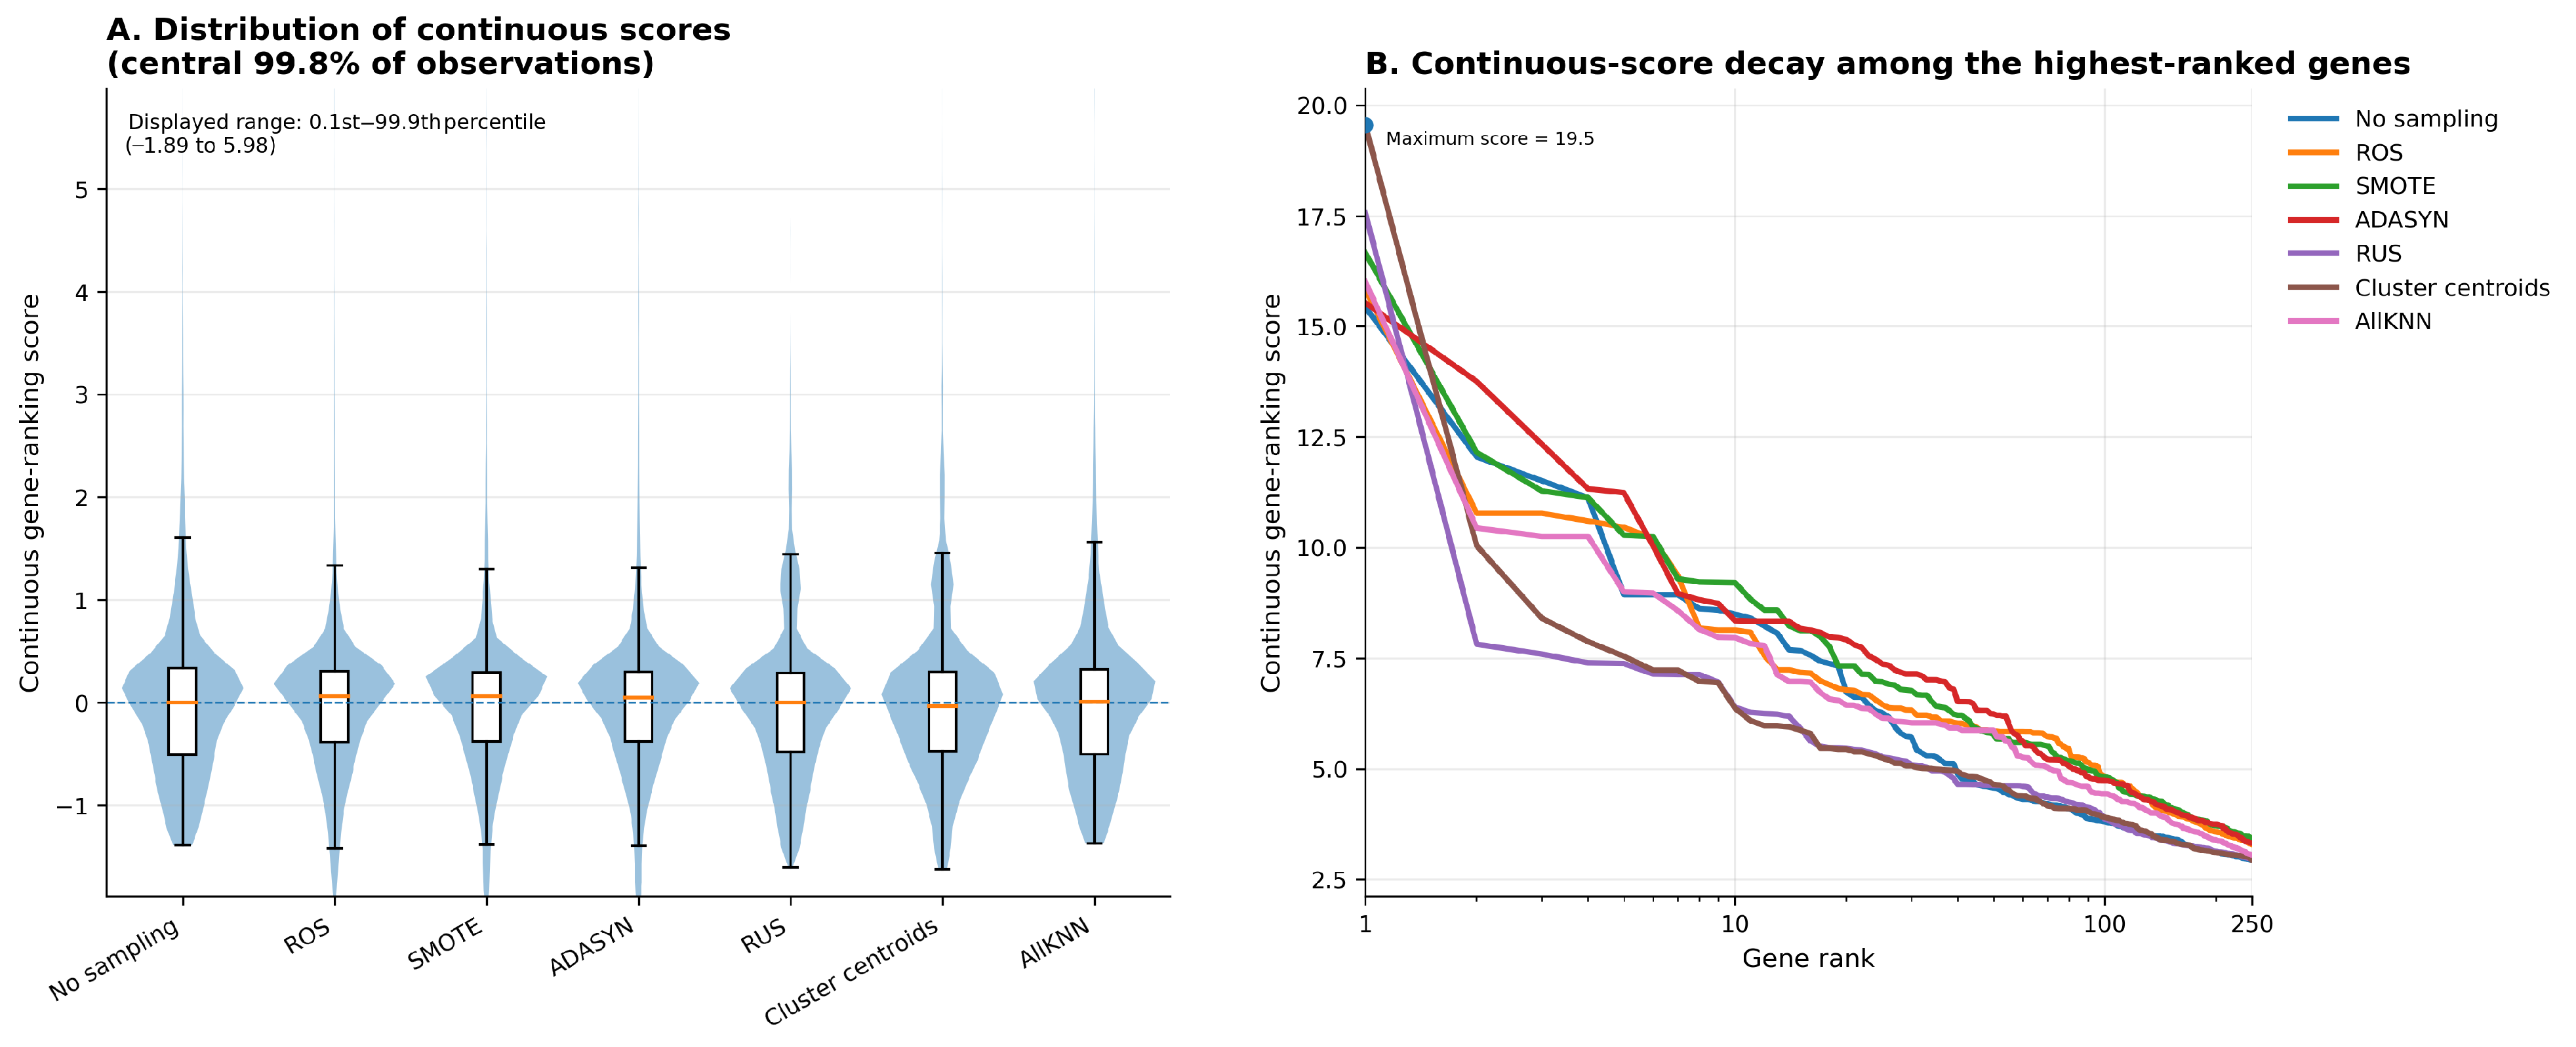
Continuous gene-ranking scores exhibited broadly similar distributions across the seven analysis strategies, although differences were observed in both the proportion of positively ranked genes and the decay of scores among the highest-ranked features (
Figure 4A). The continuous ranking framework assigns each feature a normalized consensus score derived from both Random Forest importance and ANOVA significance across repeated analyses, allowing the relative contribution of every selected feature to be evaluated rather than relying solely on binary selection. Across all the ranked genes per method, 47.65–55.08% received continuous scores greater than zero. SMOTE produced the largest proportion of positively scored genes (18,051; 55.08%), followed by ROS (17,974; 54.85%) and ADASYN (17,664; 53.90%), whereas ClusterCentroids produced the smallest proportion (15,616; 47.65%). Differences became more apparent among higher-scoring genes. At a continuous-score threshold of approximately 1.0, RUS and ClusterCentroids retained 3289 (10.04%) and 3188 (9.73%) genes, respectively, compared with 1490–1552 genes (4.55–4.74%) for the three oversampling approaches. At a threshold of approximately 3.0, however, only 235–303 genes (0.72–0.92%) remained across methods, indicating that strongly ranked genes constituted a small fraction of the overall gene-ranking space.
As shown in
Figure 4B, among the top 250 ranked genes, ClusterCentroids produced the highest individual continuous score (19.55), followed by RUS (17.56) and SMOTE (16.66). However, the ClusterCentroids and RUS score profiles declined rapidly, reaching 6.36 and 6.39, respectively, by rank 10. In contrast, SMOTE retained a score of 9.20 at rank 10, the highest among all methods. By rank 100, scores ranged from 3.80 to 4.81, and by rank 250, the range had narrowed further to 2.94–3.43. These patterns indicate that some undersampling strategies like ClusterCentroids produced exceptionally high scores for a small number of top-ranked genes, whereas the oversampling approaches, particularly SMOTE, maintained comparatively elevated scores across a broader portion of the highest-ranked features.
4.3. Random Forest and ANOVA Provide Complementary Feature Rankings
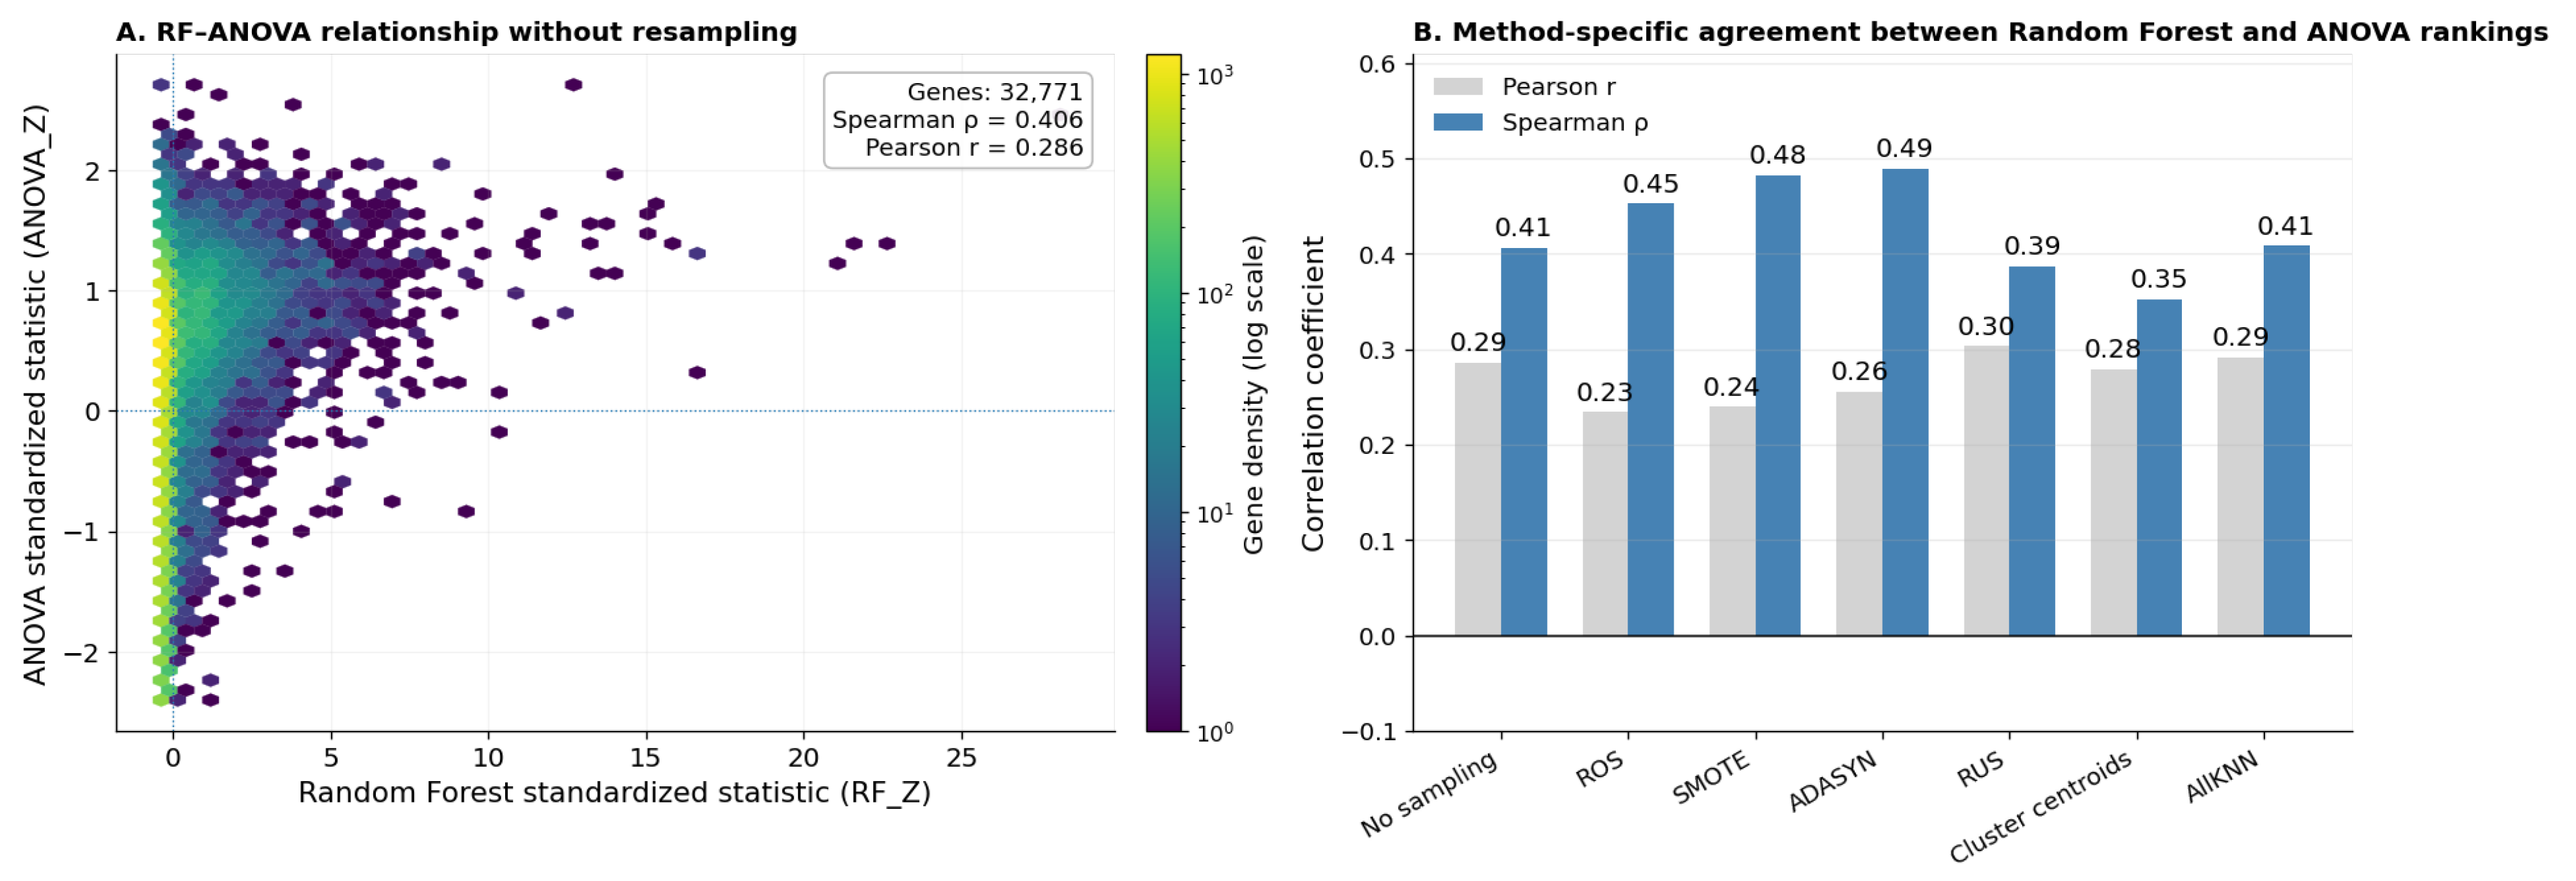
Figure 5A illustrates the relationship between normalized Random Forest feature importance and normalized ANOVA scores for all 32,771 valid gene symbols. Although both methods generally prioritized similar genes, substantial variation in score magnitude was observed. Most genes received minimal Random Forest importance while spanning a broad range of ANOVA scores, producing a dense vertical distribution near zero Random Forest importance. Pearson correlations were consistently lower (0.234–0.303) than Spearman rank correlations (0.352–0.489), indicating stronger agreement in gene ranking than in absolute score magnitude. Random Forest feature importance and ANOVA statistical testing therefore exhibited moderate agreement across all class imbalance correction strategies while retaining substantial complementary information, as shown in
Figure 5B and
Table 2. Pearson correlation coefficients ranged from 0.234 (ROS) to 0.303 (RUS), whereas Spearman rank correlations ranged from 0.352 (ClusterCentroids) to 0.489 (ADASYN), indicating consistent but non-identical feature prioritization. Because feature evidence from the stochastic resampling procedures was aggregated across 10 independent runs, these correlations characterize the overall feature-ranking behavior of each strategy rather than agreement from a single resampling realization. The correlation coefficients are therefore interpreted descriptively as measures of agreement between the Random Forest and ANOVA feature-ranking approaches rather than as statistical comparisons of the resampling strategies.
The complementary contributions of Random Forest and ANOVA are further illustrated in
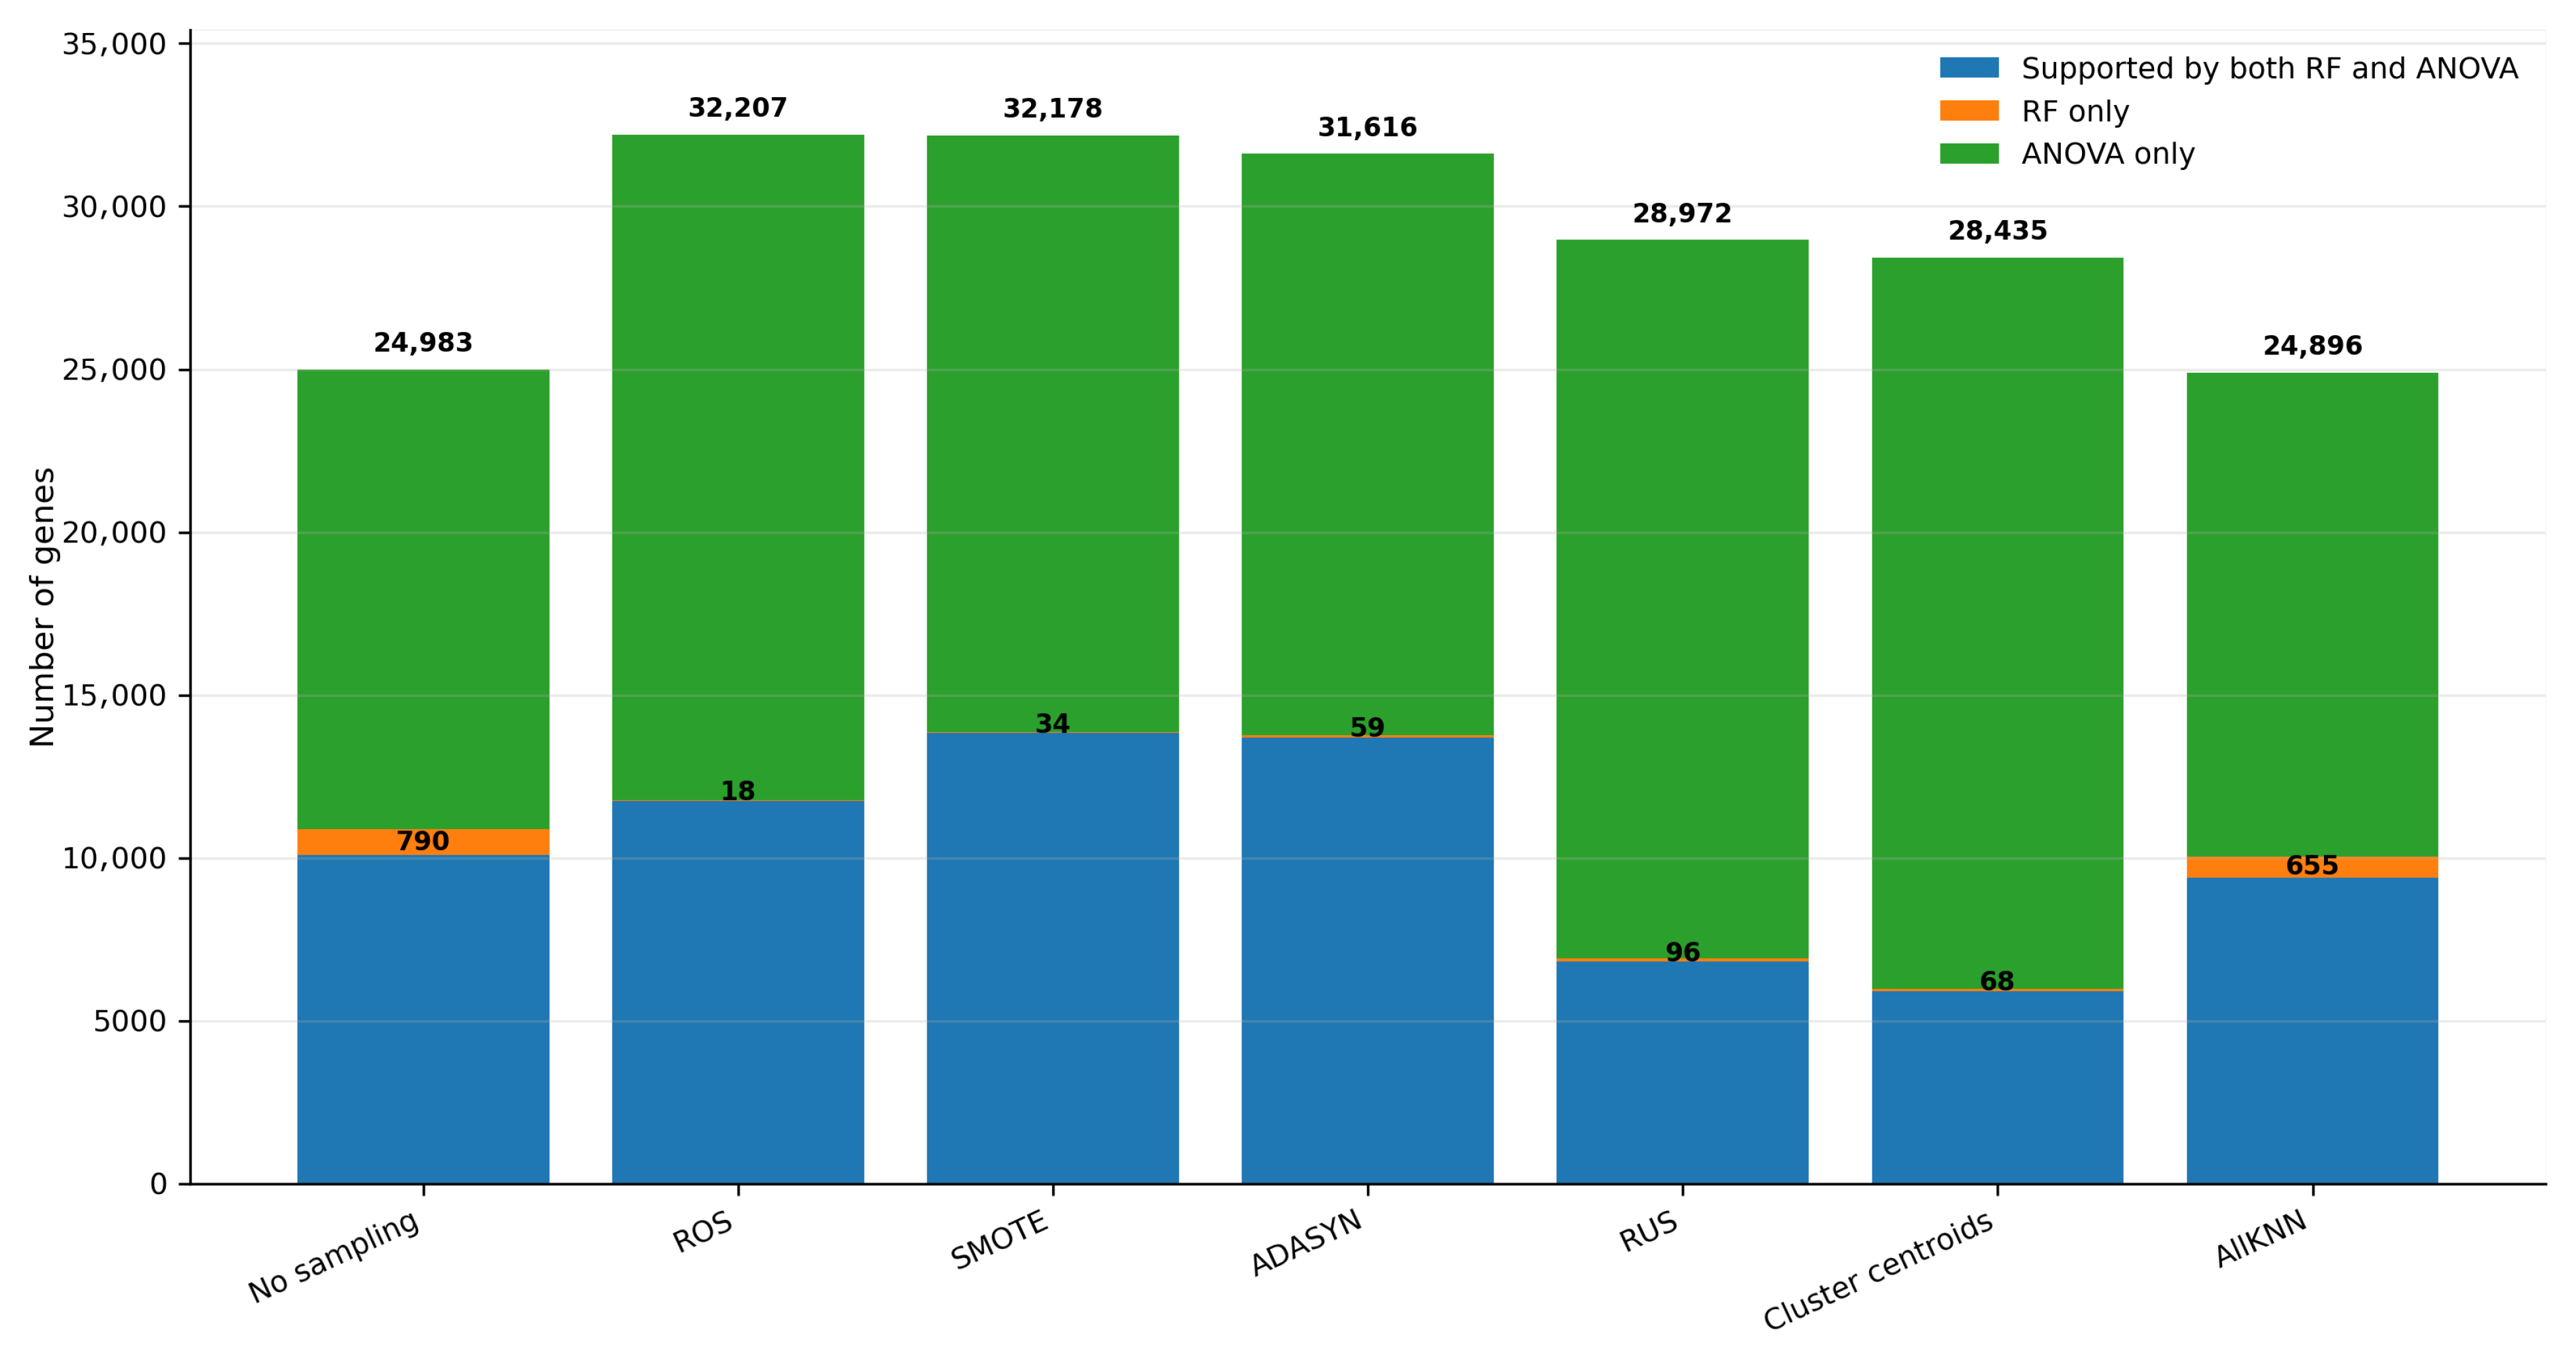
Figure 6. Across the seven analysis strategies, between 5909 and 13,827 genes were jointly supported by both approaches, whereas the number of genes supported exclusively by Random Forest was comparatively small, ranging from 18 genes for ROS to 790 genes for the no-sampling baseline. In contrast, ANOVA contributed a substantially larger set of uniquely supported genes, ranging from 14,113 genes for the no-sampling baseline to 22,458 genes for ClusterCentroids. For example, SMOTE produced 13,827 genes supported by both methods, only 34 Random Forest-only genes, and 18,317 ANOVA-only genes.
This asymmetric contribution indicates that the two approaches are not simply producing redundant feature lists. ANOVA identifies a broad set of CpG-associated genes exhibiting statistical differences between tumor and normal samples, whereas Random Forest provides an additional multivariate measure of their predictive importance. The relatively small Random Forest-only component suggests that Random Forest primarily refines and reprioritizes genes with statistical support rather than identifying an entirely independent biomarker set. Integrating the two sources of evidence therefore allows the continuous ranking framework to distinguish genes supported by both statistical association and predictive importance while retaining complementary information contributed by either approach.
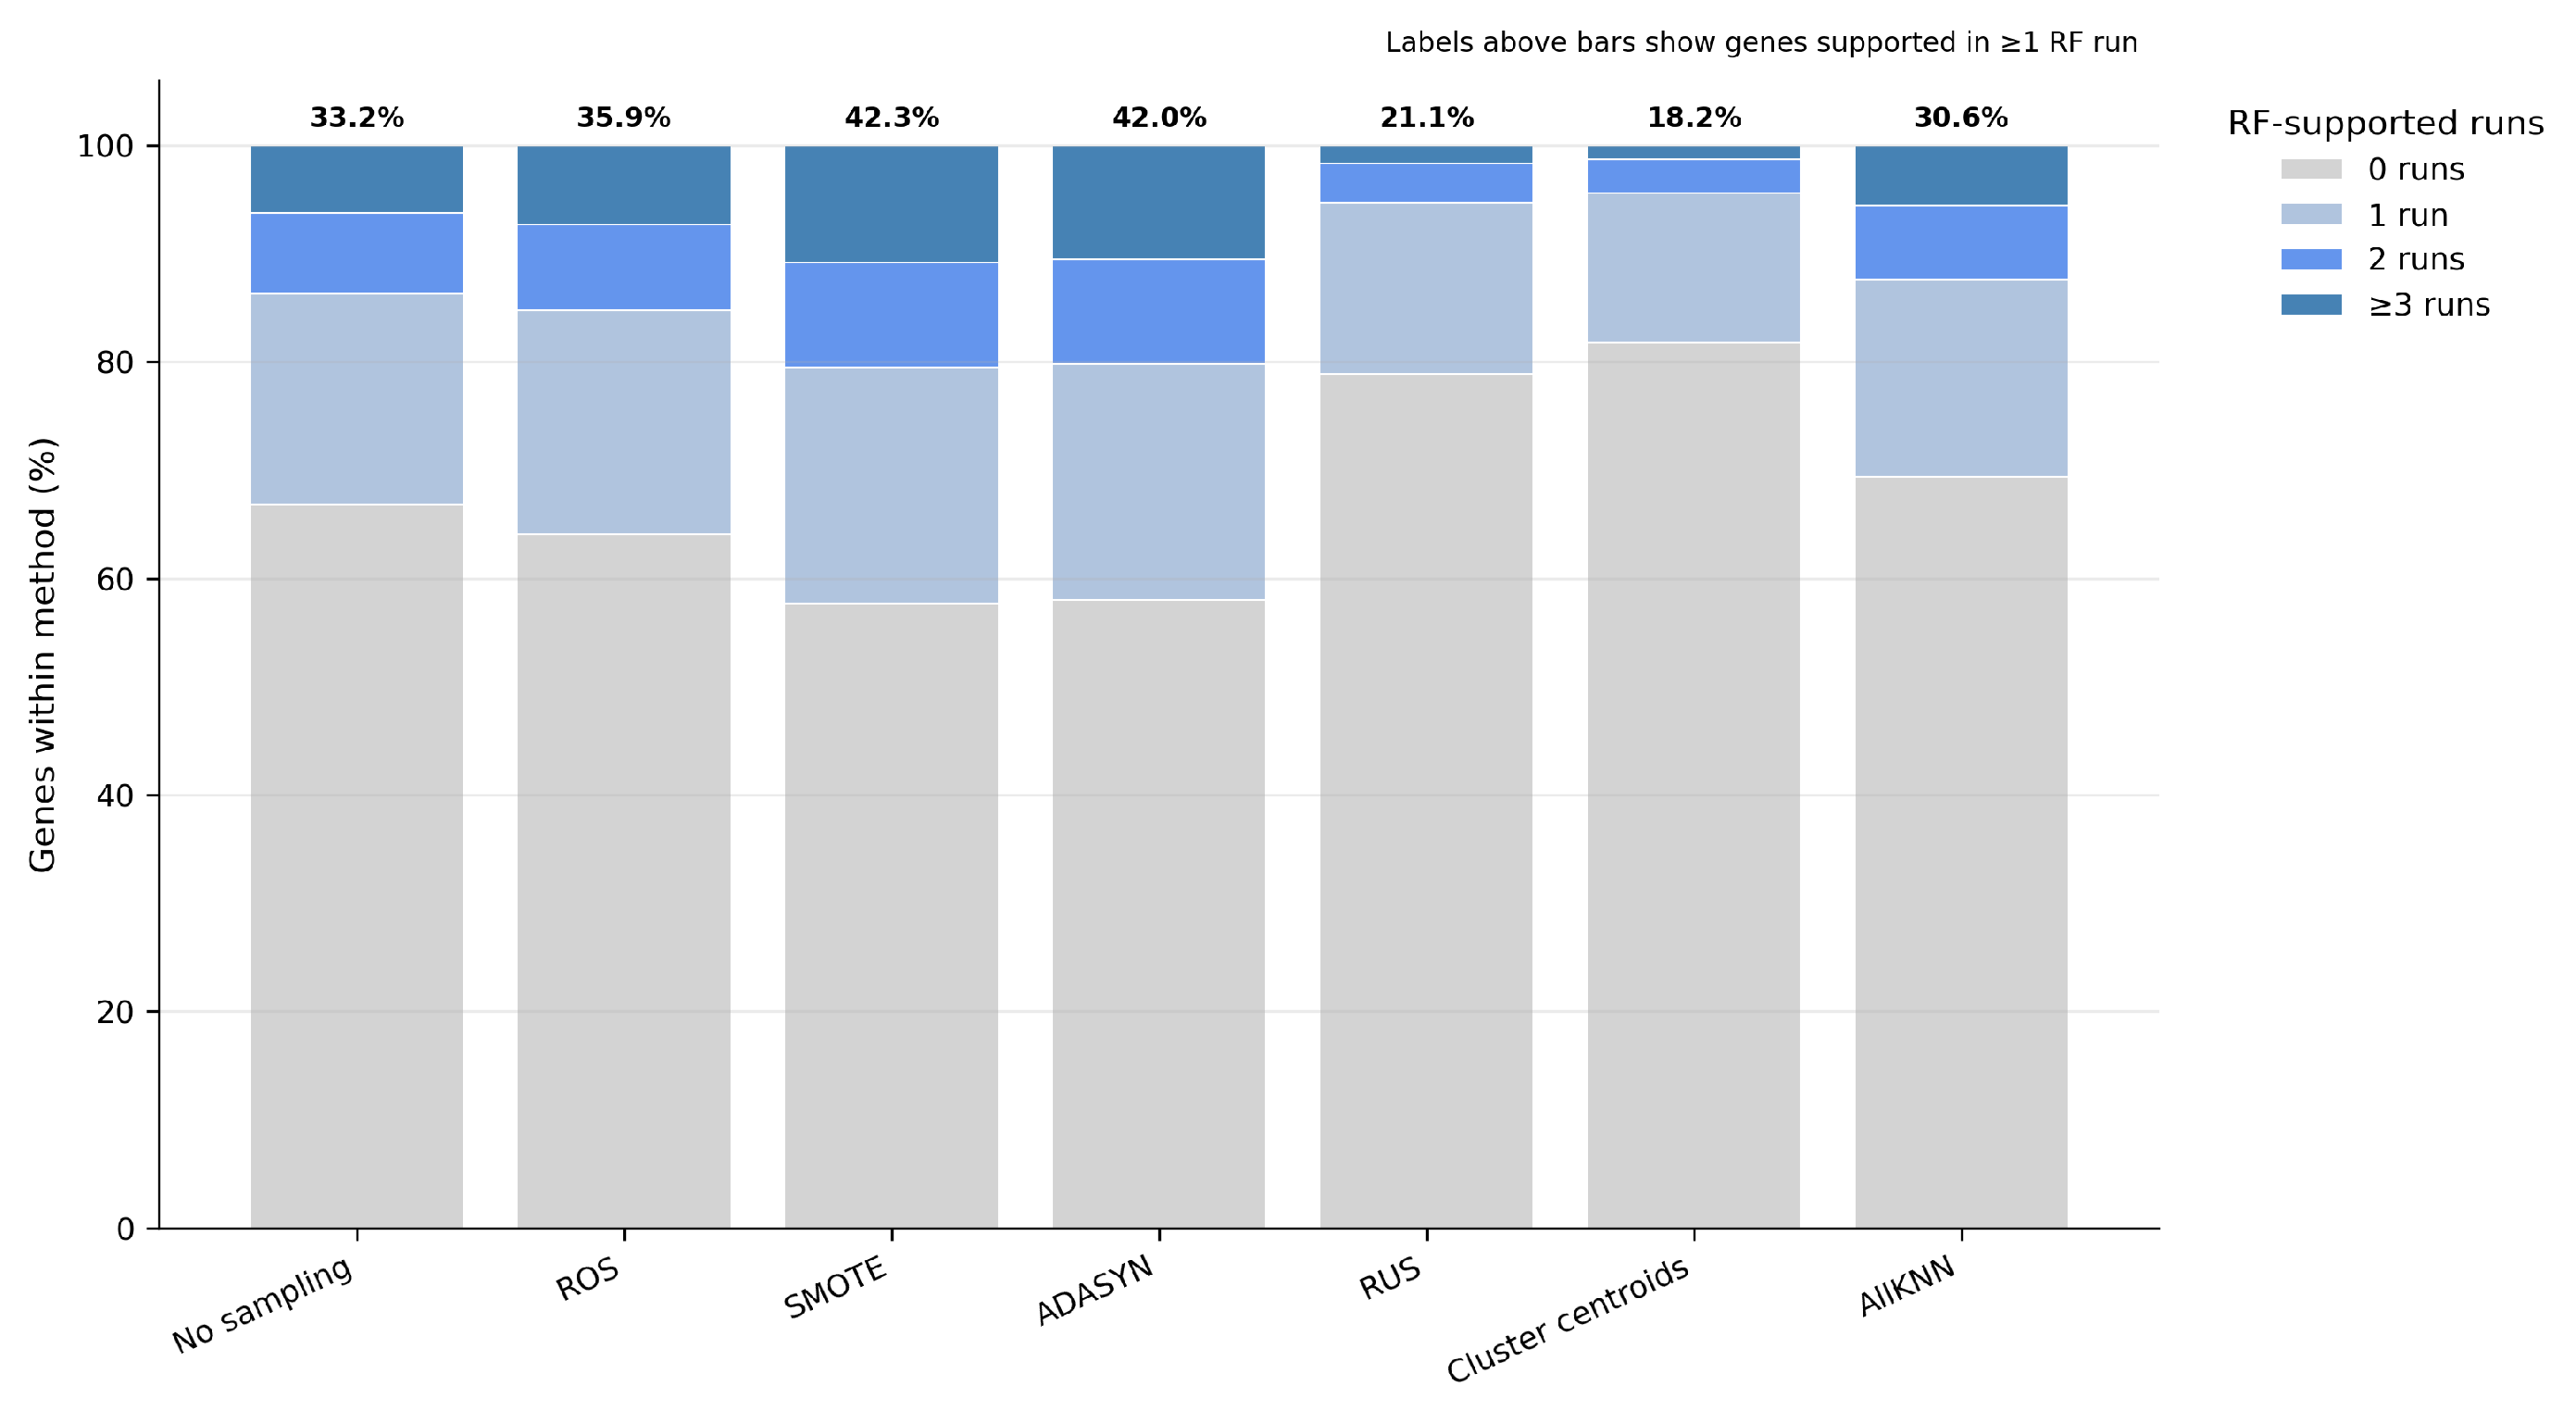
Feature-ranking stability varied substantially according to the selected imbalance correction strategy (
Figure 7). SMOTE and ADASYN demonstrated the greatest recurrence of Random Forest-supported genes, with 10.78% and 10.49% of genes, respectively, receiving Random Forest support in at least three independent analyses. ROS showed intermediate stability at 7.29%, followed by the no-sampling baseline (6.26%) and AllKNN (5.52%). In contrast, only 1.66% of genes under RUS and 1.30% under ClusterCentroids received support in at least three runs. These results indicate that the choice of imbalance correction strategy affects not only which genes are prioritized but also the reproducibility of their feature support across repeated analyses. The higher recurrence observed for SMOTE and ADASYN suggests that the oversampling strategies generated more consistent Random Forest feature-support patterns across iterations. Conversely, the markedly lower recurrence under RUS and ClusterCentroids indicates that feature prioritization was more sensitive to the majority class reduction imposed by these approaches. Importantly, this stability pattern contrasted with the biological enrichment results where methods producing the most stable feature support were not necessarily those producing the strongest disease-specific enrichment.
Furthermore, feature-score tie diagnostics (
Figure S2) showed that the proportion of genes involved in tied continuous scores ranged from 14.1% under RUS to 24.3% under AllKNN, providing an additional assessment of ranking resolution across the evaluated strategies. Despite the method-dependent differences in overall gene-set composition, several candidate biomarkers repeatedly appeared among the highest-ranked features across imbalance correction strategies (
Figure S3 and Table S1). TRIM15 showed the greatest cross-method recurrence, appearing among the top 10 genes for five of the seven strategies, with a mean top-10 continuous score of 10.41 and a maximum score of 13.75. DMRTA2 and ZSCAN23 each appeared among the top 10 for four strategies, with mean top-10 scores of 10.47 and 10.29, respectively. ADAP1, COX19, PRDM16, and LINC00925 were each recovered among the top 10 under three strategies. The recurrence of these genes across substantially different resampling procedures indicates that a subset of highly ranked candidates is comparatively insensitive to the choice of imbalance correction method. In contrast, several genes appeared among the top 10 under only one strategy, indicating substantially greater sensitivity of their prioritization to the choice of resampling method (
Figure S3). Because Random Forest and ANOVA evidence contributed equally to the continuous consensus score, these differences reflect resampling-dependent changes in feature evidence rather than differential weighting of the two feature-selection approaches.
Pairwise Jaccard similarity analysis demonstrated moderate agreement among the consensus gene sets generated by the different imbalance correction strategies (
Figure S4). SMOTE showed the highest mean off-diagonal Jaccard similarity (0.388), followed by ADASYN (0.384), ROS (0.374), the no-sampling baseline (0.365), and AllKNN (0.361). Agreement was substantially lower for RUS (0.286) and ClusterCentroids (0.258). The largest individual pairwise similarity was observed between SMOTE and ADASYN (
), consistent with the related synthetic oversampling mechanisms used by these approaches. These results indicate that imbalance correction changes gene-set composition even when the same feature-ranking procedure is applied. The comparatively greater similarity among the oversampling strategies suggests that these methods preserve a larger common biomarker pool, whereas the lower similarity associated with RUS and ClusterCentroids indicates that majority-class reduction produces more distinct consensus gene sets. Thus, the moderate cross-method overlap observed at the gene level contrasts with the substantially stronger convergence observed later at the pathway level.
4.4. PDAC-Associated Genes Are Significantly Enriched Across Resampling Strategies
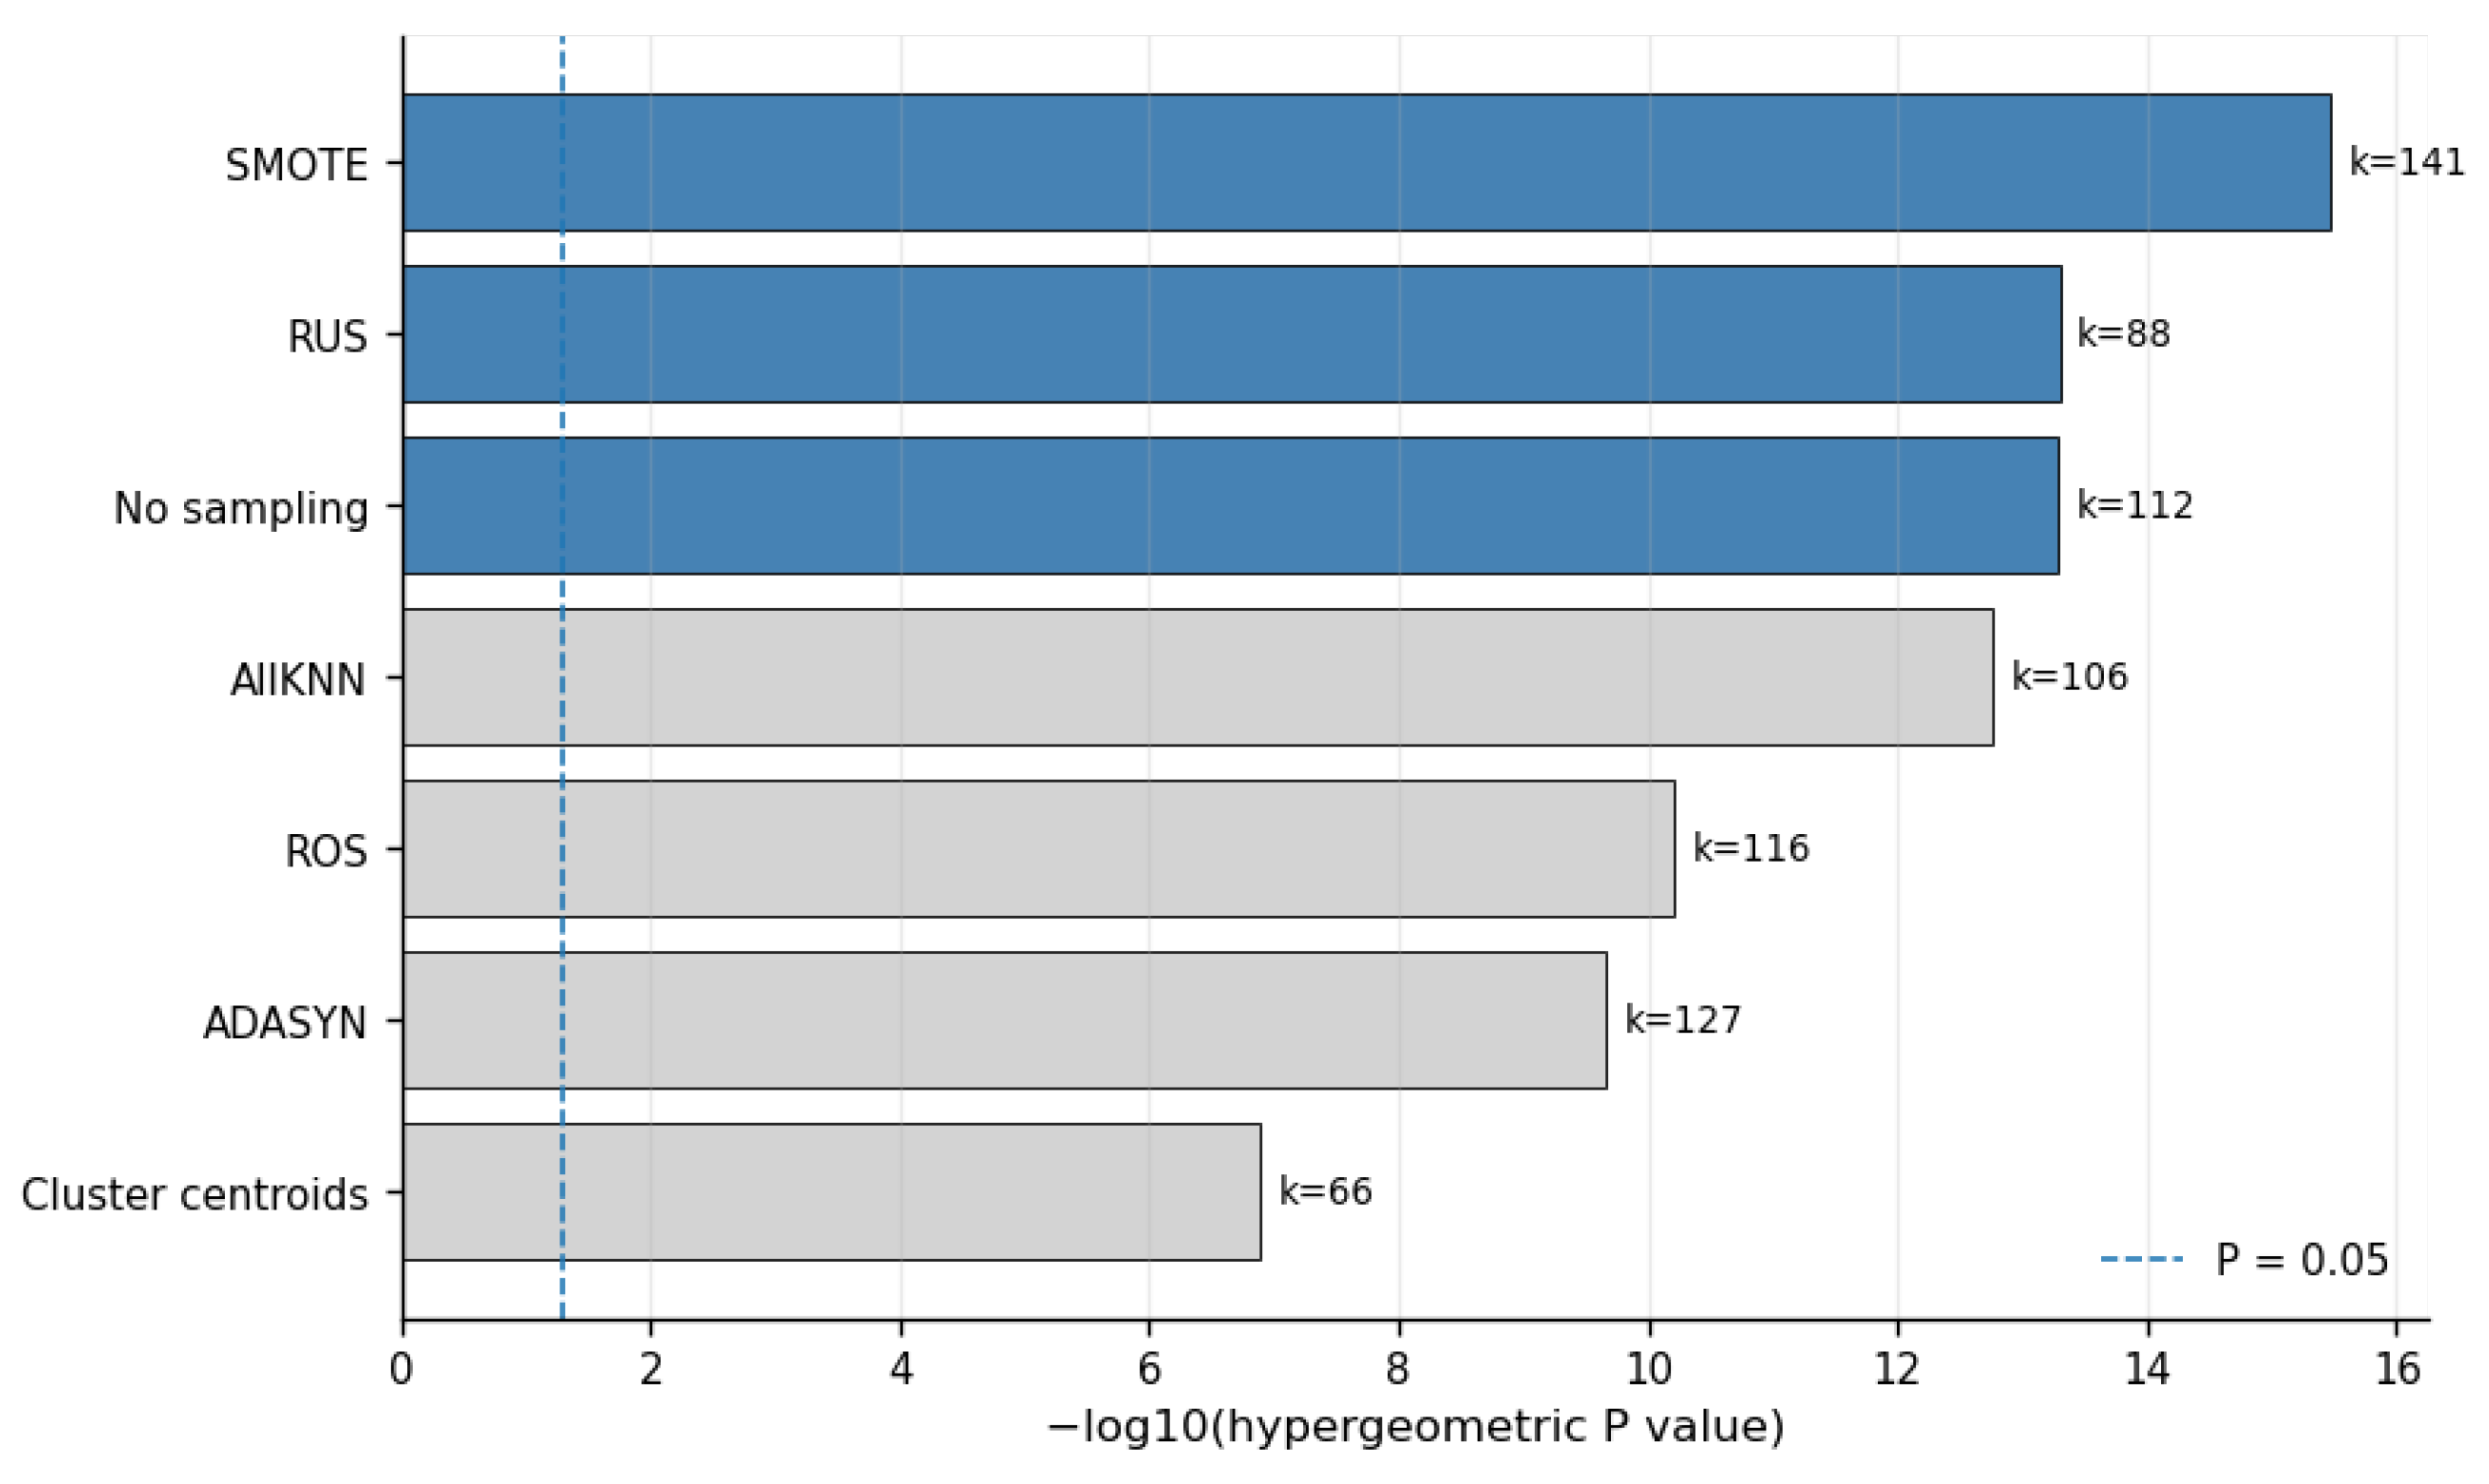
As demonstrated in
Table 3 and
Figure 8, all evaluated strategies demonstrated statistically significant enrichment for literature-supported pancreatic cancer-associated genes, indicating that the identified consensus sets contained more reference genes than expected by chance. However, the magnitude of enrichment varied among the imbalance correction approaches. All seven enrichment results remained statistically significant after Benjamini–Hochberg correction across the seven parallel tests (BH-adjusted
p-values ranging from
to
). SMOTE recovered 141 PDAC-associated genes, representing the largest absolute overlap among all evaluated methods. In contrast, RUS recovered fewer PDAC-associated genes (88) but achieved the greatest fold enrichment (2.17-fold), indicating a higher relative concentration of reference genes despite its substantially smaller consensus gene set. The no-resampling baseline also performed strongly, recovering 112 PDAC-associated genes with 1.86-fold enrichment. This observation suggests that the proposed continuous feature ranking framework is capable of recovering biologically meaningful biomarkers even without explicit class imbalance correction.
4.5. Core PDAC Pathways Are Conserved Across Resampling Strategies
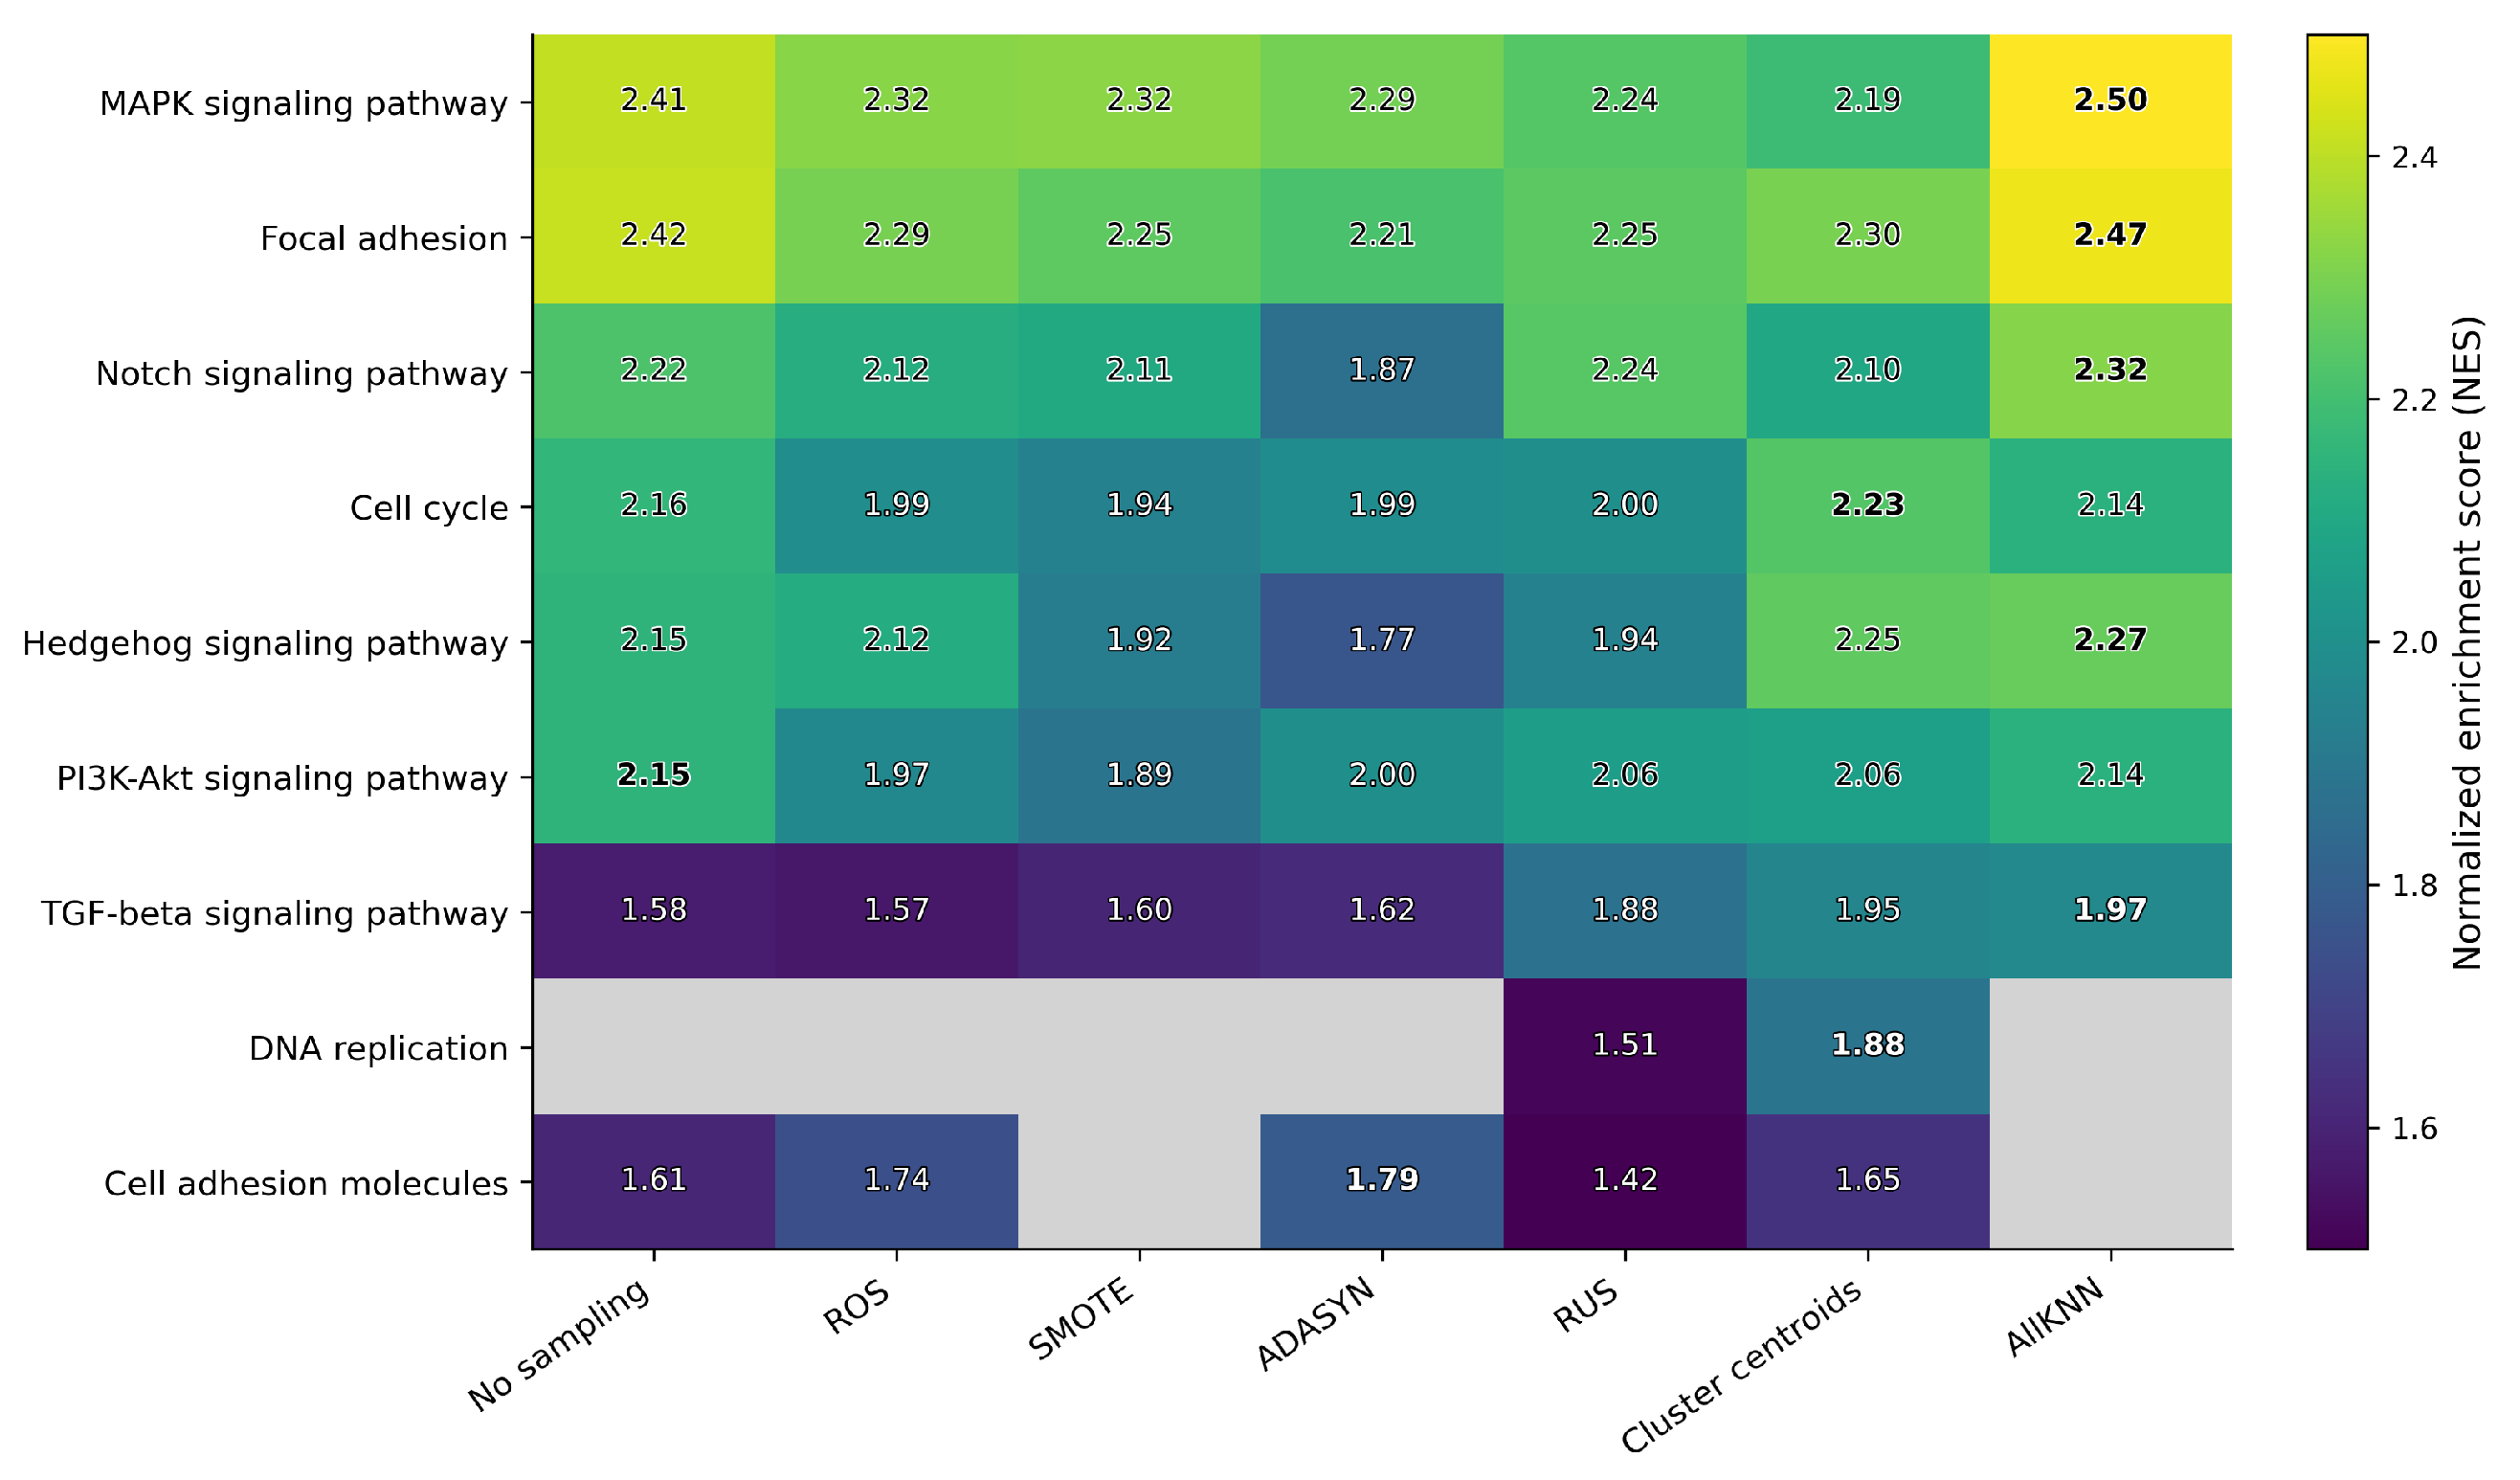
To determine whether the prioritized genes converged on established biological mechanisms associated with pancreatic ductal adenocarcinoma (PDAC), Gene Set Enrichment Analysis (GSEA) was performed for the consensus gene rankings generated by each resampling strategy. Despite substantial differences in the number and composition of prioritized genes, pathway enrichment analysis revealed considerable biological consistency across the evaluated imbalance correction methods (
Figure 9).
The breadth of global KEGG enrichment nevertheless differed substantially across resampling strategies (
Table 4). Of the 309 pathways evaluated for each method, the proportion meeting the significance criterion ranged from 54.7% for SMOTE (169/309) to 75.7% for ClusterCentroids (234/309). The no-resampling baseline identified 225 significant pathways (72.8%), followed by RUS with 223 (72.2%), AllKNN with 210 (68.0%), ROS with 198 (64.1%), and ADASYN with 180 (58.3%). Nearly all significant pathways showed positive enrichment, with 168–232 pathways per method having positive normalized enrichment scores (NES), whereas only one or two negatively enriched pathways were identified. Notably, ClusterCentroids recovered only 66 literature-supported PDAC-associated genes but produced the largest number of significantly enriched KEGG pathways (234 of 309). Conversely, SMOTE recovered the largest number of PDAC-associated genes (141) but produced the fewest significant KEGG pathways (169 of 309). This contrast indicates that gene-level recovery and pathway-level enrichment capture distinct aspects of biological relevance.
Recovery of the nine predefined PDAC-focused pathways was considerably more consistent than the global pathway counts. RUS and ClusterCentroids recovered all nine pathways (100%), the no-resampling baseline, ROS, and ADASYN recovered eight of nine (88.9%), and SMOTE and AllKNN recovered seven of nine (77.8%). Seven of the nine predefined pathways (77.8%) were significantly enriched under every experimental condition: MAPK signaling, PI3K–Akt signaling, TGF- signaling, Notch signaling, Hedgehog signaling, focal adhesion, and cell-cycle regulation.
The magnitude of enrichment for several of these consistently recovered pathways was also relatively stable across methods (
Figure 9). The strongest PDAC-focused enrichment was observed for MAPK signaling under AllKNN (NES = 2.501). Focal adhesion exhibited NES values ranging from 2.215 under ADASYN to 2.473 under AllKNN, while Notch signaling ranged from 1.867 to 2.319. Similarly, PI3K–Akt signaling produced NES values from 1.885 to 2.152, and TGF-
signaling ranged from 1.565 to 1.970. These relatively narrow ranges indicate that the direction and magnitude of enrichment for several core PDAC-associated pathways remained broadly stable despite substantial differences in the genes prioritized by individual resampling strategies.
Not all predefined pathways were equally robust to the choice of resampling strategy. DNA replication showed greater method dependence and met the significance criterion only under RUS (NES = 1.514) and ClusterCentroids (NES = 1.884). Thus, while core PDAC-associated signaling programs were consistently recovered across imbalance correction strategies, narrower biological programs showed greater sensitivity to the resampling approach.
5. Discussion
This study examined how class imbalance correction affects the biological interpretation of DNA methylation-based feature selection in PDAC. Rather than evaluating resampling methods solely through classification performance, we assessed their effects on the recovery of literature-supported PDAC genes and biologically relevant KEGG pathways. Across the seven evaluated strategies, all gene sets were significantly enriched for known PDAC-associated genes, with hypergeometric
p-values ranging from
for SMOTE to
for ClusterCentroids (
Table 3). An important observation emerging from this study is that different resampling strategies optimize different aspects of biological interpretation. Oversampling methods, particularly SMOTE, maximized the recovery of literature-supported PDAC genes by producing larger candidate gene sets, whereas undersampling methods produced more compact gene sets with higher fold enrichment. These findings suggest that broader biomarker discovery and higher disease specificity represent distinct optimization objectives rather than a single performance measure. Consequently, the choice of imbalance correction strategy should depend on the intended biological application rather than being selected solely according to predictive performance.
At the gene level, SMOTE and RUS illustrate contrasting effects of imbalance correction on biological feature recovery. SMOTE produced the broadest absolute recovery of literature-supported PDAC-associated genes, identifying 141 reference genes among 13,827 selected genes. This broad recovery was accompanied by a lower relative concentration of reference genes (1.02%), suggesting that its strong absolute recovery partly reflects the larger candidate gene set. SMOTE may therefore be advantageous when the objective is to generate a broad candidate pool for subsequent investigation.
RUS exhibited the opposite pattern. Although only 88 reference genes were recovered from its substantially smaller set of 6811 genes, these represented 1.29% of the selected genes and produced the highest fold enrichment (2.167). RUS therefore sacrificed absolute coverage while increasing the relative concentration of literature-supported PDAC-associated genes. Together, these results demonstrate that absolute disease-gene recovery and relative disease specificity are distinct properties of the resulting biomarker sets.
The no-resampling baseline also performed strongly. It recovered 112 literature-supported pancreatic cancer-associated genes, compared with an expected overlap of 60.10, resulting in 1.863-fold enrichment and a hypergeometric p-value of . Its fold enrichment remained greater than that of the three oversampling strategies and was comparable to AllKNN and ClusterCentroids. This finding suggests that the continuous feature-ranking framework retained biologically meaningful signals even without explicit class rebalancing.
An additional finding was that feature-ranking stability and biological enrichment did not necessarily favor the same resampling strategies. SMOTE and ADASYN produced the highest proportions of genes repeatedly supported across independent analyses, whereas RUS and ClusterCentroids showed considerably lower feature-level stability. Nevertheless, RUS achieved the greatest PDAC-gene fold enrichment, and ClusterCentroids produced the largest number of significantly enriched KEGG pathways. Similarly, pairwise Jaccard analysis showed that RUS and ClusterCentroids generated some of the most compositionally distinct gene sets. These results indicate that reproducibility of individual feature rankings, overlap with known disease genes, and pathway-level biological coverage represent related but distinct properties of a feature-selection pipeline. Consequently, ranking stability alone should not be interpreted as evidence that one imbalance correction strategy produces a biologically superior gene signature.
The pathway analysis further demonstrated that gene-level recovery and pathway-level enrichment capture distinct aspects of biological relevance. This distinction was particularly apparent for SMOTE and ClusterCentroids: the former produced broad recovery of literature-supported PDAC genes but comparatively narrower global pathway enrichment, whereas the latter recovered fewer known PDAC genes while exhibiting broader pathway-level enrichment. Thus, the number of recognized disease-associated genes recovered by a feature-selection strategy does not necessarily predict the breadth of biological processes represented by the resulting ranked gene set.
More importantly, recovery of the predefined PDAC-focused pathways was substantially more consistent across methods than global pathway enrichment. Despite marked differences in the composition and size of the prioritized gene sets, every strategy recovered at least seven of the nine predefined PDAC-focused pathways, and seven pathways were shared by all strategies. The relative stability of enrichment magnitude for several of these pathways further suggests that major PDAC-associated signaling programs were robust to changes in the imbalance correction procedure. This convergence at the pathway level, despite only moderate overlap among the underlying gene sets, suggests that different resampling strategies can identify alternative molecular features representing common disease-associated biological processes.
The broader pathway comparison shown in
Figure S5 further illustrated the distinction between conserved and method-sensitive biological signals. Several cancer-associated pathways remained enriched across most or all imbalance correction strategies, whereas other pathways exhibited greater variation in significance or enrichment magnitude. This pattern indicates that the principal oncogenic mechanisms recovered from the methylation data were comparatively robust to the choice of resampling strategy, whereas less consistently enriched biological programs were more sensitive to changes in the feature-ranking landscape. Together with the moderate gene-level Jaccard similarities in
Figure S4, these results demonstrate that substantial differences in selected genes can coexist with convergence on similar higher-level biological processes.
Taken together, the gene-level, ranking-stability, and pathway-level analyses reveal a multidimensional trade-off among biomarker breadth, disease specificity, feature reproducibility, and functional coverage. SMOTE provided the greatest absolute recovery of known PDAC genes and among the highest feature-recurrence rates, making it potentially useful for exploratory studies seeking a broad and reproducible candidate pool. RUS produced a substantially smaller and less recurrent feature set but achieved the highest fold enrichment and recovered all nine predefined PDAC-focused pathways, supporting its potential utility when disease-specific concentration is prioritized. ClusterCentroids produced the smallest consensus gene set and the lowest cross-method similarity, yet generated the largest number of significant KEGG pathways and recovered all nine PDAC-focused pathways. The no-resampling baseline remained competitive across multiple gene- and pathway-level measures, demonstrating that explicit class rebalancing did not universally improve biological feature selection.
These contrasting results indicate that no single imbalance correction strategy simultaneously maximized all measures of biological performance. Instead, resampling altered different properties of the resulting feature landscape, while many core PDAC-associated biological mechanisms remained recoverable across strategies. The appropriate imbalance correction method should therefore be selected according to the intended analytical objective rather than assuming that improved class balance necessarily produces a biologically superior biomarker signature.
6. Conclusions
This study explored how class imbalance correction influences feature prioritization and downstream biological interpretation in DNA methylation data from PDAC. By comparing three oversampling approaches, three undersampling approaches, and a no-resampling baseline within a common Random Forest–ANOVA feature-ranking framework, the analysis demonstrated that resampling strategy can alter the genes prioritized from the same underlying molecular dataset. Future work will evaluate the generalizability of these findings in independent PDAC methylation cohorts and across additional molecular platforms and cancer types. The small number of normal samples in the TCGA-PAAD cohort also limits the diversity of the minority-class distribution available to oversampling algorithms; consequently, synthetic observations generated by SMOTE and ADASYN may not fully represent the biological heterogeneity of normal pancreatic tissue. Synthetic oversampling should therefore be interpreted cautiously when the available minority class is very small, particularly when the objective is biological feature discovery rather than predictive performance alone. Future studies incorporating larger and more diverse normal-tissue cohorts will be important for determining the extent to which this limitation influences synthetic sampling and subsequent feature prioritization. Biological validation could also be expanded beyond the curated PDAC reference set and KEGG annotations, which may favor well-characterized genes and pathways and underrepresent recently discovered or context-specific mechanisms. In addition, the large number of significant KEGG pathways observed in this study suggests broad, correlated biological signals in the ranked gene lists; future analyses could explicitly investigate pathway redundancy, gene-set overlap, and alternative pathway databases to determine the robustness of these enrichment patterns. Another important direction for future work is to extend this framework to additional cancer types with varying tumor-to-normal sample distributions. Class imbalance should be distinguished from biological heterogeneity: the former may arise from tissue availability, sample acquisition, cohort design, and availability of appropriate normal controls, whereas the latter reflects variation within the underlying biological populations. Finally, the literature- and pathway-based analyses performed here provide computational evidence of biological relevance but do not establish functional or clinical validity. Experimental validation of prioritized methylation markers and prospective evaluation in independent patient cohorts will therefore be important for determining their potential biological and clinical significance. More broadly, future integration of molecular datasets with emerging patient-specific digital-twin frameworks may provide opportunities to evaluate whether methylation-derived biomarkers contribute to multimodal models of pancreatic disease. Overall, these findings demonstrate that class imbalance correction should not be viewed solely as a preprocessing decision since the choice of resampling strategy can influence the molecular features ultimately prioritized for biological interpretation.
Supplementary Materials
The following supporting information can be downloaded at
https://www.mdpi.com/article/10.3390/ai7100421/s1. Figure S1: Highest-ranked genes identified under each class imbalance correction strategy. The top 15 genes according to the consensus continuous feature-ranking score are shown for each evaluated resampling strategy; Figure S2: Feature-score tie diagnostics across resampling strategies. Bars show the percentage of genes involved in identical continuous consensus scores under each class imbalance correction strategy. Residual score ties ranged from 14.1% under RUS to 24.3% under AllKNN, illustrating method-dependent differences in ranking resolution; Table S1: Cross-method recurrence and method-specific highly ranked genes across class imbalance correction strategies. Genes shown appeared among the top 10 ranked genes under at least one experimental condition. Top-10 count indicates the number of the seven experimental conditions in which the gene appeared among the top 10. Top-10 methods identifies those conditions, and best rank indicates the highest rank achieved by the gene across the seven conditions; Figure S3: Cross-method recurrence of highly ranked genes across class imbalance correction strategies. Rows represent genes that appeared among the top 10 ranked genes for at least one experimental condition, and columns represent the no-resampling baseline and the six imbalance correction strategies. Heatmap colors indicate the continuous consensus score for each gene under each strategy, including strategies in which the gene did not rank among the top 10. Parenthetical values following each gene name indicate the number of the seven experimental conditions in which that gene appeared among the top 10. TRIM15 showed the greatest cross-method recurrence, appearing in the top 10 under five of seven conditions, followed by DMRTA2 and ZSCAN23 under four of seven conditions; Figure S4: Pairwise similarity of consensus gene sets across class imbalance correction strategies. Pairwise Jaccard similarity coefficients quantify the overlap between consensus gene sets generated by each resampling strategy. Higher similarity values indicate greater agreement in prioritized biomarkers, whereas lower values highlight the influence of imbalance correction on feature selection; Figure S5: Additional KEGG pathway enrichment results across class imbalance correction strategies. Extended pathway enrichment analyses illustrating the consistency of biological mechanisms identified across the evaluated resampling strategies. The normalized enrichment scores support the robustness of the pathway-level conclusions presented in the main manuscript.
Author Contributions
Conceptualization, R.J.J. and R.G.; methodology, P.K., R.J.J. and R.G.; software, P.K. and R.G.; validation, P.K., R.J.J. and R.G.; formal analysis, P.K. and R.G.; investigation, P.K., K.H., N.P., R.J.J. and R.G.; resources, A.W., R.J.J. and R.G.; data curation, P.K., K.H. and N.P.; writing—original draft preparation, P.K., Z.C., S.T.M. and R.G.; writing—review and editing, P.K., Z.C., N.P., A.W., S.T.M., R.J.J. and R.G.; visualization, P.K. and R.G.; supervision, R.J.J. and R.G.; project administration, R.J.J. and R.G.; funding acquisition, R.J.J. and R.G. All authors have read and agreed to the published version of the manuscript.
Funding
This research project was funded by the National Science Foundation (NSF)-Research Experience for Undergraduates OAC-2447779. The computational resources of the study were provided by the Blugold Center for High-Performance Computing under NSF grant CNS-1920220. We would also like to acknowledge the Office of Research and Sponsored Programs at UW-Eau Claire for providing support. The Biostatistics Shared Resource of the Masonic Cancer Center, supported in part by National Cancer Institute Cancer Center Support grant P30CA077598 and the National Center for Advancing Translational Sciences of the National Institutes of Health Award Number UM1TR004405. The content is solely the responsibility of the authors and does not necessarily represent the official views of the National Institutes of Health. Partial funding support for this work was provided by National Institutes of Health (NIH) COBRE grant P20GM109024.
Institutional Review Board Statement
Not applicable.
Informed Consent Statement
Not applicable.
Data Availability Statement
The source code and analysis workflows used in this study are publicly available at
https://github.com/gomes-computational-lab/methylation_imbalance_solver (accessed on 6 October 2026). The TCGA sample identifiers corresponding to the methylation samples analyzed in this study are also provided in the repository to facilitate reproducibility of the dataset and analysis.
Acknowledgments
The authors declare that Generative AI tools were used during manuscript preparation solely for language editing and code formatting. Specifically, ChatGPT 5 variants were used to improve the clarity, grammar, and presentation of the manuscript and to assist with formatting research code. Generative AI was not used to conduct the research, analyze the data, interpret the results, or determine the scientific conclusions. The authors reviewed and verified all AI-assisted content and take full responsibility for the final manuscript.
Conflicts of Interest
The authors declare no conflicts of interest.
Abbreviations
The following abbreviations are used in this manuscript:
| TCGA | The Cancer Genome Atlas |
| PAAD | Pancreatic adenocarcinoma |
| PDAC | Pancreatic ductal adenocarcinoma |
| GDC | Genomic Data Commons |
| NCI | National Cancer Institute |
| CpG | Cytosine–phosphate–guanine |
| kNN | k-nearest neighbors |
| ROS | Random OverSampling |
| SMOTE | Synthetic Minority Over-sampling Technique |
| ADASYN | Adaptive Synthetic Sampling |
| RUS | Random UnderSampling |
| RF | Random Forest |
| ANOVA | Analysis of Variance |
| GSEA | Gene Set Enrichment Analysis |
| KEGG | Kyoto Encyclopedia of Genes and Genomes |
| NES | Normalized Enrichment Score |
| FDR | False Discovery Rate |
| AUC | Area Under the Curve |
References
- Singh, N.; Rashid, S.; Rashid, S.; Dash, N.R.; Gupta, S.; Saraya, A. Clinical significance of promoter methylation status of tumor suppressor genes in circulating DNA of pancreatic cancer patients. J. Cancer Res. Clin. Oncol. 2020, 146, 897–907. [Google Scholar] [CrossRef] [Scilit] [PubMed]
- Siegel, R.L.; Miller, K.D.; Wagle, N.S.; Jemal, A. Cancer statistics, 2023. CA Cancer J. Clin. 2023, 73, 17–48. [Google Scholar] [CrossRef] [Scilit] [PubMed]
- Delpu, Y.; Cordelier, P.; Cho, W.C.; Torrisani, J. DNA methylation and cancer diagnosis. Int. J. Mol. Sci. 2013, 14, 15029–15058. [Google Scholar] [CrossRef] [Scilit] [PubMed]
- Brancaccio, M.; Natale, F.; Falco, G.; Angrisano, T. Cell-Free DNA Methylation: The New Frontiers of Pancreatic Cancer Biomarkers’ Discovery. Genes 2020, 11, 14. [Google Scholar] [CrossRef] [Scilit] [PubMed]
- Bird, A. DNA methylation patterns and epigenetic memory. Genes Dev. 2002, 16, 6–21. [Google Scholar] [CrossRef] [Scilit] [PubMed]
- Jones, P.A.; Baylin, S.B. The epigenomics of cancer. Cell 2007, 128, 683–692. [Google Scholar] [CrossRef] [Scilit] [PubMed]
- Berdasco, M.; Esteller, M. Aberrant epigenetic landscape in cancer: How cellular identity goes awry. Dev. Cell 2010, 19, 698–711. [Google Scholar] [CrossRef] [Scilit] [PubMed]
- Wild, L.; Flanagan, J.M. Genome-wide hypomethylation in cancer may be a passive consequence of transformation. Biochim. Biophys. Acta Rev. Cancer 2010, 1806, 50–57. [Google Scholar] [CrossRef] [Scilit] [PubMed]
- Salmi, M.; Atif, D.; Oliva, D.; Abraham, A.; Ventura, S. Handling imbalanced medical datasets: Review of a decade of research. Artif. Intell. Rev. 2024, 57, 273. [Google Scholar] [CrossRef] [Scilit]
- Yang, Y.; Mirzaei, G. Performance analysis of data resampling on class imbalance and classification techniques on multi-omics data for cancer classification. PLoS ONE 2024, 19, e0293607. [Google Scholar] [CrossRef] [Scilit] [PubMed]
- Claude, E.; Leclercq, M.; Thébault, P.; Droit, A.; Uricaru, R. Optimizing hybrid ensemble feature selection strategies for transcriptomic biomarker discovery in complex diseases. NAR Genom. Bioinform. 2024, 6, lqae079. [Google Scholar] [CrossRef] [Scilit] [PubMed]
- Demircioğlu, A. The effect of data resampling methods in radiomics. Sci. Rep. 2024, 14, 2858. [Google Scholar] [CrossRef] [Scilit] [PubMed]
- Welvaars, K.; Oosterhoff, J.H.; van den Bekerom, M.P.; Doornberg, J.N.; van Haarst, E.P.; OLVG Urology Consortium; the Machine Learning Consortium. Implications of resampling data to address the class imbalance problem (IRCIP): An evaluation of impact on performance between classification algorithms in medical data. JAMIA Open 2023, 6, ooad033. [Google Scholar] [CrossRef] [Scilit] [PubMed]
- Abdelhay, O.; Shatnawi, A.; Najadat, H.; Altamimi, T. Resampling methods for class imbalance in clinical prediction models: A scoping review protocol. PLoS ONE 2025, 20, e0330050. [Google Scholar] [CrossRef] [Scilit] [PubMed]
- Chawla, N.V.; Bowyer, K.W.; Hall, L.O.; Kegelmeyer, W.P. SMOTE: Synthetic minority over-sampling technique. J. Artif. Intell. Res. 2002, 16, 321–357. [Google Scholar] [CrossRef] [Scilit]
- He, H.; Bai, Y.; Garcia, E.A.; Li, S. ADASYN: Adaptive synthetic sampling approach for imbalanced learning. In Proceedings of the 2008 IEEE International Joint Conference on Neural Networks (IEEE World Congress on Computational Intelligence), Hong Kong, China, 1–6 June 2008; pp. 1322–1328. [Google Scholar]
- Fu, G.H.; Wang, J.B.; Zong, M.J.; Yi, L.Z. Feature ranking and screening for class-imbalanced metabolomics data based on rank aggregation coupled with re-balance. Metabolites 2021, 11, 389. [Google Scholar] [CrossRef] [Scilit] [PubMed]
- Rauschert, S.; Raubenheimer, K.; Melton, P.; Huang, R. Machine learning and clinical epigenetics: A review of challenges for diagnosis and classification. Clin. Epigenet. 2020, 12, 51. [Google Scholar] [CrossRef] [Scilit] [PubMed]
- Yuan, T.; Edelmann, D.; Fan, Z.; Alwers, E.; Kather, J.N.; Brenner, H.; Hoffmeister, M. Machine learning in the identification of prognostic DNA methylation biomarkers among patients with cancer: A systematic review of epigenome-wide studies. Artif. Intell. Med. 2023, 143, 102589. [Google Scholar] [CrossRef] [Scilit] [PubMed]
- Sahoo, K.; Sundararajan, V. Methods in DNA methylation array dataset analysis: A review. Comput. Struct. Biotechnol. J. 2024. [Google Scholar] [CrossRef] [Scilit] [PubMed]
- Zheng, C.; Xu, R. Predicting cancer origins with a DNA methylation-based deep neural network model. PLoS ONE 2020, 15, e0226461. [Google Scholar] [CrossRef] [Scilit] [PubMed]
- Modhukur, V.; Sharma, S.; Mondal, M.; Lawarde, A.; Kask, K.; Sharma, R.; Salumets, A. Machine learning approaches to classify primary and metastatic cancers using tissue of origin-based DNA methylation profiles. Cancers 2021, 13, 3768. [Google Scholar] [CrossRef] [Scilit] [PubMed]
- Hosseini, M.; Lotfi-Shahreza, M.; Nikpour, P. Integrative analysis of DNA methylation and gene expression through machine learning identifies stomach cancer diagnostic and prognostic biomarkers. J. Cell. Mol. Med. 2023, 27, 714–726. [Google Scholar] [CrossRef] [Scilit] [PubMed]
- Adeoye, J.; Wan, C.C.J.; Zheng, L.W.; Thomson, P.; Choi, S.W.; Su, Y.X. Machine learning-based genome-wide salivary DNA methylation analysis for identification of noninvasive biomarkers in oral cancer diagnosis. Cancers 2022, 14, 4935. [Google Scholar] [CrossRef] [Scilit] [PubMed]
- Sharif Rahmani, E.; Lawarde, A.; Lingasamy, P.; Moreno, S.V.; Salumets, A.; Modhukur, V. MBMethPred: A computational framework for the accurate classification of childhood medulloblastoma subgroups using data integration and AI-based approaches. Front. Genet. 2023, 14, 1233657. [Google Scholar] [CrossRef] [Scilit] [PubMed]
- Ren, J.; Zhou, X.; Guo, W.; Feng, K.; Huang, T.; Cai, Y.D. Identification of methylation signatures and rules for sarcoma subtypes by machine learning methods. Biomed Res. Int. 2022, 2022, 5297235. [Google Scholar] [CrossRef] [Scilit] [PubMed]
- Gomes, R.; Paul, N.; He, N.; Huber, A.F.; Jansen, R.J. Application of feature selection and deep learning for cancer prediction using DNA methylation markers. Genes 2022, 13, 1557. [Google Scholar] [CrossRef] [Scilit] [PubMed]
- Newsham, I.; Sendera, M.; Jammula, S.G.; Samarajiwa, S.A. Early detection and diagnosis of cancer with interpretable machine learning to uncover cancer-specific DNA methylation patterns. Biol. Methods Protoc. 2024, 9, bpae028. [Google Scholar] [CrossRef] [Scilit] [PubMed]
- Yin, X.; Kong, L.; Liu, P. Identification of prognosis-related molecular subgroups based on DNA methylation in pancreatic cancer. Clin. Epigenet. 2021, 13, 109. [Google Scholar] [CrossRef] [Scilit] [PubMed]
- Solomon, O.; MacIsaac, J.; Quach, H.; Tindula, G.; Kobor, M.S.; Huen, K.; Meaney, M.J.; Eskenazi, B.; Barcellos, L.F.; Holland, N. Comparison of DNA methylation measured by Illumina 450K and EPIC BeadChips in blood of newborns and 14-year-old children. Epigenetics 2018, 13, 655–664. [Google Scholar] [CrossRef] [Scilit] [PubMed]
- Touleimat, N.; Tost, J. Complete pipeline for Infinium® Human Methylation 450K BeadChip data processing using subset quantile normalization for accurate DNA methylation estimation. Epigenomics 2012, 4, 325–341. [Google Scholar] [CrossRef] [Scilit] [PubMed]
- Di Lena, P.; Sala, C.; Prodi, A.; Nardini, C. Missing value estimation methods for DNA methylation data. Bioinformatics 2019, 35, 3786–3793. [Google Scholar] [CrossRef] [Scilit] [PubMed]
- LemaÃŽtre, G.; Nogueira, F.; Aridas, C.K. Imbalanced-learn: A python toolbox to tackle the curse of imbalanced datasets in machine learning. J. Mach. Learn. Res. 2017, 18, 1–5. [Google Scholar]
- Alkhawaldeh, I.M.; Albalkhi, I.; Naswhan, A.J. Challenges and limitations of synthetic minority oversampling techniques in machine learning. World J. Methodol. 2023, 13, 373–378. [Google Scholar] [CrossRef] [Scilit] [PubMed]
- Breiman, L. Random forests. Mach. Learn. 2001, 45, 5–32. [Google Scholar] [CrossRef] [Scilit]
- Gomes, R.; Ahsan, M.; Denton, A. Random forest classifier in SDN framework for user-based indoor localization. In Proceedings of the 2018 IEEE International Conference on Electro/Information Technology (EIT), Rochester, MI, USA, 3–5 May 2018; pp. 537–542. [Google Scholar]
- Tan, A.C. Characterizing DNA methylation patterns in pancreatic cancer genome. Mol. Oncol. 2009, 3, 425–438. [Google Scholar] [CrossRef] [Scilit] [PubMed]
- Esteller, M. Cancer epigenomics: DNA methylomes and histone-modification maps. Nat. Rev. Genet. 2007, 8, 286–298. [Google Scholar] [CrossRef] [Scilit] [PubMed]
- Esteller, M.; Corn, P.G.; Baylin, S.B.; Herman, J.G. A gene hypermethylation profile of human cancer. Cancer Res. 2001, 61, 3225–3229. [Google Scholar] [PubMed]
- Matsubayashi, H.; Sato, N.; Fukushima, N.; Yeo, C.J.; Walter, K.M.; Brune, K.; Sahin, F.; Hruban, R.H.; Goggins, M. Methylation of cyclin D2 is observed frequently in pancreatic cancer but is also an age-related phenomenon in gastrointestinal tissues. Clin. Cancer Res. 2003, 9, 1446–1452. [Google Scholar] [PubMed]
- Feinberg, A.P.; Ohlsson, R.; Henikoff, S. The epigenetic progenitor origin of human cancer. Nat. Rev. Genet. 2006, 7, 21–33. [Google Scholar] [CrossRef] [Scilit] [PubMed]
- Takeuchi, S.; Doi, M.; Ikari, N.; Yamamoto, M.; Furukawa, T. Mutations in BRCA1, BRCA2, and PALB2, and a panel of 50 cancer-associated genes in pancreatic ductal adenocarcinoma. Sci. Rep. 2018, 8, 8105. [Google Scholar] [CrossRef] [Scilit] [PubMed]
- Sikdar, N.; Saha, G.; Dutta, A.; Ghosh, S.; Shrikhande, S.V.; Banerjee, S. Genetic alterations of periampullary and pancreatic ductal adenocarcinoma: An overview. Curr. Genom. 2018, 19, 444–463. [Google Scholar] [CrossRef] [Scilit] [PubMed]
- Stefanoudakis, D.; Frountzas, M.; Schizas, D.; Michalopoulos, N.V.; Drakaki, A.; Toutouzas, K.G. Significance of TP53, CDKN2A, SMAD4 and KRAS in Pancreatic Cancer. Curr. Issues Mol. Biol. 2024, 46, 2827–2844. [Google Scholar] [CrossRef] [Scilit] [PubMed]
- Fang, Z.; Liu, X.; Peltz, G. GSEApy: A comprehensive package for performing gene set enrichment analysis in Python. Bioinformatics 2023, 39, btac757. [Google Scholar] [CrossRef] [Scilit] [PubMed]
- Morris, J.P., IV; Wang, S.C.; Hebrok, M. KRAS, Hedgehog, Wnt and the twisted developmental biology of pancreatic ductal adenocarcinoma. Nat. Rev. Cancer 2010, 10, 683–695. [Google Scholar] [CrossRef] [Scilit] [PubMed]
- McCleary-Wheeler, A.L.; McWilliams, R.; Fernandez-Zapico, M.E. Aberrant signaling pathways in pancreatic cancer: A two compartment view. Mol. Carcinog. 2012, 51, 25–39. [Google Scholar] [CrossRef] [Scilit] [PubMed]
- Kung, H.C.; Yu, J. Targeted therapy for pancreatic ductal adenocarcinoma: Mechanisms and clinical study. MedComm 2023, 4, e216. [Google Scholar] [CrossRef] [Scilit] [PubMed]
- Ottenhof, N.A.; de Wilde, R.F.; Maitra, A.; Hruban, R.H.; Offerhaus, G.J.A. Molecular characteristics of pancreatic ductal adenocarcinoma. Pathol. Res. Int. 2011, 2011, 620601. [Google Scholar] [CrossRef] [Scilit] [PubMed][Green Version]
Figure 1.
Overview of the analytical workflow. DNA methylation data from the TCGA pancreatic adenocarcinoma (TCGA-PAAD) cohort were preprocessed and evaluated under seven class imbalance conditions: No Sampling, random oversampling (ROS), Synthetic Minority Oversampling Technique (SMOTE), Adaptive Synthetic Sampling (ADASYN), Random Undersampling (RUS), ClusterCentroids (CC), and AllKNN. Random Forest feature importance and ANOVA-based statistical evidence were integrated through the proposed continuous feature ranking framework. Consensus rankings generated across repeated analyses were subsequently evaluated through ranking robustness analyses, gene-level enrichment of known PDAC-associated genes, and pathway enrichment analysis.
Figure 1.
Overview of the analytical workflow. DNA methylation data from the TCGA pancreatic adenocarcinoma (TCGA-PAAD) cohort were preprocessed and evaluated under seven class imbalance conditions: No Sampling, random oversampling (ROS), Synthetic Minority Oversampling Technique (SMOTE), Adaptive Synthetic Sampling (ADASYN), Random Undersampling (RUS), ClusterCentroids (CC), and AllKNN. Random Forest feature importance and ANOVA-based statistical evidence were integrated through the proposed continuous feature ranking framework. Consensus rankings generated across repeated analyses were subsequently evaluated through ranking robustness analyses, gene-level enrichment of known PDAC-associated genes, and pathway enrichment analysis.
Figure 2.
Distributionof missingness across CpG markers in the TCGA-PAAD methylation dataset. Histogram bins represent the percentage of samples with missing values for each CpG marker. We implemented a 30% missingness threshold, shown by the dashed vertical line.
Figure 2.
Distributionof missingness across CpG markers in the TCGA-PAAD methylation dataset. Histogram bins represent the percentage of samples with missing values for each CpG marker. We implemented a 30% missingness threshold, shown by the dashed vertical line.
Figure 3.
Number of discrete consensus genes identified under each class imbalance correction strategy. A gene was included in the consensus set when it exhibited nonzero Random Forest importance in at least one analysis run and ANOVA significance (p < 0.05) in at least one available run. Bars show the resulting RF–ANOVA intersection gene sets for the no-sampling baseline and each resampling strategy.
Figure 3.
Number of discrete consensus genes identified under each class imbalance correction strategy. A gene was included in the consensus set when it exhibited nonzero Random Forest importance in at least one analysis run and ANOVA significance (p < 0.05) in at least one available run. Bars show the resulting RF–ANOVA intersection gene sets for the no-sampling baseline and each resampling strategy.
Figure 4.
Distribution and rank-decay of continuous feature scores across class imbalance correction strategies. (A) Violin plots show the distribution of consensus continuous scores across ranked genes for each strategy. (B) Continuous-score profiles for the 250 highest-ranked genes illustrate differences in the concentration and decay of high-scoring features across methods.
Figure 4.
Distribution and rank-decay of continuous feature scores across class imbalance correction strategies. (A) Violin plots show the distribution of consensus continuous scores across ranked genes for each strategy. (B) Continuous-score profiles for the 250 highest-ranked genes illustrate differences in the concentration and decay of high-scoring features across methods.
Figure 5.
Agreement between Random Forest and ANOVA-derived gene-level feature evidence across class imbalance correction strategies. (A) Representative hexbin density plot for the no-resampling baseline showing the relationship between normalized Random Forest and ANOVA-derived evidence across all valid gene symbols. The no-resampling condition showed a Spearman rank correlation of and a Pearson correlation of . (B) Pearson and Spearman correlations across all seven experimental conditions. Spearman correlations ranged from to and were consistently higher than the corresponding Pearson correlations (–), indicating stronger monotonic than strictly linear agreement between the two feature-evaluation approaches.
Figure 5.
Agreement between Random Forest and ANOVA-derived gene-level feature evidence across class imbalance correction strategies. (A) Representative hexbin density plot for the no-resampling baseline showing the relationship between normalized Random Forest and ANOVA-derived evidence across all valid gene symbols. The no-resampling condition showed a Spearman rank correlation of and a Pearson correlation of . (B) Pearson and Spearman correlations across all seven experimental conditions. Spearman correlations ranged from to and were consistently higher than the corresponding Pearson correlations (–), indicating stronger monotonic than strictly linear agreement between the two feature-evaluation approaches.
Figure 6.
Contribution of Random Forest and ANOVA to the consensus feature rankings. Genes supported by both Random Forest feature importance and ANOVA statistical significance, as well as genes uniquely identified by each approach, are shown for every class imbalance correction strategy. These results illustrate the complementary nature of the two feature evaluation methods and justify their integration within the proposed continuous feature ranking framework.
Figure 6.
Contribution of Random Forest and ANOVA to the consensus feature rankings. Genes supported by both Random Forest feature importance and ANOVA statistical significance, as well as genes uniquely identified by each approach, are shown for every class imbalance correction strategy. These results illustrate the complementary nature of the two feature evaluation methods and justify their integration within the proposed continuous feature ranking framework.
Figure 7.
Ranking stability across repeated analyses. Stacked bars show the proportion of genes receiving nonzero Random Forest feature importance in zero, one, two, or at least three analysis runs under each class imbalance correction strategy. Higher recurrence indicates greater stability of feature support across repeated analyses.
Figure 7.
Ranking stability across repeated analyses. Stacked bars show the proportion of genes receiving nonzero Random Forest feature importance in zero, one, two, or at least three analysis runs under each class imbalance correction strategy. Higher recurrence indicates greater stability of feature support across repeated analyses.
Figure 8.
Enrichment of known PDAC-associated genes among the prioritized gene sets. Consensus gene sets generated under each class imbalance correction strategy were compared with a curated reference set of 220 pancreatic cancer-associated genes, of which 212 were represented in the methylation-array background universe and were included in the hypergeometric analysis. Bars show enrichment significance expressed as
, and labels indicate the observed number of reference genes recovered by each strategy. Exact enrichment statistics are provided in
Table 3.
Figure 8.
Enrichment of known PDAC-associated genes among the prioritized gene sets. Consensus gene sets generated under each class imbalance correction strategy were compared with a curated reference set of 220 pancreatic cancer-associated genes, of which 212 were represented in the methylation-array background universe and were included in the hypergeometric analysis. Bars show enrichment significance expressed as
, and labels indicate the observed number of reference genes recovered by each strategy. Exact enrichment statistics are provided in
Table 3.
Figure 9.
KEGG pathway enrichment across class imbalance correction strategies. The heatmap presents normalized enrichment scores (NES) for KEGG pathways identified from the consensus gene rankings produced under each imbalance correction condition. Rows represent pathways and columns represent resampling strategies. Only pathway–method combinations with an FDR q-value are displayed; blank cells indicate that the pathway did not meet the significance threshold for the corresponding method. Consistent enrichment across multiple strategies indicates convergence on shared PDAC-associated biological mechanisms despite variation in the composition of the prioritized gene sets.
Figure 9.
KEGG pathway enrichment across class imbalance correction strategies. The heatmap presents normalized enrichment scores (NES) for KEGG pathways identified from the consensus gene rankings produced under each imbalance correction condition. Rows represent pathways and columns represent resampling strategies. Only pathway–method combinations with an FDR q-value are displayed; blank cells indicate that the pathway did not meet the significance threshold for the corresponding method. Consistent enrichment across multiple strategies indicates convergence on shared PDAC-associated biological mechanisms despite variation in the composition of the prioritized gene sets.
Table 1.
Representative machine-learning studies using DNA methylation data for cancer analysis. Prior studies demonstrate the predictive value of methylation profiles and, in several cases, explicitly address class imbalance; however, resampling is predominantly evaluated through classification performance rather than its effects on biological feature selection and downstream enrichment.
Table 1.
Representative machine-learning studies using DNA methylation data for cancer analysis. Prior studies demonstrate the predictive value of methylation profiles and, in several cases, explicitly address class imbalance; however, resampling is predominantly evaluated through classification performance rather than its effects on biological feature selection and downstream enrichment.
| Study | Cancer/Dataset | ML or Feature-Selection Approach | Imbalance Handling | Primary Objective | Relevant Limitation Relative to This Study |
|---|
| Zheng and Xu [21] | Pan-cancer; TCGA, 7339 patients | Deep neural network; 10,360 CpGs | Not primary focus | Cancer tissue-of-origin classification | Focused on predictive classification rather than effects of imbalance
correction on biological feature selection |
| Modhukur et al. [22] | 24 cancer types; TCGA + GEO, 9303 methylomes | RF, SVM, XGBoost, Naive Bayes; differential methylation | SMOTE | Primary/metastatic cancer classification | Demonstrated classification gains after SMOTE but did not compare
biological feature recovery across alternative resampling strategies |
| Gomes et al. [27] | Breast cancer; TCGA-BRCA, Illumina 27K/450K | ANOVA + RF feature selection; DNN | SMOTE | Tumor classification and CpG feature identification | Used a single imbalance-correction strategy; did not evaluate how
alternative resampling methods alter biological feature rankings |
| Yang and Mirzaei [10] | Breast, liver, and colon cancer; TCGA multi-omics | 18 classifiers; RNA-seq, CNV, and DNA methylation | Five resampling approaches including SMOTE | Normal-versus-tumor classification | Directly compared resampling, but evaluation centered on AUC,
precision, recall, and F-measure rather than biological feature validity |
| Newsham et al. [28] | 13 cancer types; TCGA methylomes | Interpretable XGBoost models | Class imbalance explicitly evaluated | Cancer detection and interpretable methylation signatures | Addresses imbalance in predictive modeling but does not systematically
compare resampling-induced changes in downstream biological enrichment |
| Yin et al. [29] | Pancreatic cancer; methylation data | LASSO, molecular subtyping, prognostic modeling | Not primary focus | Methylation-based pancreatic cancer prognosis | Focused on prognosis and molecular subgroups rather than tumor–normal
imbalance and resampling effects on feature discovery |
| Hosseini et al. [23] | Stomach cancer; methylation + gene expression | Integrative machine learning | Not primary focus | Diagnostic and prognostic biomarker identification | Biomarker discovery was not designed to quantify sensitivity of selected
features to class-imbalance correction |
| Adeoye et al. [24] | Oral cancer; salivary DNA methylation | Genome-wide methylation + machine learning | Not primary focus | Noninvasive diagnostic biomarker discovery | Emphasized diagnostic performance rather than resampling-dependent
biological feature stability |
| Rahmani et al. [25] | Childhood medulloblastoma | Integrated methylation data and AI classification | Not primary focus | Molecular subgroup classification | Targets subtype prediction rather than systematic comparison of
imbalance correction and biological feature interpretation |
| Ren et al. [26] | Sarcoma subtypes | Machine-learning feature ranking and classification | Not primary focus | Methylation signature identification | Does not evaluate how alternative resampling strategies affect
biomarker composition or pathway-level interpretation |
Table 2.
Agreement between Random Forest feature importance and ANOVA statistical significance across the evaluated class imbalance correction strategies. The consistently higher Spearman correlations indicate that Random Forest and ANOVA generally prioritize similar genes but differ in the magnitude of their assigned scores, reflecting complementary rather than redundant feature evaluation.
Table 2.
Agreement between Random Forest feature importance and ANOVA statistical significance across the evaluated class imbalance correction strategies. The consistently higher Spearman correlations indicate that Random Forest and ANOVA generally prioritize similar genes but differ in the magnitude of their assigned scores, reflecting complementary rather than redundant feature evaluation.
| Method | Pearson r | Spearman | RF–ANOVA Consensus Genes | RF Only | ANOVA Only |
|---|
| No Sampling | 0.286 | 0.406 | 10,080 | 790 | 14,113 |
| ROS | 0.234 | 0.452 | 11,746 | 18 | 20,443 |
| SMOTE | 0.239 | 0.482 | 13,827 | 34 | 18,317 |
| ADASYN | 0.255 | 0.489 | 13,694 | 59 | 17,863 |
| RUS | 0.303 | 0.387 | 6811 | 96 | 22,065 |
| ClusterCentroids | 0.279 | 0.352 | 5909 | 68 | 22,458 |
| AllKNN | 0.291 | 0.408 | 9387 | 655 | 14,854 |
Table 3.
Hypergeometric enrichment of literature-supported PDAC genes across class imbalance correction strategies.
Table 3.
Hypergeometric enrichment of literature-supported PDAC genes across class imbalance correction strategies.
| Method | Selected Genes, n | PDAC Overlap, k | PDAC Genes (%) | Expected Overlap | Fold Enrichment | Hypergeo-metric P | BH-Adjusted p-Value |
|---|
| SMOTE | 13,827 | 141 | 1.02 | 82.44 | 1.710 | | |
| RUS | 6811 | 88 | 1.29 | 40.61 | 2.167 | | |
| No sampling | 10,080 | 112 | 1.11 | 60.10 | 1.863 | | |
| AllKNN | 9387 | 106 | 1.13 | 55.97 | 1.894 | | |
| ROS | 11,746 | 116 | 0.99 | 70.04 | 1.656 | | |
| ADASYN | 13,694 | 127 | 0.93 | 81.65 | 1.555 | | |
| ClusterCentroids | 5909 | 66 | 1.12 | 35.23 | 1.873 | | |
Table 4.
Summary of significant KEGG pathway enrichment across class imbalance correction strategies.
Table 4.
Summary of significant KEGG pathway enrichment across class imbalance correction strategies.
| Method | KEGG Pathways Tested | Significant Pathways | Positive NES | Negative NES | PDAC-Focused Pathways |
|---|
| No sampling | 309 | 225 | 224 | 1 | 8 |
| ROS | 309 | 198 | 197 | 1 | 8 |
| SMOTE | 309 | 169 | 168 | 1 | 7 |
| ADASYN | 309 | 180 | 179 | 1 | 8 |
| RUS | 309 | 223 | 222 | 1 | 9 |
| ClusterCentroids | 309 | 234 | 232 | 2 | 9 |
| AllKNN | 309 | 210 | 209 | 1 | 7 |
| Disclaimer/Publisher’s Note: The statements, opinions and data contained in all publications are solely those of the individual author(s) and contributor(s) and not of MDPI and/or the editor(s). MDPI and/or the editor(s) disclaim responsibility for any injury to people or property resulting from any ideas, methods, instructions or products referred to in the content. |





 ,
,