1. Introduction
Electrocardiogram (ECG) is a non-invasive test method widely used for diagnosing cardiovascular diseases. The morphology of the ECG—including the P-wave, QRS complex, and T-wave—is an important metric for assessing a patient’s cardiac health. For example, a comprehensive study in 2015 [
1] showed that both short and long P-wave durations are associated with an elevated risk of atrial fibrillation (AF). Another study suggested that T-wave alternans (TWA) is a highly sensitive predictor of cardiac death in patients with mild-to-moderate congestive heart failure undergoing cardiac rehabilitation [
2]. Moreover, in [
3], it was shown that the use of microvolt TWA is more accurate than QRS duration in identifying groups at high and low risk of dying among heart failure patients. Therefore, accurately detecting and estimating the location and duration of P-waves and T-waves is essential for the reliable diagnosis of cardiac conditions. However, these waves typically have low amplitudes and are, therefore, highly susceptible to being obscured by noise or artifacts, particularly during prolonged ECG recordings, such as those obtained through ambulatory cardiac monitoring (ACM). In such settings, various types of physical noise—such as baseline wander, motion artifacts, and electrode displacement—introduced by patient movement during routine daily activities can significantly degrade ECG signal quality [
4]. During prolonged ECG monitoring, the volume of data recorded for subsequent analysis is substantial. Consequently, compression techniques are commonly employed to reduce the amount of data that must be stored or transmitted, enabling more efficient handling and analysis of long-term ECG recordings.
The current state-of-the-art approach for denoising biosignals is the denoising autoencoder (DAE). Numerous DAE architectures have been proposed in the literature, and their performance largely depends on two key factors: (1) the type of input segment (whether it is QRS-aligned or a non-aligned ECG segment), and (2) the structure of the DAE (whether it employs fully connected layers or convolutional layers). Most studies utilize long, non-aligned ECG segments in conjunction with deep convolutional denoising autoencoders (CDAEs) to exploit temporal correlations and achieve strong denoising performance [
4,
5,
6,
7]. In contrast, fully connected DAEs typically require QRS-aligned input segments but can achieve effective denoising with fewer hidden layers [
8,
9,
10,
11]. A novel DAE architecture, known as the Running DAE model, was proposed in [
4], and it effectively leverages the high correlation between successive overlapping segments—commonly referred to as the sliding window—to successfully remove unwanted noise from the signal.
Prolonged ECG recordings, like ACM, enable continuous assessment of heart functions throughout a person’s daily activities, including sleep, exercise, and routine tasks. Unlike traditional in-clinic ECG tests that offer only a brief snapshot of cardiac activity, ACM provides a more comprehensive and dynamic view of the heart’s condition over an extended period. However, this continuous monitoring generates a large volume of ECG data, posing significant challenges in terms of data storage, transmission, and processing—particularly in resource-constrained environments. Efficient medical data management becomes critical to ensure that, without overburdening the communication infrastructure or computational resources, clinically relevant information is preserved and made accessible for timely diagnosis. Several methods have been proposed in the literature for ECG signal compression, ranging from traditional approaches, such as the direct data compression method [
12], compressed sensing [
13,
14,
15,
16], and support value and tensor decomposition method [
17,
18], to more advanced techniques based on autoencoders [
6]. The effectiveness of sparse coding largely depends on the choice of dictionary used to represent the signal. However, due to the complex and highly variable morphology of ECG signals, capturing their structure with predefined dictionaries is particularly challenging, often limiting the compression performance of classical methods. In [
11], a regularized DAE model demonstrated highly promising results—not only in effectively denoising ECG signals, but also in capturing underlying features that closely resemble key morphological components of the ECG, such as the P-wave, QRS complex, and T-wave.
This study introduces an autoencoder-based dictionary framework for denoising, compressing and decomposing ECG morphology. To generate suitable data-driven dictionary for these tasks, we examined two weight regularization strategies: L1- and L2-regularization. L1-regularization enforces sparsity by forcing many weights to zero, producing representations that closely align with ECG morphologies [
11]. In contrast, L2-regularization penalizes large weights more strongly and distributes them more uniformly, resulting in redundant morphological representations [
11]. Based on these observations, an autoencoder with L1-weight regularization was adopted to construct distinct dictionaries for the P-wave, QRS complex, and T-wave. When combined with the matching pursuit algorithm, the proposed framework achieves effective and interpretable representation of ECG morphology, thereby enabling automated ECG decomposition without any labeling.
2. Materials and Methods
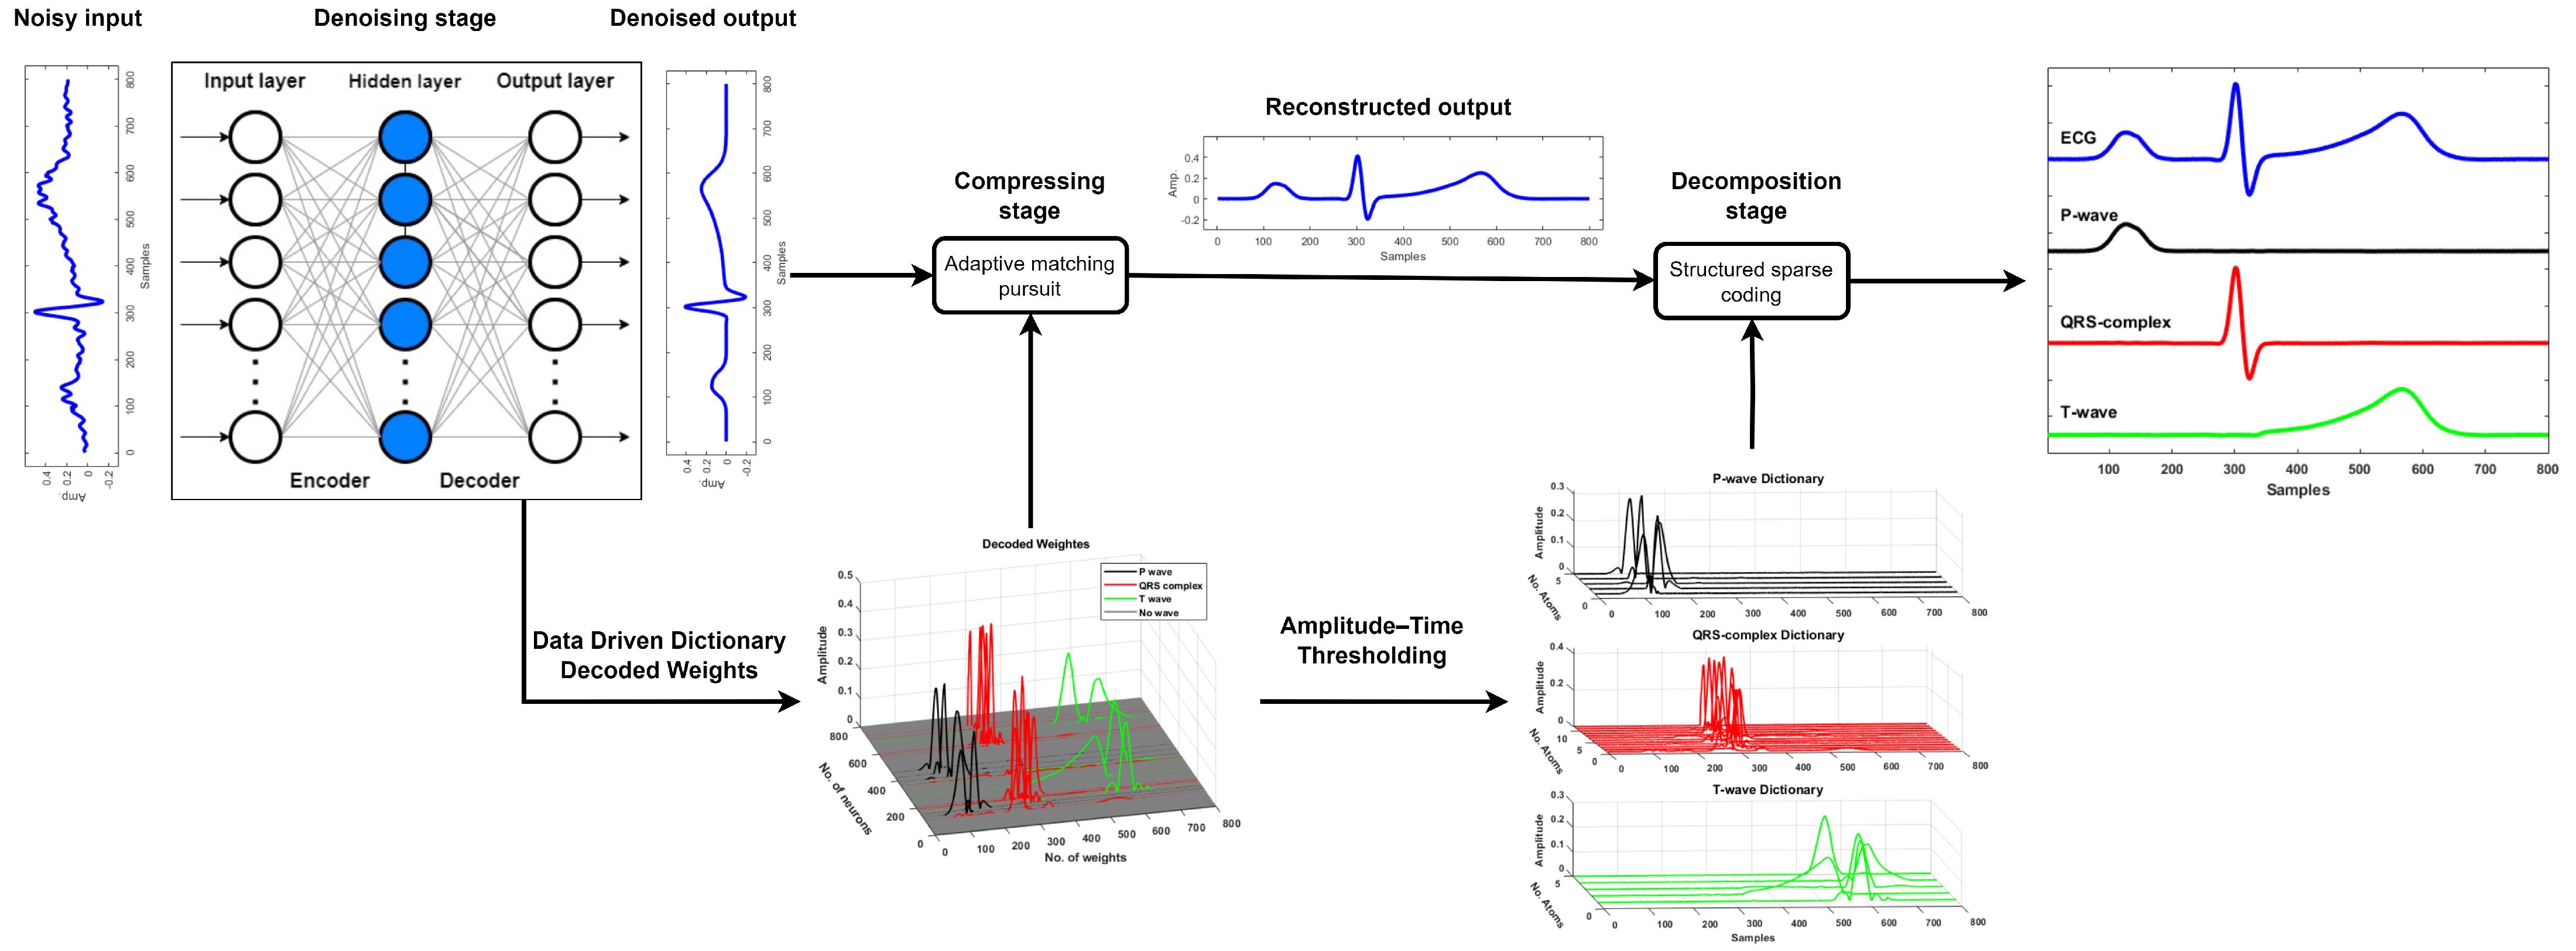
The proposed framework consists of three stages, as shown in
Figure 1: denoising, compression, and decomposition. Once the noisy ECG signal is denoised using a denoising autoencoder, the resulting clean signal is compressed using an autoencoder-driven dictionary
, which is derived from the trained weights of the decoder. The compression is, subsequently, performed using the matching pursuit algorithm. The reconstructed ECG segment is further decomposed into its fundamental morphological components—namely, the P-wave, QRS complex, and T-wave—using structured sparse approximation. This decomposition is achieved by employing three distinct sub-dictionaries, denoted as
,
, and
. These sub-dictionaries are formed by thresholding the learned weights based on both the amplitude and temporal location of each atom in relation to the known ECG morphology. The amplitude–time threshold is used to identify and group atoms that significantly contribute to each waveform component, enabling a morphology-aware separation of the ECG signal. This decomposition is also carried out using the matching pursuit algorithm.
2.1. Denoising Stage
An autoencoder (AE) is an unsupervised machine learning model commonly used for solving regression problems. A typical AE consists of an input layer, one or more hidden layers, and an output layer, with the input and output layers having the same number of neurons, as shown in
Figure 2. To help the AE to learn a compact and meaningful representation of the data, the hidden layer typically has fewer neurons than the input and output layers—a design known as the bottleneck effect. This bottleneck layer compresses the input, encouraging the model to retain only the most relevant features while eliminating redundant information. Such dimensionality reduction improves learning efficiency and generalization [
11]. However, choosing the right size for the bottleneck layer is essential to prevent underfitting or overfitting [
10]. As a general rule of thumb, the number of hidden neurons is typically set to around half the number of neurons in the input/output layer (see
Figure 2). This is a simple AE version, many AE have more hidden layers. Mathematically, the AE encodes the input segment into latent representation; then, decodes it back to produce the desired output, as follows.
where
: Original segment (clean);
: Input segment (noisy);
: Latent (encoded) representation;
: Output segment (denoised);
: Weight matrix of the encoder;
: Bias vector of the encoder;
: Weight matrix of the decoder;
: Bias vector of the decoder;
: Activation function (e.g., ReLU).
Note: in the case of autoencoder, the input segment is equal to the desired segment . The AE models learn by minimizing the reconstruction error between the desired segments and the output segments, effectively capturing the underlying features of the training data. The only difference between a standard autoencoder (AE) and a denoising autoencoder (DAE) lies in the data used for learning: while the AE uses clean segments as both the input and target, the DAE takes noisy segments as the input and learns to reconstruct the corresponding clean target segments by minimizing the error between the output and the clean reference.
In this work, the bottleneck effect is introduced by forcing the model to have small or nearly zero weights for the unwanted features of the input segment employing either L2- or L1-weight regularization.
Mathematically, a regularized loss function combines a data fidelity term (loss function) with a regularization term to prevent overfitting and improve generalization. The general form is expressed as follows:
where
denotes the primary loss function measuring the discrepancy between the ground truth
, the model prediction
,
is the regularization term applied to model parameters
, and
is a regularization parameter.
In this work, we considered two forms of regularized loss functions, where both the loss term and the regularization term adopt the same norm. Specifically, we explored either a fully L2-regularized formulation or a fully L1-regularized formulation. Mathematically, the regularization term added to loss function as a combination of mean square error (MSE) with L2-regularization term or mean absolute error (MAE) with L1-regularization, as follow,
These formulations illustrate the integration of the loss term with either L1- or L2-regularization, which are commonly used for promoting sparsity or penalizing large weights, respectively.
2.2. Compressing Stage
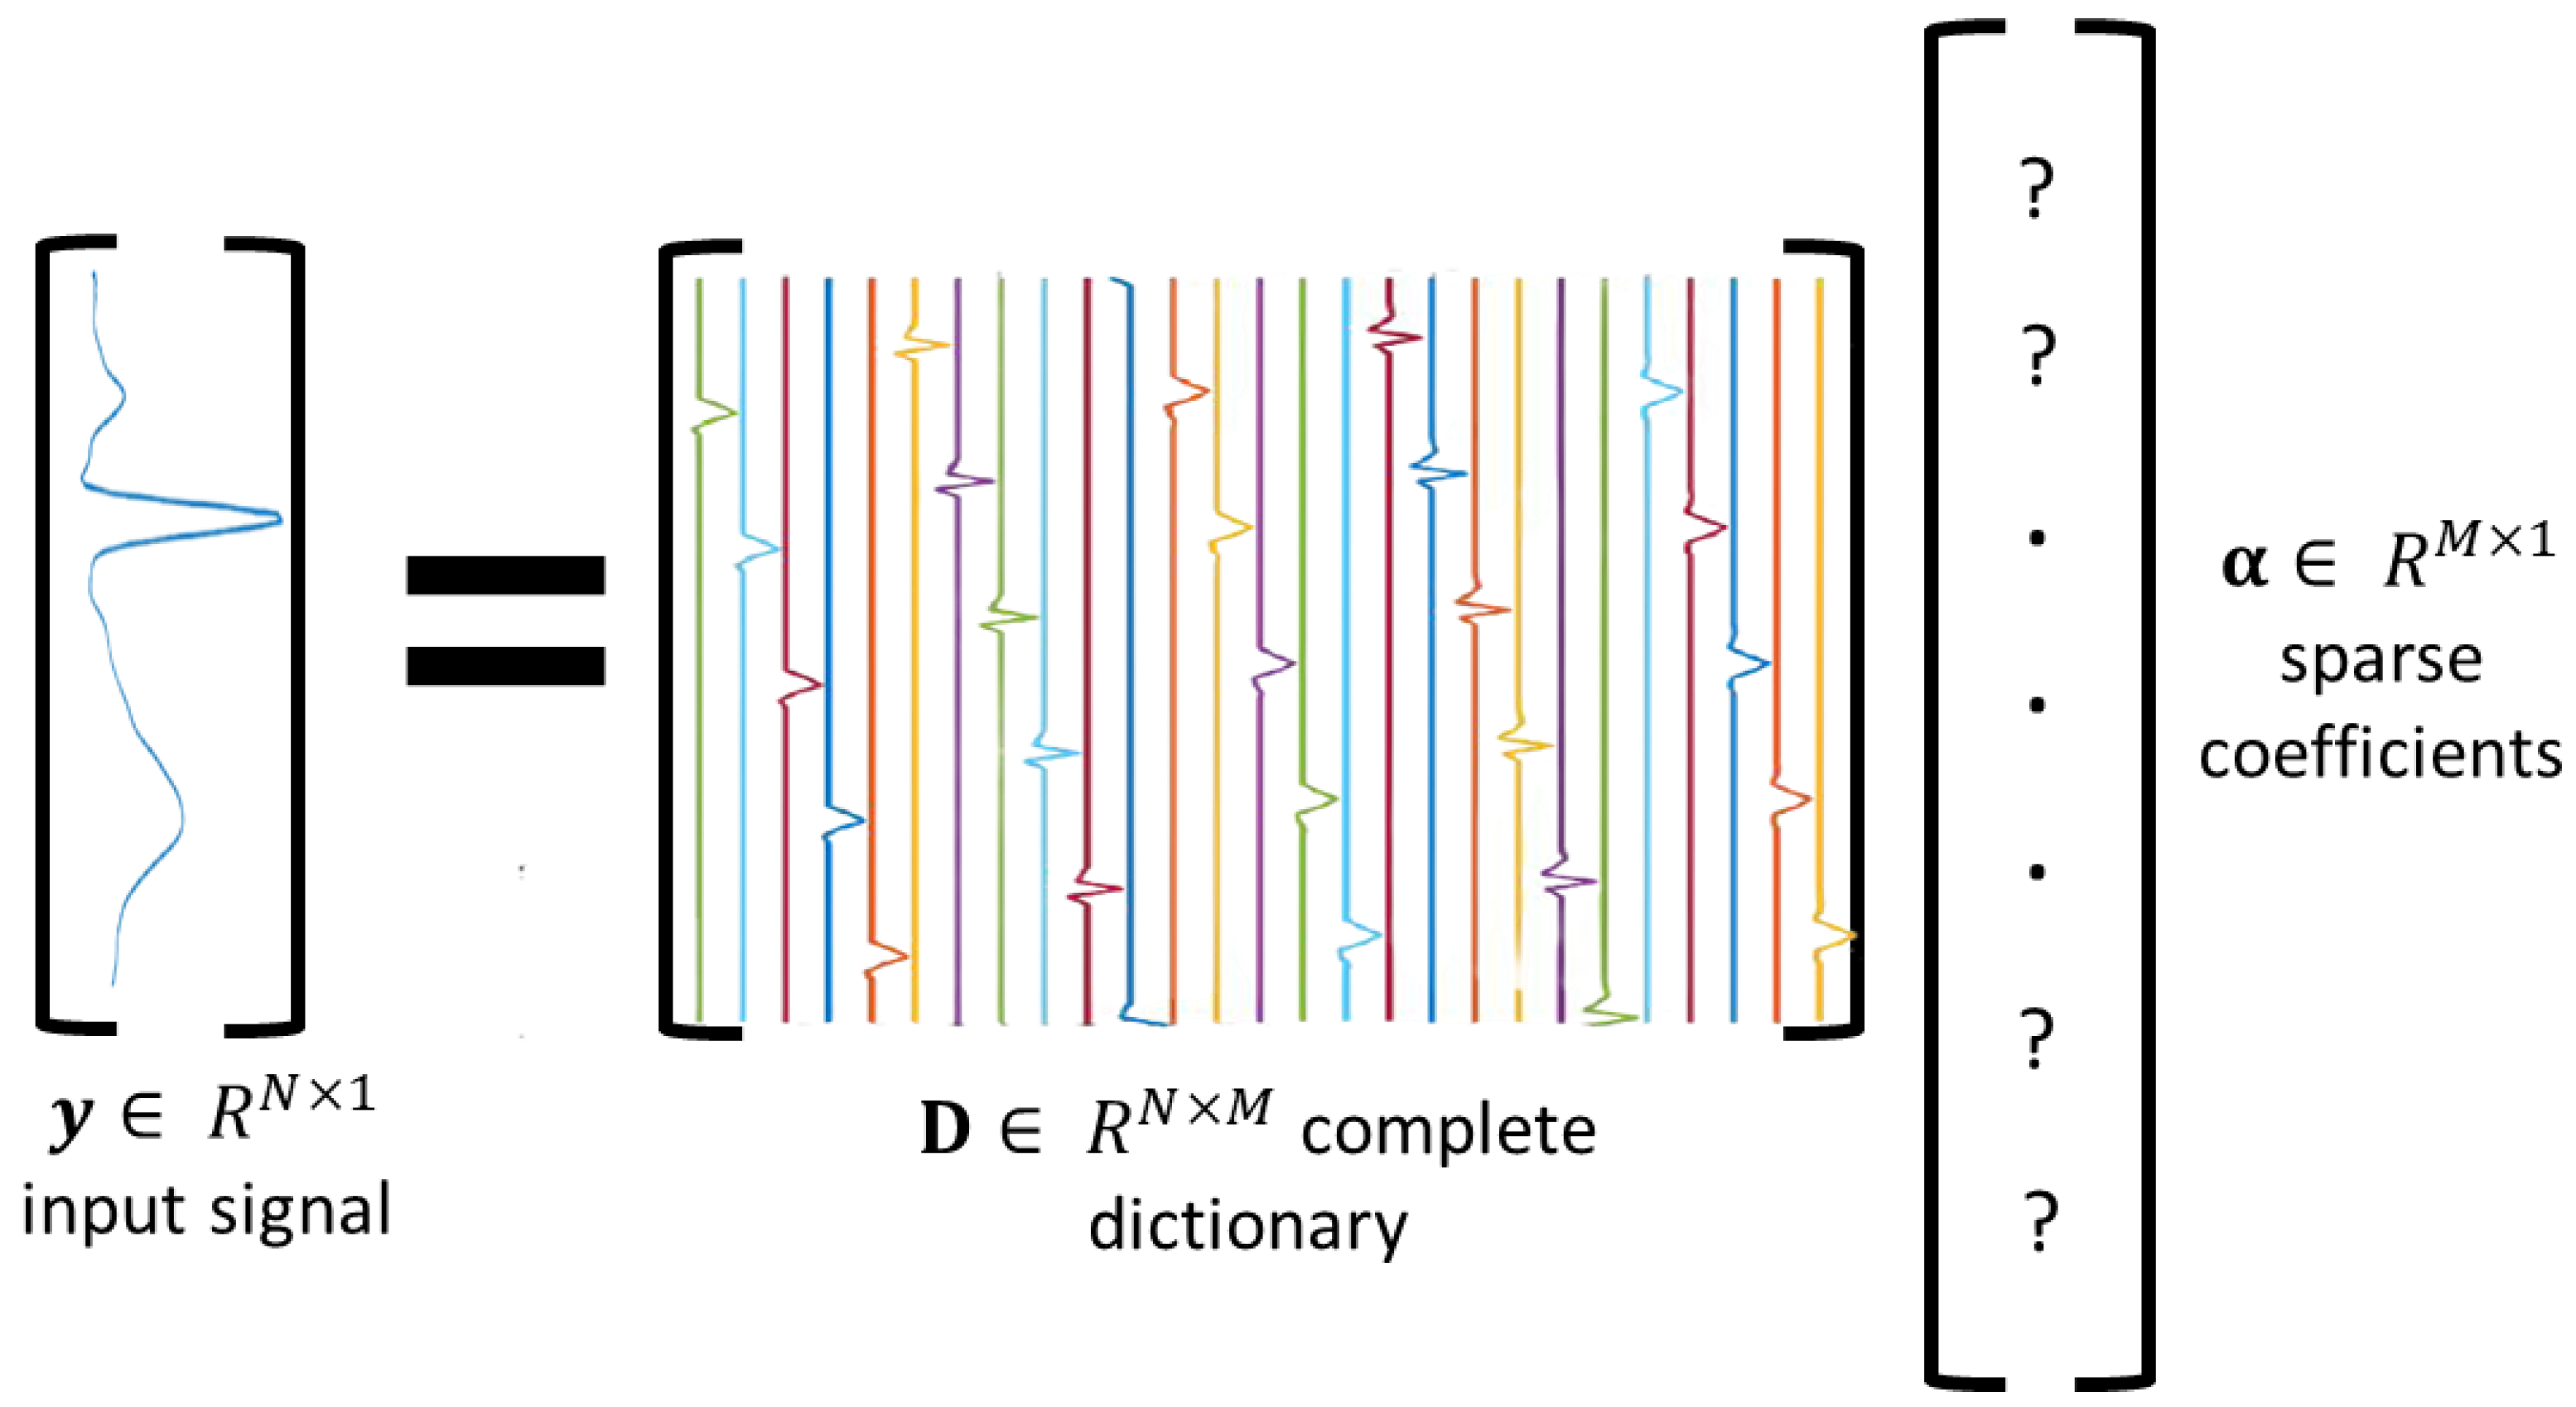
Sparse modeling is a mathematical representation of a noiseless signal
by a linear combination of a few basis elements (denoted as atoms), which are extracted from a dictionary
of
M atoms (see
Figure 3), such that
where
is a sparse coefficient vector. The dictionary
with
is known as an overcomplete dictionary, and when
, it is referred to as a complete dictionary. In this work, the output of the DAE model is considered as the noiseless signal
, and the dictionary
is obtained from the trained weights
of AE’s decoder. The main goal is to estimate the sparse vector
, which fulfills the assumption of Equation (
6). The sparse modeling problem can be tackled by using error-constraint problem. We propose the mean square error as an error-constraint as follows:
Here,
represents the threshold for the allowable reconstruction error. In this work, the matching pursuit algorithm is primarily employed due to its simplicity and computational efficiency. Since the focus is on biomedical signals, such as ECG, the error threshold
is set to be as small as possible (e.g.,
) to ensure accurate and low reconstruction error of the compressed signal
. Three dictionaries based on the autoencoder-driven dictionary (AE-DD) were used to compress the denoised ECG segments:
,
, and
. As suggested by [
4], four predefined dictionaries, e.g., DCT, Sym6, db6, and coif2, were also considered as well-suited dictionaries for representing ECG segments (see
Figure 4). We compared the performance of our learned dictionaries against these predefined ones.
2.3. Decomposing Stage
In this work, structured sparse coding was employed to decompose the ECG morphology into its fundamental components. This was achieved using the trained weights of an L1-regularized autoencoder, denoted as
. This dictionary was grouped into three subdictionaries corresponding to distinct ECG components:
The grouping was carried out through an amplitude–time thresholding technique, which identifies and assigns atoms that make significant contributions to each morphological component based on their temporal location and amplitude. Matching pursuit was applied using the full dictionary to estimate a sparse coefficient vector
:
where
denotes the reconstructed ECG segment obtained from the compression stage. To isolate a specific morphological component, a binary mask
(with ones in the positions corresponding to subdictionary
i and zeros elsewhere) was used to extract the relevant part of the sparse code. The component reconstruction is then given by the following:
where
, and ⊙ denotes element-wise multiplication. This allows the reconstruction of each ECG component independently from its corresponding subdictionary.
2.4. Hyperparameters and Computational Environment
All the hyperparameters used for training both the denoising autoencoder (DAE) and the autoencoder (AE) models are summarized in
Table 1. The choice of loss function depends on the regularization type: mean absolute error (MAE) was used with L1-regularization, while mean squared error (MSE) was paired with L2-regularization.
The models were implemented in Python 3.7 using the TensorFlow 2.11.0 library. All experiments were conducted on a personal laptop equipped with an Intel Core i5 processor and 20 GB of RAM.
2.5. Evaluation Metrics
The performance of the denoising stage was evaluated using signal-to-noise ratio improvement (
) and mean squared error (
), as defined below:
where
is the original ECG segment;
is the noisy ECG segment;
is the denoised output.
A higher indicates better noise reduction performance, while a lower implies a closer match between the denoised and the original ECG signal.
The effectiveness of the compression stage is evaluated using peak signal-to-noise ratio (
), mean squared error (
), percentage root-mean-square difference (
), and compression ratio (
), which are defined as follows:
where
is the reconstructed ECG segment;
N is the length (in samples) of the ECG segment;
K is the number of non-zero coefficients used for reconstruction;
b is the number of bits per coefficient value (e.g., 16 bits);
M is the size of the dictionary (i.e., number of atoms);
is the maximum absolute value in .
Higher values and lower and values indicate improved signal fidelity after compression, while a higher reflects greater compression efficiency.
The effectiveness of the decomposition stage is assessed using the correlation coefficient (
r) and mean squared error (
) between the original component
(e.g., P-wave, QRS complex, or T-wave) and its reconstructed version
:
where
is the original ECG component (P, QRS, or T);
is the reconstructed ECG component;
and are their respective means.
A higher r indicates stronger similarity in morphology, while a lower reflects better reconstruction accuracy of the decomposed component. Note: the original ECG components used for reference were segmented manually.
3. Results and Discussion
The absence of ground truth signals is a crucial problem when assessing a novel denoising or compressing technique. Typically, noise is superimposed on the raw recorded ECG signals. As a result, the evaluation of these denoising techniques is partially acceptable. However, the majority of the advanced DAE models were tested using filtered ECG signals as the ground truth. Therefore, in order to verify the effectiveness of the proposed framework, we considered simulated ECG signals. A simulating model proposed by [
19] was used to generate 160 ECG recordings, all representing normal and clean ECG signals with heart rates ranging between 60 and 100 beats per minute. The suggested models were trained using 110 of the 160 simulated ECG recordings that were sampled at a sampling frequency of 1 KHz, and their performance was assessed using the remaining recordings. One hundred QRS aligned ECG segments with length of 800 samples (about duration 0.8 s) were collected from each recording.
To evaluate the denoising stage, both the training and testing datasets were contaminated with a mixture of physiological noise types—namely baseline wander, motion artifacts, and electrode movement—collected from [
20]. Various input signal-to-noise ratio (
) levels were applied: for the training set, input
values of
∞, 5, 0, and −5 dB were used; and for the testing set, input
values of
∞, 3, 0, and −3 dB were considered. The denoised ECG segments were further compressed by the compressing stage; then, the reconstructed ECG segments were decomposed into their main components: P-wave, QRS complex, and T-wave.
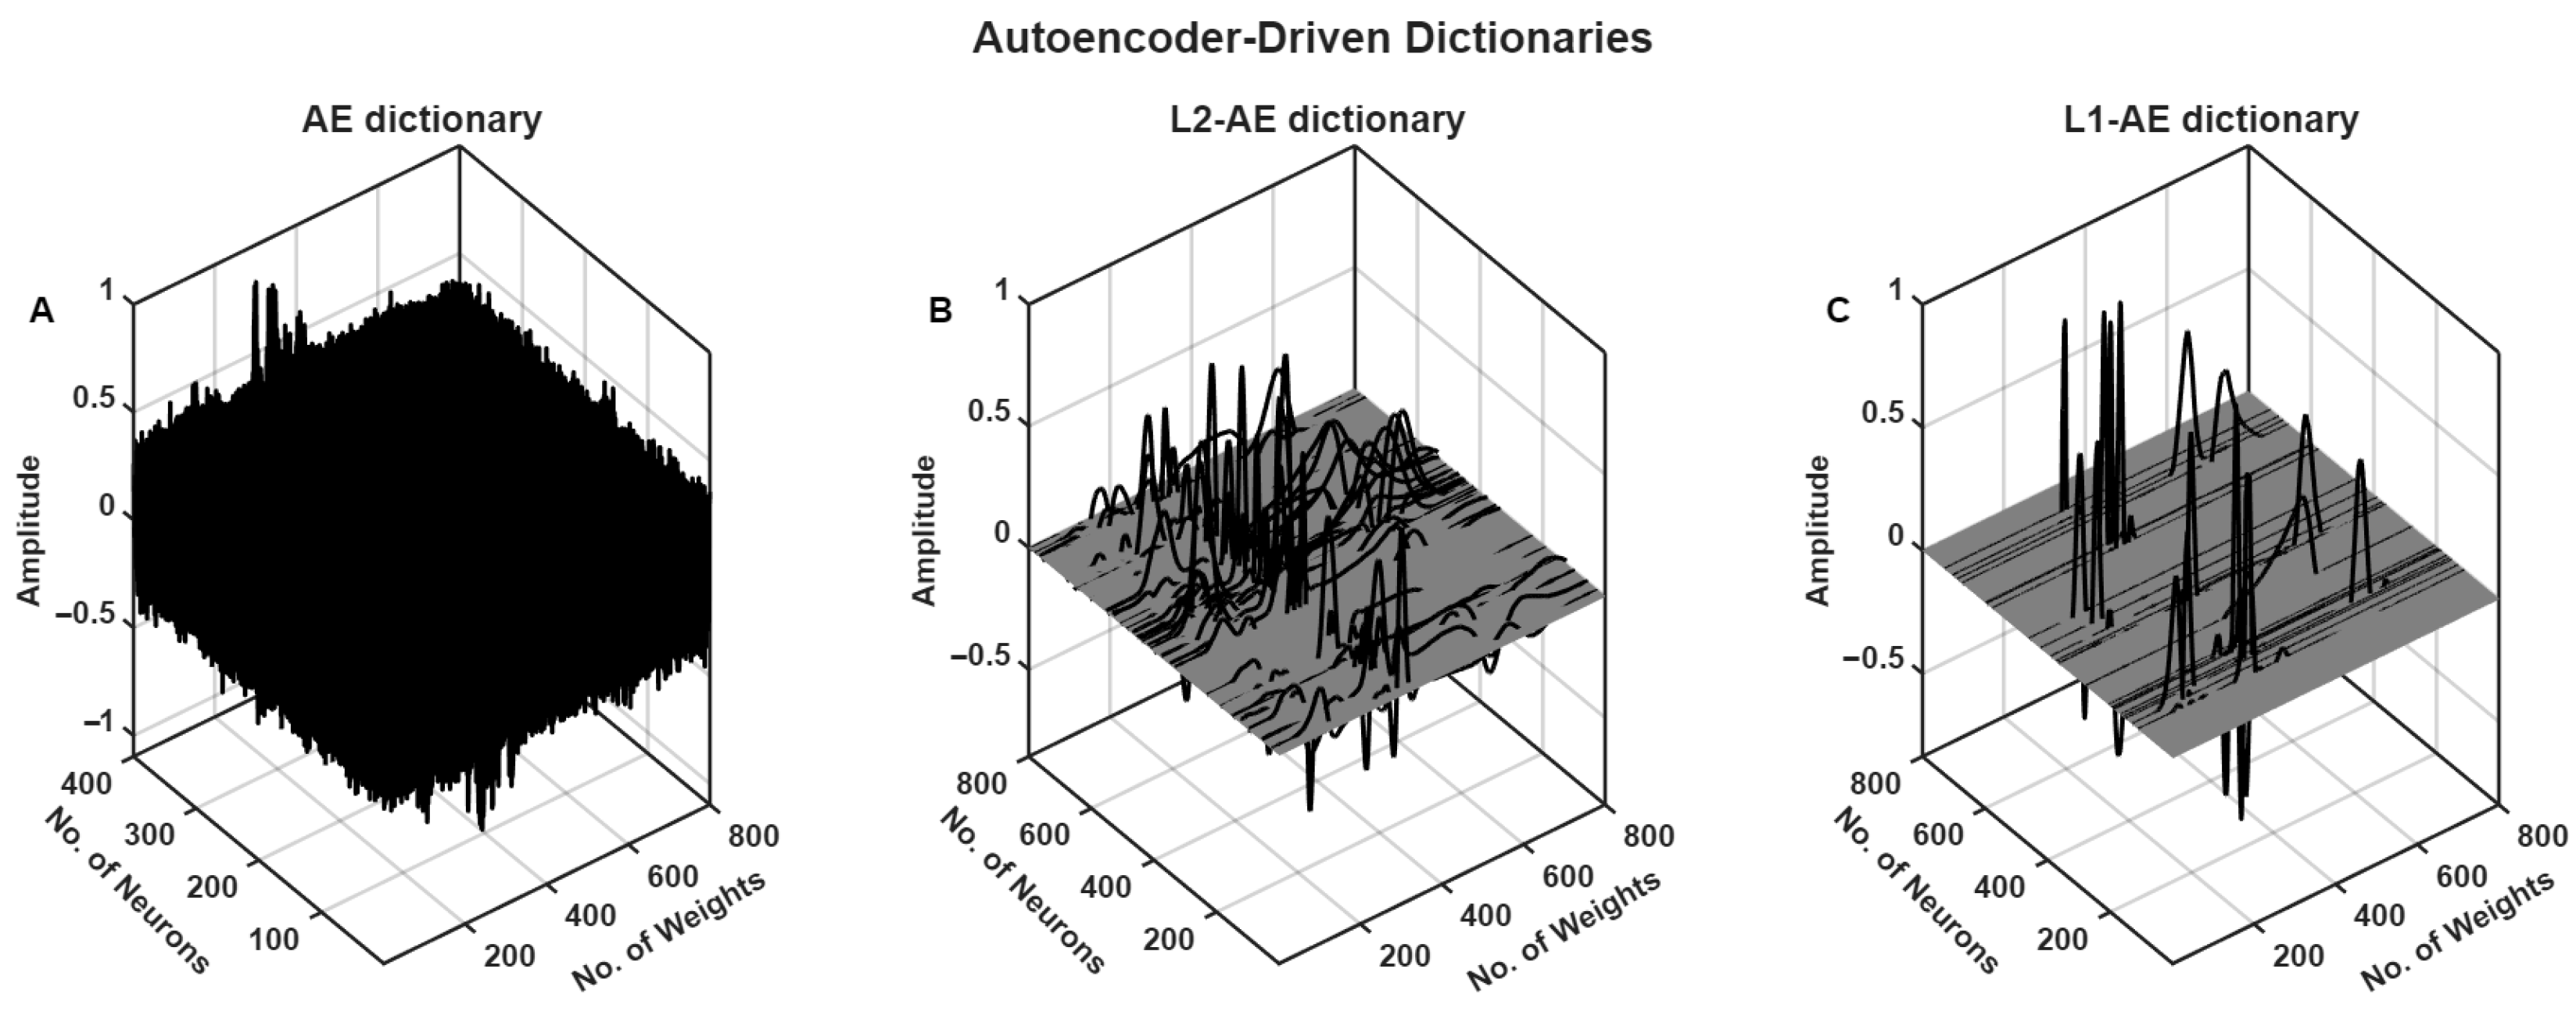
The autoencoder model with and without weight regularization was trained with clean ECG segments of the training set (the trained decoded weights of different AE models are presented in
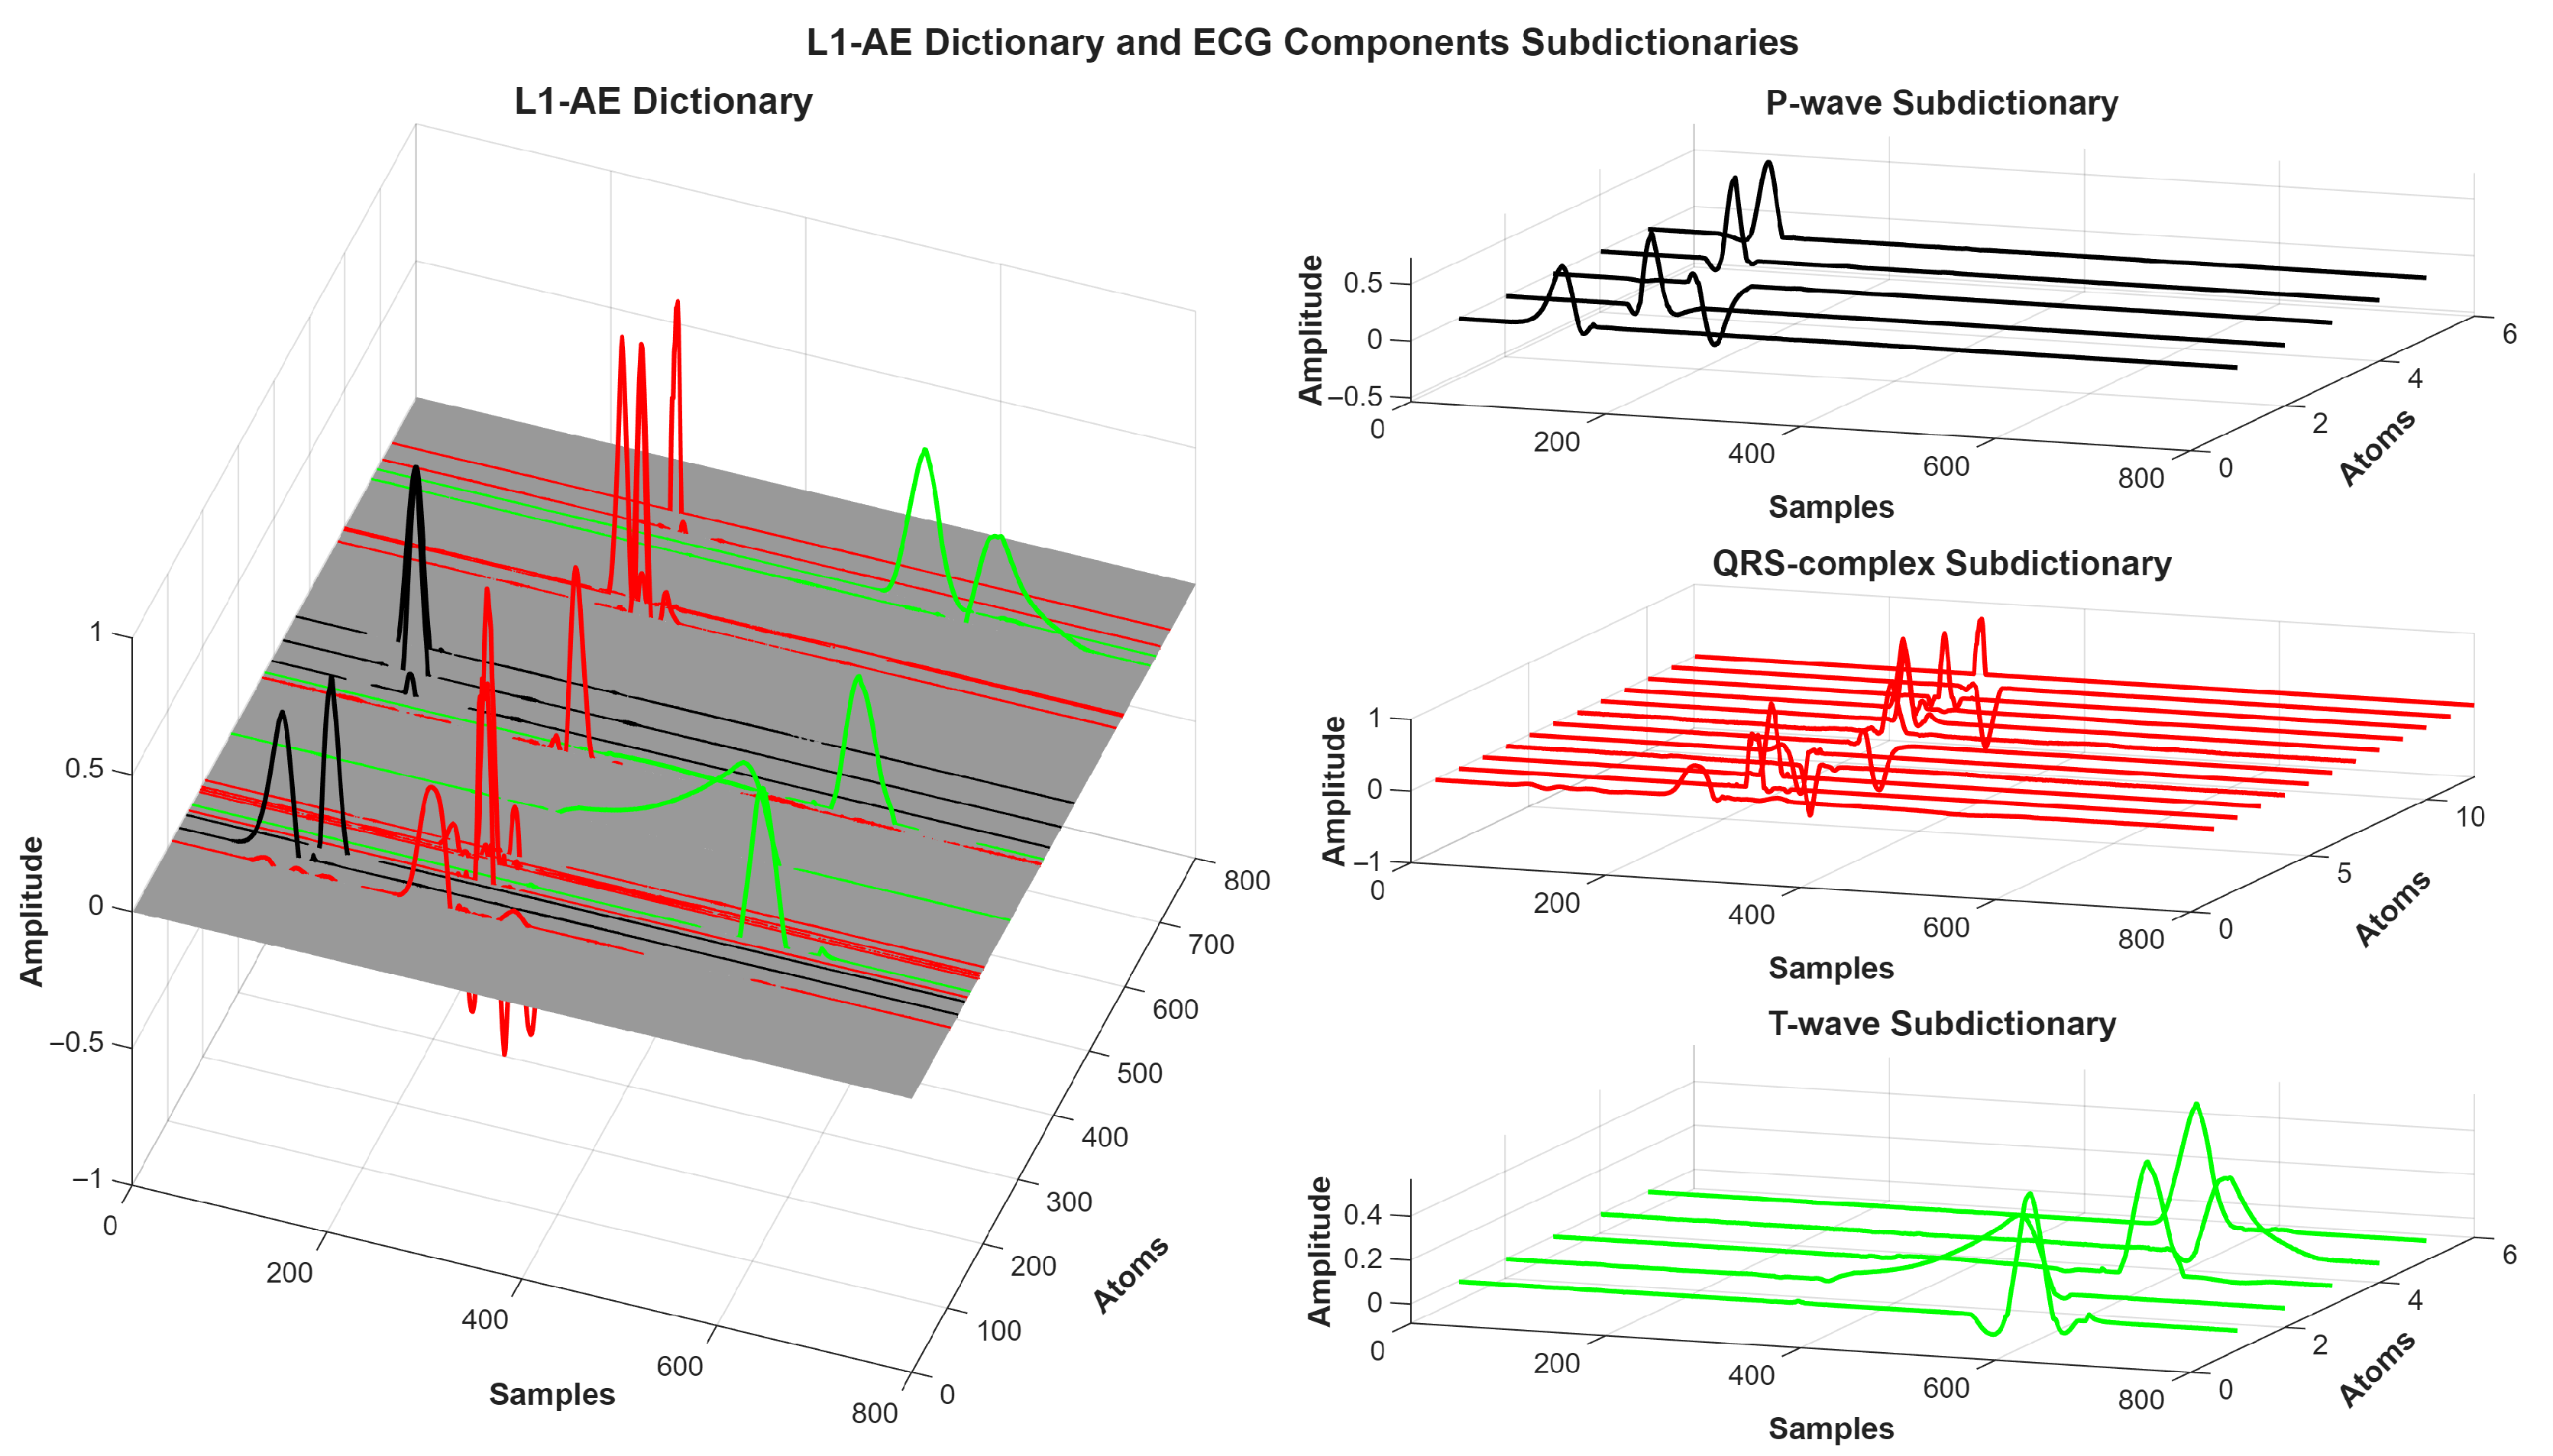
Figure 5). The trained L1-AE model had some weights related to components of ECG, such as P-wave, QRS complex, and T-wave, as shown in
Figure 6.
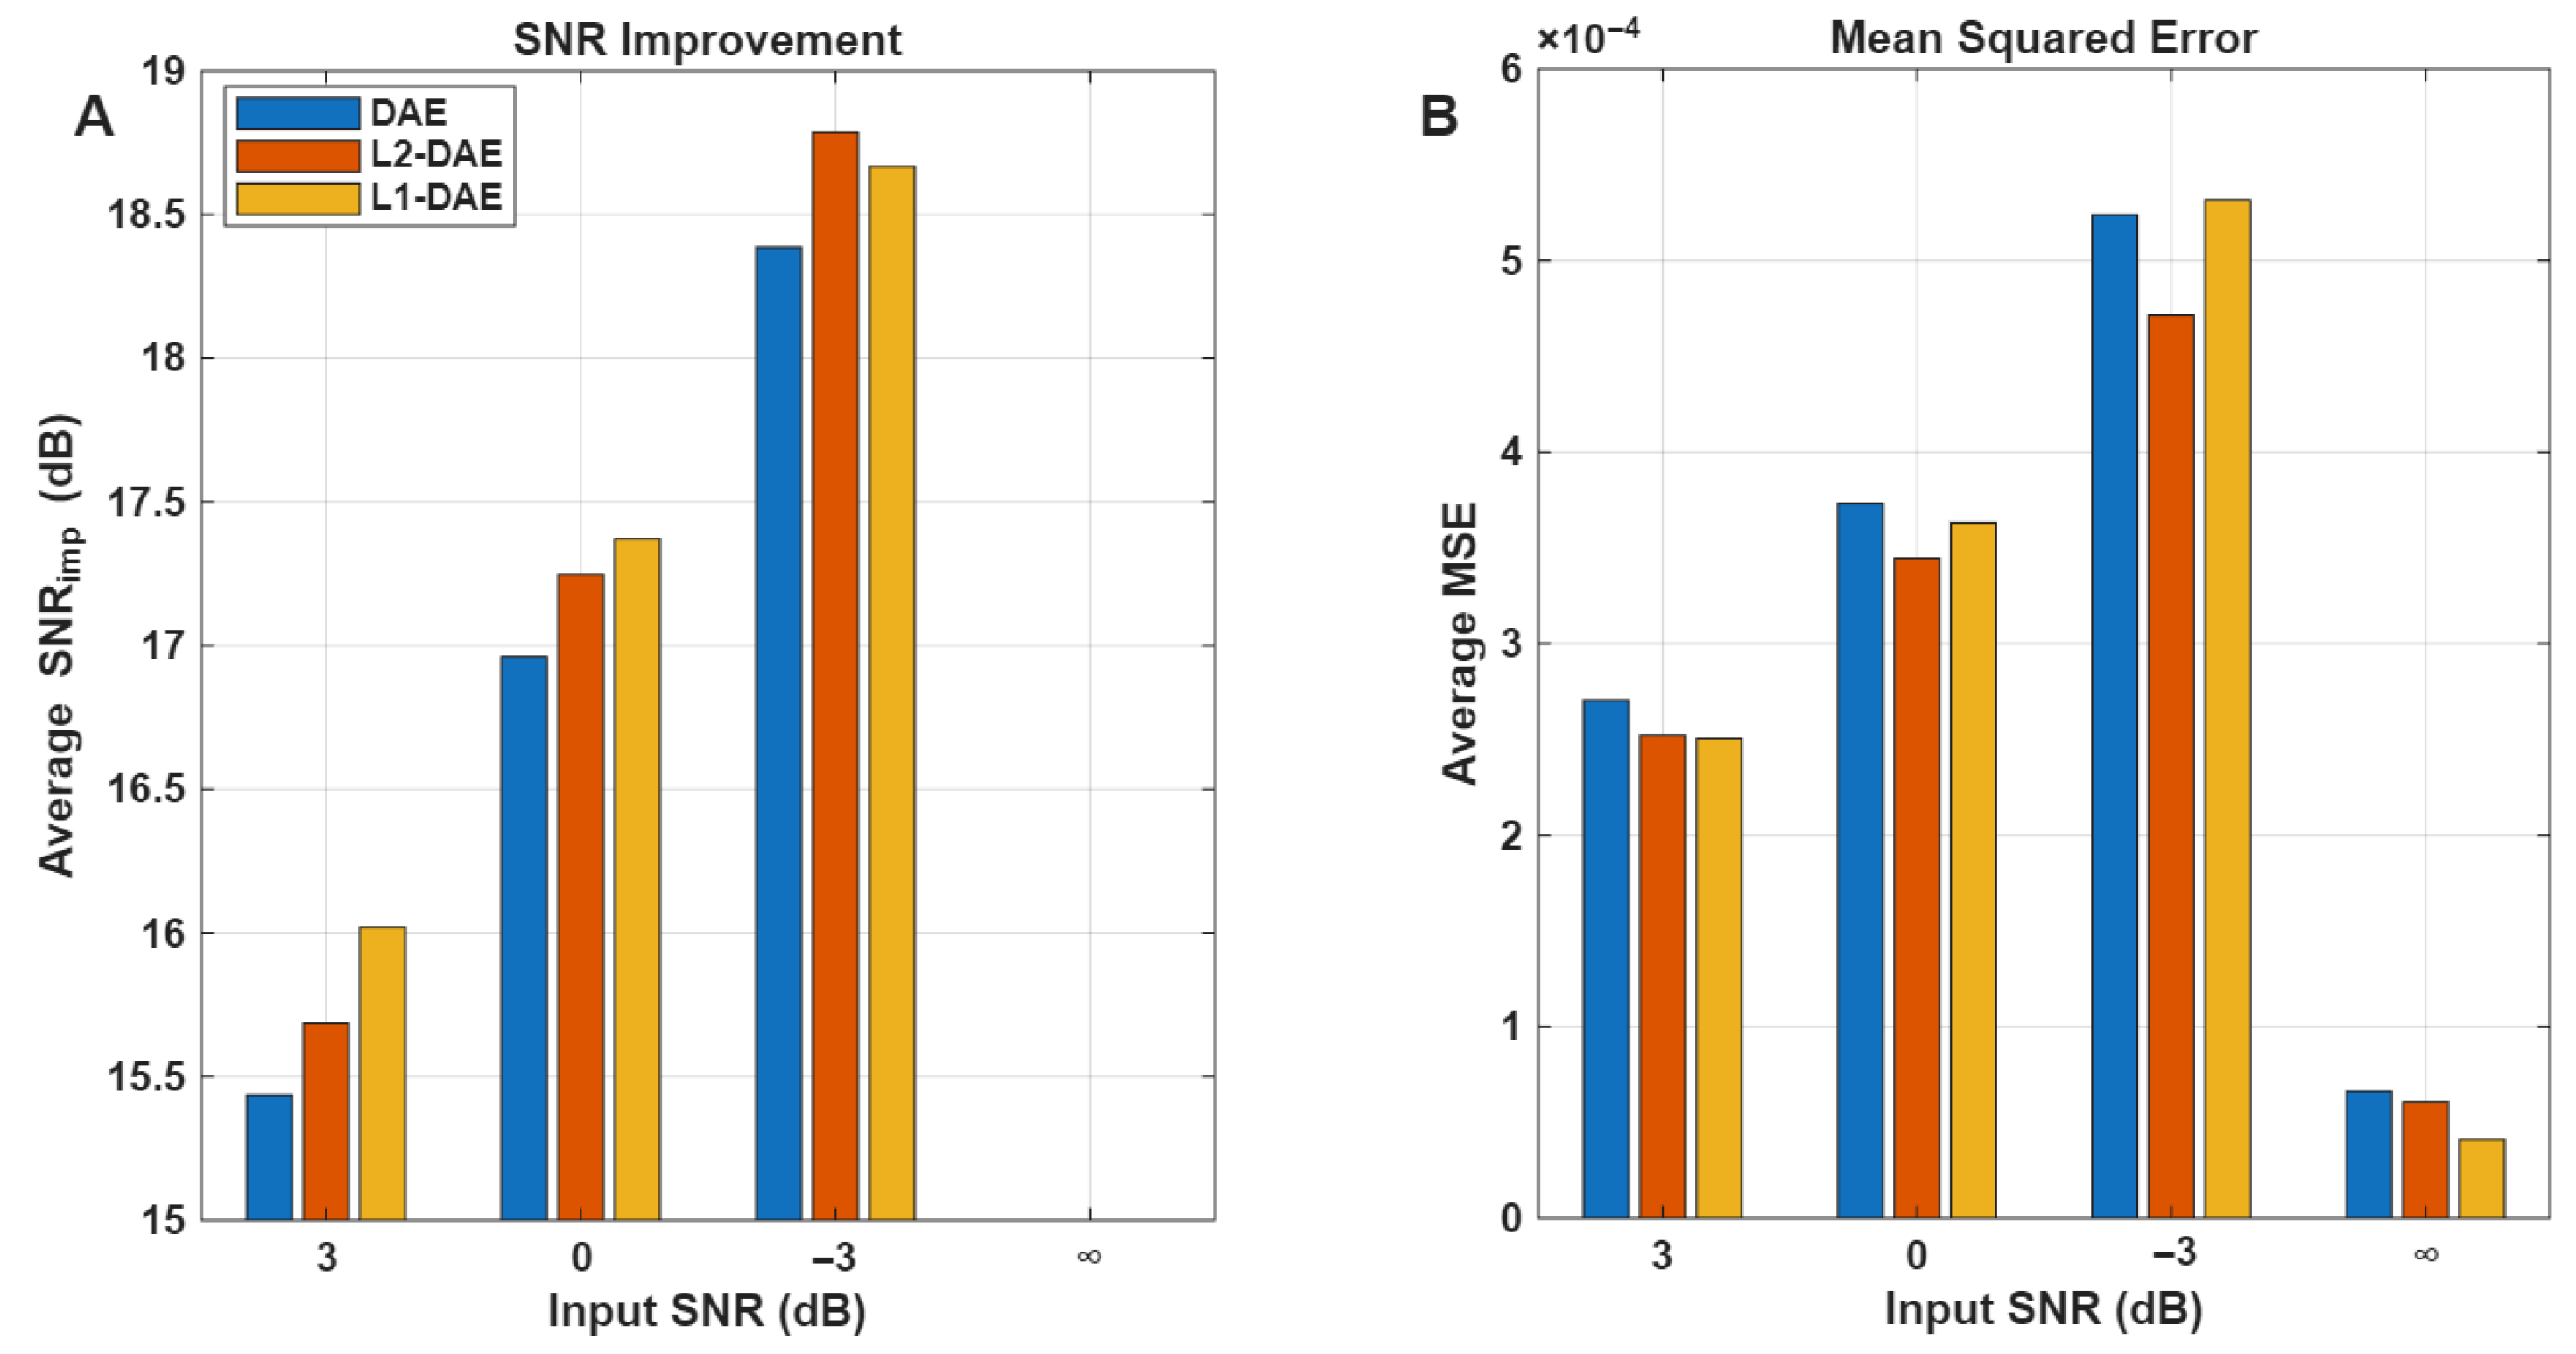
The performance of the denoising stage was evaluated for the DAE models with and without the weight regularization technique at different input SNR levels.
Figure 7 clearly shows that the DAE model with L1-regularization (L1-DAE) achieved better denoising performance compared to the L2-DAE and DAE models, especially in the case of input
∞, 3, and 0 dB. In the case of input
3 dB, the L2-DAE model achieved slightly higher
18.75 dB compared to L1-DAE
18.60 dB. This slight improvement by the L2-DAE model under the challenging −3 dB
conditions may be attributed to the nature of the regularization terms. L2-regularization typically encourages smaller, more evenly distributed weight values, which can help the model better generalize when the input signal is heavily corrupted by noise. Under such low
conditions, the L2 norm is more effective in preventing large fluctuations in the learned parameters, leading to a more stable reconstruction despite the high noise levels. On the other hand, L1-regularization promotes sparsity, which generally improves denoising performance by focusing on dominant features, but this may be less advantageous when the noise is extremely strong and widespread, as in −3 dB
. Therefore, the numerical advantage of L2-DAE here reflects its increased robustness to heavy noise, complementing the strengths of L1-DAE observed at a higher input
.
Figure 8 shows that the L1-AE model, which was trained using weight regularization, effectively compressed the denoised ECG segment with a high compression ratio (CR = 28), obtaining the lowest MSE and highest PSNR for all input
values. The DAE model, on the other hand, was unable to learn efficient basis functions for representing the ECG signal in the absence of weight regularization (see
Figure 5). This highlights the critical role of weight regularization in enabling the model to learn more compact and meaningful representations using fewer atoms. Moreover, the use of the mean squared error (MSE) as an error constraint in Equation (
7) ensures the quality of the reconstructed ECG segment following the compression stage, maintaining a reconstruction error below
, as clearly demonstrated in
Figure 8.
The learned AE-DD dictionary, e.g., L1-AE, was also compared to a number of predefined dictionaries, including DCT, Sym6, db6, and coif2, which were found to have a strong correlation with the ECG signals reported in [
4].
Table 2 highlights the effectiveness of the proposed method compared to different predefined dictionaries. The L1-regularized autoencoder (L1-AE) dictionary attained the best overall performance, while requiring the fewest atoms at 18, with the highest peak signal-to-noise ratio (PSNR) of 47.84 dB, the lowest mean squared error (MSE) of
, the lowest PRD of 2.13, and the highest compression ratio of 28. This demonstrates that the L1-AE dictionary provides a more compact and accurate representation of ECG signals, leading to improved compression results compared to traditional dictionaries, such as DCT and various wavelets. Additionally, the proposed compression method demonstrated superior performance compared to various existing ECG compression techniques, as summarized in
Table 3. Specifically, it achieved a notably high compression ratio of 28 while maintaining acceptable (PRD) of 2.13, outperforming most referenced methods in terms of both compression efficiency and signal fidelity.
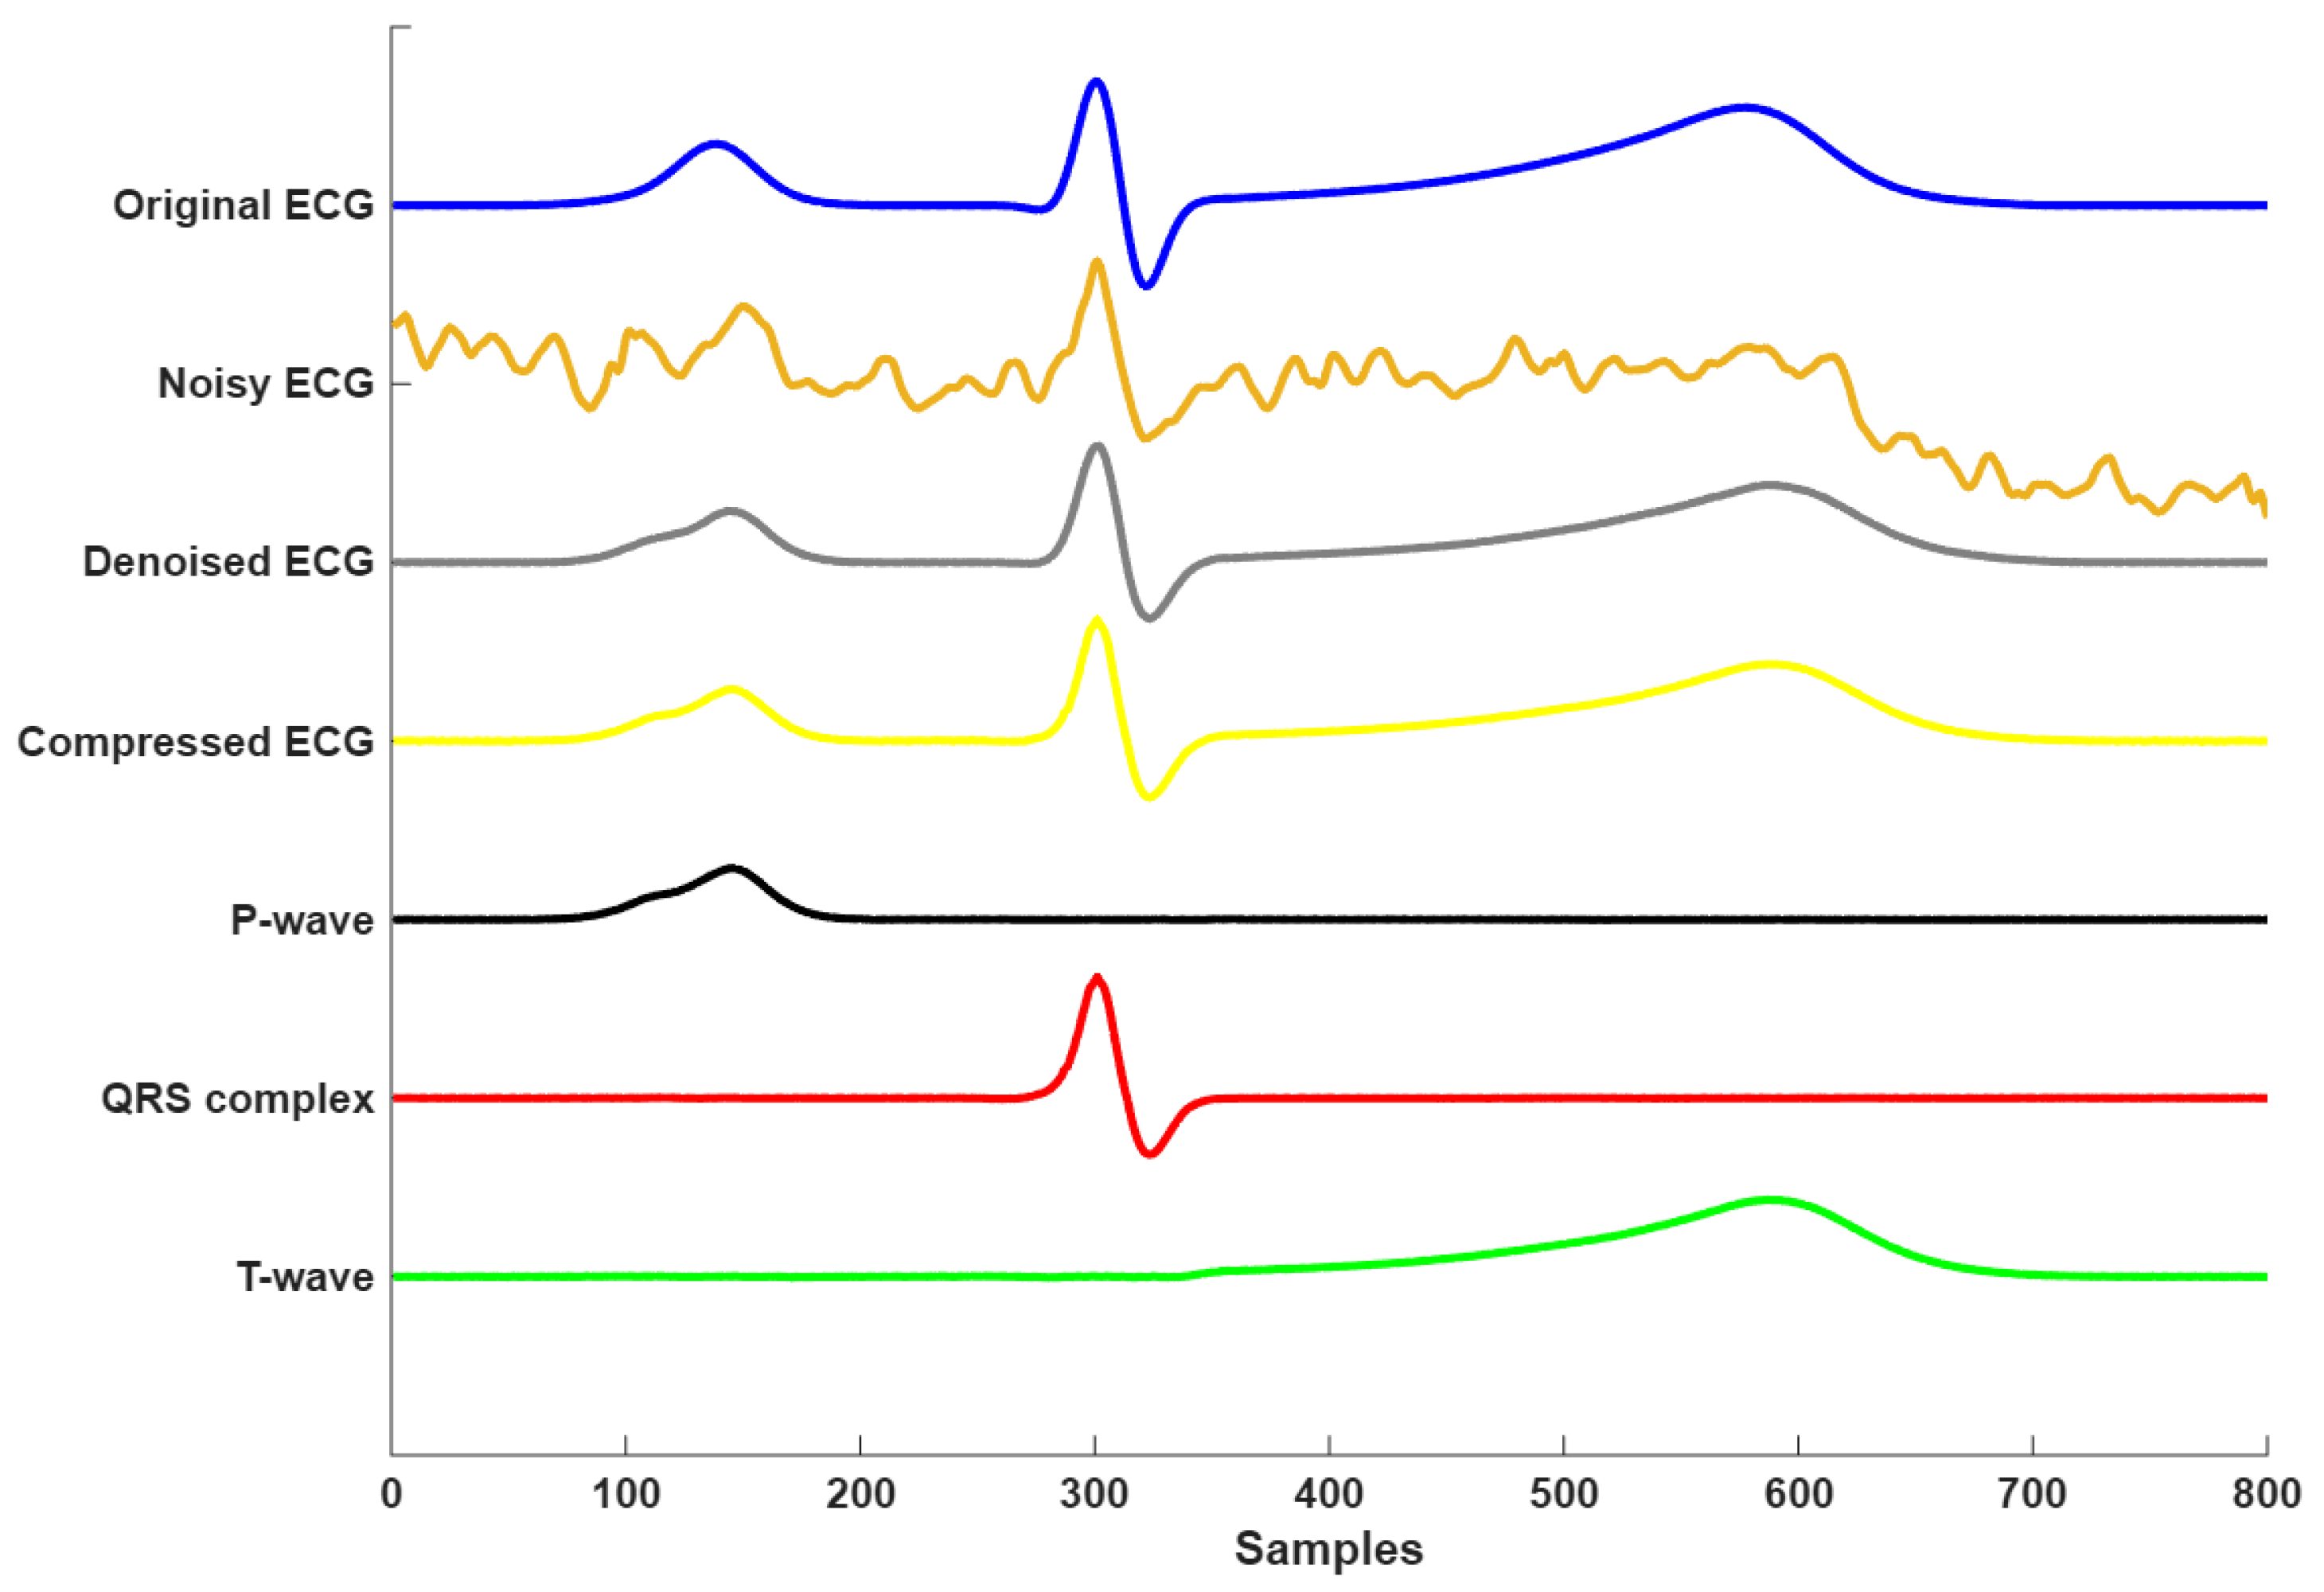
Figure 9 presents the complete signal processing pipeline of the proposed framework, demonstrating three key stages: denoising, compression, and morphological decomposition. The time course analysis revealed accurate component decomposition, where the P-waves (visible at Samples 100–200) and T-wave (Samples 450–650) were clearly resolved despite their lower amplitudes relative to the R-peak. Each component was clearly isolated, showing minimal overlap, which verifies the framework’s capacity for morphological decomposition. This decomposition enables precise analysis of individual ECG waves, which is particularly valuable in clinical applications such as arrhythmia detection, ischemia monitoring, and cardiac pathology characterization. Overall, the results confirm that the proposed model not only performs robust denoising and compression, but also enables interpretable and clinically meaningful decomposition of the ECG signal.
To assess the generalization performance of the proposed autoencoder-driven dictionary approach, we considered real recorded ECG signals from the St. Petersburg INCART 12-lead Arrhythmia Database [
33], focusing on QRS-aligned ECG segments categorized into four AAMI classes: Normal (N), Ventricular ectopic beat (V), Supraventricular ectopic beat (S), and Fusion beat (F). Each segment was 0.78 s in duration (corresponding to 200 samples at a sampling rate of 257 Hz).
All segments underwent preprocessing using a third-order butterworth bandpass filter (0.5–40 Hz) to remove baseline wander and high-frequency noise. An adaptive screening method, as described by [
4], was then applied to identify and retain low-noise, outlier-free segments suitable for model evaluation. Following screening, 80% of the segments from each class were used to train the proposed L1-regularized autoencoder (L1-AE) model, while the remaining 20% were reserved for evaluating the model’s performance in compressing and decomposing the morphological structure of ECG signals.
Table 4 summarizes the number of segments collected before and after filtering and from the adaptive screening across the four AAMI classes.
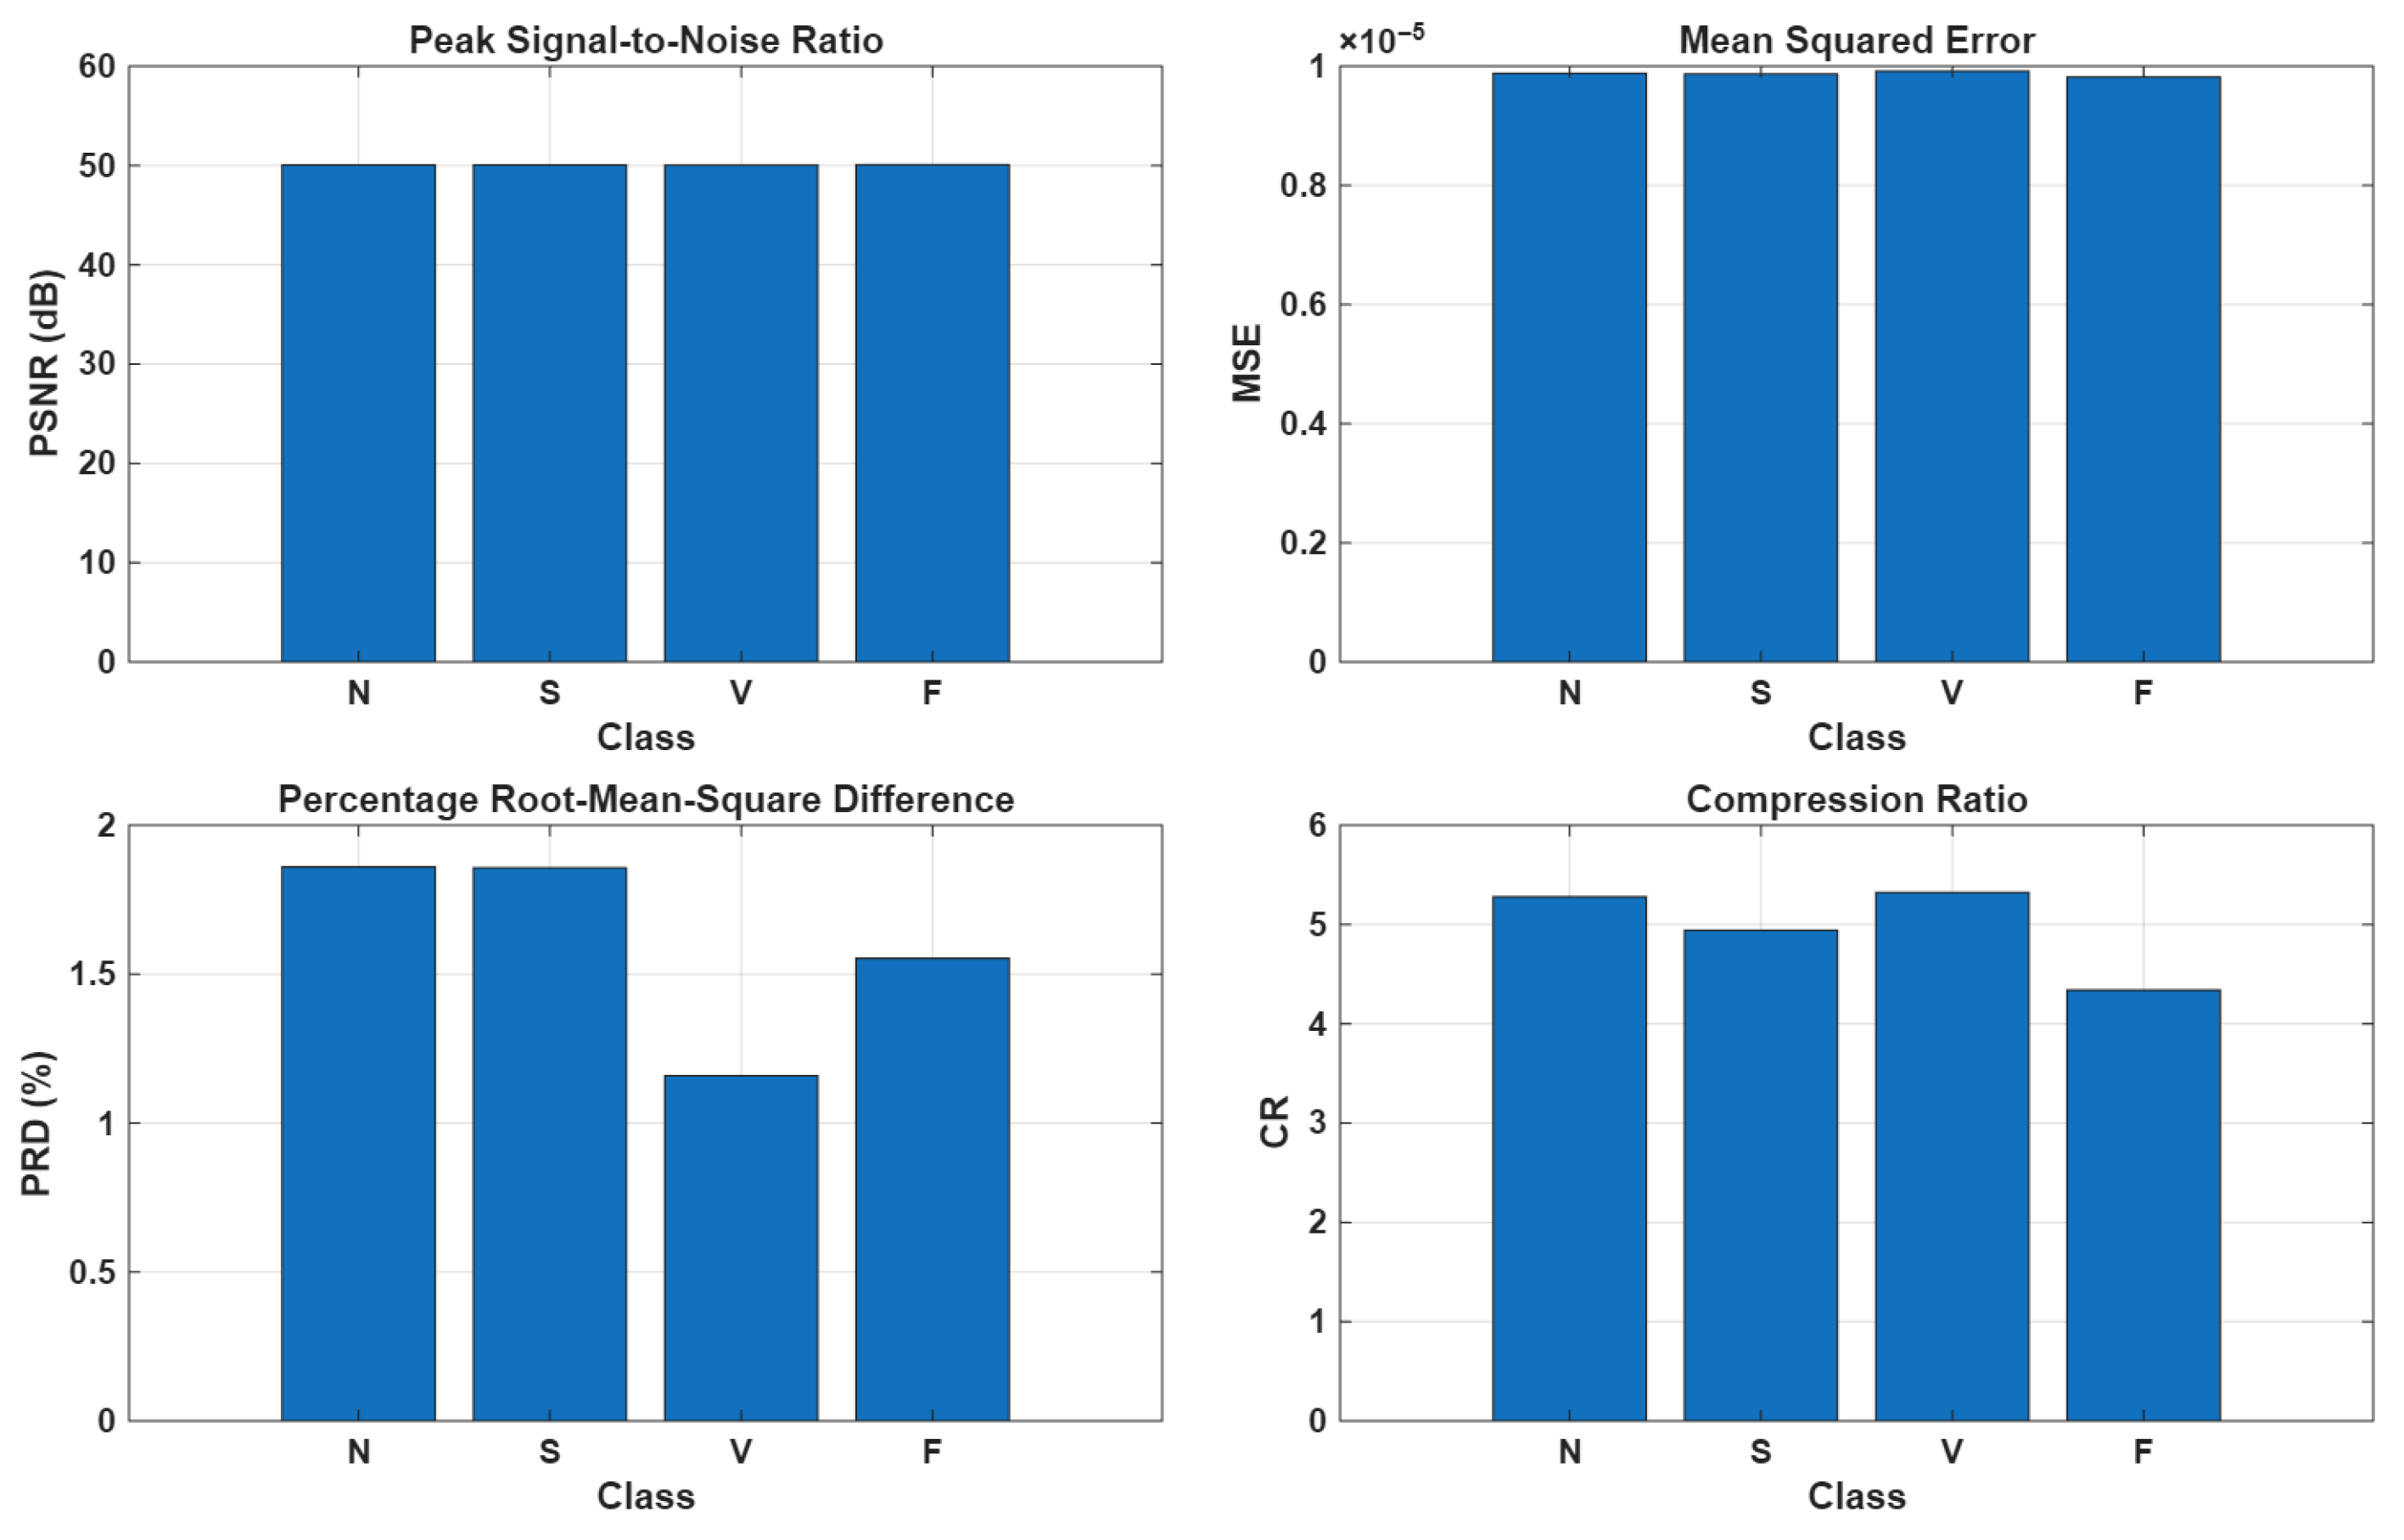
As illustrated in
Figure 10, the compression stage applied to real ECG segments demonstrated promising performance, achieving a high PSNR of approximately 50 dB, a low MSE on the order of
, and a PRD of around 1.5%. However, the primary limitation of the method is its relatively modest compression ratio, which remains around 5:1 across all AAMI classes. This limitation could be attributed not only to residual noise or artifacts, which increase the number of atoms required to accurately represent the signal, but also to other factors, such as ECG waveform diversity and QRS alignment errors. In particular, the dataset exhibits an R-peak jitter of approximately
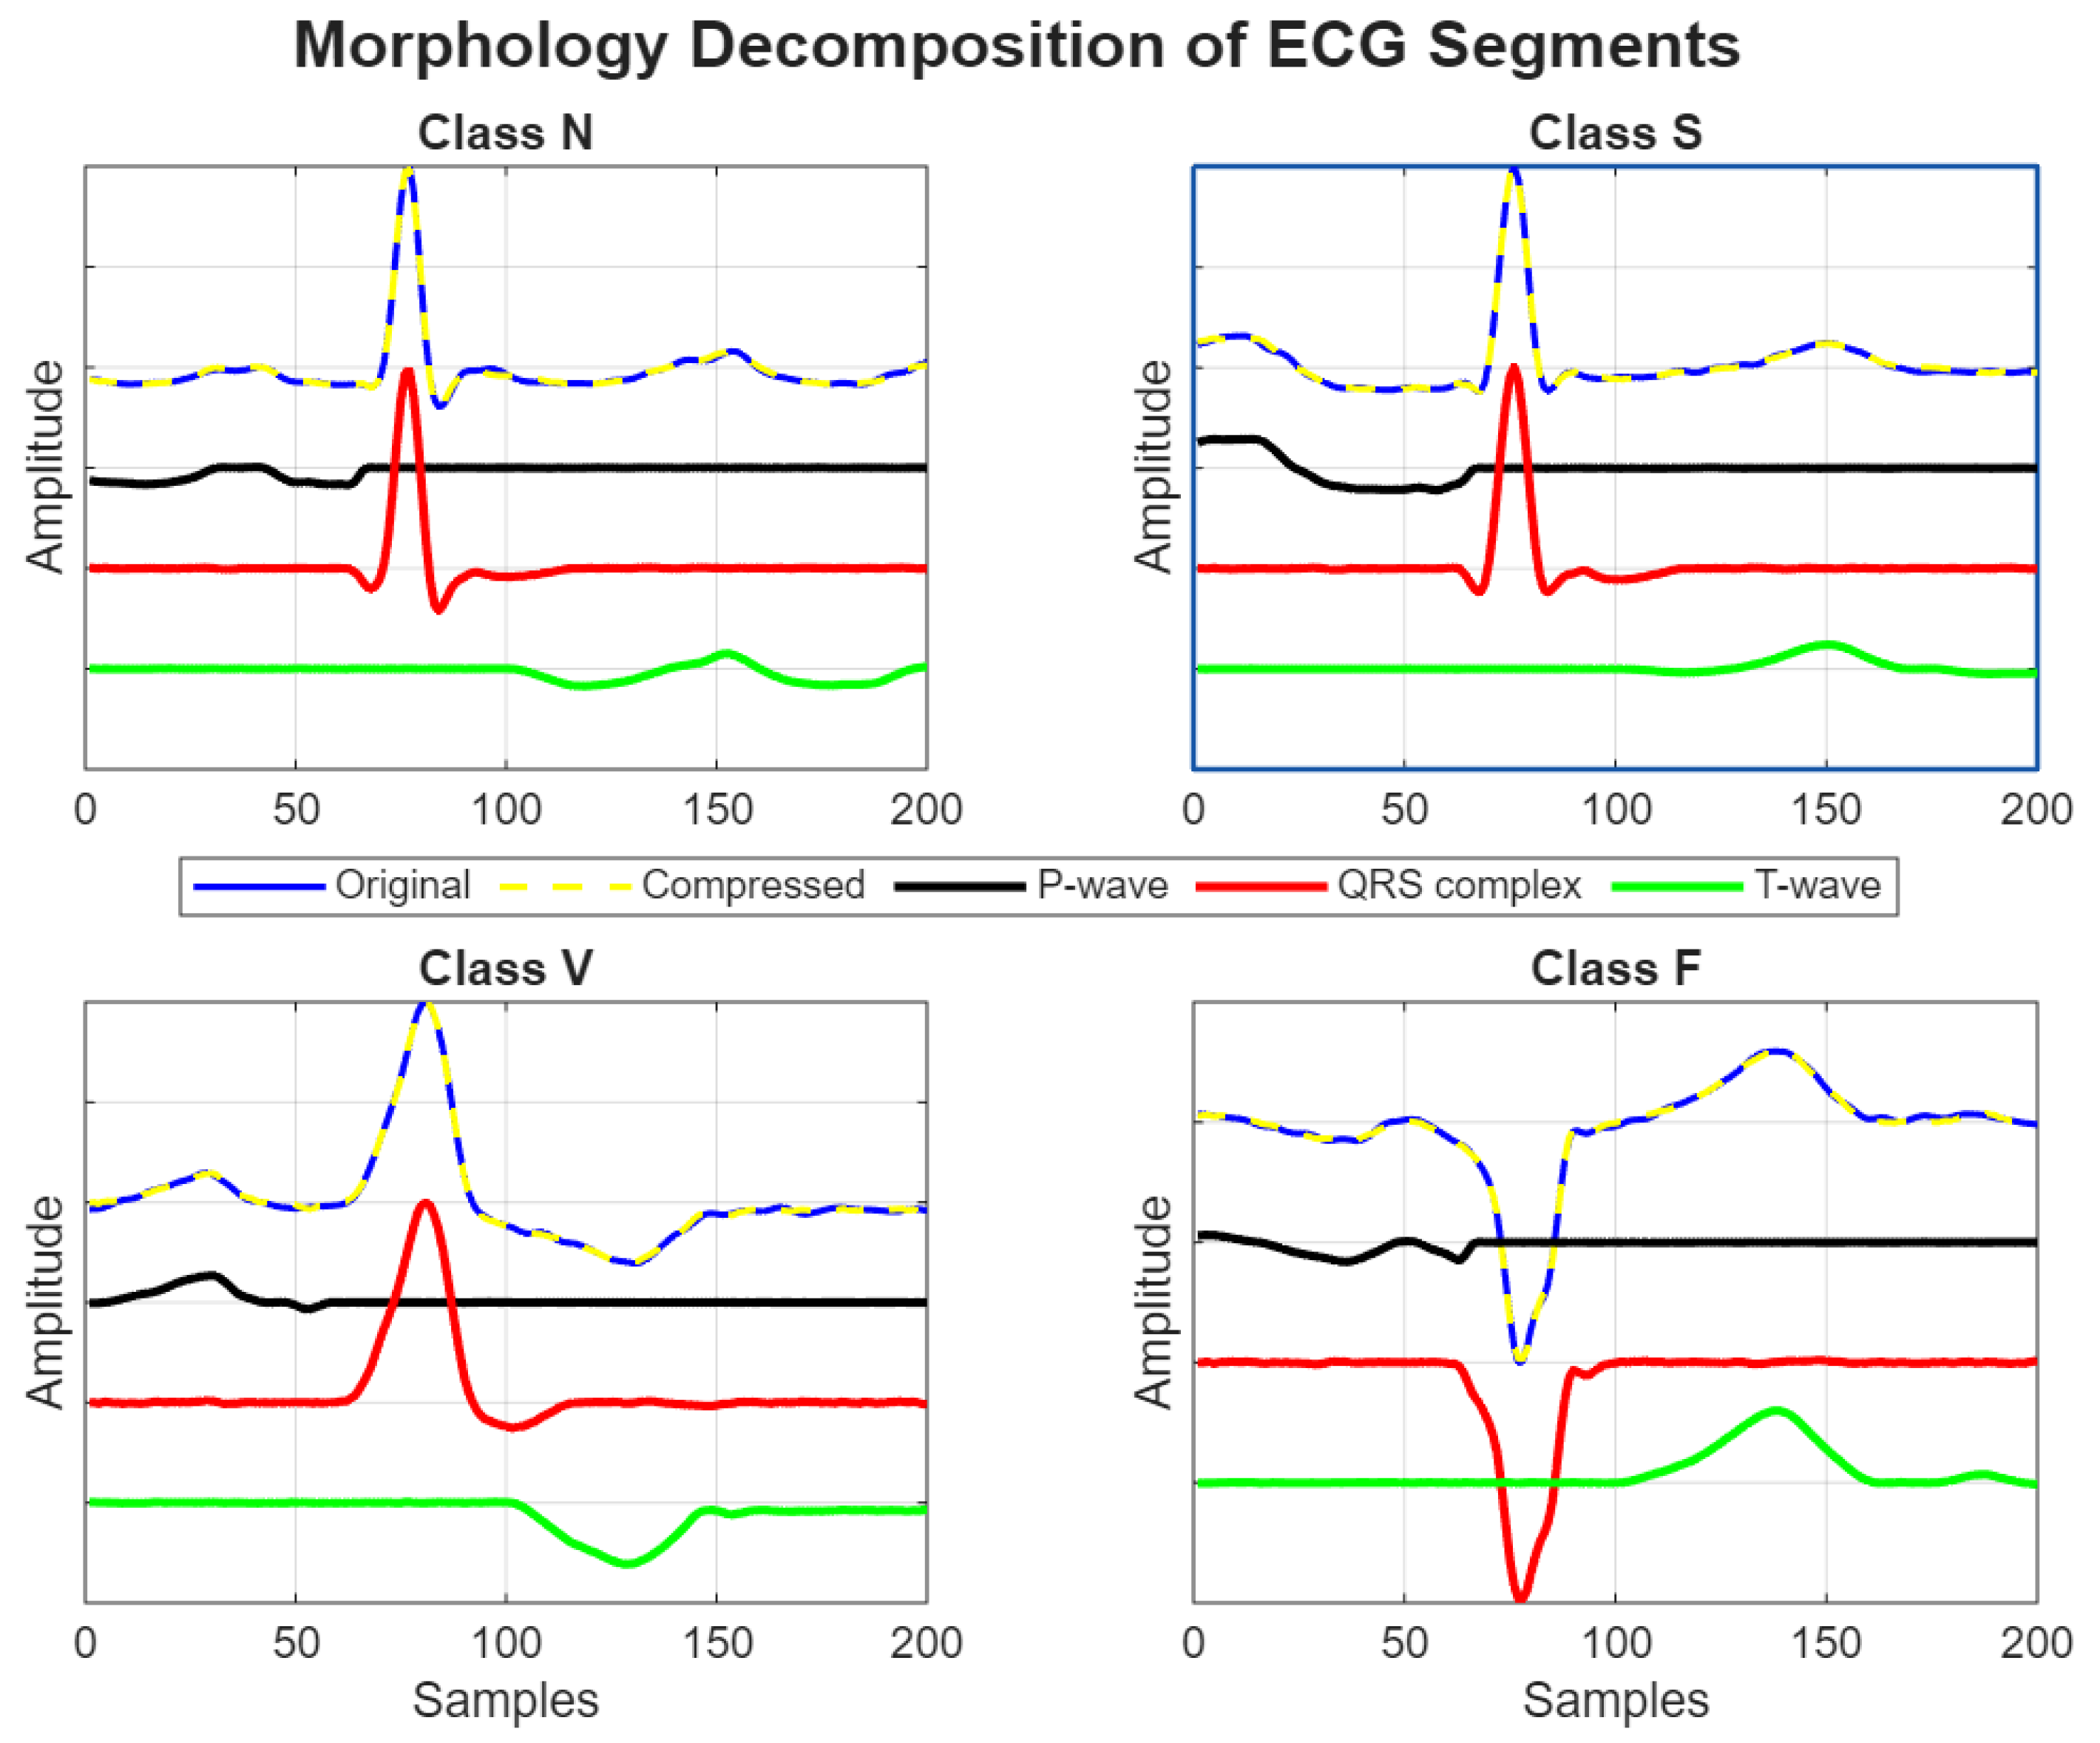
, which may further affect the ability of the method to efficiently compress the signal while preserving its morphological features. Despite the low compression ratio, the proposed AE-DD method demonstrated strong generalization capabilities in accurately decomposing both normal and arrhythmic ECG segments into their fundamental morphological components, such as P-wave, QRS complex, and T-wave, as illustrated in
Figure 11.
Table 5 presents the correlation coefficients and mean squared error (MSE) values obtained when comparing the original ECG signal with the reconstructed morphologies. The results demonstrate that the decomposition method preserves the main characteristics of the ECG waveform with high fidelity. In particular, the QRS complex showed the highest similarity, with a correlation of 0.99 and an MSE of
, reflecting the robustness of the method in capturing the sharp and high-amplitude features of the ECG. The P-wave also exhibited strong agreement between the original and reconstructed signals, achieving a correlation of 0.98 and a very low MSE of
, indicating accurate preservation of low-amplitude deflections. For the T-wave, a correlation of 0.95 and an MSE of
were obtained, which, although slightly lower than the other components, still confirmed the reliability of the method in reconstructing repolarization morphology. Overall, these results highlight that the proposed approach achieves accurate ECG morphology reconstruction across all key waveform components.
4. Conclusions
This study presents a novel framework based autoencoder-driven dictionary (AE-DD) that simultaneously addresses ECG denoising, compression, and morphological decomposition. By leveraging L1-regularized autoencoders with the matching pursuit algorithm, the method achieves high-fidelity signal compression and the precise decomposition of ECG components. Key contributions include end-to-end high-performance denoising along with ECG morphology decomposition.
In controlled experiments, the L1-AE dictionary achieved a 28:1 compression ratio with near-perfect reconstruction fidelity, which was reflected by an extremely low MSE of and PRD of 2.1%—significantly outperforming non-regularized autoencoders and predefined dictionaries. In the case of real ECG segments from the INCART database, the framework continued to demonstrate a good performance, achieving a PSNR of approximately 50 dB, a PRD of 1.5%, and an MSE on the order of . Although the compression ratio in the case of real signals was more modest (approximately 5:1), this was primarily due to the presence of residual noise and artifacts even after adaptive screening, which required more atoms for accurate representation. However, the decomposition stage showed excellent generalization in decomposing both normal and arrhythmic real ECG segments.
The detection and duration estimation of P- and T-waves remains a significant challenge due to their relatively low amplitudes and the potential overlap with noise and artifacts. To address this challenge, the trained weights of the L1-AE model form basis functions that naturally align with key ECG components, including the P-wave, QRS complex, and T-wave. These learned bases enable not only the automatic identification of P- and T-waves, but also the precise estimation of their durations, offering a robust and interpretable approach for detailed morphological assessment.
Finally, the proposed framework addresses the challenges of prolonged ambulatory ECG monitoring by offering a unified solution for signal enhancement, compression, and clinically interpretable feature extraction. Notably, the morphological decomposition capability is both highly novel and clinically valuable as it enables accurate identification and temporal localization of individual ECG components, particularly the P-wave and T-wave durations. In addition, we recorded initial indications that separate bases are better suited for representing the P-wave, QRS complex, and T-wave when the time interval between these signal components varies. This capability facilitates precise temporal and morphological analysis, essential for diagnosing conditions such as atrial fibrillation and heart failure.
