1. Introduction
Physical frailty is a clinical syndrome marked by a measurable decline in muscle strength, mobility, balance, and endurance that increases vulnerability to falls, dependency, hospitalization, and mortality. It is most commonly defined using the Fried frailty phenotype, which includes five components: unintentional weight loss, self-reported exhaustion, weakness (grip strength), slow walking speed, and low levels of physical activity [
1].
Japan is is considered the fastest-aging nation in the world. It faces a significant burden of physical frailty. In 2024, over 28.9% of its population was older than 65 years, with projections suggesting that this number will increase to over 35% by the year 2040 [
2]. A separate survey reported that, in 2012, approximately 7.4% of community-dwelling older adults (65+ years old) were physically frail, while nearly 48.1% were pre-frail [
3]. Age-stratified data revealed frailty rates rising from 1.9% (ages 65–69) to 35.1% (ages 85+), with no significant sex difference (8.1% women vs. 7.6% men) [
3]. A national survey in 2012 found even higher estimates: 8.7% frail and 40.8% pre-frail among 2206 Japanese adults older than 65 years [
4].
Meta-analyses for 2012–2017 indicated a slight decline in frailty prevalence, from 7.0% to 5.3%, suggesting modest improvements [
5]. However, the percentage of pre-frail individuals remained high, indicating a substantial at-risk population. In Japan, physical infirmity has resulted in detrimental effects on both the individual and society. Clinically, it results in a higher rate of hospitalization falls, and a lower standard of living. While Japan’s dependency ratio keeps rising as the workforce declines, the nation faces challenges from an aging and feeble population that might strain family care givers, overburden healthcare systems, and increase long-term care expenditures.
Frailty is increasingly understood as a multidimensional clinical syndrome that extends beyond physical decline to include psychological and social dimensions. As Gobbens et al. [
6] emphasize, frailty should be viewed holistically, encompassing physical impairments (such as muscle weakness, reduced mobility, and balance issues), cognitive or emotional vulnerabilities, and social disengagement. Among these domains, physical frailty is the most objectively measurable, characterized by criteria such as diminished grip strength, slowed gait, low endurance, and reduced balance, popularized by the Fried phenotype [
1]. Psychological frailty includes aspects such as cognitive decline or depression, while social frailty involves isolation or lack of support systems. Although these domains overlap, they are distinct and require different assessment strategies.
This study focuses on physical frailty, as it is the most tangible through functional performance testing and aligns perfectly with sensor-based AI-driven assessment methods. By focusing on physical performance through depth and motion data, the proposed system enables automated, real-time, and reproducible measurements, addressing the shortcomings of manual assessments in geriatric screening.
Recent years have witnessed significant progress in non-invasive, sensor-based frailty assessment, particularly using vision and depth sensors. A kinematic evaluation of sit-to-stand, Timed Up and Go (TUG), and stepping tasks achieved strong reliability and clinical agreement, demonstrating the effectiveness of vision-based systems in tracking functional mobility [
7]. In [
8], a frailty classifier was proposed that can extract skeletal data across multiple tasks and uses machine learning (ML) to classify frailty levels. In a Parkinson’s disease cohort, kinematic metrics captured via Kinect and processed through ML models identified pre-frailty, with the AUC reaching 0.94 for combined limb features [
9]. Sensor-based wearable devices, such as inertial measurement units (IMUs), integrated canes, or pressure-sensing insoles, combined with ML have achieved robust performance in physical frailty detection, with area under the ROC curve (AUC) values between 0.80 and 0.92. For instance, a study using digital insoles during the Timed Up and Go (TUG) Test reported excellent AUCs of 0.801–0.919 for identifying frailty in an orthopedic elderly cohort [
10,
11]. Another study utilizing plantar-pressure insoles classified frailty effectively using features like pressure wavelets during standing and walking [
12].
Despite increasing adoption of sensor-based approaches, current frailty assessment systems remain limited in scope and practicality. Most existing methods target individual tests—such as the Timed Up and Go (TUG) Test, Walking Speed Test, or Grip Strength Test—rather than offering a unified framework. Many studies rely on wearable IMUs or pressure-sensing insoles, which, while accurate, require proper placement, charging, and user compliance, making them less feasible for routine screening of older adults. Vision-based systems are more user-friendly and contactless but typically depend on handcrafted thresholds or partial automation and often lack robust, test-specific ML models. Additionally, these systems are rarely validated across multiple frailty domains or optimized for real-time operation.
To address these gaps, we propose a comprehensive and fully automated platform that uses a single vision sensor to perform all six standard physical frailty assessments. Depth and skeletal data are captured, segmented, and processed into kinematic features, which are fed into task-specific ML models trained for both classification and performance estimation. Our system achieves 98–100% classification accuracy with clinician-annotated ground truths, outperforming existing vision-based and wearable-based benchmarks.
In this study, six clinically validated physical tests are combined into a single, completely automated, contactless framework. To the best of our knowledge, this is the first study that provides an end-to-end vision-based physical frailty assessment system. Our approach allows both frailty classification and continuous performance scoring by capturing depth and skeletal data in real time, extracting a comprehensive set of kinematic and temporal features. We have developed specific machine learning models for each clinical test, in contrast to previous approaches, which focused on individual tasks or relied on wearable sensors. The system provides real-time feedback without requiring wearable technology or manual input, running inference in less than 50 ms. In all six clinical tests, the models achieved consistently high accuracy ranging from 98% to 100% on both training and testing sets, with no indication of overfitting. Stratified splits and cross-validation ensured balanced class distributions, and consistent performance across two independent datasets (Japan: 268 participants; Kyrgyzstan: 300 participants) further confirms the models’ generalization. In this study, we make the following contributions:
Development of a fully automated, contactless physical frailty assessment system using a single vision sensor.
Integration of six clinically validated physical frailty tests into a single unified platform. These tests include the Grip Strength (GS) Test, Seated Forward Bend (SFB) Test, Functional Reach Test (FRT), Timed Up and Go (TUG) Test, Standing on One Leg With Eyes Open (SOOLWEO) Test, and Walking Speed Test.
Real-time data acquisition using skeletal tracking and depth sensing, eliminating the need for wearable devices or manual intervention.
Development of test-specific machine learning models to accurately classify frailty levels based on performance metrics. These models achieved 98–100% classification accuracy across all models, indicating robust reliability.
The remainder of this paper is structured as follows:
Section 2 presents a review of the recent literature on frailty assessment methods.
Section 3 outlines the methodology, including the design of the vision-based system, and provides a detailed description of the six clinical tests for the assessment of physical frailty.
Section 4 presents the results of the test executions and the evaluation of the ML models.
Section 5 discusses the findings in the context of previous studies and implications for clinical practice. Finally,
Section 6 provides the conclusion of this study and outlines future directions.
2. Literature Review
Physical frailty, characterized by reduced strength, balance, and mobility, is a major predictor of falls, hospitalization, and mortality in older adults. To address the growing need for early detection and scalable interventions, researchers have explored technology-driven approaches that replace manual subjective assessments with objective, automated systems. In particular, sensor-based methods, ranging from wearable inertial units (IMUs) and pressure-sensing insoles to RGB and depth cameras, have gained traction for assessing performance during standardized tests such as the Timed Up and Go (TUG) Test, Walking Speed Test, and Grip Strength Test. Moreover, machine learning (ML) has been used to classify frailty or predict clinical scores from extracted features. However, despite this progress, existing solutions often suffer from limited task coverage, sensor dependency, or handcrafted decision rules. This section reviews recent (2022–2025) high-impact studies on automated frailty assessment, highlighting their methodologies, outcomes, and critical limitations, which shaped the research gap addressed in this work.
Recent advances in wearable sensor-based frailty assessment have heavily relied on IMUs, pressure insoles, accelerometers, and smartwatches. Amjad et al. reviewed the promise and challenges of using IMU-derived gait features with ML and deep learning (DL) models for frailty detection [
13]. Arshad et al. and Osuka et al. further showed that spectrogram-based deep Convolutional Neural Networks (CNNs) on IMU signals can classify frailty stages with accuracies of 85–97% [
14]. Insole-based systems by Benson et al. and Kraus et al. achieved high discrimination using pressure data during TUG and balance tests, yet remain limited to lower-limb measures [
11]. Another innovative instrument is the IMU-embedded cane, which achieved approximately 79% accuracy and an AUC of approximately 0.82 using decision-tree analysis [
15]. In clinical populations, wrist-worn accelerometers have also shown promise. Hodges et al. used activity metrics in hemodialysis patients to predict frailty status with an AUC of up to 0.80 [
16], while Arrué et al. combined Fitbit-based upper-extremity tests and heart-rate variability to detect frailty [
17]. A comparison of traditional ML vs. DL for raw IMU data reinforced the added value of deep learning [
18]. Meanwhile, broader surveys highlighted trends and gaps in wearable frailty detection, and the Otago exercise monitoring work shows that even rehab compliance can be tracked through a single waist IMU [
19]. These studies underscore a pattern wherein high accuracy is achievable, but sensor placement, calibration, device compliance, and the focus on single tasks or body regions limit real-world scalability and task coverage.
A range of vision-based and ML-driven systems have been developed for contactless frailty and fall risk assessment, but most of them suffer from a narrow scope or limited practicality. Akbari et al. [
8] explored vision-derived skeletal features in gait and functional tasks (for example, arm curls and sit-to-stand) in 787 elderly participants, reaching approximately 97.5% accuracy, although the setup relied on offline analysis in controlled lab environments and omitted grip and reach measurements. A similar setup, Kinect stepping tests [
20], achieved an AUC of 0.72 in frailty screening but focused only on single-task balance assessment. Kim et al. [
21] developed a multi-factorial fall risk assessment system using a low-cost markerless scheme to analyze the movement and posture of older adults. The system applied a Random Forest classifier in real-world assessments involving 102 participants and achieved an overall classification accuracy of 84.7%. Despite these promising results, the system has certain limitations as it was not designed for real-time feedback and only targets fall risk—not comprehensive frailty profiling involving strength, mobility, or flexibility tests. Sobrino-Santos et al. [
22] proposed a vision-based pilot system for lower-body function, but it lacks real-time ML-based frailty scoring and ignores upper-body metrics like grip strength. Moreover, home-care systems show only moderate validity for forward reach (r = 0.484) and walking speed (r = 0.493), reflecting the depth-tracking inaccuracies in these domains [
7]. Liu et al. [
23] used deep CNNs (AlexNet/VGG16) on RGB gait videos for frailty detection and achieved an AUC of up to 0.90; however, their model lacks real-time feedback and is highly sensitive to lighting conditions. In another vision-based study, Shu et al. [
24] developed a skeleton–RGB fusion network to recognize the daily activities of the elderly. However, their system was not explicitly designed for standardized frailty assessment, lacks domain-specific ML models, and does not offer real-time classification. Osuka et al. [
20] evaluated a vision-based 20s stepping test on 563 older adults and reported an AUC of 0.72 for frailty detection; however, their system is limited to a single test with no real-time ML classification. Altogether, these studies demonstrate contactless viability but suffer from gaps, including limited test coverage, no real-time ML output, environmental sensitivity, occlusion issues, and lack of upper-body/grip assessments.
Despite advances in automated frailty assessment, most existing systems remain task-specific, focusing on isolated domains like gait, grip strength, or TUG. Other systems rely on wearable devices, RGB cameras, or subjective questionnaires. Even with deep learning on IMU or video signals, many approaches depend on non-scalable hardware, lack real-time processing, and fail to integrate multiple tests meaningfully. This fragmented landscape highlights the need for a unified, contactless, and interpretable solution. To provide a clearer overview of these gaps,
Table 1 summarizes recent representative studies, highlighting their methods, sensor modalities, test coverage, real-time capability, use of ML, and reported performance. As shown, most systems are limited to one or two frailty tests, rely on wearable or offline processing, and lack robust real-time ML-based outputs. Our proposed system addresses these gaps by combining vision-based depth sensing with test-specific machine learning models to deliver real-time, multi-domain frailty profiling.
3. Methodology
The proposed frailty assessment system is a fully automated, non-contact solution built around a single vision sensor. Specifically, the system uses a Microsoft Kinect V2 depth camera, configured with its open-source SDK, which captures both 3-D skeletal and depth data in real time. The system runs on a workstation with Windows 11, an Intel i7 processor, 16 GB RAM, and an NVIDIA GTX 1660 GPU. The back-end framework for test design and skeletal tracking was implemented in Microsoft Visual Studio 2023 using C++14. Machine learning models were developed and trained in Python (Google Colab environment, Python 3.x) and integrated into the pipeline. No third-party pose-estimation libraries such as OpenPose were used, as the Kinect SDK provides native joint tracking of 25 skeletal joints.
The system evaluates six standardized clinical tests: Grip Strength, Seated Forward Bend, Functional Reach, Timed Up and Go (TUG), Walking Speed, and Standing on One Leg. Relevant joint movements are analyzed to extract test-specific parameters such as distance, time, and stability. These parameters are processed using trained machine learning models to classify frailty levels. The results are instantly visualized via a graphical user interface, stored in structured CSV files, and compiled into a comprehensive medical report shared with healthcare professionals for clinical interpretation.
Ground truth labels for all six clinical tests were provided by clinical doctors and subject specialists from Juntendo University, Japan. The annotation of these labels was performed following the standardized clinical thresholds supplied by Juntendo University. This ensured consistency in label assignment across all participant data used for training and evaluation of the machine learning models.
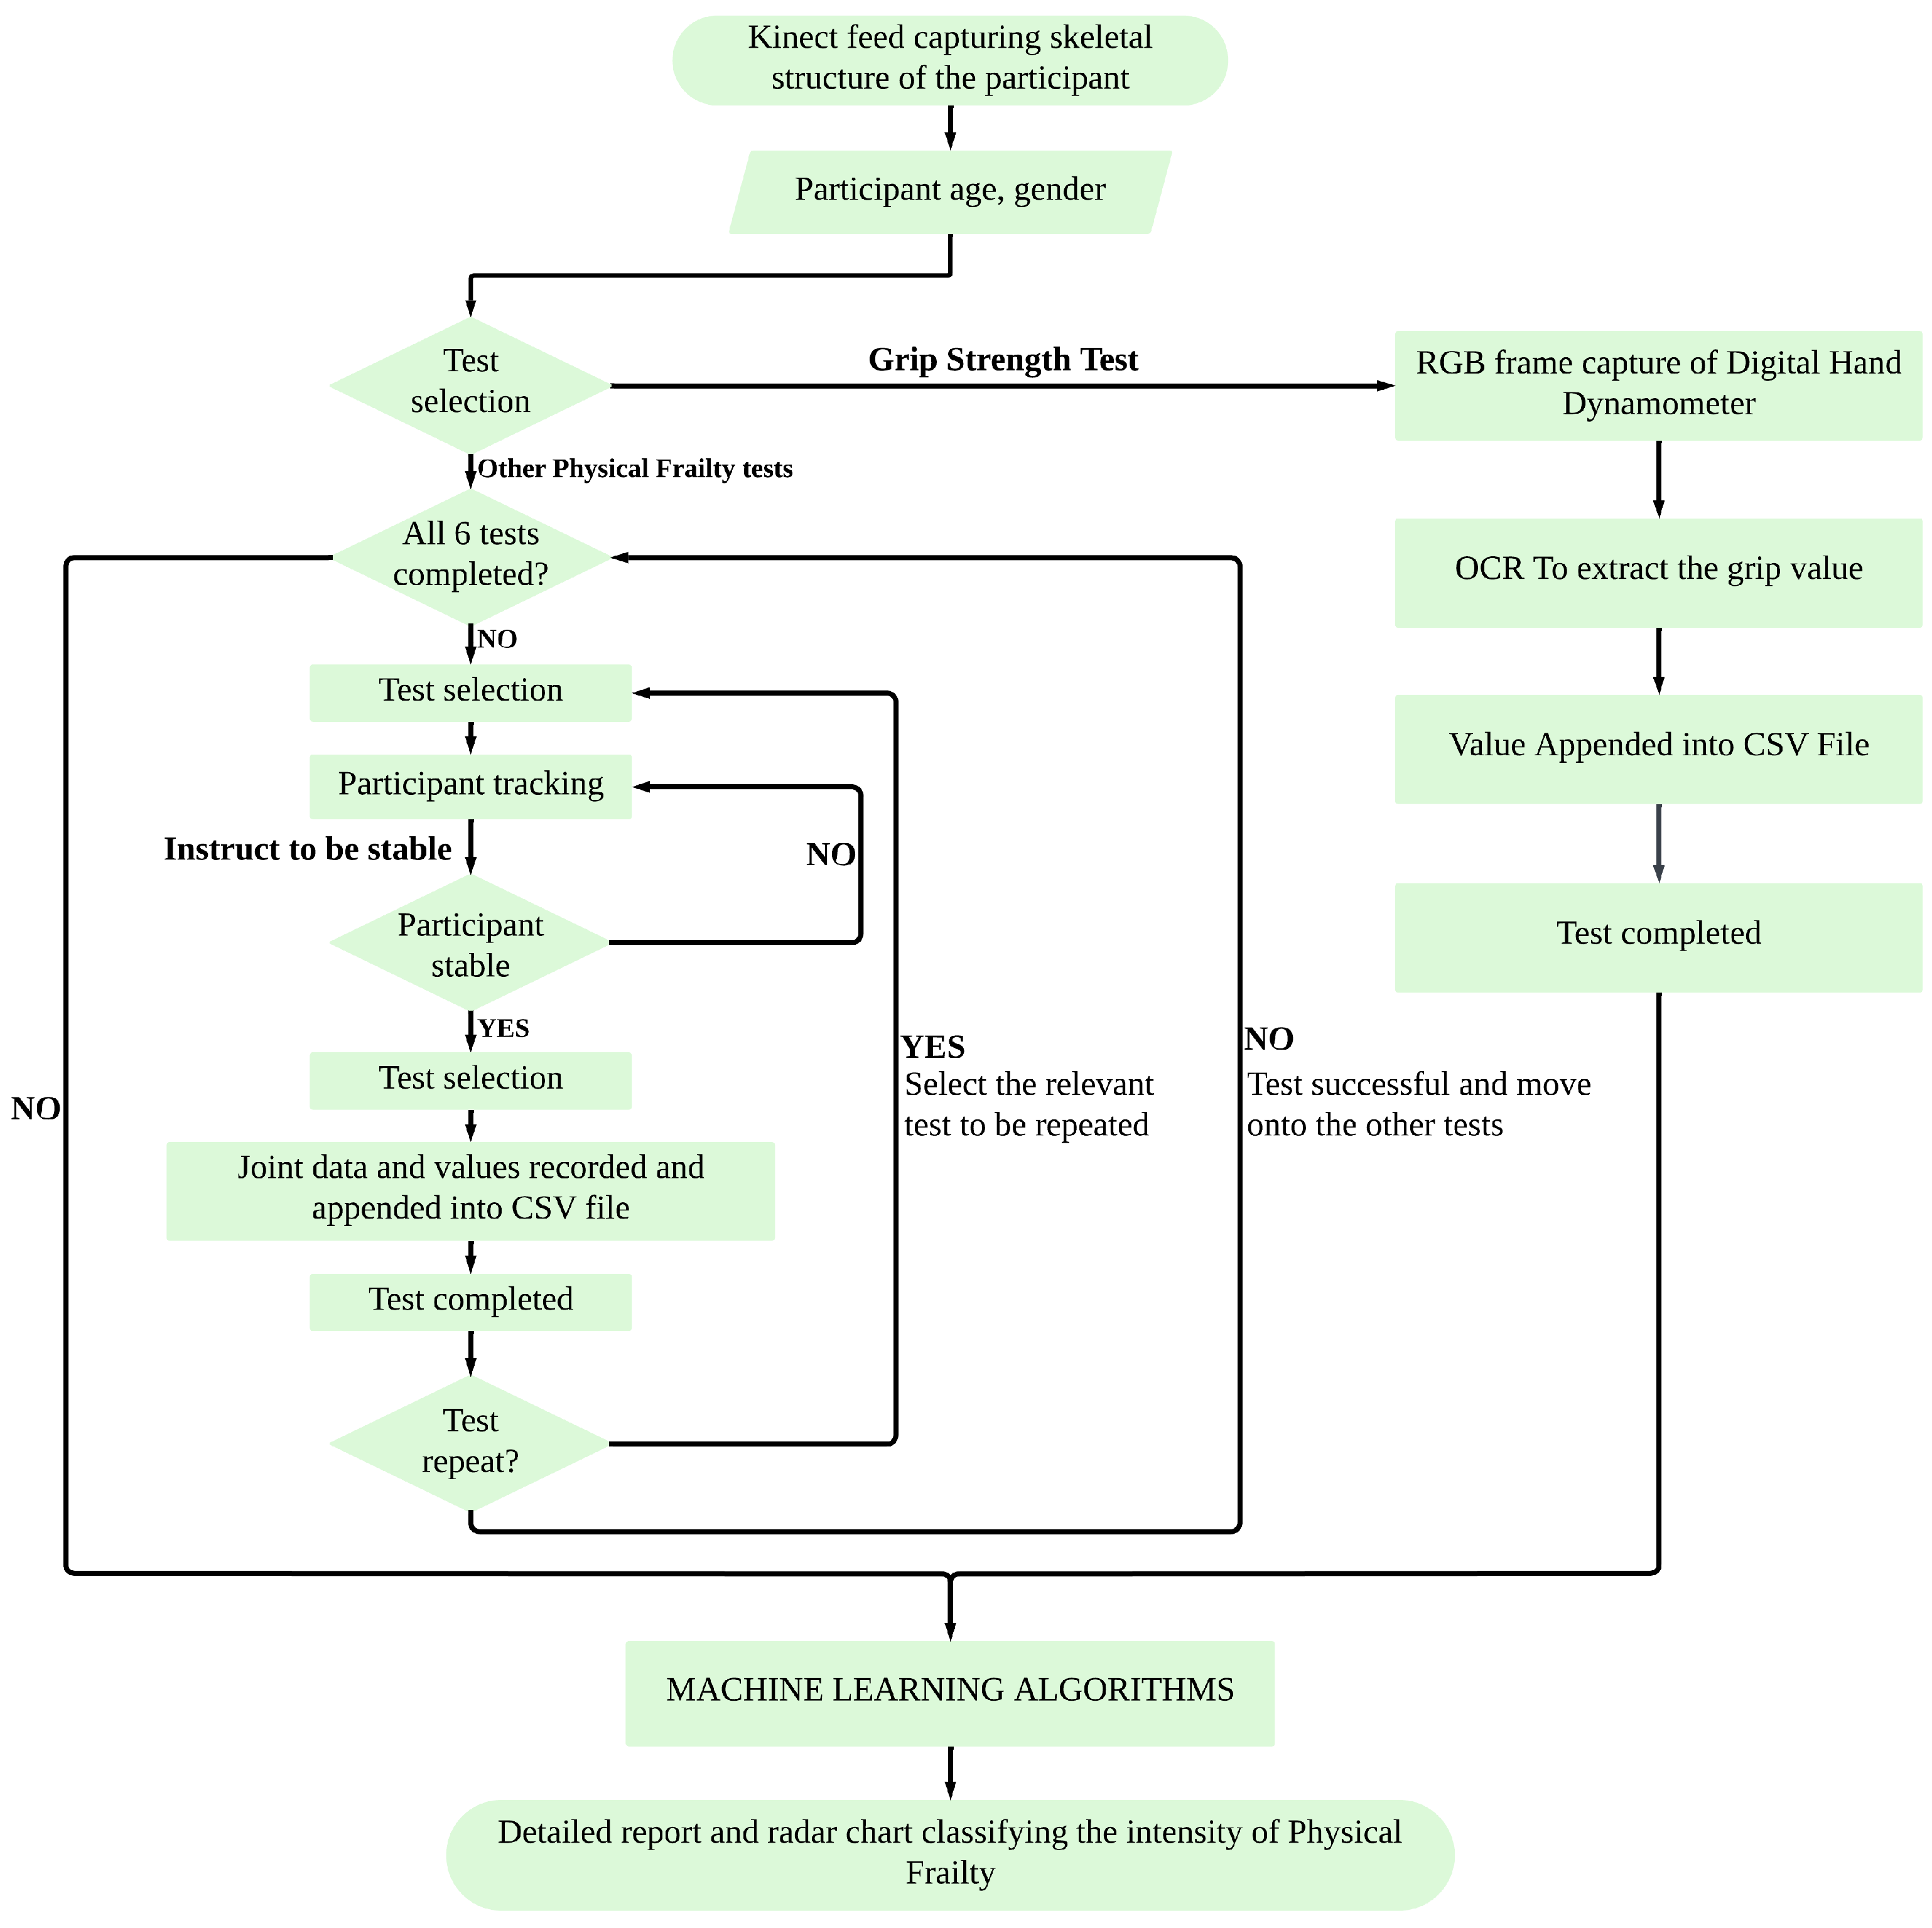
To provide a clear overview of the proposed system architecture, the complete workflow is illustrated in
Figure 1. It outlines the sequence from participant setup and sensor data acquisition to individual test execution, feature extraction, machine learning-based classification, and final result generation. During each test, the system provides real-time feedback to confirm that the participant’s performance is being successfully recorded and meets the test requirements. This feedback is purely monitoring-oriented and does not guide corrective actions. The system can automatically handle real-time data processing, CSV logging, and result visualization. This modular structure enables flexible execution of all six physical frailty tests in an automated and user-guided manner.
The proposed system integrates six standardized physical performance tests, each clinically validated and widely used in frailty research. The Grip Strength Test is a core component of the frailty phenotype defined by Fried et al. [
1], evaluating upper-limb muscle strength and identifying the risk of sarcopenia. Ultimately, grip strength remains one of the most predictive single markers. Roberts et al. [
25] conducted a comprehensive review of grip strength measurement techniques and normative values and highlighted the wide variability in protocols (e.g., dynamometer models, testing posture, trial counts) that hinder comparability across frailty research. This shows the need for standardization to improve frailty screening consistency. Bohannon (2008) validated grip dynamometry as a strong predictor of disability and mortality in older adults [
26].
The Seated Forward Bend Test, adapted from general elderly fitness protocols [
27], assesses lower back and hamstring flexibility. The Functional Reach Test (FRT) was developed by Duncan et al. [
28] to measure dynamic standing balance by recording the maximum forward reach a person can achieve without losing stability. Similarly, Rosa et al. [
29] conducted a systematic review and meta-analysis of 40 studies on the Functional Reach Test, reporting normative reach values (26.6 cm in community-dwelling adults) and highlighting methodological inconsistencies across FRT implementations, which indicate that a comprehensive and detailed system needs to be developed. The Timed Up and Go (TUG) Test, introduced by Podsiadlo and Richardson [
30], evaluates functional mobility and fall risk by timing a participant’s ability to rise from a chair, walk three meters, turn, return, and sit. Gao et al. [
31] established age and sex stratified reference values for the five-repetition chair–stand test in more than 12,000 Chinese older adults, highlighting its utility as a benchmark for lower-limb function. Their results showed significant associations between slower chair–stand times and age, waist circumference, and chronic illnesses, making it a sensitive indicator of physical decline. The Standing on One Leg with Eyes Open Test, commonly used in Japanese clinical screenings, is supported by the normative study conducted by Yamada et al. [
32], which established age- and gender-specific reference values for single-leg standing duration. Finally, the Walking Speed Test is recognized as a strong predictor of frailty and mortality, with Studenski et al. [
33] identifying gait speeds below 1.0 m/s as clinically significant for health risks. Similarly, Middleton et al. [
34] synthesized evidence supporting walking speed as a “functional vital sign”, demonstrating its validity and reliability and linking slower speeds (<0.8 m/s) to a range of adverse outcomes including functional decline, hospitalization, and mortality. Together, these tests span multiple domains of physical health—strength, flexibility, balance, and mobility—forming a comprehensive frailty evaluation framework.
3.1. Grip Strength Test
The Grip Strength Test evaluates the muscular strength of the upper limbs and serves as an important indicator of frailty. Traditionally, this test is performed using a handheld dynamometer, where the participant is instructed to squeeze the device with maximum effort, and the peak force value is recorded.
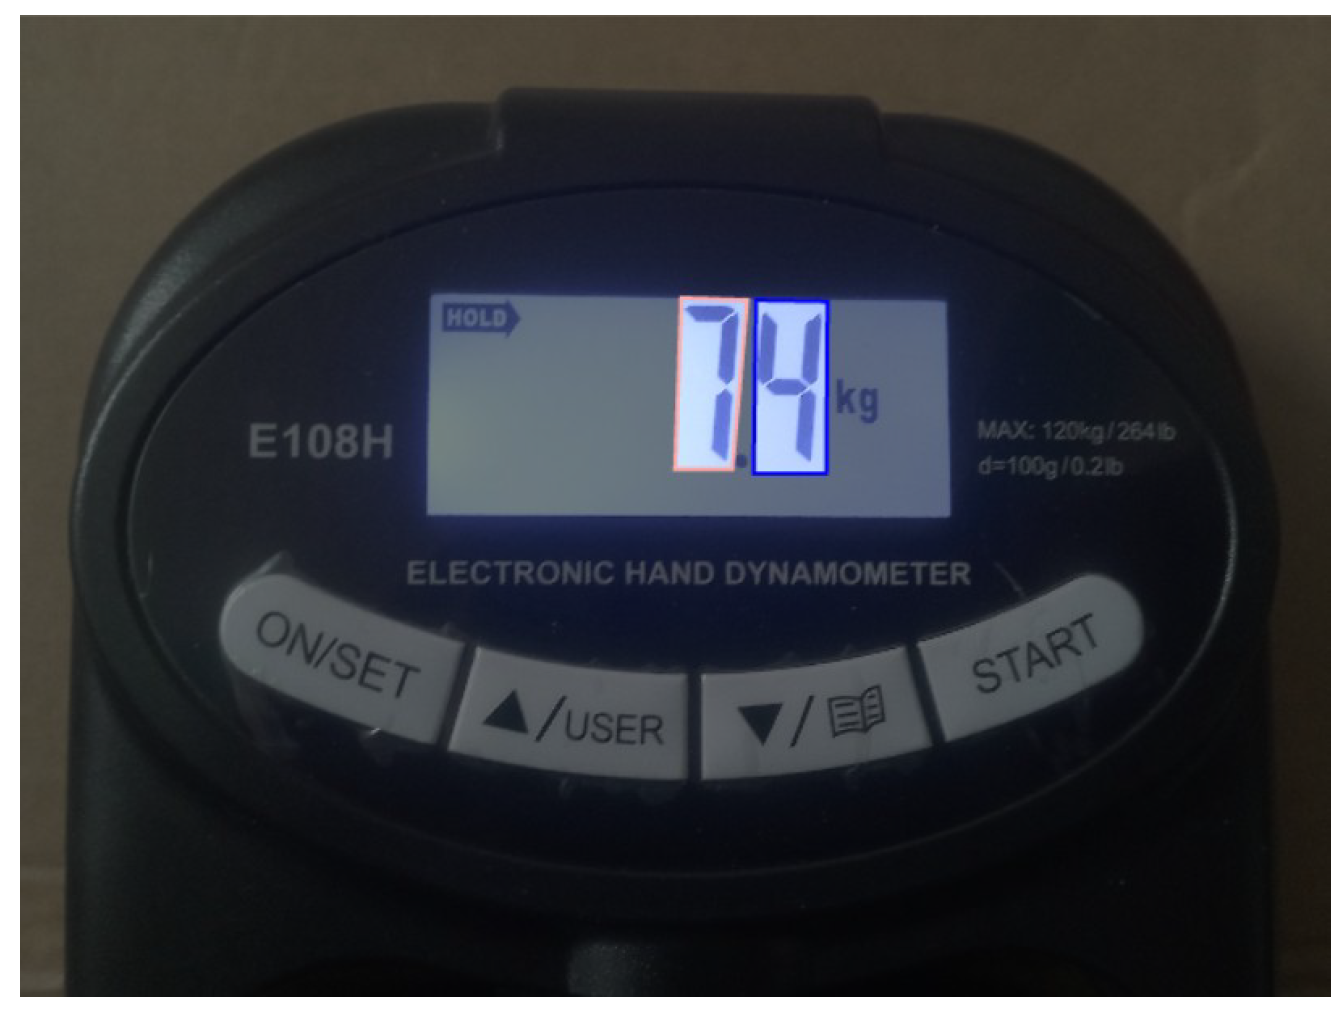
In the proposed system, a digital hand dynamometer with a seven-segment display is used. The Kinect V2 camera captures the live image of the display during the test, and Optical Character Recognition (OCR) is applied to extract the numeric grip strength value in real time. It is important to note that the OCR readings are independent of the skeletal joint data; there is no temporal synchronization required between hand joint tracking and the dynamometer display. The extracted values are automatically recorded in a structured CSV file, compared against standardized age- and gender-based thresholds, and then included in a detailed graphical report for clinical interpretation.
3.2. Seated Forward Bend Test
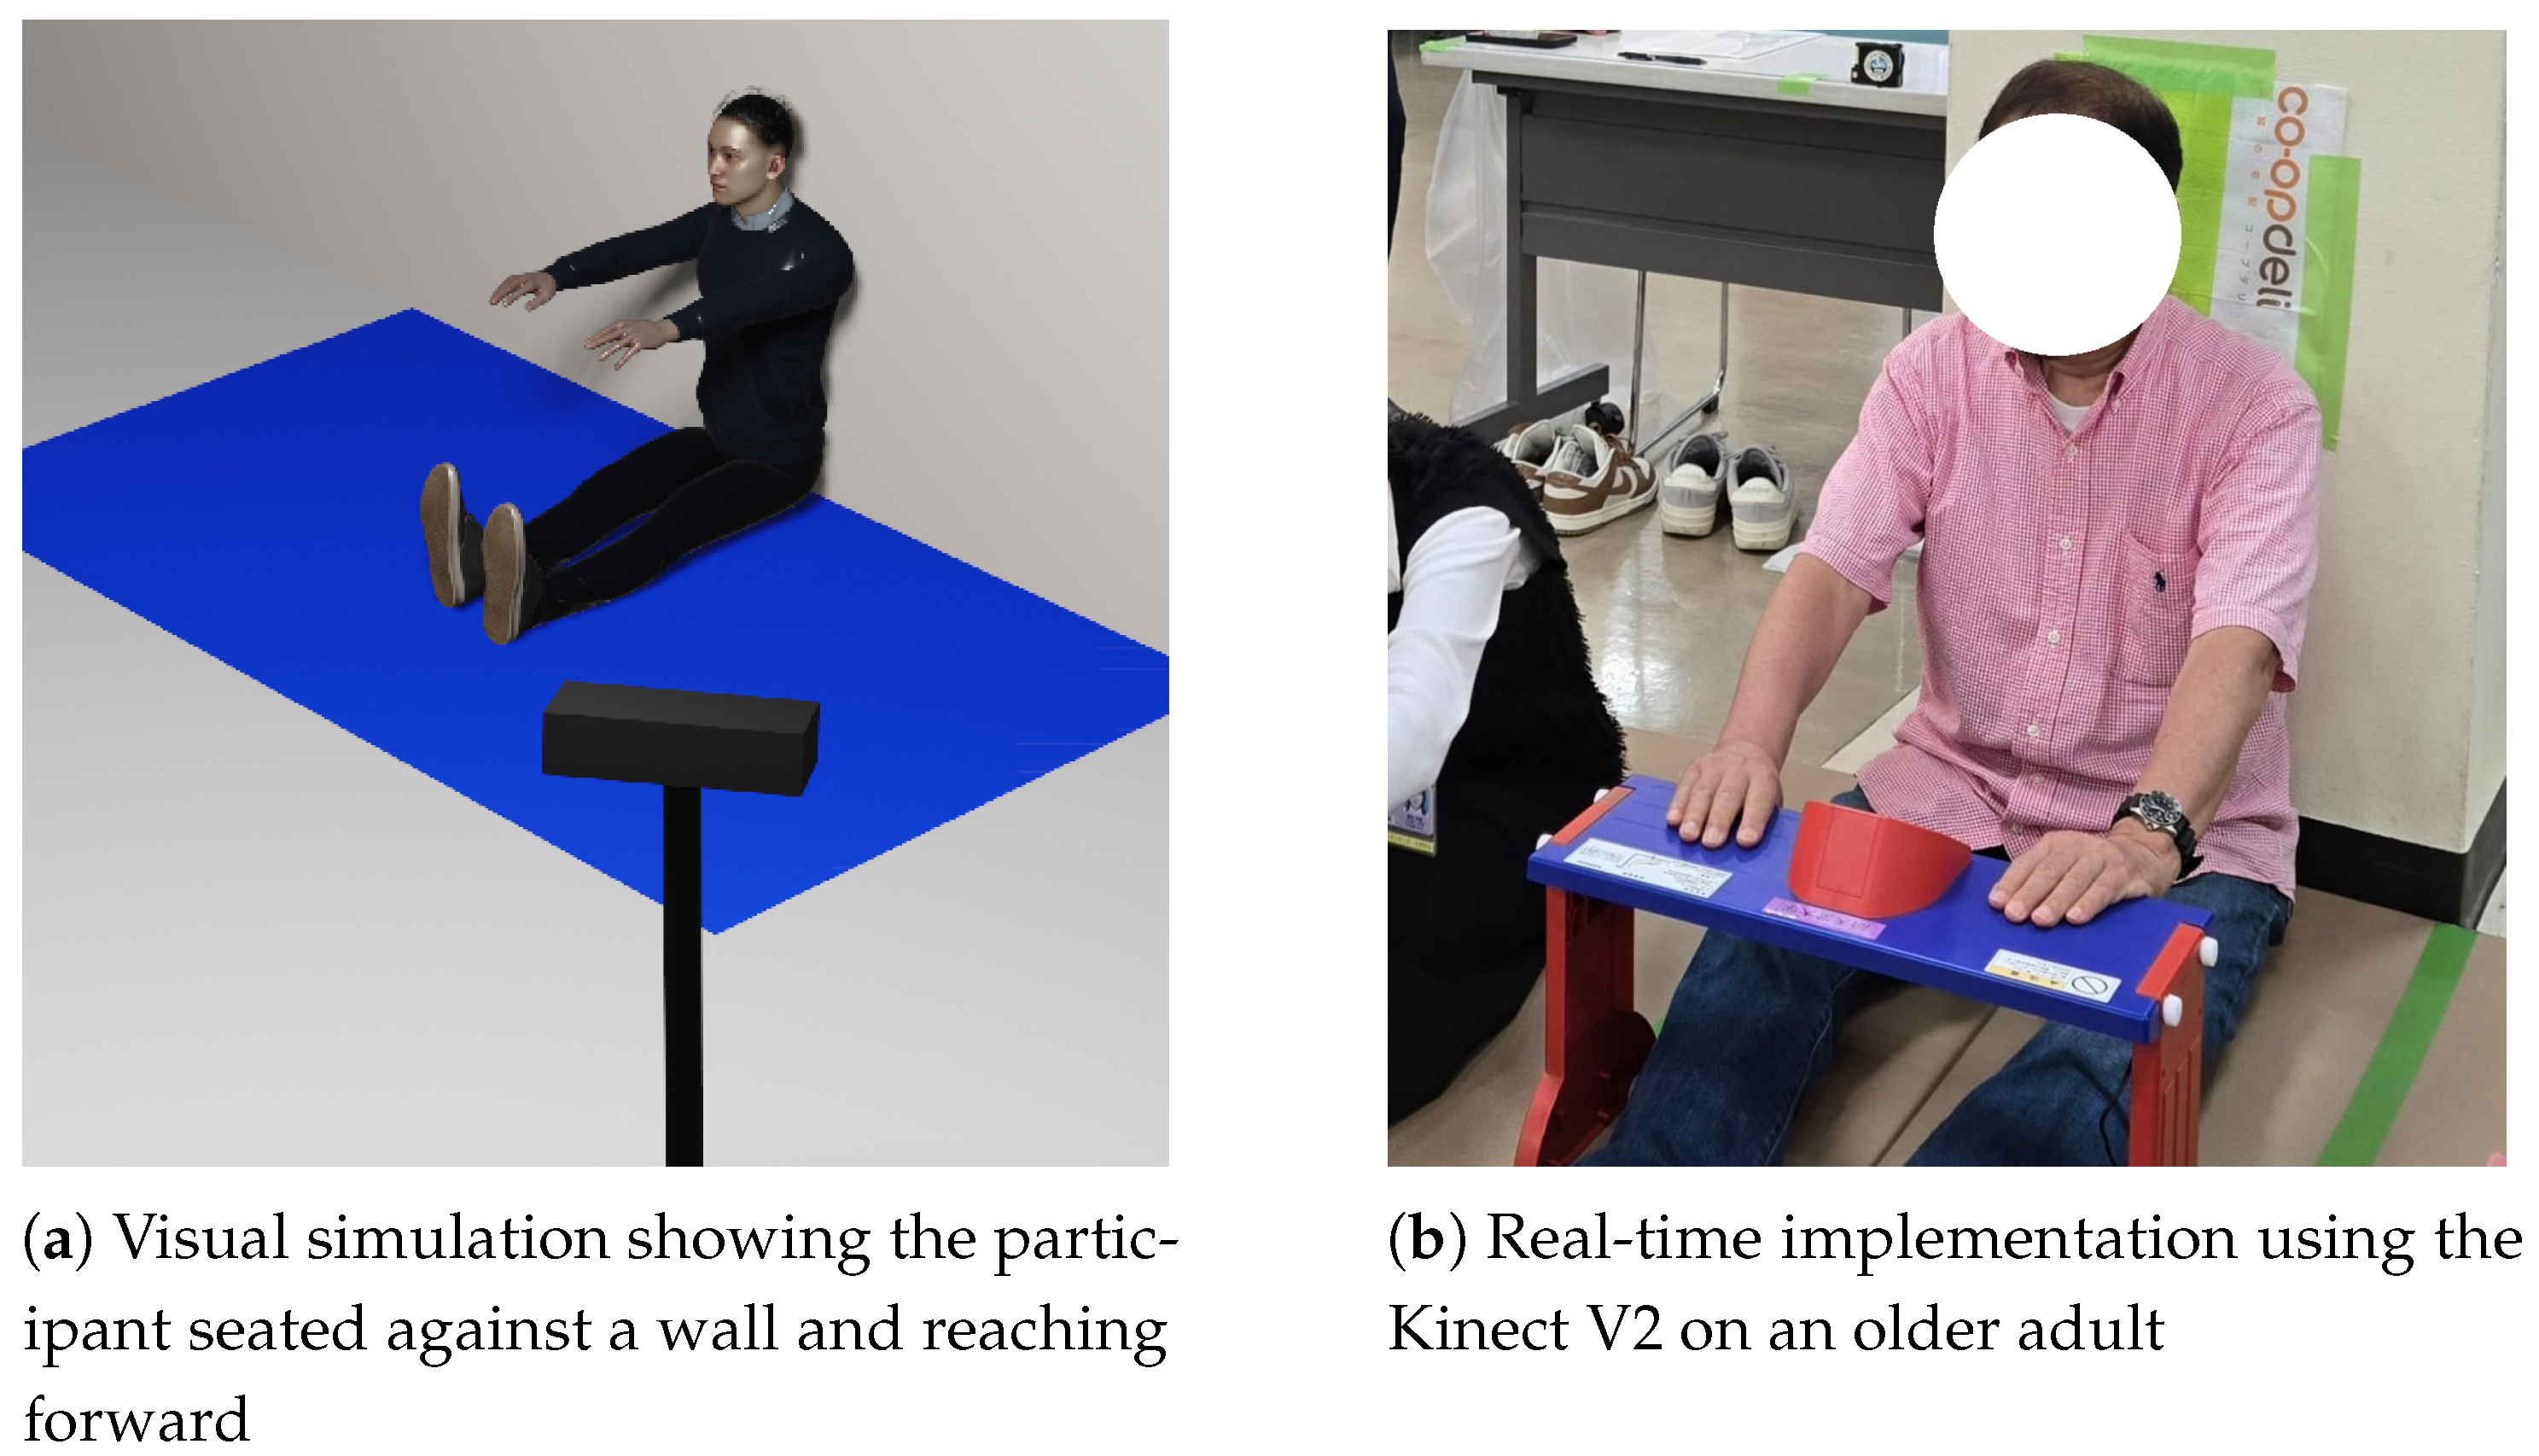
The Seated Forward Bend Test (SFBT) assesses the flexibility of the lower back and hamstring muscles, which are essential for mobility and balance. In the conventional approach, the participant sits on the floor with the legs fully extended and the back straight against a wall. A ruler-based wooden platform is placed in front, and the participant is instructed to stretch forward as far as possible, pushing the ruler without bending the knees or lifting the legs. The maximum distance reached is manually recorded from the scale on the platform.
In the proposed system, once a stable seated posture is detected by the vision sensor, the participant is prompted to raise both arms forward, and the initial hand joint coordinates are recorded automatically. The system then instructs the participant to lean forward to their maximum reach while keeping their feet fixed. The maximum forward displacement of the hands is captured and stored in real time, after which the participant returns to the baseline position to complete the test.
To quantify forward reach, the vision sensor is used to continuously track the hand coordinates throughout the bending motion. The system calculates the instantaneous forward reach distance as the absolute change in the hand’s
x-axis position (relative to its initial raised position), where
t denotes the current time instant during the motion, updated continuously as the system captures data. The distance is measured in centimeters and computed separately for each hand:
where
and
denote the right and left hand’s
x-coordinates at time
t, and
and
are the initial (reference) coordinates when the participant raises both arms.
The system continuously updates the maximum observed reach per hand. Here,
t is continuously updated during the motion, and
and
correspond to the maximum distance values attained at some time
t when the hands reach their furthest positions:
The final test output is determined as the greater of the two, representing the maximum forward reach distance achieved at a specific time
t during the motion:
This final reach distance, , is saved in a CSV file and passed to a machine learning model trained on the seated forward bend parameters. The model classifies the test results, and the prediction is incorporated into the final clinical report. In addition, the result is visualized as one of the axes on a radar chart representing the overall frailty status.
Figure 2a presents a visual simulation of the Seated Forward Bend Test, where the participant is seated against a wall and extends forward to reach the maximum hand displacement.
Figure 2b shows the real-time implementation of the test using the vision sensor on an elderly participant.
3.3. Functional Reach Test
The Functional Reach Test (FRT) is used to evaluate a person’s ability to maintain balance while reaching forward, serving as an indicator of dynamic stability and fall risk. Traditionally, the test is performed by having the participant stand upright next to a mounted ruler or scale, typically affixed to a wall, and extend their arms forward while reaching as far as possible without taking a step. The displacement on the ruler reflects the distance that the person can reach.
In the proposed system, once a stable upright posture is detected, the vision sensor automatically records the baseline coordinates of key joints (hands, elbows, shoulders, Spine-Mid, and Spine-Base). The participant is then instructed to lean forward maximally while keeping their feet fixed, and the system tracks the corresponding changes in joint positions. The maximum forward displacement along the z-axis is computed as the reach distance, which is logged in real time, stored in a CSV file, and passed to the machine learning model for classification. The model’s output is subsequently integrated into the clinical report and visualized on the frailty radar chart.
Figure 3a shows a simulation of the Functional Reach Test, with the participant extending their arms forward as the Kinect V2 tracks joint movement.
Figure 3b depicts the test being performed in real time by an elderly participant. The FRT uses the same computation principle as the SFBT, but measures hand displacement along the
z-axis (forward depth) instead of the
x-axis.
3.4. Timed Up and Go Test
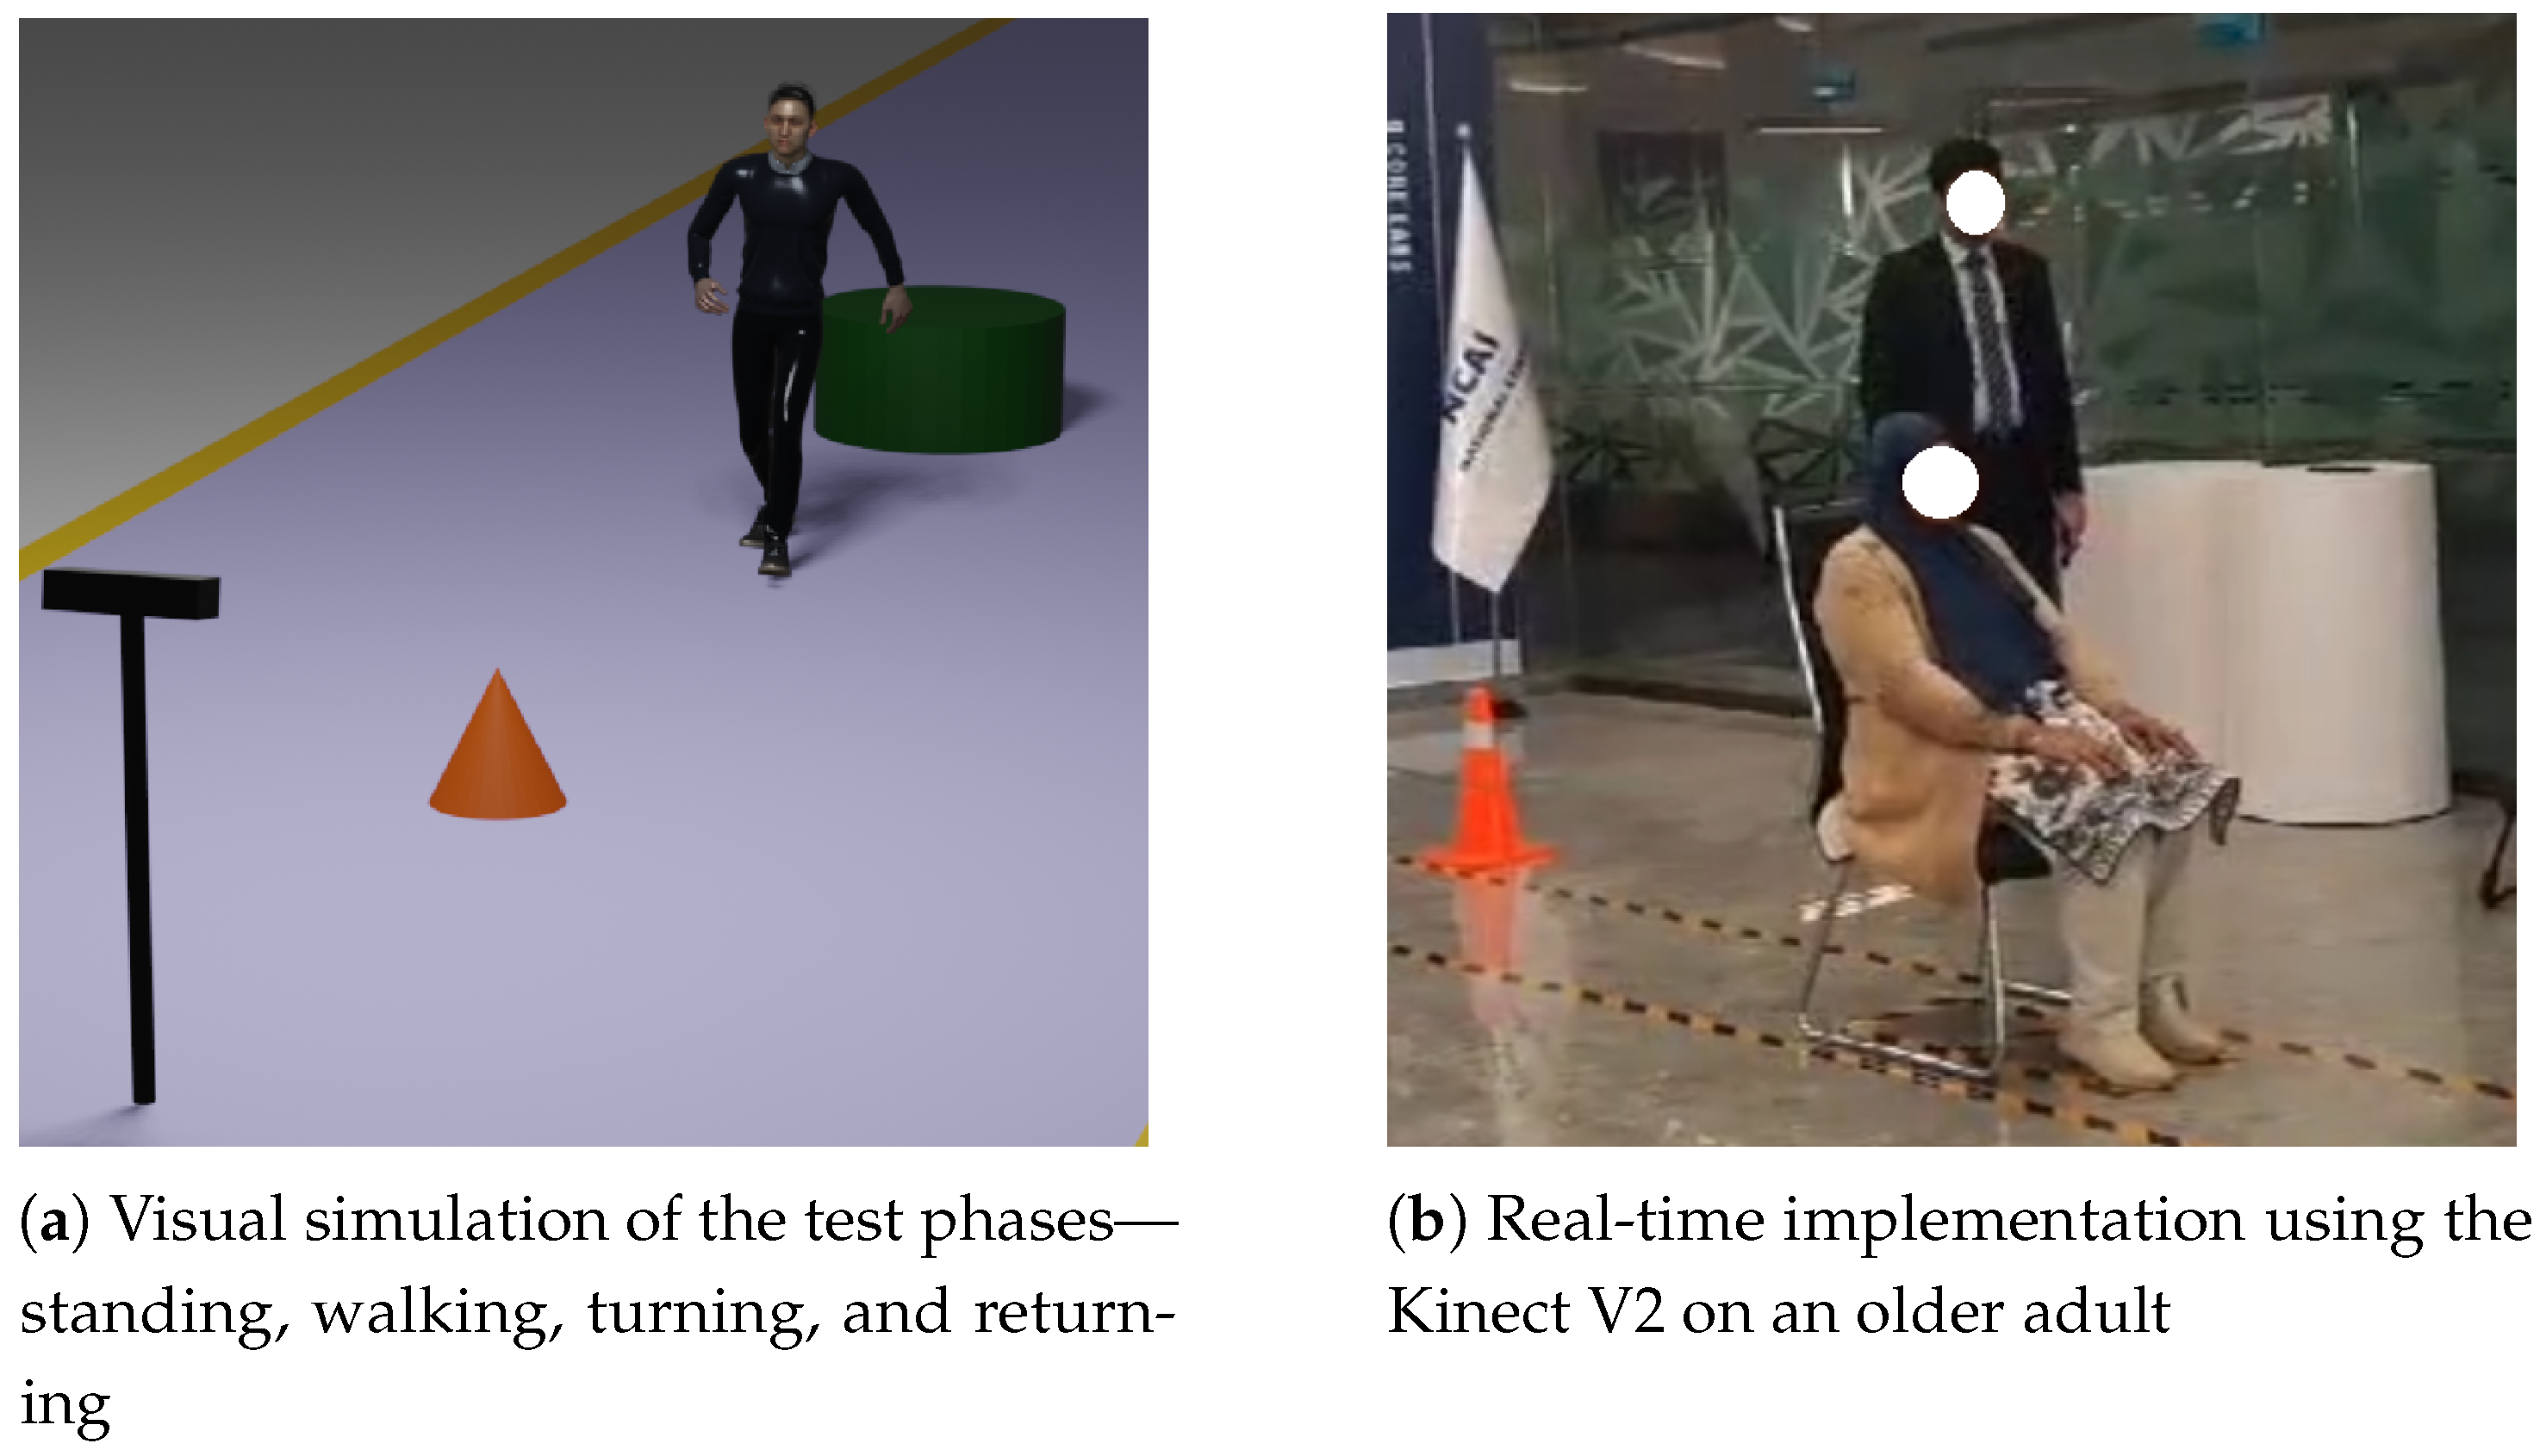
The Timed Up and Go (TUG) Test is a widely used clinical tool to assess the strength, mobility, and fall risk of the lower limbs. In the conventional method, the participant is seated in an armless chair with both hands resting on their thighs. Upon receiving the verbal instruction from the test conductor, the participant stands up without using their hands for support, walks forward for three meters toward a visual marker, turns around, walks back, and sits down again. A stopwatch is used to record the time taken by the participant to move from standing up to sitting back down.
In the proposed system, the participant begins seated in front of the vision sensor. Using skeletal tracking, the system continuously monitors key joints, including the knees, hips, Spine-Base, Spine-Mid, and hands. Once the participant is seated and stable, the system displays a “Test Ready” prompt and instructs the participant to stand. The timer is automatically activated when the knees and hip joints are no longer vertically aligned, indicating that the participant has begun to rise. The participant proceeds to walk three meters and then returns to the initial position. The timer stops as soon as the system detects that the participant has returned to the original seated position—identified by the alignment of the tracked joints matching the baseline position.
The total time taken is computed using the difference between the start and stop timestamps, as expressed by the following equation:
where
is the time when the standing motion is first detected and
is when the return to the seated position is confirmed. The computed duration, i.e., the total time taken, is logged in a CSV file and passed to the machine learning model trained on TUG performance data. The result is included in the final clinical report visualized on the participant’s frailty radar chart.
Figure 4a presents a visual representation of the TUG Test setup, highlighting key movement phases including standing up, walking, turning, and returning to the chair, as captured by the vision sensor.
Figure 4b shows the real-time implementation of the test on an elderly participant.
3.5. Standing on One Leg with Eyes Open Test
The Standing on One Leg with Eyes Open (SOOLWEO) Test is commonly used to evaluate static balance and lower-limb strength. In the traditional method, the participant stands upright and, upon the instructor’s cue, is asked to raise one leg—either forward, backward, or upward—while maintaining balance with eyes open. The timer is started manually when the foot leaves the ground and stopped when it returns. If the participant balances for less than 60 s on the first attempt, the test is repeated with the opposite leg. The best of the two durations is taken as the final result.
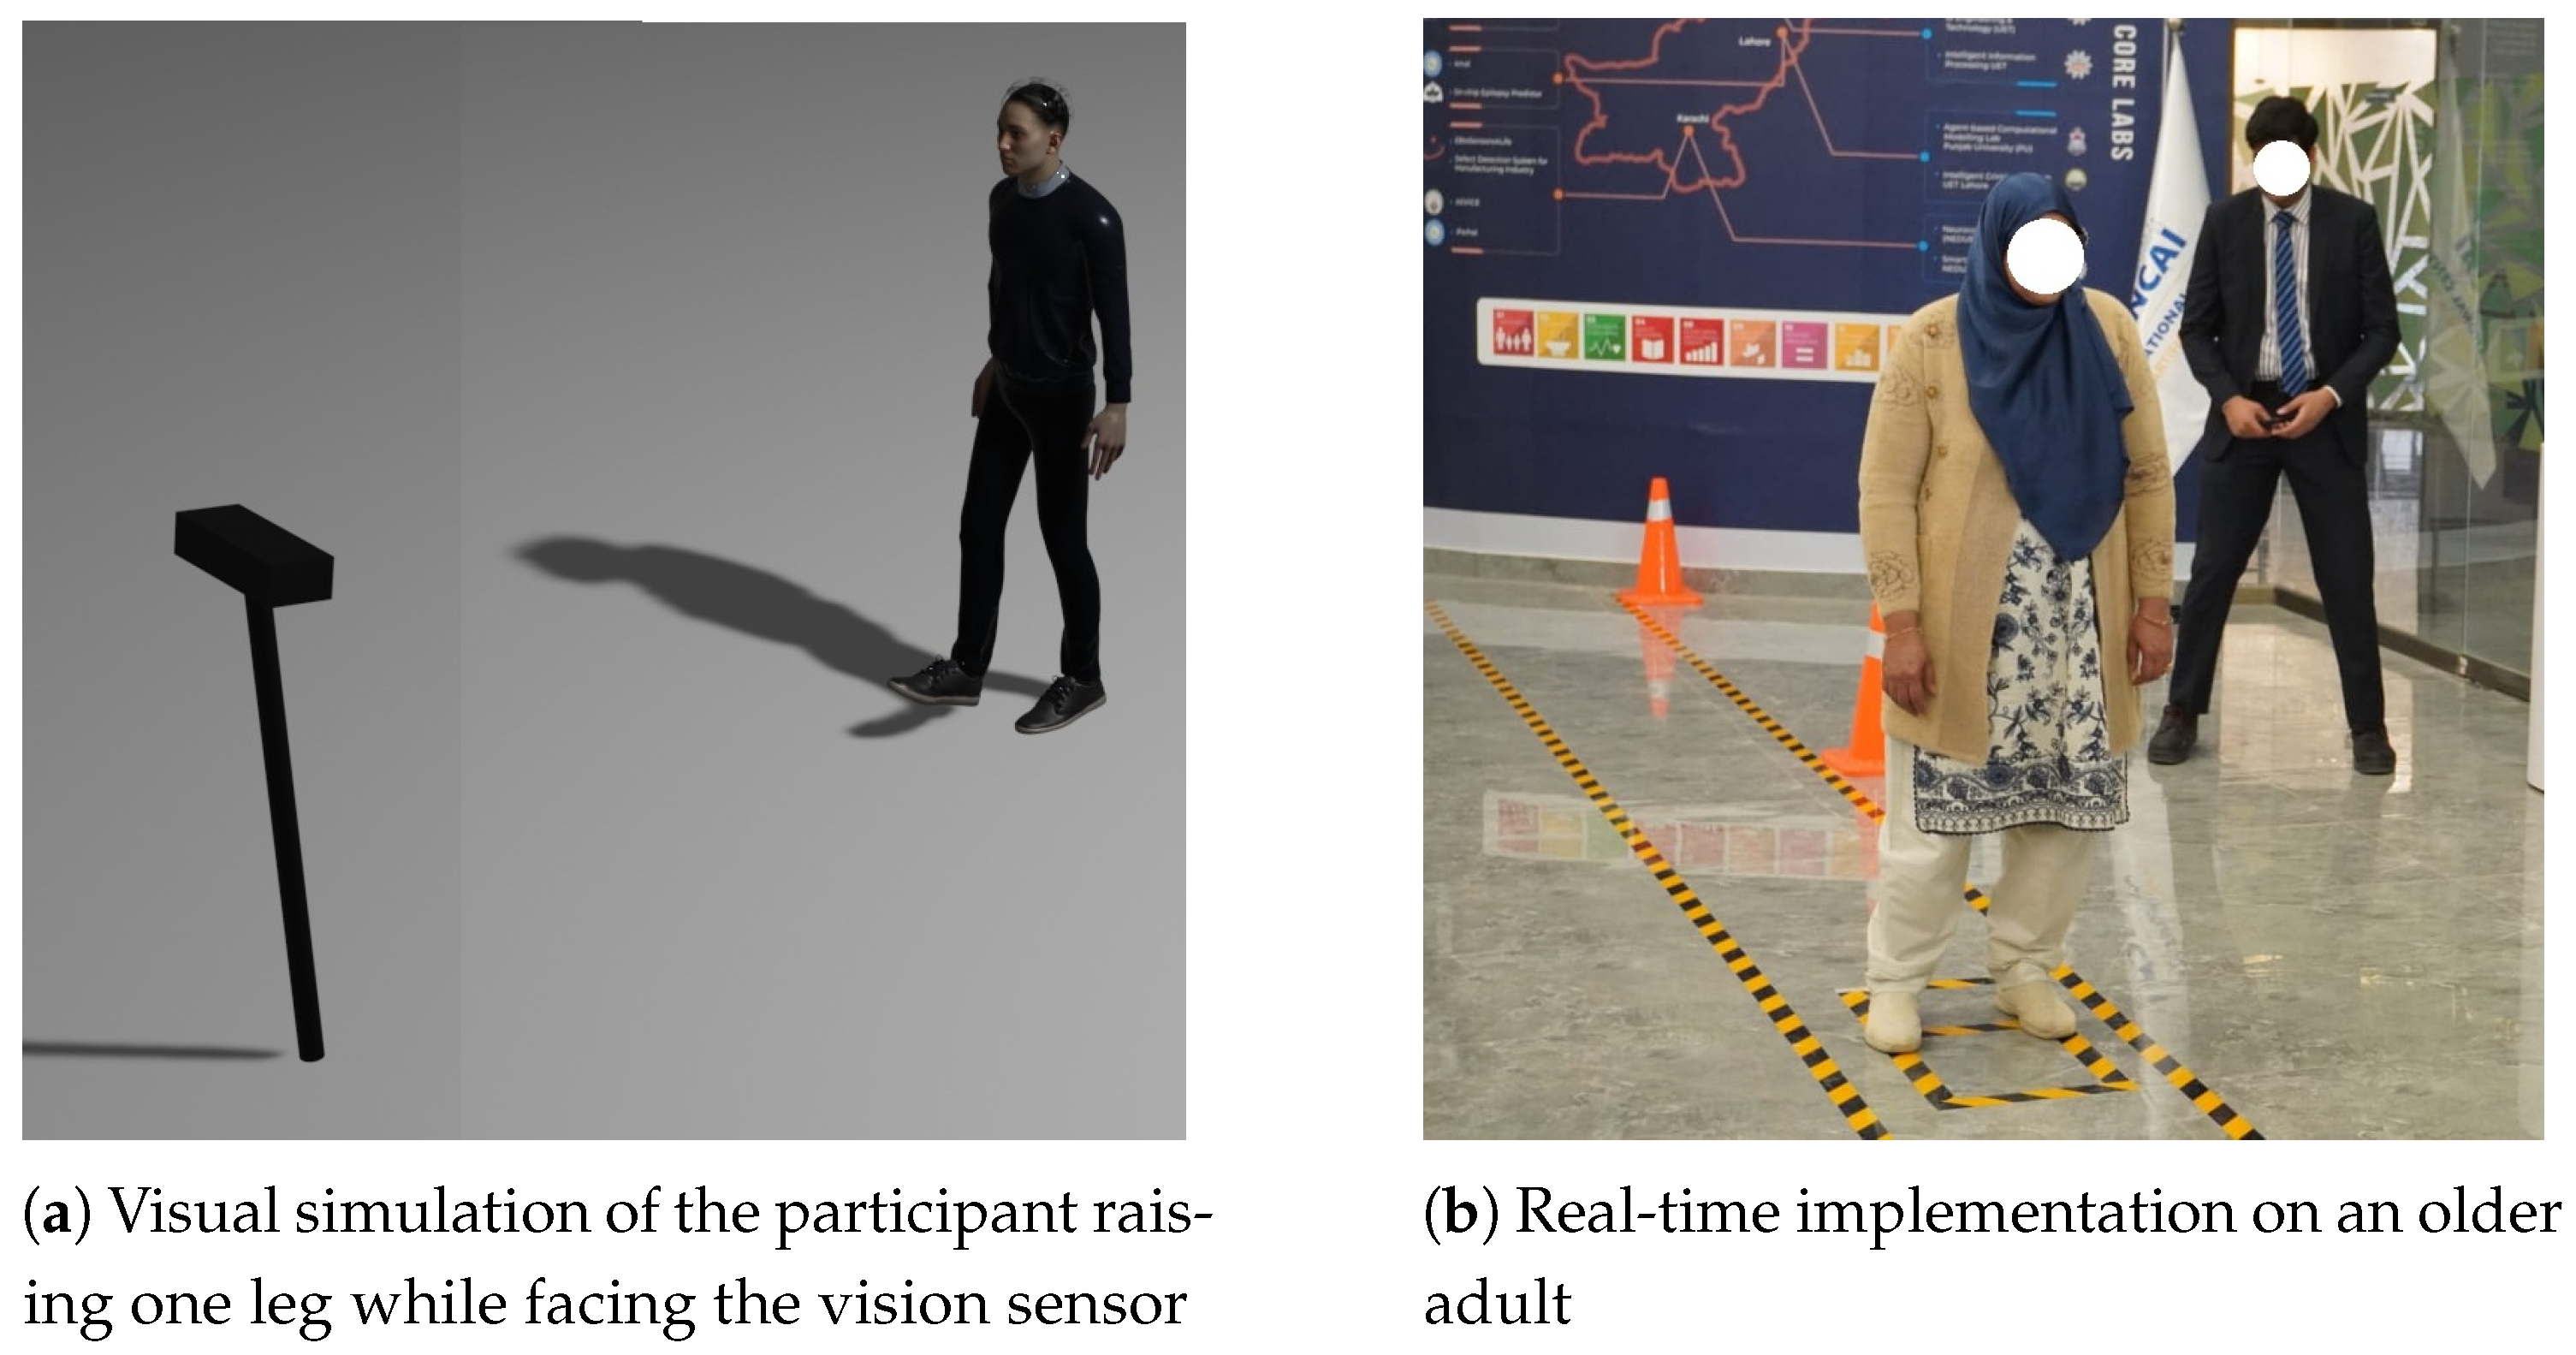
In the proposed system, the participant stands facing the vision sensor. Once a stable standing posture is detected using the coordinates of the foot, knee, and spinal joints, the system prompts the participant to raise the right leg. The test begins automatically when a significant positional change is detected in the foot and knee joints, regardless of the direction of leg lift. The timer continues as long as the foot remains elevated. A raised foot is identified when the
y-coordinate deviates from the baseline beyond the minimum detectable limit of the camera (0.05 m). However, to ensure robustness against sensor noise and minor jitter, a practical threshold of 0.1 m was used in the implementation:
The balance time is calculated using the difference between the foot-down and foot-lift timestamps, as shown below:
where
marks the moment the foot leaves the ground and
corresponds to the time when it returns. Simply put, when the foot returns to the ground, the timer stops. If the duration is less than 60 s, the system instructs the participant to raise the left leg, and the same logic is applied. Once both attempts are complete, the highest of the two balance times is saved in the CSV file and passed to the machine learning model trained on SOOLWEO parameters. The result is then reflected in the final frailty report and plotted on the participant’s radar chart for clinical interpretation.
Figure 5a illustrates a rendered scene of the Standing on One Leg with Eyes Open Test, where the participant maintains balance on one foot while the camera tracks joint positions to calculate the duration of static balance.
Figure 5b shows a real-time implementation of the test with an elderly participant.
3.6. Walking Speed Test
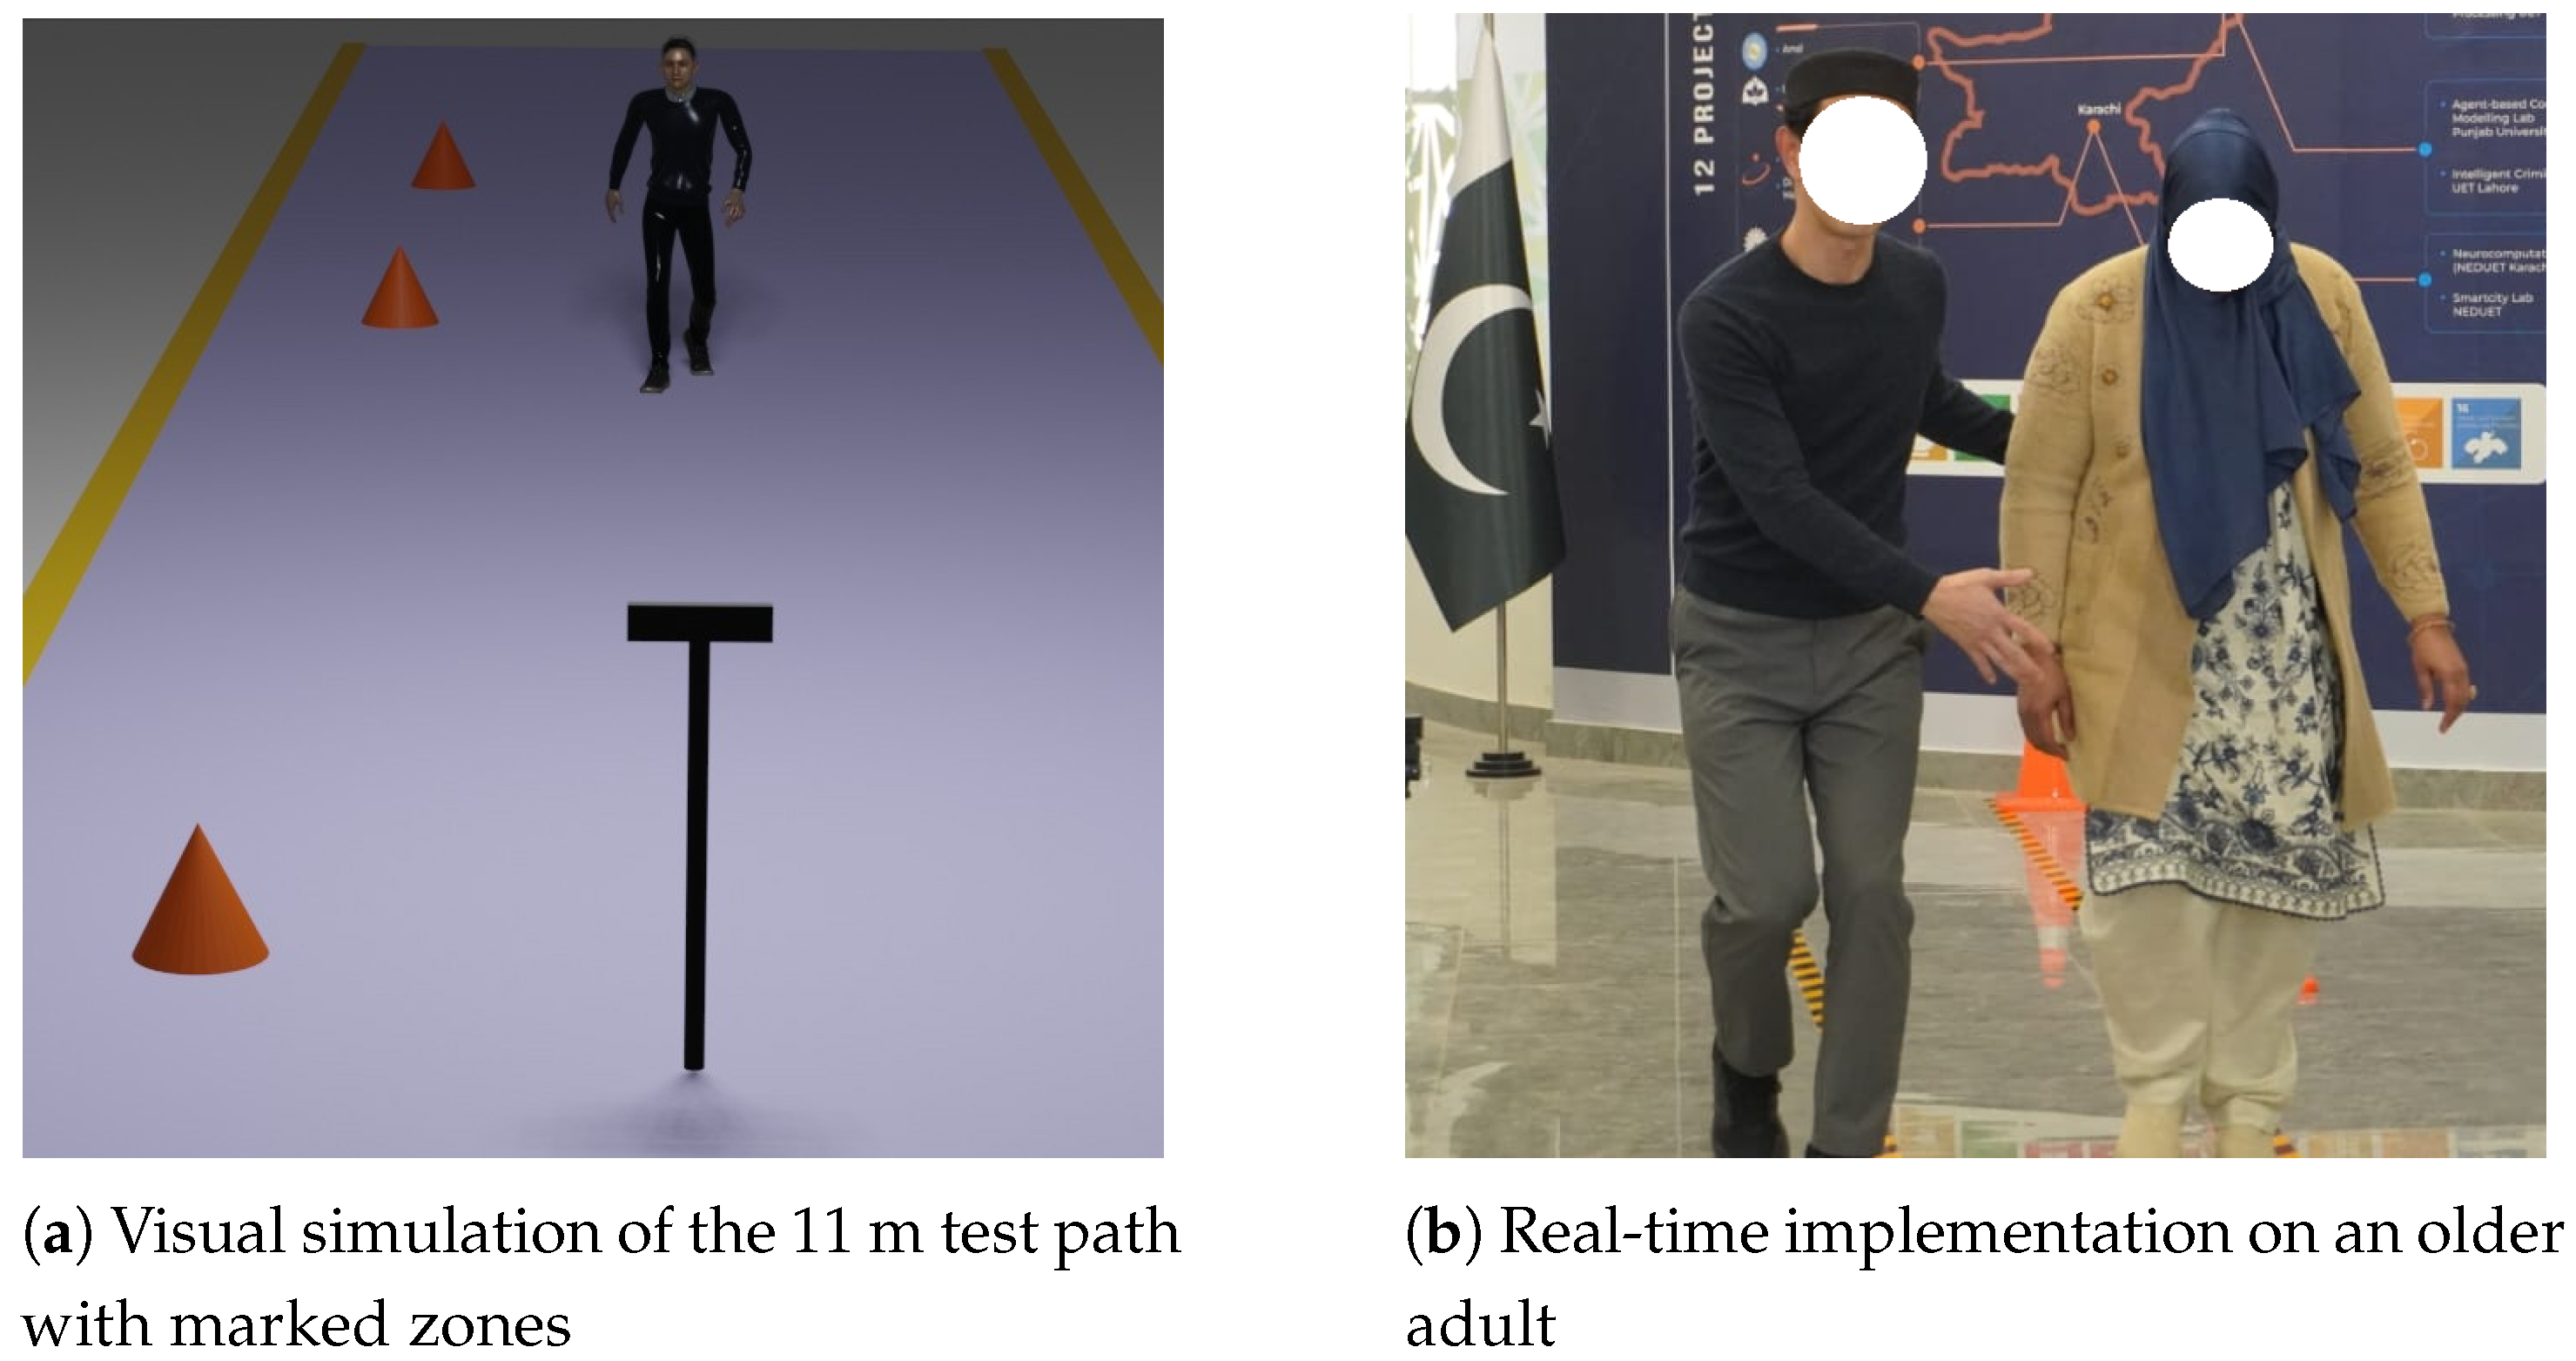
The Walking Speed Test assesses the gait performance of an individual. This is a critical indicator of physical frailty and fall risk. In the traditional method, a total distance of approximately 11 m is marked, where the first and last 3 m serve as acceleration and deceleration zones, respectively. The instructor activates a stopwatch when the participant crosses the 8 m mark and stops it at the 3 m mark, effectively measuring the time taken to walk the middle 5 m segment.
In the proposed system, the participant begins walking from approximately the 11 m mark, facing the vision sensor. The Kinect uses depth data from the Spine-Base and Spine-Mid joints to continuously track the participant’s position. Once the spine joint depth crosses the 8 m threshold, the system automatically starts the timer. As the participant reaches the 3 m mark, the timer is stopped. The final 3 m distance allows the participant to decelerate naturally after the test. The total walking time is computed as follows:
where
and
represent the system timestamps at the start and end of the detected walking interval, respectively. This implementation is independent of stride length and focuses solely on the time taken to traverse the defined 5 m zone. The duration is recorded in a structured CSV file and passed to a machine learning model trained on walking speed data. The result is used in the overall frailty classification and is visualized in the final radar chart included in the clinical report.
Figure 6a presents a visual simulation of the Walking Speed Test setup, illustrating the participant’s movement along the 11 m path with designated acceleration, timed, and deceleration zones.
Figure 6b shows a real-time implementation of the test using the vision sensor on an elderly participant.
To enable automated and interpretable frailty classification, five different machine learning classifiers were trained and evaluated for each of the six physical performance tests using labeled datasets. For every test, the best-performing model was selected based on standard evaluation metrics including precision, recall, accuracy, and F1-score. This resulted in six optimized models—one for each test. All models were implemented in Python using the scikit-learn library, with XGBoost added via its Python package. Default hyperparameters were used for all classifiers to provide a consistent baseline comparison. Data were standardized (zero mean, unit variance), and an 80–20 train–test split was performed on a per-participant basis to prevent data leakage. To ensure robustness, training and evaluation were repeated with multiple random seeds, and mean scores were reported. For imbalanced outcomes, the built-in class_weight = balanced option (Logistic Regression, SVM) and scale_pos_weight (XGBoost) were applied where appropriate.
To ensure robust model evaluation while maintaining class balance, each dataset corresponding to the six clinical tests was randomly split into training and testing subsets using an 80–20 ratio. The training sets were used to optimize the machine learning models, while the testing sets were reserved for independent evaluation of model performance.
Table 2 summarizes the total number of samples per test, the distribution of outcome classes, and the resulting split between training and testing data. This approach ensured that each model was trained on a representative subset of the data while providing an unbiased assessment of predictive accuracy on unseen samples.
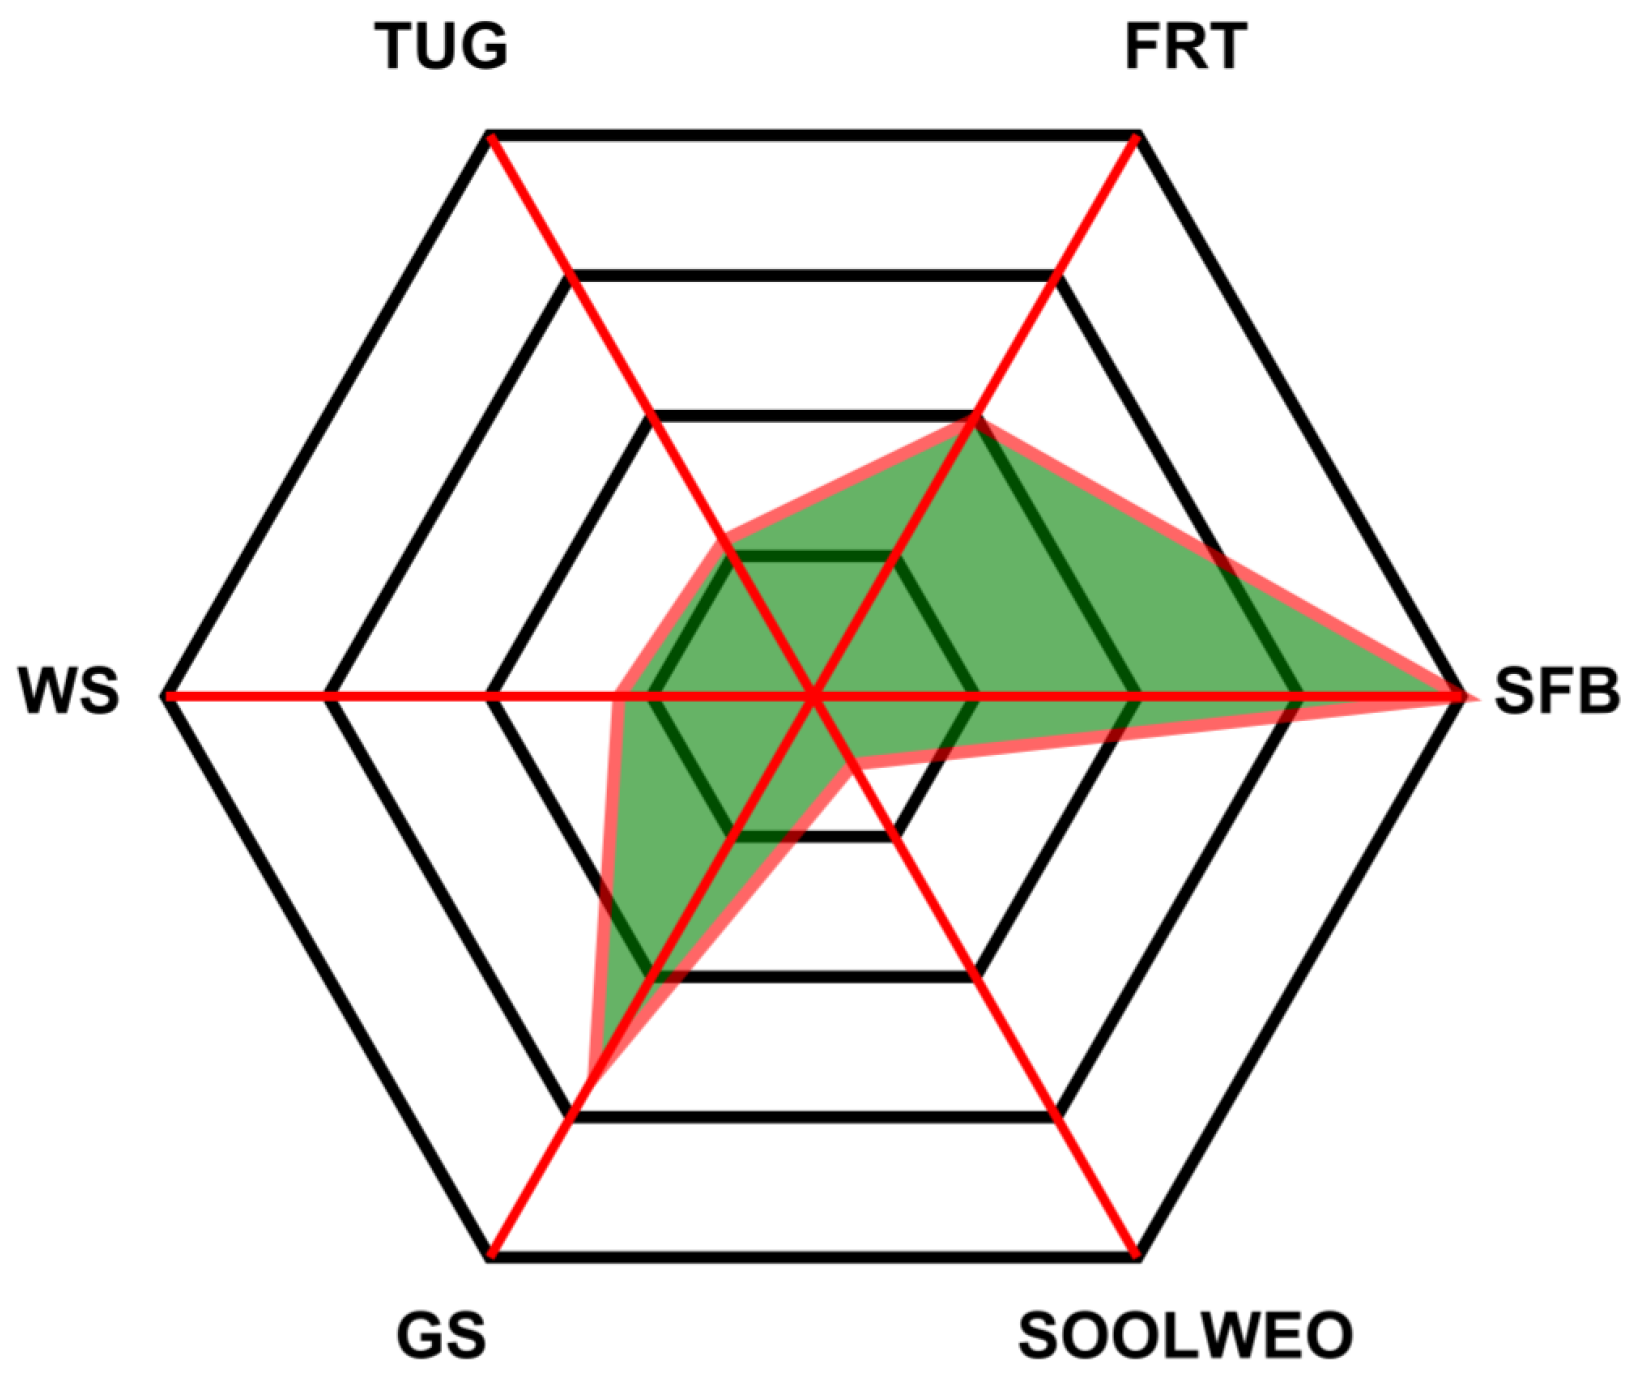
After a participant completes a test, relevant performance parameters are extracted from the skeletal data and saved into a structured CSV file. These parameters are then passed to the corresponding machine learning model, which generates a frailty prediction. The prediction is displayed in a custom-built user interface developed for the frailty assessment system. Along with individual test outcomes, a comprehensive report is automatically generated that includes a radar chart (web chart) to visually represent the participant’s frailty profile across multiple physical domains.
4. Results
This section outlines the results obtained from six standardized physical tests conducted using the Kinect V2 sensor: the Grip Strength Test, Seated Forward Bend Test, Functional Reach Test, Standing on One Leg with Eyes Open Test, Timed Up and Go Test, and Walking Speed Test. Each test is designed to extract specific kinematic or temporal features such as duration, distance, and repetitions. These tests were approved by the Institutional Review Board of the National University of Sciences and Technology (NUST) via IRB/IFRL/2025/01 on 10 March 2025. The results focus on capturing performance metrics relevant to physical function, enabling a quantitative evaluation of each individual’s test outcomes.
The Grip Strength Test was performed using a digital hand dynamometer, with the RGB camera capturing the live display. OCR was used to extract the grip strength value, which, in one case, was recorded as 7.4 kg, below the threshold for the age and gender of the participant. The value was saved to a CSV file and passed to a trained machine learning model, i.e., KNN, which classified the result as ‘reduced grip strength’. The classification output was displayed and added to the clinical report and radar chart. As shown in
Figure 7, the RGB camera captures the digital hand dynamometer screen, allowing the system to detect digits for real-time grip strength extraction.
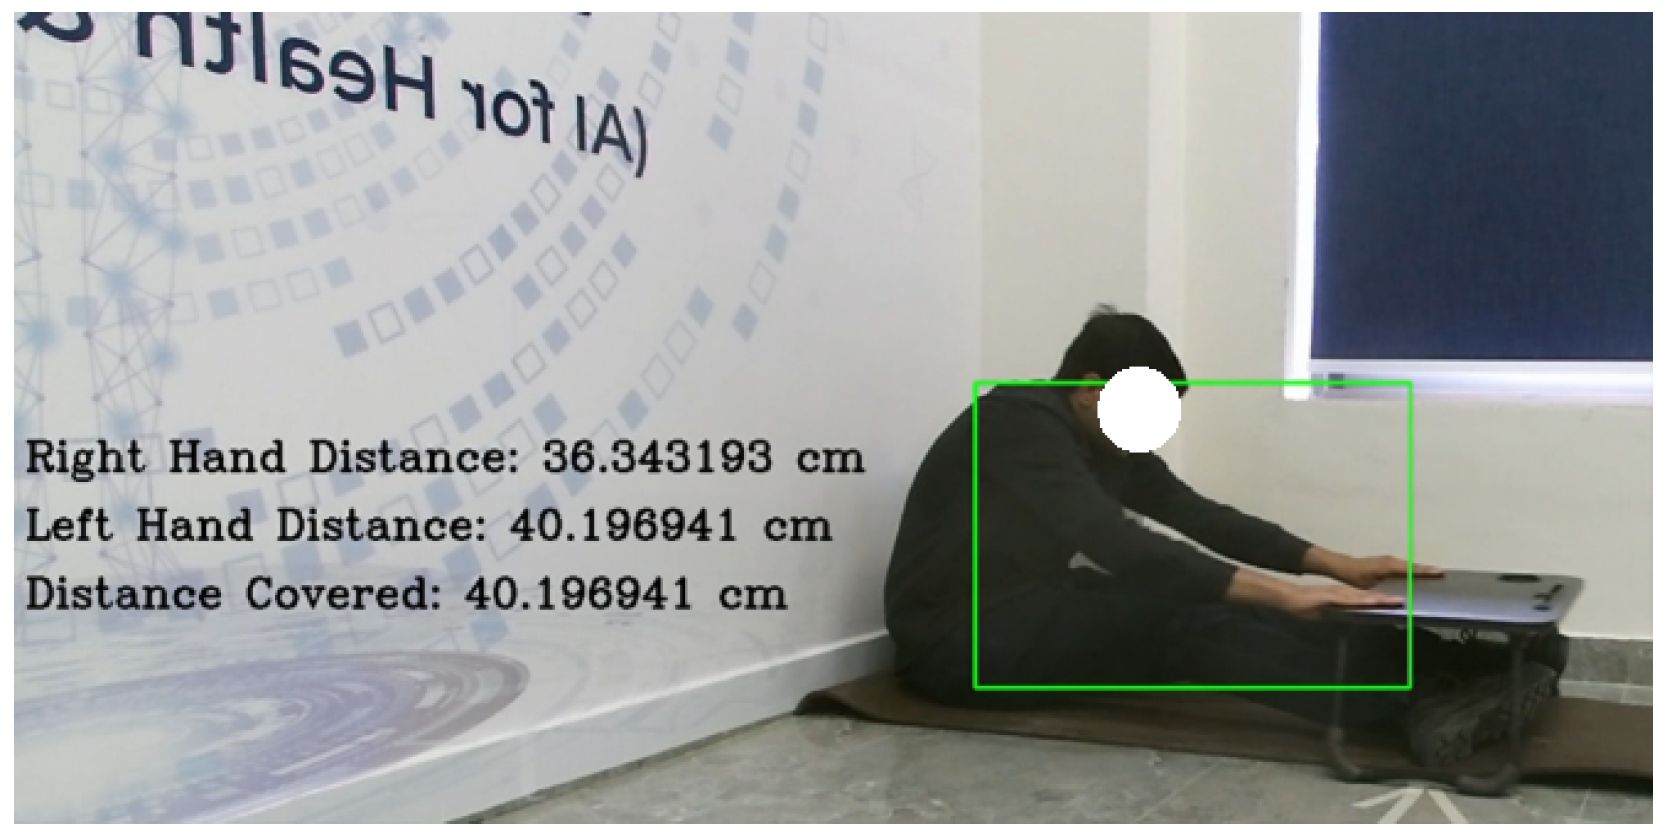
In the Seated Forward Bend Test, the hand, elbow, spine, and knee joints were tracked to estimate reach distance. In one recorded instance, the participant achieved a maximum forward reach of 40.196 cm, exceeding the age-specific threshold. The trained model, i.e., the Support Vector Machine (SVM) in this case, classified the result as ‘good flexibility’, which was included in the clinical report and visualized on the radar chart. As shown in
Figure 8, the RGB stream was used to monitor hand positions in real time for accurate distance estimation. Here, the green rectangle represents the bounding box for the participant detected by the computer vision system.
In the Functional Reach Test, the participant stood sideways to the camera while hand, elbow, and spine joint data were used to track forward arm extension without foot movement. In one instance, a maximum reach distance of 31.226 cm was recorded. The trained Random Forest classifier classified the result as ‘low risk’. This outcome was included in the clinical report and visualized on the radar chart. As shown in
Figure 9, the Kinect feed captured the participant’s posture and arm extension during the test.
In the Timed Up and Go (TUG) Test, the participant began seated, and the system automatically triggered the timer upon detecting knee–hip joint misalignment during standing. After walking three meters, turning, and returning to the chair, the timer stopped once the seated posture was re-established. In one instance, the total recorded time was 11.8 s, exceeding the normal mobility threshold. The trained XGBoost model classified the result as ‘slow mobility’. This outcome was added to the clinical report and visualized on the radar chart. As shown in
Figure 10, the camera feed captured key movement stages throughout the test.
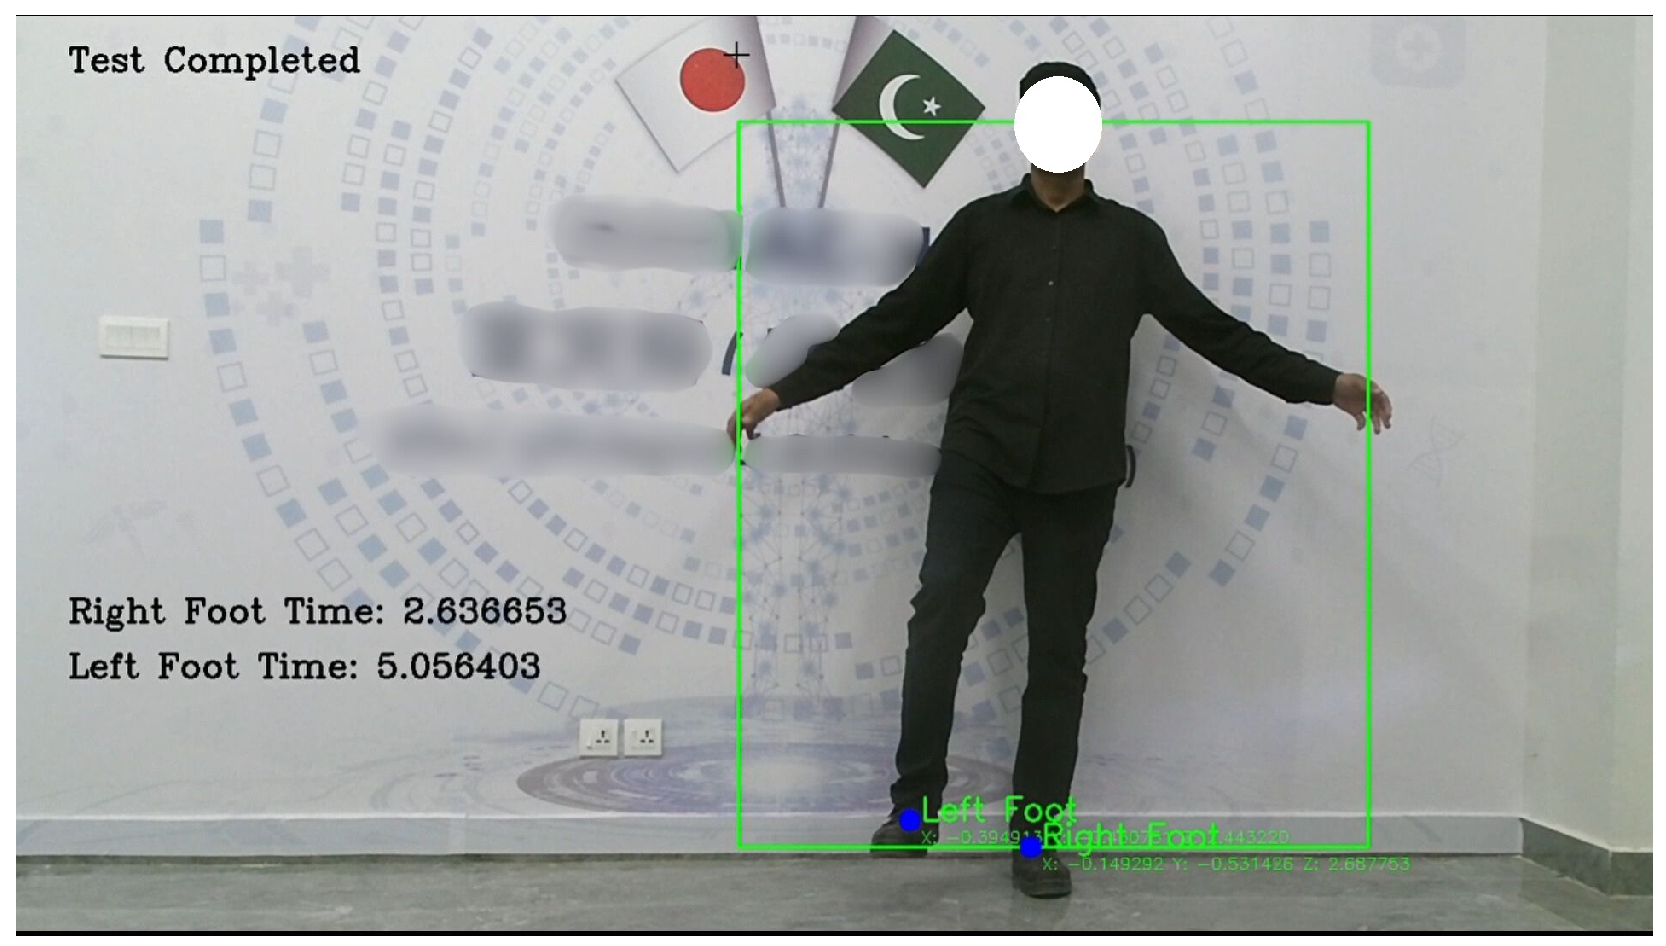
In the Standing on One Leg with Eyes Open (SOOLWEO) Test, the participant stood facing the Kinect V2 sensor and raised one leg once stability was detected. The system timed both legs individually, recording 2.6366 s on the right and 5.056 s on the left. The better of the two, 5.056 s, was logged and classified by the trained Support Vector Machine model as ‘risk of locomotor instability’. The result was included in the clinical report and visualized on the radar chart. As illustrated in
Figure 11, the camera feed captured the participant’s posture while balancing on a single leg.
In the Walking Speed Test, the participant walked a distance of 11 m toward the vision sensor. The system automatically timed the participant between the 8 m and 3 m marks, measuring the central 5 m segment. In one recorded trial, the walking time was 6.4 s, which exceeded the high-risk threshold of 6.2 s. The result was classified by the trained XGBoost model as a high fall risk and was included in the clinical report and visualized on the radar chart. As shown in
Figure 12, the camera feed captured the participant’s walking approach during the test.
The final classification outcomes of all six tests were compiled and visualized in a radar chart, as shown in
Figure 13. Each axis of the chart corresponds to one of the six physical frailty tests: Grip Strength, Seated Forward Bend, Functional Reach, Standing on One Leg with Eyes Open, Timed Up and Go, and Walking Speed. The radar chart offers a comprehensive visual summary of the participant’s performance, enabling quick identification of strong and weak areas based on the system-evaluated results.
In addition to classification accuracy, we evaluated the inference time per test to validate the real-time performance of the proposed system.
Table 3 reports the average inference time for each of the six frailty tests. The results show that inference times ranged from 8.46 ms (Walking Speed) to 27.23 ms (Standing on One Leg with Eyes Open), with an overall average of 15.97 ms. All values were well below the 50 ms threshold typically associated with real-time clinical systems. This confirms that the proposed framework not only achieves high accuracy but also ensures efficient real-time operation across all test modalities.
5. Discussion
This study proposed a fully automated and comprehensive frailty assessment system that leverages a single vision sensor for markerless joint tracking and applies machine learning models to classify performance across six standardized physical tests. The system produced highly reliable results, with multiple models achieving near-perfect precision, recall, and F1-scores, confirming its alignment with clinical benchmarks.
For completeness, a brief overview of the classification models used is provided here: Logistic Regression was included as a linear baseline model. A Support Vector Machine (SVM) was chosen for its effectiveness in high-dimensional feature spaces and its ability to construct optimal separating hyperplanes. K-Nearest Neighbors (KNN) served as a simple non-parametric method that classifies based on feature similarity. Random Forest (RF), an ensemble of decision trees, was applied for its robustness and ability to capture nonlinear relationships while reducing overfitting. Extreme Gradient Boosting (XGBoost) was selected due to its superior predictive accuracy and efficiency, particularly in structured biomedical datasets. These complementary models ensured a balanced evaluation of the proposed frailty assessment framework.
A key strength of the system lies in its modular machine learning architecture, where separate models were trained for each test based on task-specific features. The performance of each classifier was visualized through heatmaps, revealing clear trends.
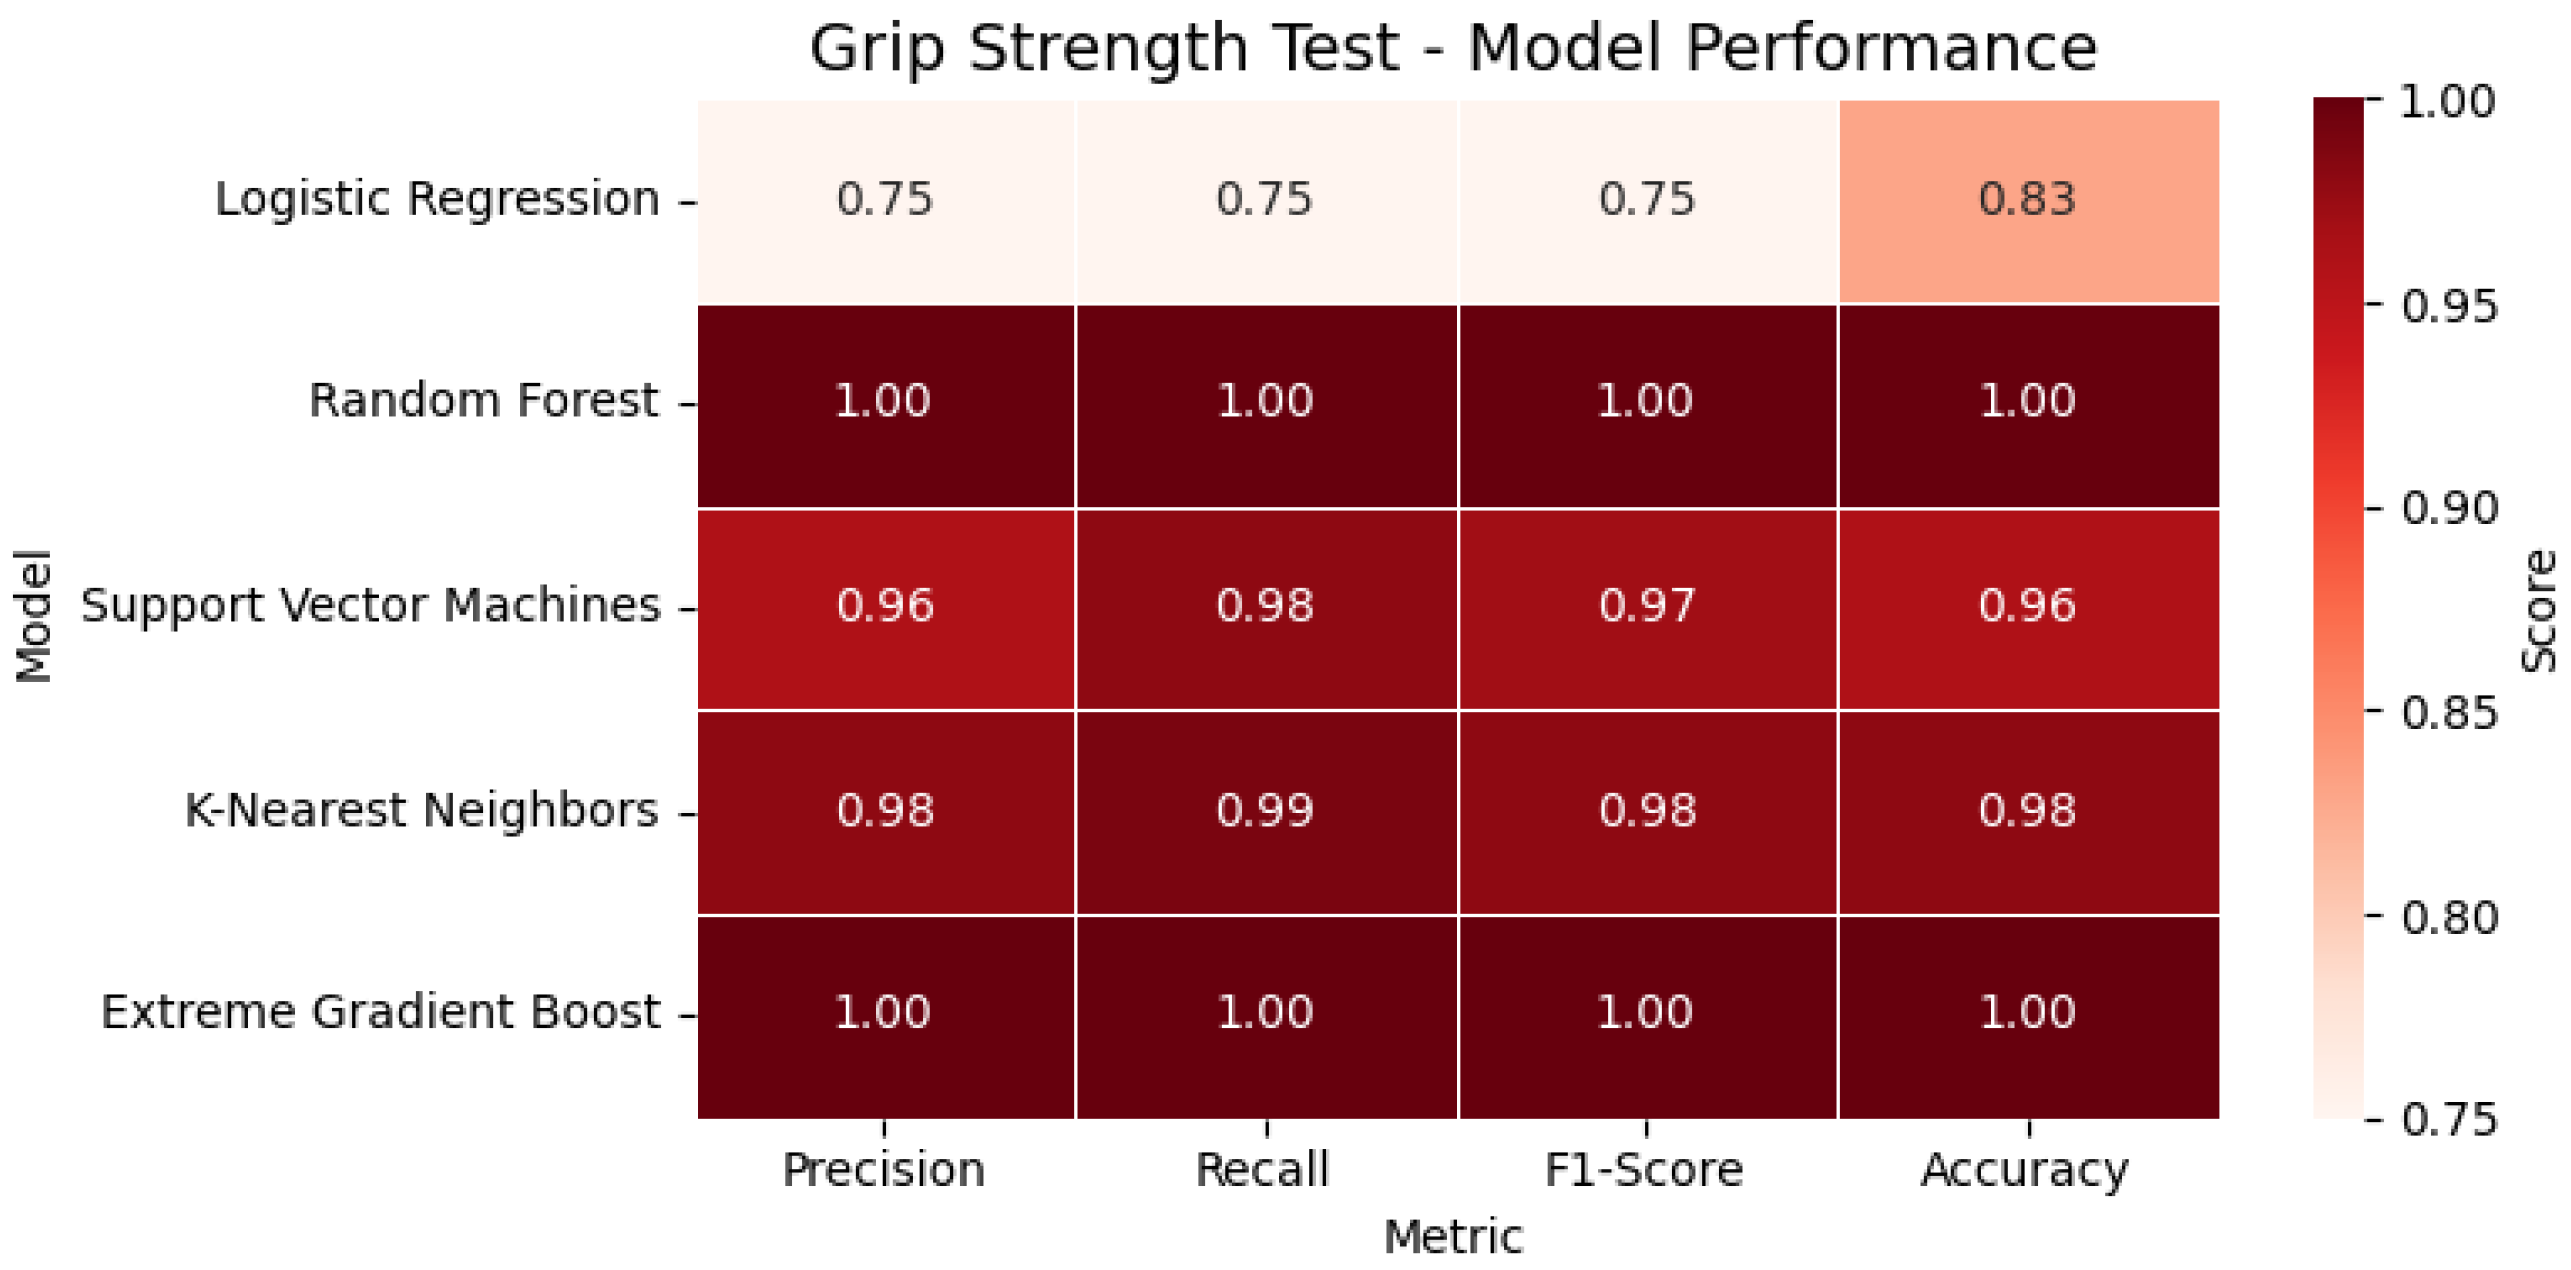
In the Grip Strength Test, tree-based models such as Random Forest and XGBoost achieved perfect classification metrics (precision, recall, F1-score = 1.00), while the SVM and KNN also showed strong generalization, outperforming Logistic Regression. For the evaluated participant, the extracted grip strength was 7.4 kg, which fell below the clinical threshold and was accordingly classified as ‘reduced grip strength’. As shown in
Figure 14, the heatmap highlights the performance of all evaluated classification models for the Grip Strength Test across four key metrics, accuracy, precision, recall, and F1-score, enabling a clear visual comparison of each model’s effectiveness.
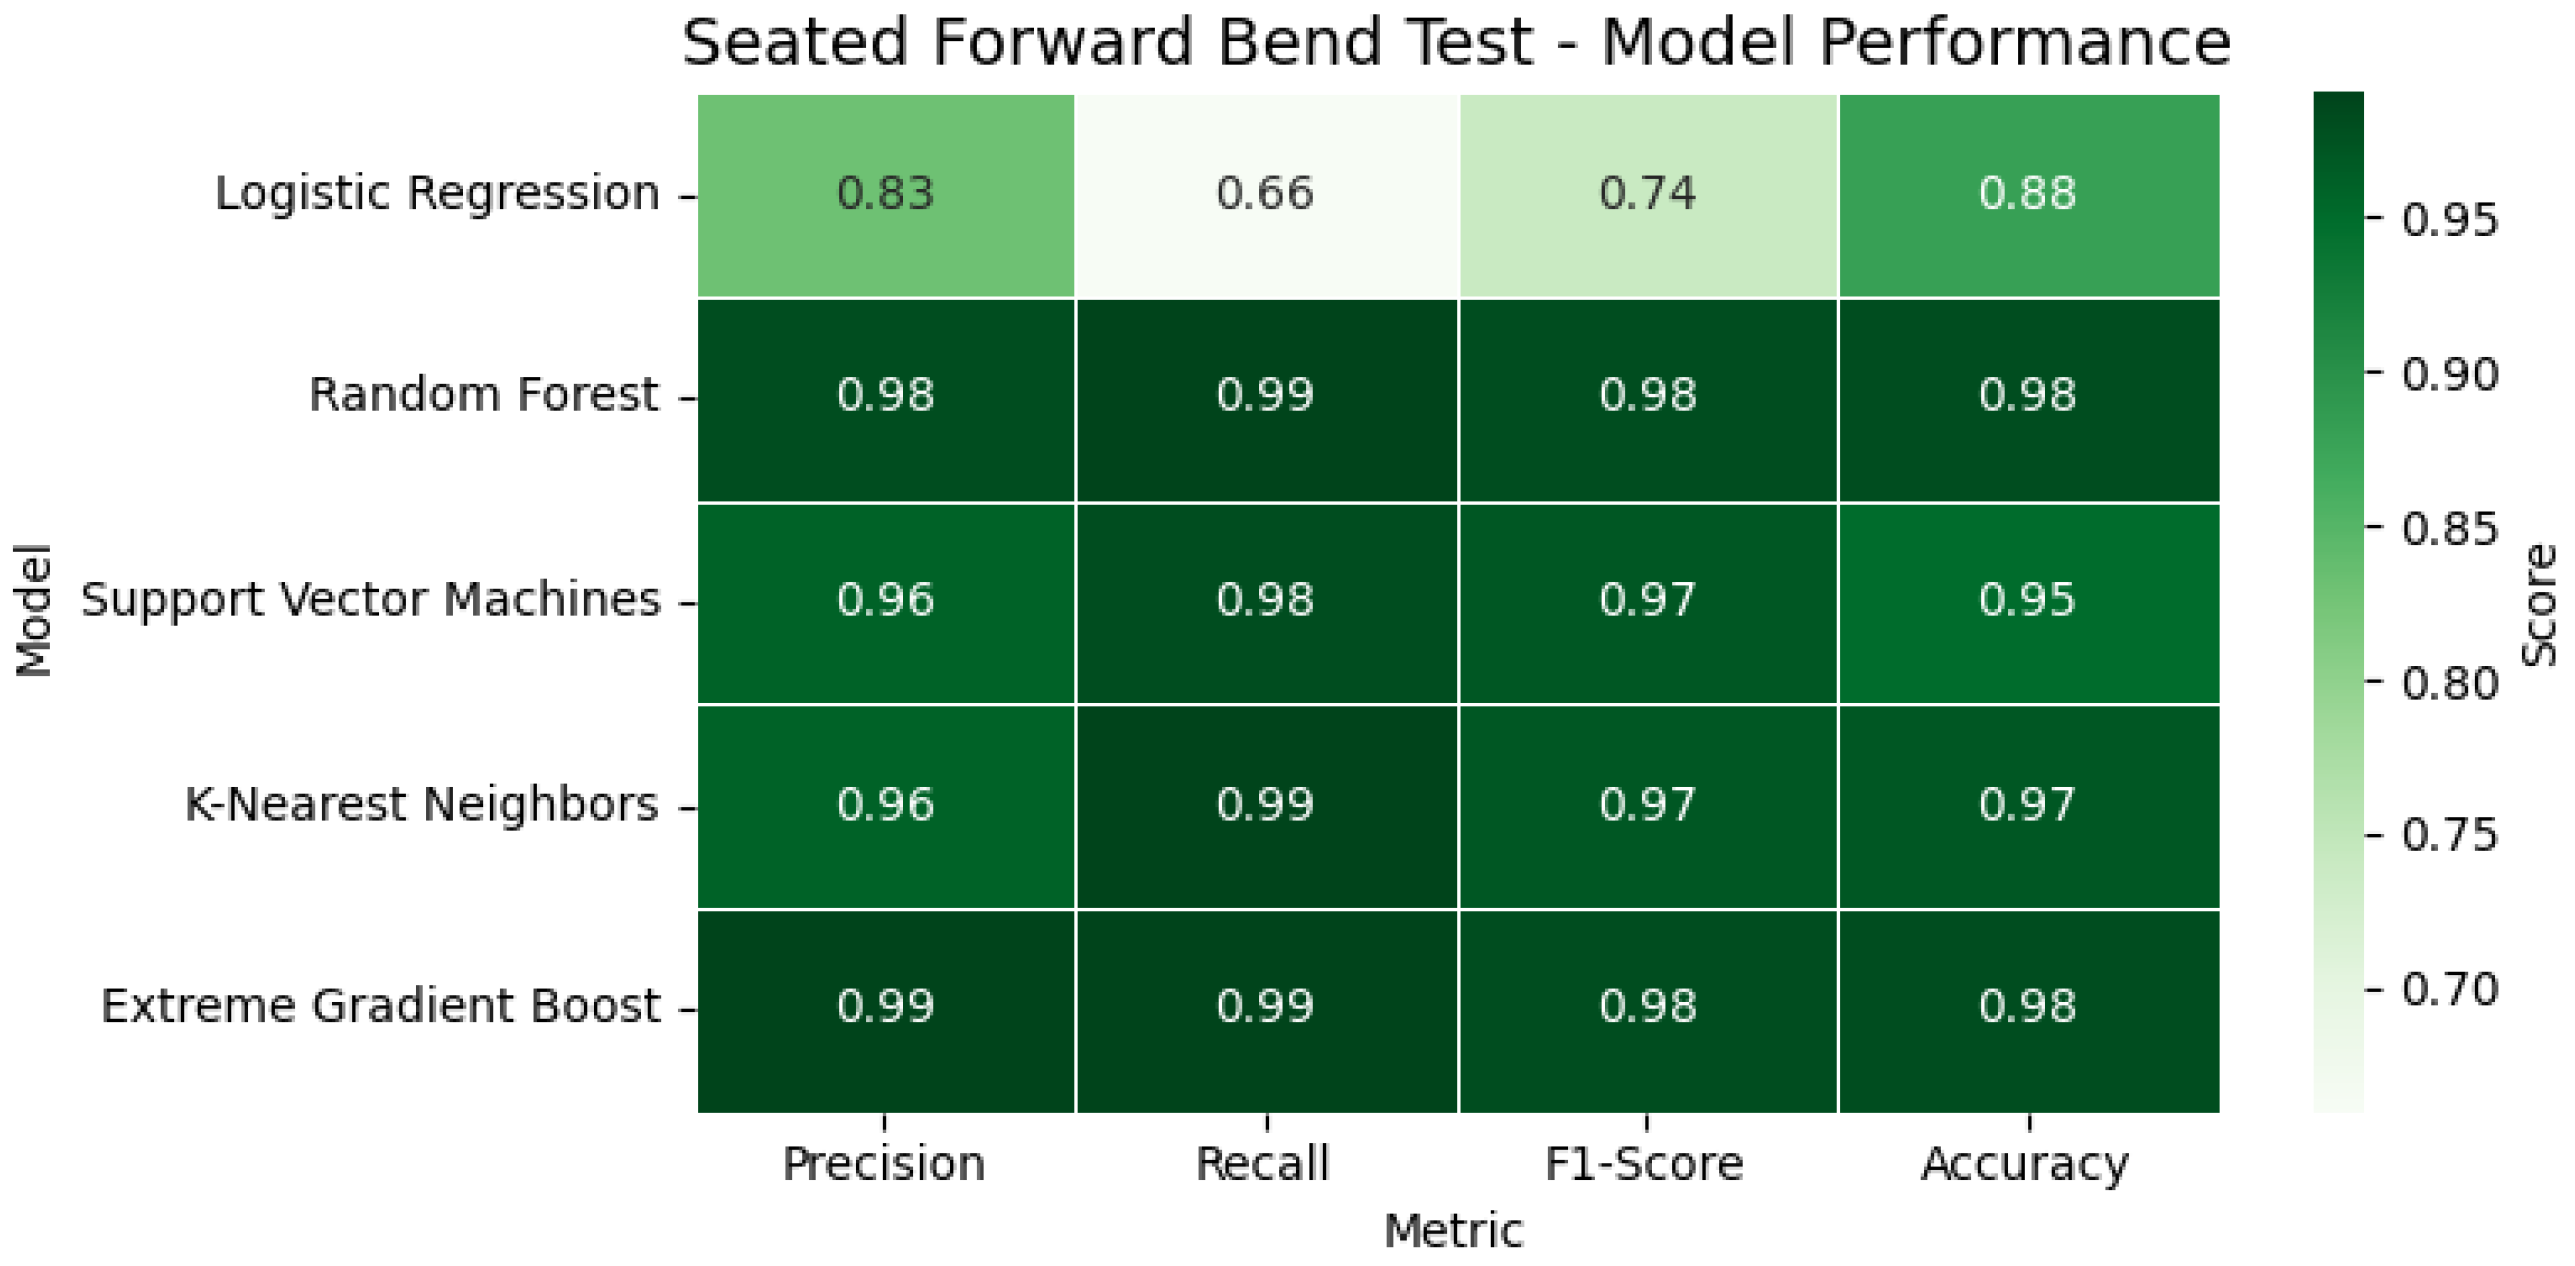
In the Seated Forward Bend Test, models again performed with high consistency. Random Forest and XGBoost reached 98% accuracy, while the SVM and KNN both recorded F1-scores of 0.97 or above. In the observed instance, the participant achieved a reach of 40.19 cm, exceeding the normative cutoff, and was thus classified as having good flexibility. In
Figure 15, the heatmap illustrates the classification performance of various models applied to the Seated Forward Bend Test. Key metrics, including accuracy, precision, recall, and F1-score, are visualized, providing a comparative overview of each model’s flexibility prediction capability.
The Functional Reach Test showed consistently high metrics across all classifiers, with several achieving 100% performance. The relatively simple frontal plane movement made it well-suited for Kinect-based depth tracking. In one case, the participant’s reach of 23.5 cm placed them in the ‘moderate balance performance’ category. In
Figure 16, the heatmap displays the performance metrics of all evaluated classifiers for the Functional Reach Test. The comparison across accuracy, precision, recall, and F1-score highlights the consistently high reliability of the models in predicting balance performance.
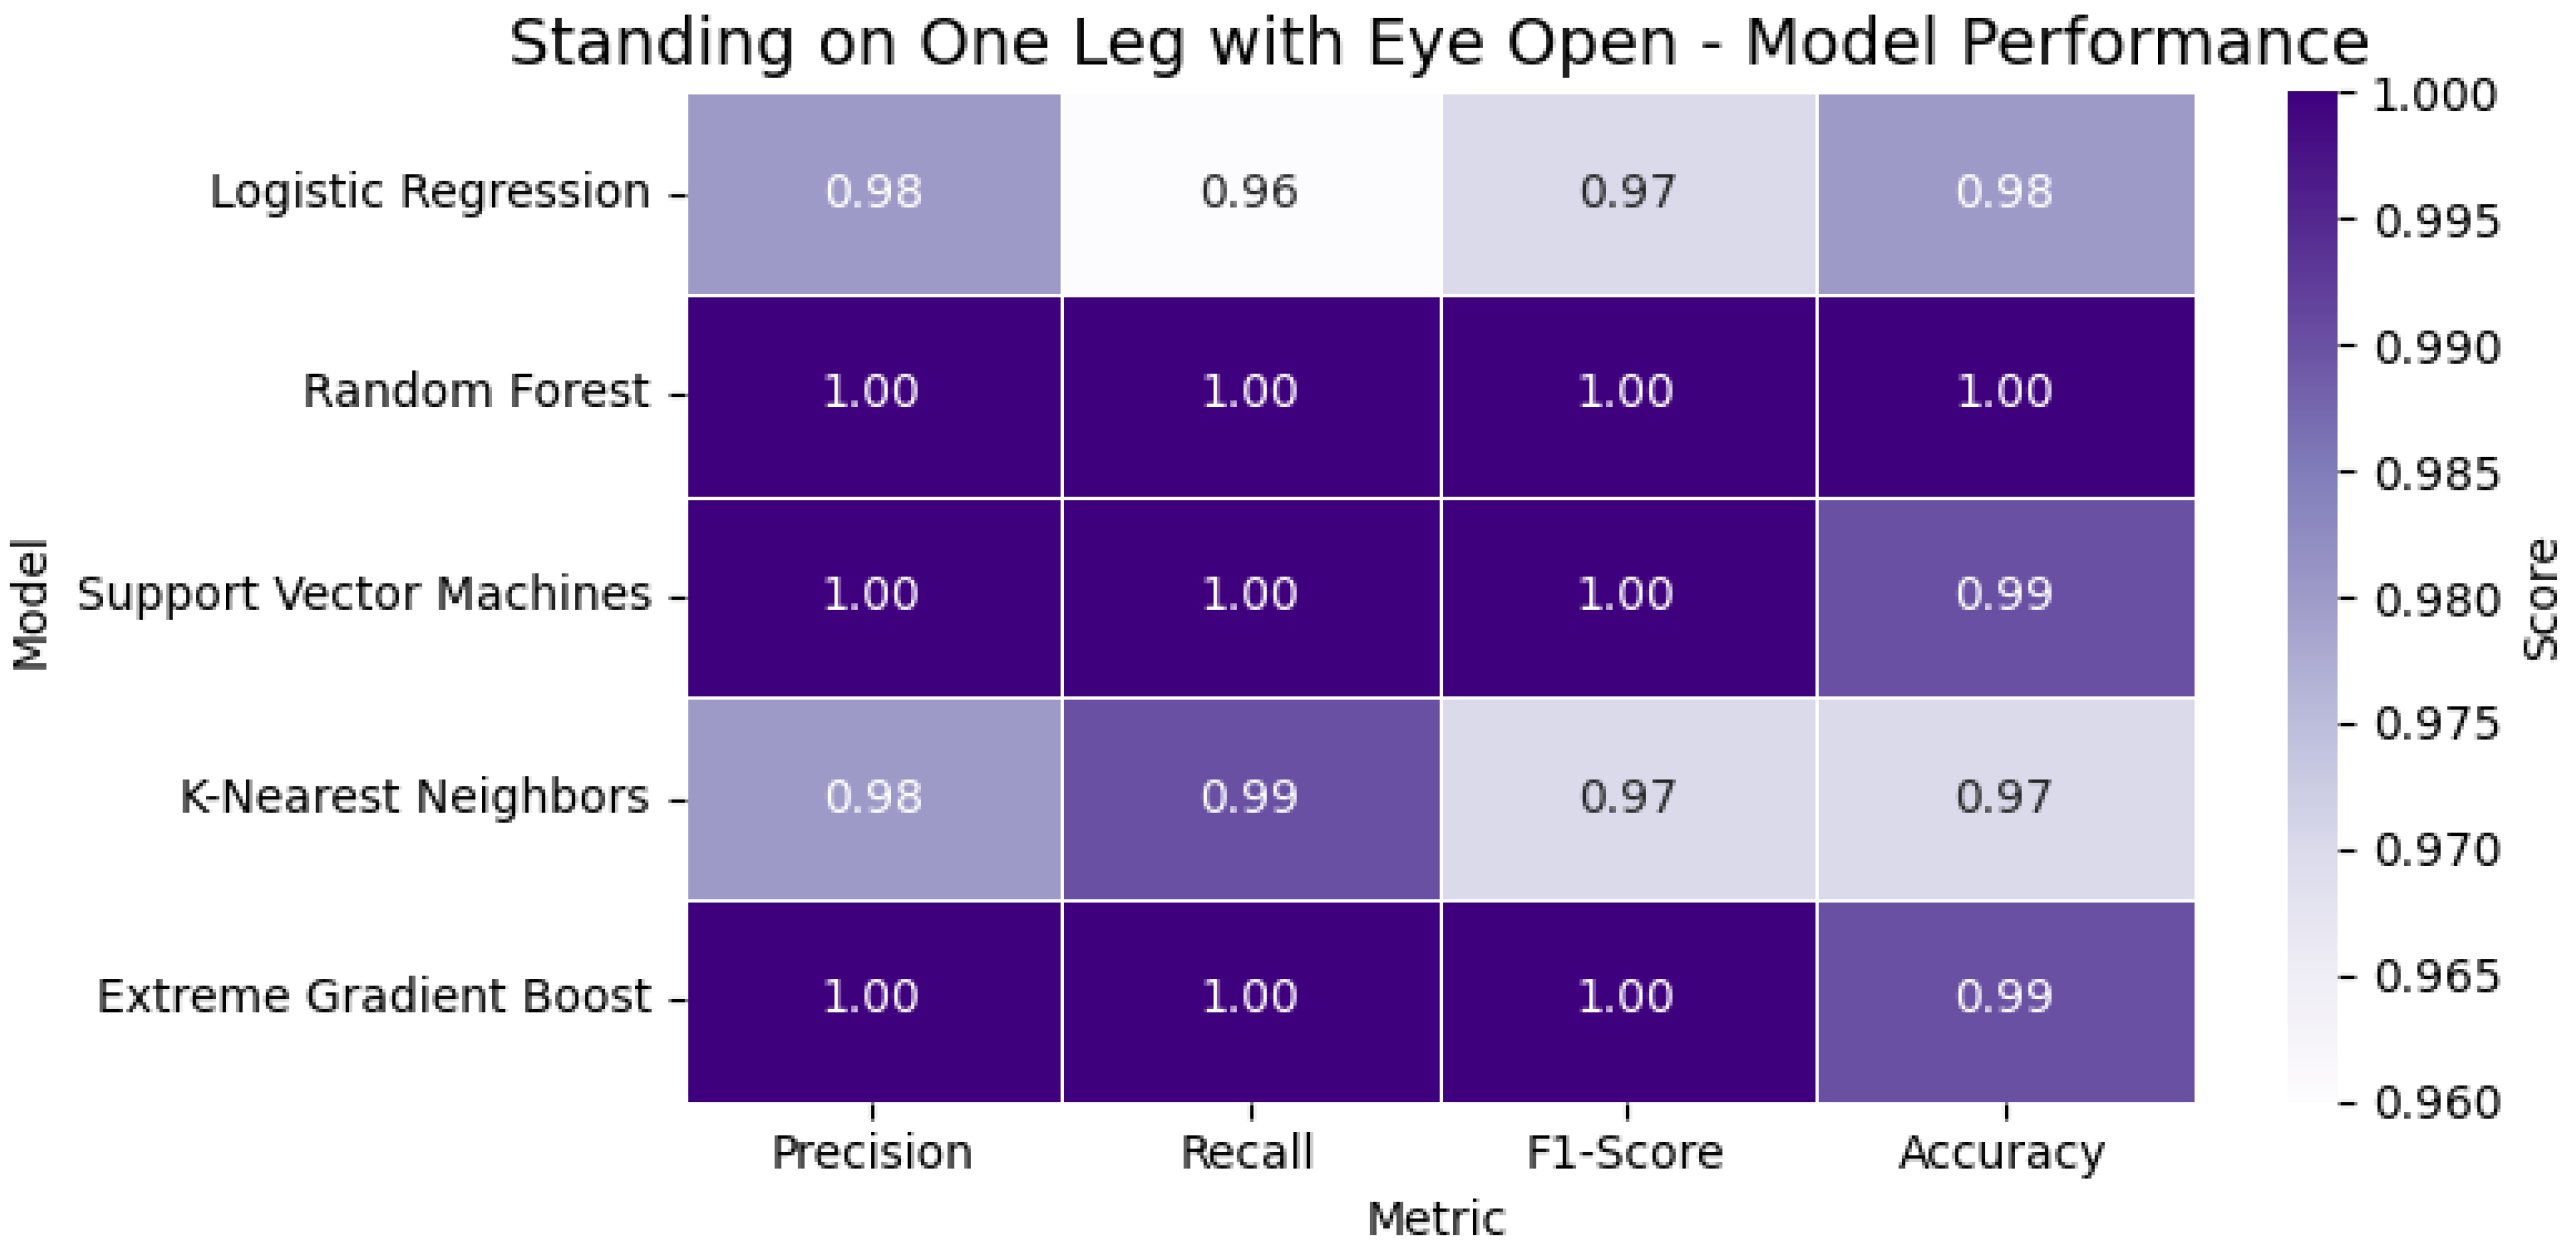
The Standing on One Leg with Eyes Open (SOOLWEO) Test involved more variability due to balance and leg strength. Here, Random Forest and XGBoost again demonstrated robust performance. The participant balanced for 48.1 s on the better leg—below the 60 s standard—and was therefore classified as having reduced static balance. In
Figure 17, the heatmap presents the classification metrics—accuracy, precision, recall, and F1-score—for the models used in the SOOLWEO Test. The visualization highlights each model’s ability to assess static balance performance accurately.
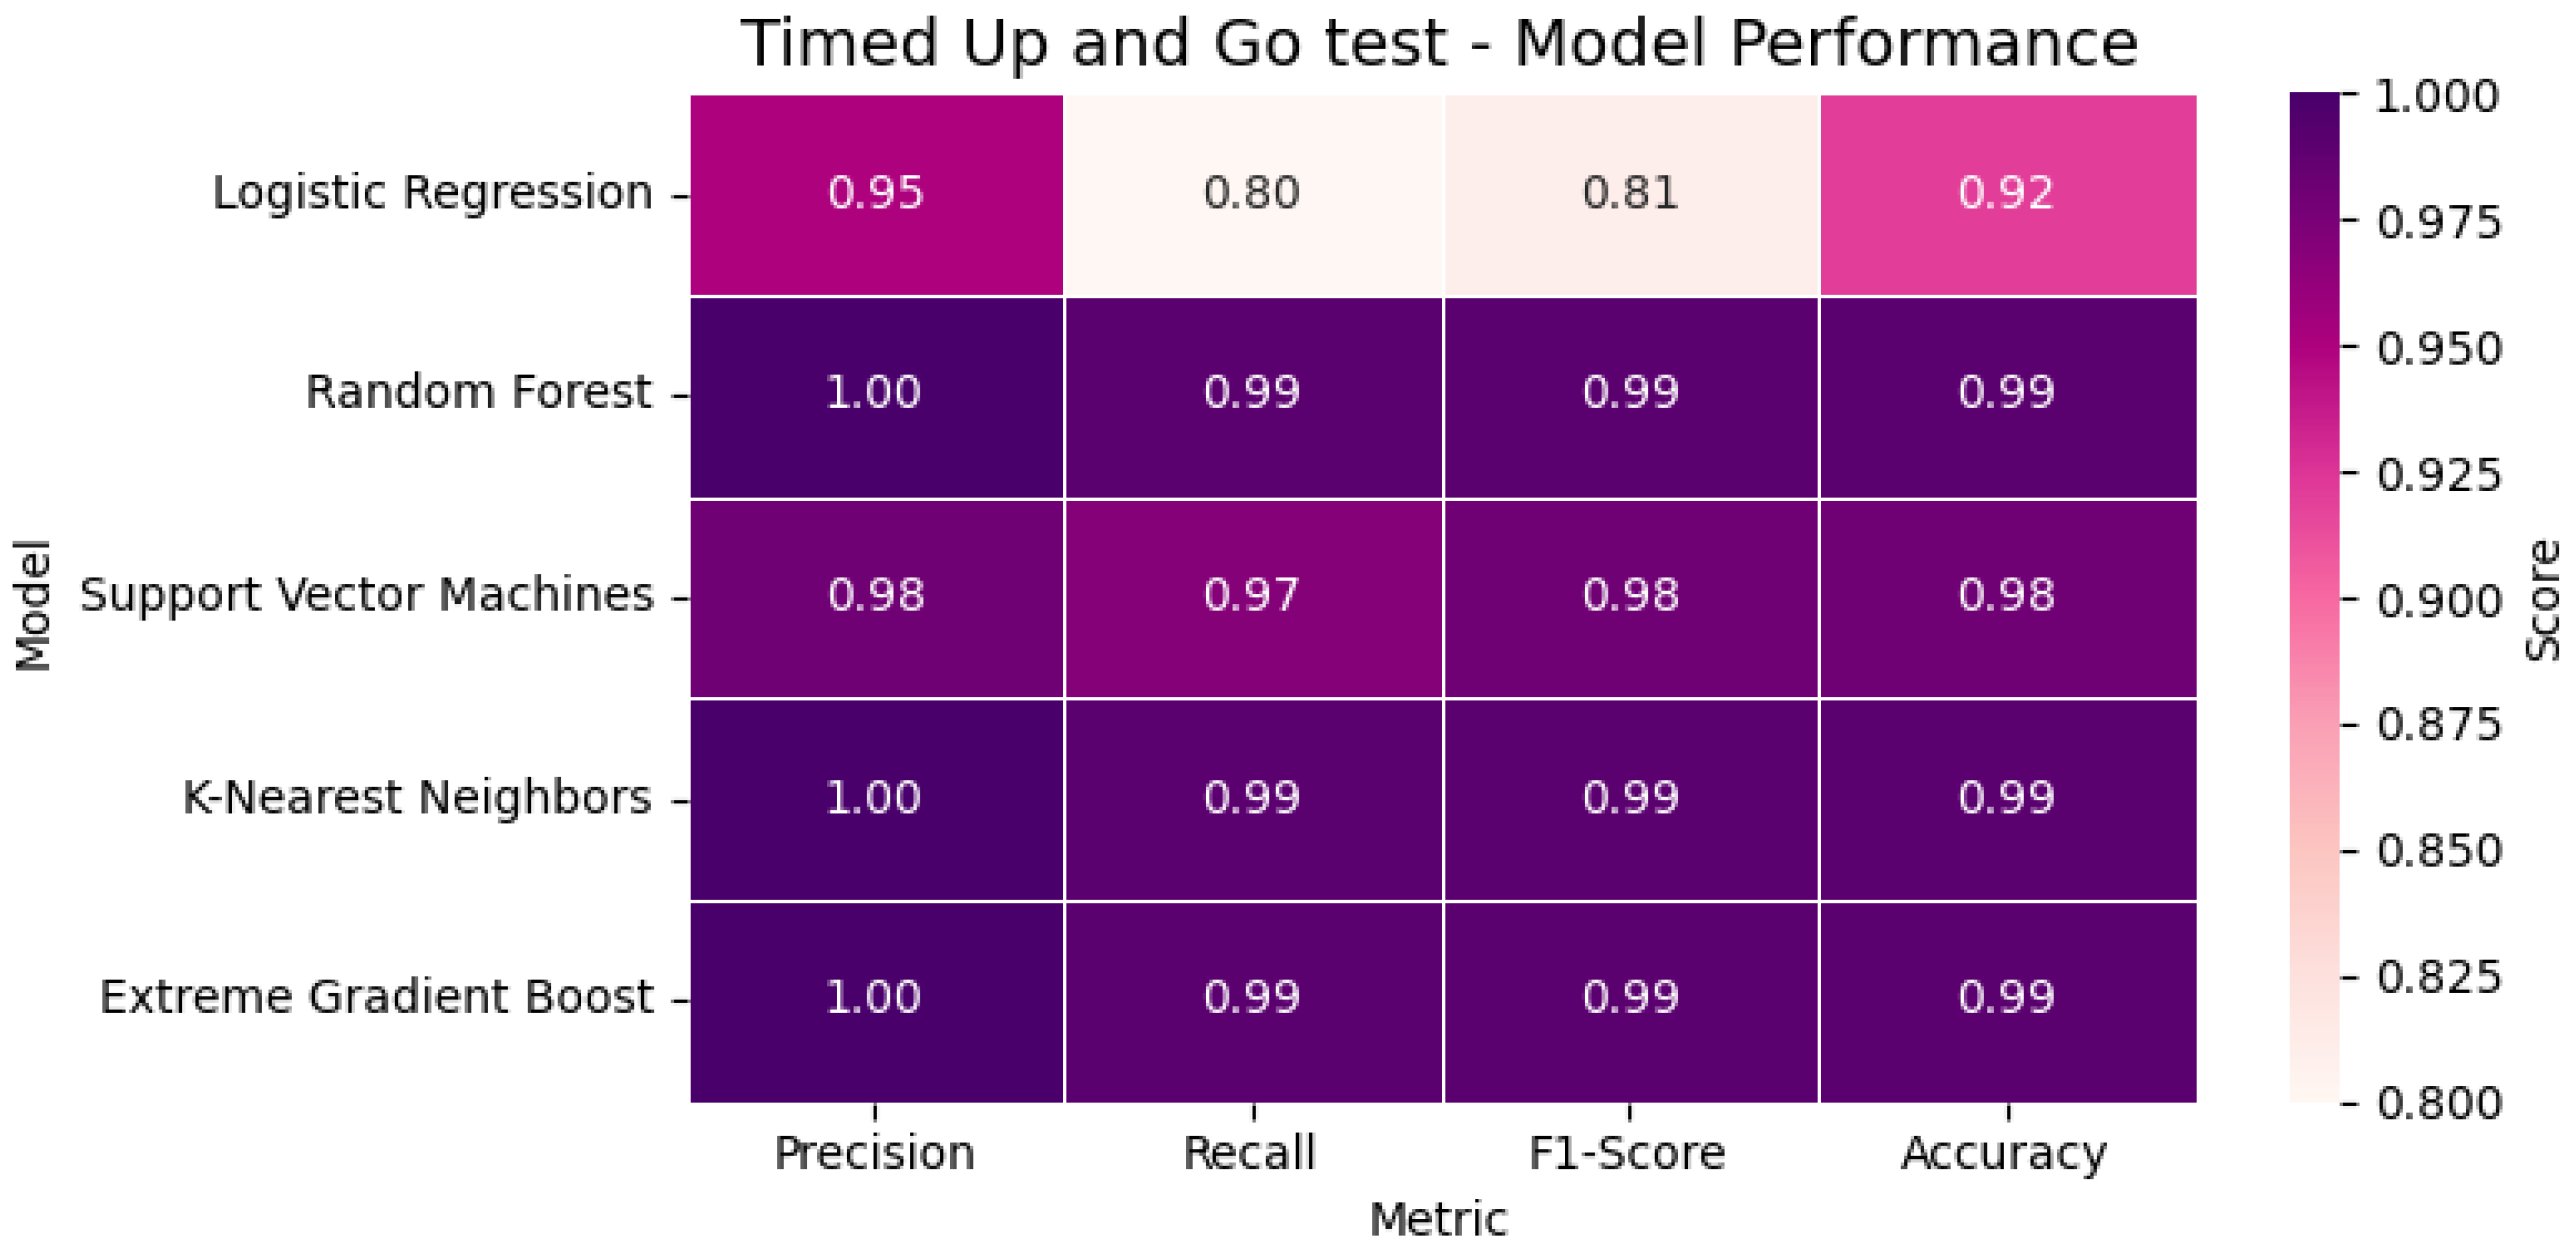
In the Timed Up and Go (TUG) Test, the classification was more challenging due to the complex body transitions. Despite this, XGBoost and KNN maintained near-perfect scores (F1 = 0.99), outperforming Logistic Regression. The participant’s total time of 11.8 s exceeded the standard threshold, and the result was correctly labeled as ‘slow mobility’. In
Figure 18, the heatmap visualizes the classification performance of the evaluated models for the TUG Test. Metrics including accuracy, precision, recall, and F1-score are compared to assess each model’s effectiveness in identifying mobility limitations.
Finally, in the Walking Speed Test, all models performed exceptionally well, with Random Forest and XGBoost again reaching 100% accuracy. A walking time of 6.4 s over the central 5 m path exceeded the 6.2 s high-fall-risk threshold, leading to a classification of ‘high fall risk’. In
Figure 19, the heatmap highlights the classification performance of all tested models for the Walking Speed Test. The metrics—accuracy, precision, recall, and F1-score—demonstrate each model’s reliability in detecting walking impairments and fall risk.
These per-test classifications were aggregated and visualized using a radar chart, providing a clear, intuitive summary of the participant’s physical performance profile. Each axis represents a separate test, allowing healthcare professionals to easily identify specific areas of concern such as balance, mobility, or strength. This visual representation bridges the gap between raw model outputs and clinical decision-making.
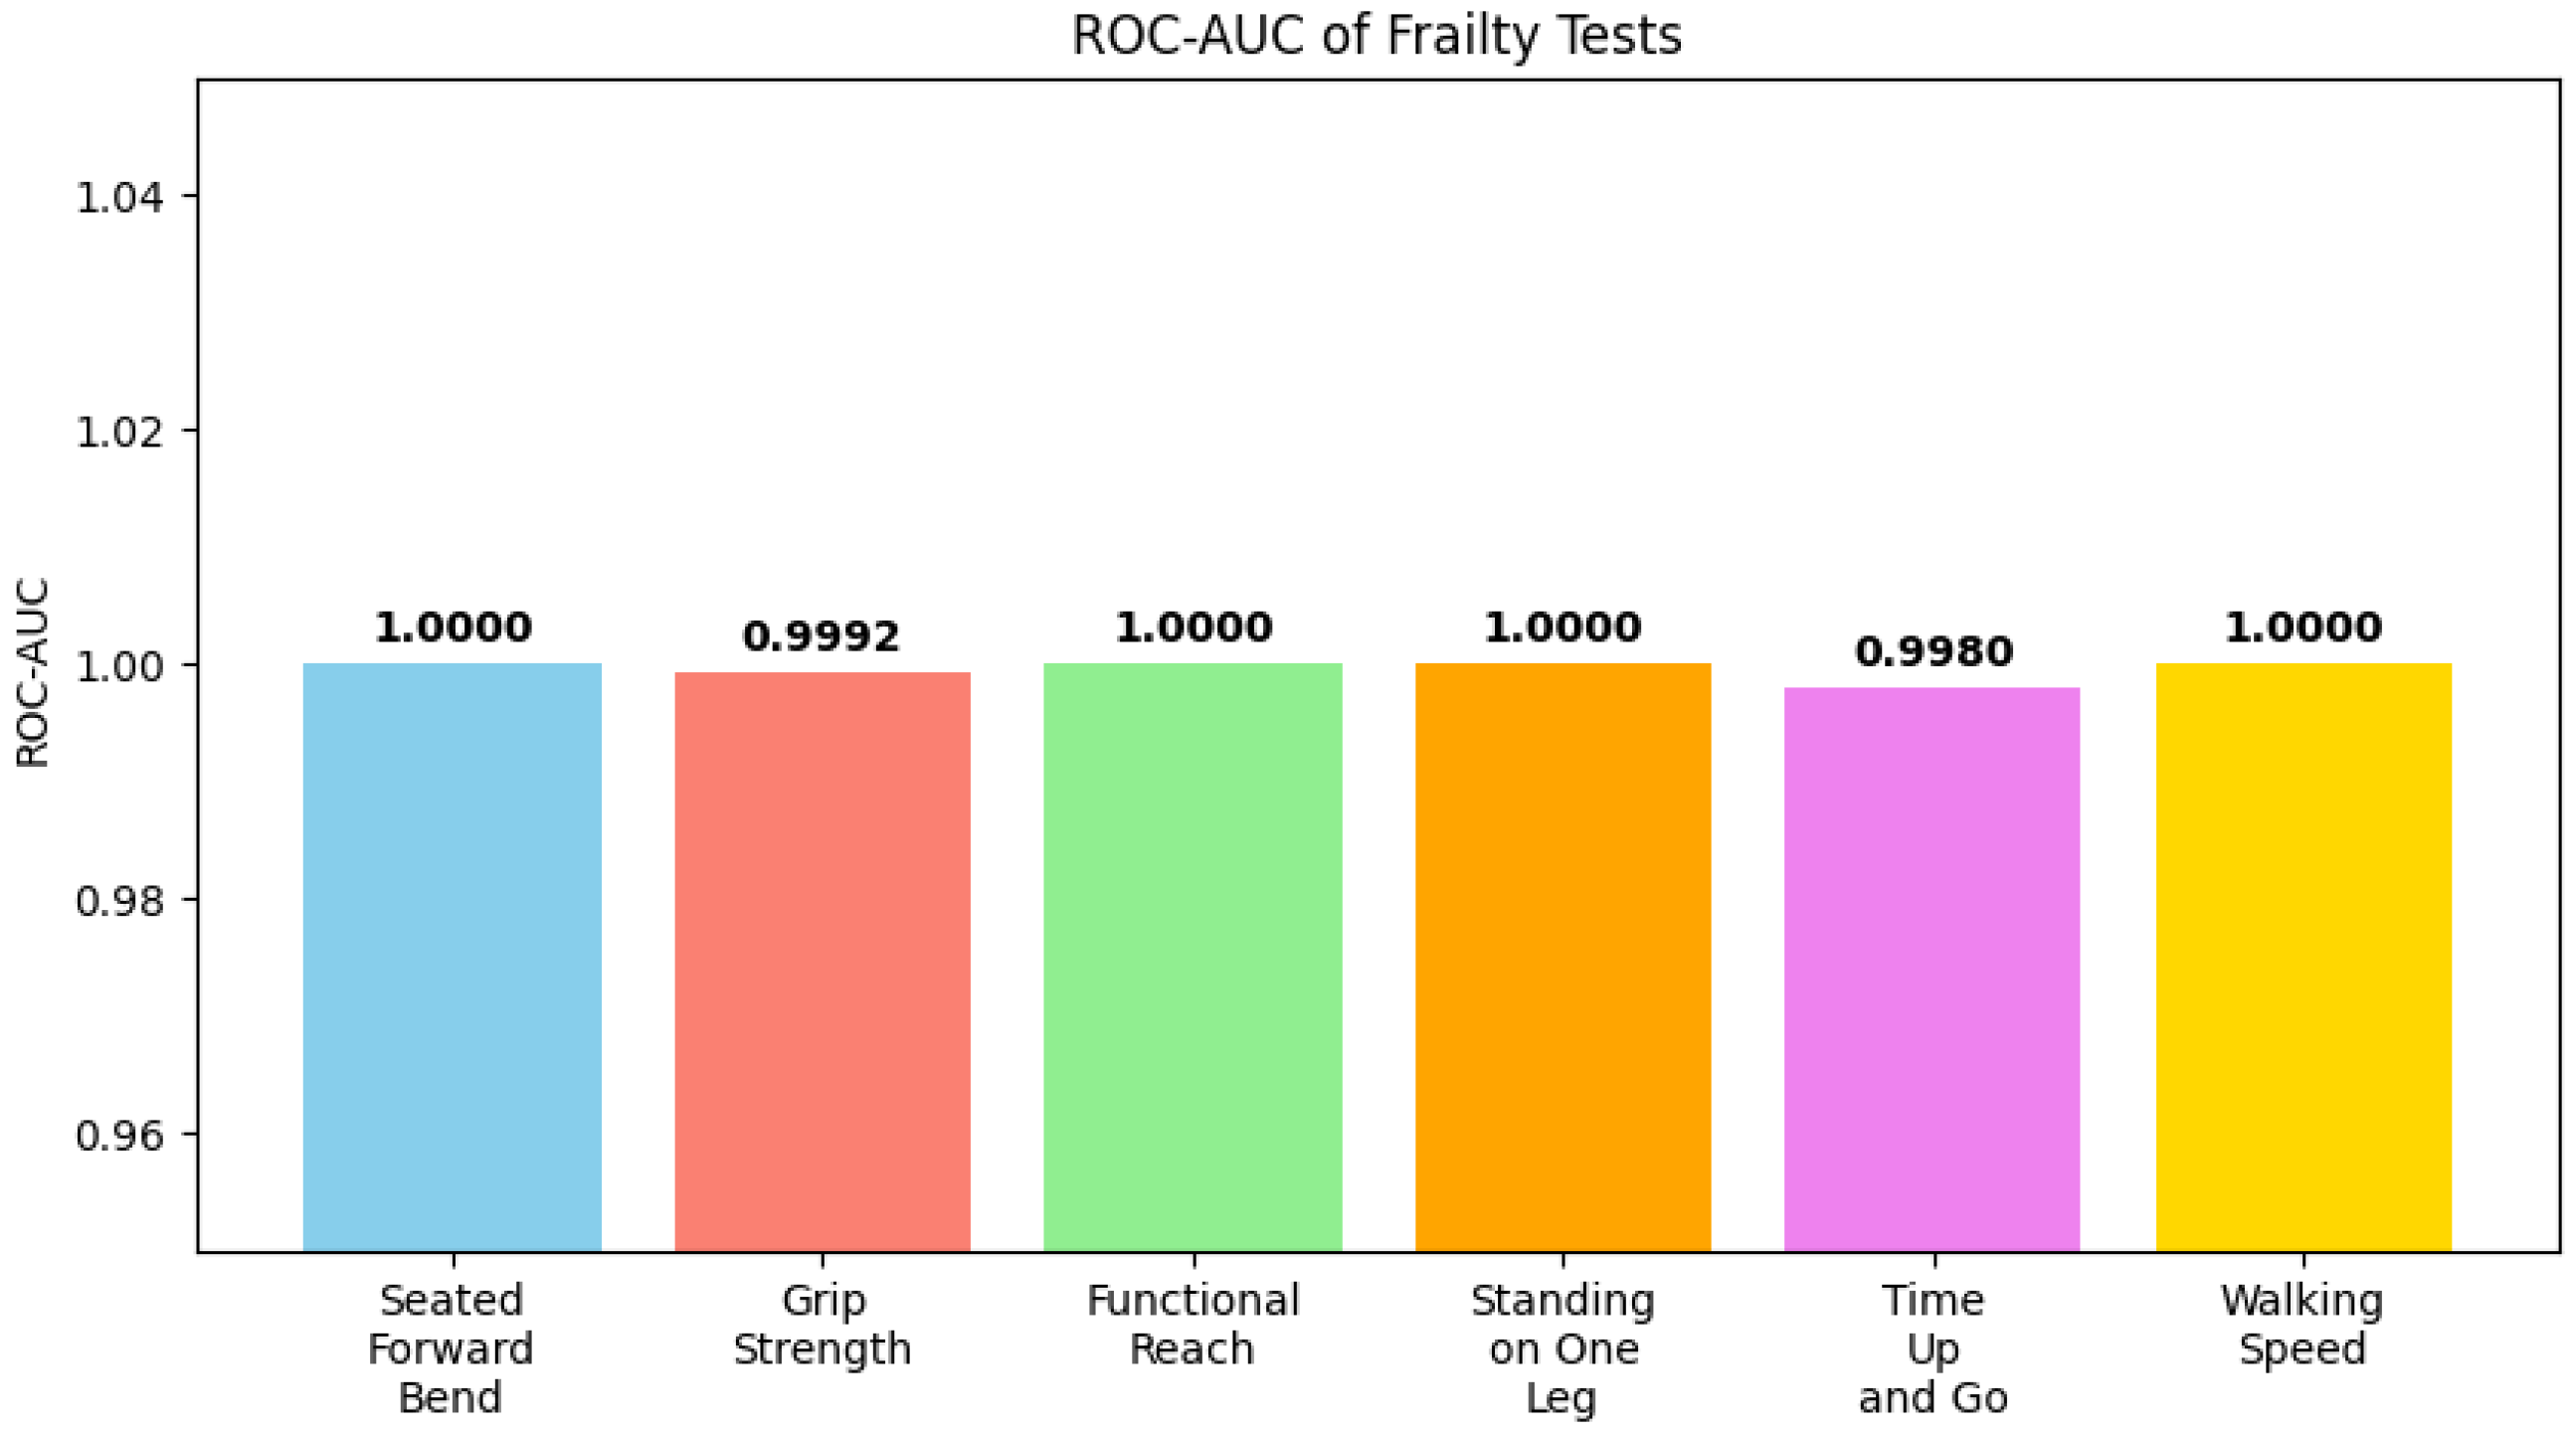
Figure 20 shows ROC-AUC values for each test, indicating model performance across different physical performance domains, while
Figure 21 illustrates feature importance, highlighting which participant characteristics most strongly influence predictions.
Beyond technical performance, the framework was designed from a social perspective, treating older adults as active participants rather than passive objects of measurement. This aligns the system with the dignity and empowerment required in elderly care, ensuring that assessments contribute not only to clinical outcomes but also to patient engagement and acceptance.
Another important consideration is affordability. The system requires only a single Kinect V2 depth sensor (around USD 50 on the secondary market) and a consumer-grade laptop (approximately USD 600), both of which are sufficient to run the software without performance issues. In addition, all supporting software and machine learning libraries used in this study are open-source and freely available. This cost-effective design reduces barriers to adoption in clinics, community centers, and even home environments, while avoiding the expenses associated with multi-camera motion capture systems or wearable devices.
Compared to prior studies, which often evaluated single assessments such as the Timed Up and Go Test or walking speed in isolation, our framework unifies six clinically validated tests into a single automated system. Earlier Kinect-based approaches demonstrated feasibility but lacked comprehensiveness and were not directly integrated into a clinical decision-making workflow. In contrast, this system provides structured outputs (radar charts, CSV reports) that align with existing frailty assessment protocols, enabling healthcare professionals to interpret results without additional manual processing. Furthermore, by relying on established tests widely used in geriatric practice (e.g., TUG, Grip Strength, Walking Speed), the framework ensures that its outputs are directly comparable with clinical thresholds and normative data. This integration of validated clinical measures with modern machine learning strengthens the practical applicability of the system in both hospital and home-care settings.
Finally, while the current work demonstrates the technical feasibility and clinical alignment of the system, formal usability and acceptability studies with patients and clinicians have not been conducted yet. The current work can be considered a pilot study where the system design has been tested and approved by the clinical experts at Juntendo University. However, systematic evaluations such as user surveys, clinician feedback, and usability trials are yet to be incorporated into the system. Inclusion of these studies will provide deeper insights into patient comfort, ease of use, and integration into clinical workflows, thereby ensuring that the system is not only technically effective but also practically adoptable in real-world healthcare settings.
6. Conclusions
This study presents a fully automated, non-intrusive system for frailty assessment integrating six clinically validated physical tests using a single vision sensor and machine learning models. The system captures depth and skeletal data in real time to extract test-specific parameters for grip strength, balance, flexibility, and mobility. Each test is paired with an optimized classifier selected from Logistic Regression, Random Forest, an SVM, KNN, and XGBoost, achieving high performance across all models, with several reaching 98–100% accuracy without any signs of overfitting. Results are processed through a custom interface that logs data, visualizes outcomes via radar charts, and generates a detailed clinical report for healthcare professionals. This framework reduces human error, increases reproducibility, and supports scalable frailty screening in both clinical and home environments.
The system is limited by the Kinect V2 camera’s field of view and sensitivity to lighting. To nullify these effects, all tests were conducted indoors. Future iterations could integrate advanced sensors to further mitigate these limitations. Another limitation is the lack of direct user-centered evaluations in this prototype stage. Future work will therefore involve comprehensive trials with elderly participants and healthcare professionals to assess usability, user acceptance, and clinical applicability, ensuring that older adults are treated as active subjects of care rather than passive objects of measurement.
From a practical perspective, the framework is also highly affordable. A single Kinect V2 depth sensor (approximately USD 50 on the secondary market) and a consumer-grade laptop (approximately USD 600) are sufficient to operate the system without performance issues. Combined with the fact that all supporting software and machine learning libraries are open-source and freely available, the overall deployment cost remains low, enabling adoption in diverse environments ranging from hospitals to community centers and home-based care.
Further expansion into cognitive and nutritional assessments is planned to support a more holistic frailty evaluation. These components will be integrated using multimodal data fusion, combining questionnaire-based cognitive and nutritional inputs with real-time physical test data within the same automated framework. Overall, this system bridges clinical best practices with real-time, explainable digital health technologies tailored for elderly care.
