Article

Breast Cancer Classification via a High-Precision Hybrid IGWO–SOA Optimized Deep Learning Framework

by
Aniruddha Deka
1,2,
Debashis Dev Misra
2,
Anindita Das
1,2 and
Manob Jyoti Saikia
1,3,*
1
Biomedical Sensors & Systems Lab, University of Memphis, Memphis, TN 38152, USA
2
Computer Science and Engineering, Assam down town University, Guwahati 781026, India
3
Electrical and Computer Engineering Department, University of Memphis, Memphis, TN 38152, USA
*
Author to whom correspondence should be addressed.
AI 2025, 6(8), 167; https://doi.org/10.3390/ai6080167
Submission received: 4 June 2025 / Revised: 18 July 2025 / Accepted: 22 July 2025 / Published: 24 July 2025
(This article belongs to the Section Medical & Healthcare AI)

Abstract

Breast cancer (BRCA) remains a significant cause of mortality among women, particularly in developing and underdeveloped regions, where early detection is crucial for effective treatment. This research introduces an innovative hybrid model that combines Improved Grey Wolf Optimizer (IGWO) with the Seagull Optimization Algorithm (SOA), forming the IGWO–SOA technique to enhance BRCA detection accuracy. The hybrid model draws inspiration from the adaptive and strategic behaviors of seagulls, especially their ability to dynamically change attack angles in order to effectively tackle complex global optimization challenges. A deep neural network (DNN) is fine-tuned using this hybrid optimization method to address the challenges of hyperparameter selection and overfitting, which are common in DL approaches for BRCA classification. The proposed IGWO–SOA model demonstrates optimal performance in identifying key attributes that contribute to accurate cancer detection using the CBIS-DDSM dataset. Its effectiveness is validated using performance metrics such as loss, F1-score, precision, accuracy, and recall. Notably, the model achieved an impressive accuracy of 99.4%, outperforming existing methods in the domain. By optimizing both the learning parameters and model structure, this research establishes an advanced deep learning framework built upon the IGWO–SOA approach, presenting a robust and reliable method for early BRCA detection with significant potential to improve diagnostic precision.

1. Introduction

In recent years, cancer has become one of the leading causes of death worldwide [1]. According to global health statistics, approximately 9.6 million people lost their lives to cancer in a single year, highlighting its severe impact on public health. Between 2007 and 2017, the incidence of cancer rose significantly, by nearly 33 percent, demonstrating how rapidly this disease is spreading [2]. Among various types of cancer, BRCA has shown a noticeable increase in occurrence [3]. BRCA is a form of malignant growth that begins in breast tissue [4]. It predominantly affects women and becomes particularly dangerous when it progresses to a malignant stage. Statistics for 2017 indicate that almost 200,000 people in the United States alone died from this disease [5]. These alarming figures underline the fact that breast cancer (often referred to as BRCA) is among the fastest-growing cancers worldwide. Monitoring the mortality rate associated with BRCA is therefore crucial. This disease can manifest in several ways; while some growths in breast tissue may be benign and non-threatening, others can become malignant and life-threatening. Despite advances in medical technology, effective treatment of cancer continues to pose a significant challenge for healthcare professionals [6].
Early detection of cancer plays a vital role in improving treatment outcomes, especially in the case of BRCA. Many women can now identify the disease at an early stage, thanks to regular medical screening methods such as mammography, which significantly helps to reduce the mortality rate [7]. However, cancer treatment is often time-consuming and extremely costly. The success of treatment is highly dependent on the expertise and experience of oncologists [8]. Various screening techniques are available to detect abnormalities in breast tissue, including ultrasound, magnetic resonance imaging (MRI), mammography, and histopathological examination. Among these, mammography is considered one of the most effective methods, as it requires lower doses of X-rays and can efficiently detect early signs of cancer [9]. Ultrasound, on the other hand, uses high-frequency sound waves to create real-time images of internal structures, while MRI provides detailed images at the molecular level with high spatial resolution. However, despite their strengths, both MRI and ultrasound sometimes fail to detect the exact location of the tumor with precision. To address these limitations, histopathological image analysis has become increasingly important. This technique helps pathologists identify and evaluate cancerous tissues with greater precision. Histopathology is often preferred when conventional imaging methods fail to deliver conclusive results. In this process, pathologists examine tissue samples under a microscope, usually from a biopsy procedure in which a small sample of tissue is removed from the body for closer inspection. This method plays a crucial role in confirming the presence of tumors and improving medical decisions.
When examining biopsy tissues under a microscope, pathologists look for signs of abnormal cell growth to determine whether a tumor is malignant. Among the various diagnostic approaches, histopathological examination is considered the gold standard for accurately identifying BRCA. However, manually analyzing these tissue samples can be both time-consuming and susceptible to human error. To address these challenges and improve diagnostic accuracy, the integration of computer-aided diagnosis (CAD) systems [10] has become increasingly important. Researchers have conducted extensive studies on the classification of histopathological images using conventional machine learning (ML) methods, such as support vector machines (SVM) and random forest (RF). These approaches often rely on features related to texture or color to make predictions [11]. While these techniques have made valuable contributions, their accuracy is often limited, and they can result in higher error rates in clinical settings. In recent years, the emergence of deep learning (DL) and advancements in computer vision (CV) have significantly transformed histopathological image analysis. Especially when working with hematoxylin and eosin-stained tissue slides, DL models have demonstrated superior performance by offering more reliable and precise classification capabilities.
The proposed manuscript is organized as follows: A collection of related works and their associated limitations is discussed in Section 2. Section 3 discusses a detailed overview of the proposed methodology. In Section 4, all the experimental details and their results are derived. The manuscript concludes with a summary in Section 5.

2. Literature Review

Over the past decade, the application of artificial intelligence (AI) in BRCA detection has evolved remarkably, particularly through various imaging techniques. In [12], Alirezazadeh et al. proposed an unsupervised domain adaptation method that aims to distinguish between benign and malignant histopathological images. Their work tackled the challenge of limited labeled data, though it sometimes struggled with accuracy in more complex scenarios. In [13], Budak et al. developed a hybrid model that fused fully convolutional networks (FCNs) with bidirectional long short-term memory (Bi-LSTM) networks, capturing both spatial and temporal features. While effective, the model introduced a higher computational burden. Singla et al. in [14] proposed a two-step classification system where genetic algorithms (GAs) were used for selecting features, followed by classifiers like multilayer perceptron (MLP), RF, and naive Bayes (NB). Despite its innovative design, the method was vulnerable to noise and high-dimensional data complications. George et al. in [15] designed a NucTraL framework, which applied convolutional neural networks (CNNs) to extract nucleus-level features and applied SVM with classifier fusion. This improved accuracy came with increased system complexity.
In terms of transfer learning (TL), a novel approach in [16] applied the VGG-19 model to histopathological images, successfully transferring learned knowledge from large datasets. However, its performance largely depended on how closely the new data matched the training domain. Irumhirra et al. introduced the Pa-DBN-BC model, which used a patch-based Deep Belief Network (DBN) in combination with logistic regression to map structural information [17]. Although promising, it required extensive manual preprocessing. In [18], Guangli Li et al. proposed the MA-MIDN framework that brought together mutual learning, multi-view attention, and multiple instance learning pooling. Despite its innovation, it remained sensitive to errors at the patch level. Das et al. presented a unique stacked ensemble model that turned one-dimensional data into images using Convex Hull and t-SNE techniques, followed by CNN classification [19]. While this enhanced accuracy, it demanded considerable computational resources. Gupta et al. in [20] crafted a CNN model capable of processing histopathology images across different magnification levels, improving its adaptability, though challenges in normalization across resolutions persisted.
More recently, there has been a growing emphasis on broad reviews and the development of versatile frameworks. In [21], Mohiuddin et al. discussed the transformative role of AI in improving diagnostic precision, while also emphasizing the importance of validating these methods in clinical settings. Khalid et al. developed a CNN model for mammogram analysis that incorporated feature selection to enhance performance [22]. However, they noted the need for broader dataset testing to ensure generalizability. Sharafaddini et al. provided an extensive review of 68 studies covering imaging modalities like mammography, MRI, ultrasound, and thermography [23]. Their findings highlighted CNNs as the most frequently adopted models but also pointed out ongoing concerns such as limited data availability and lack of interpretability. In [24], Nassih et al. introduced a novel classification approach using the Patient Rule Induction Method (PRIM). This framework allowed for subgroup analysis with a focus on interpretability and achieved strong results on the Wisconsin dataset. Collectively, these studies illustrate a diverse landscape of AI-driven approaches in BRCA detection, each with unique contributions and limitations, paving the way for more integrated and clinically viable solutions.

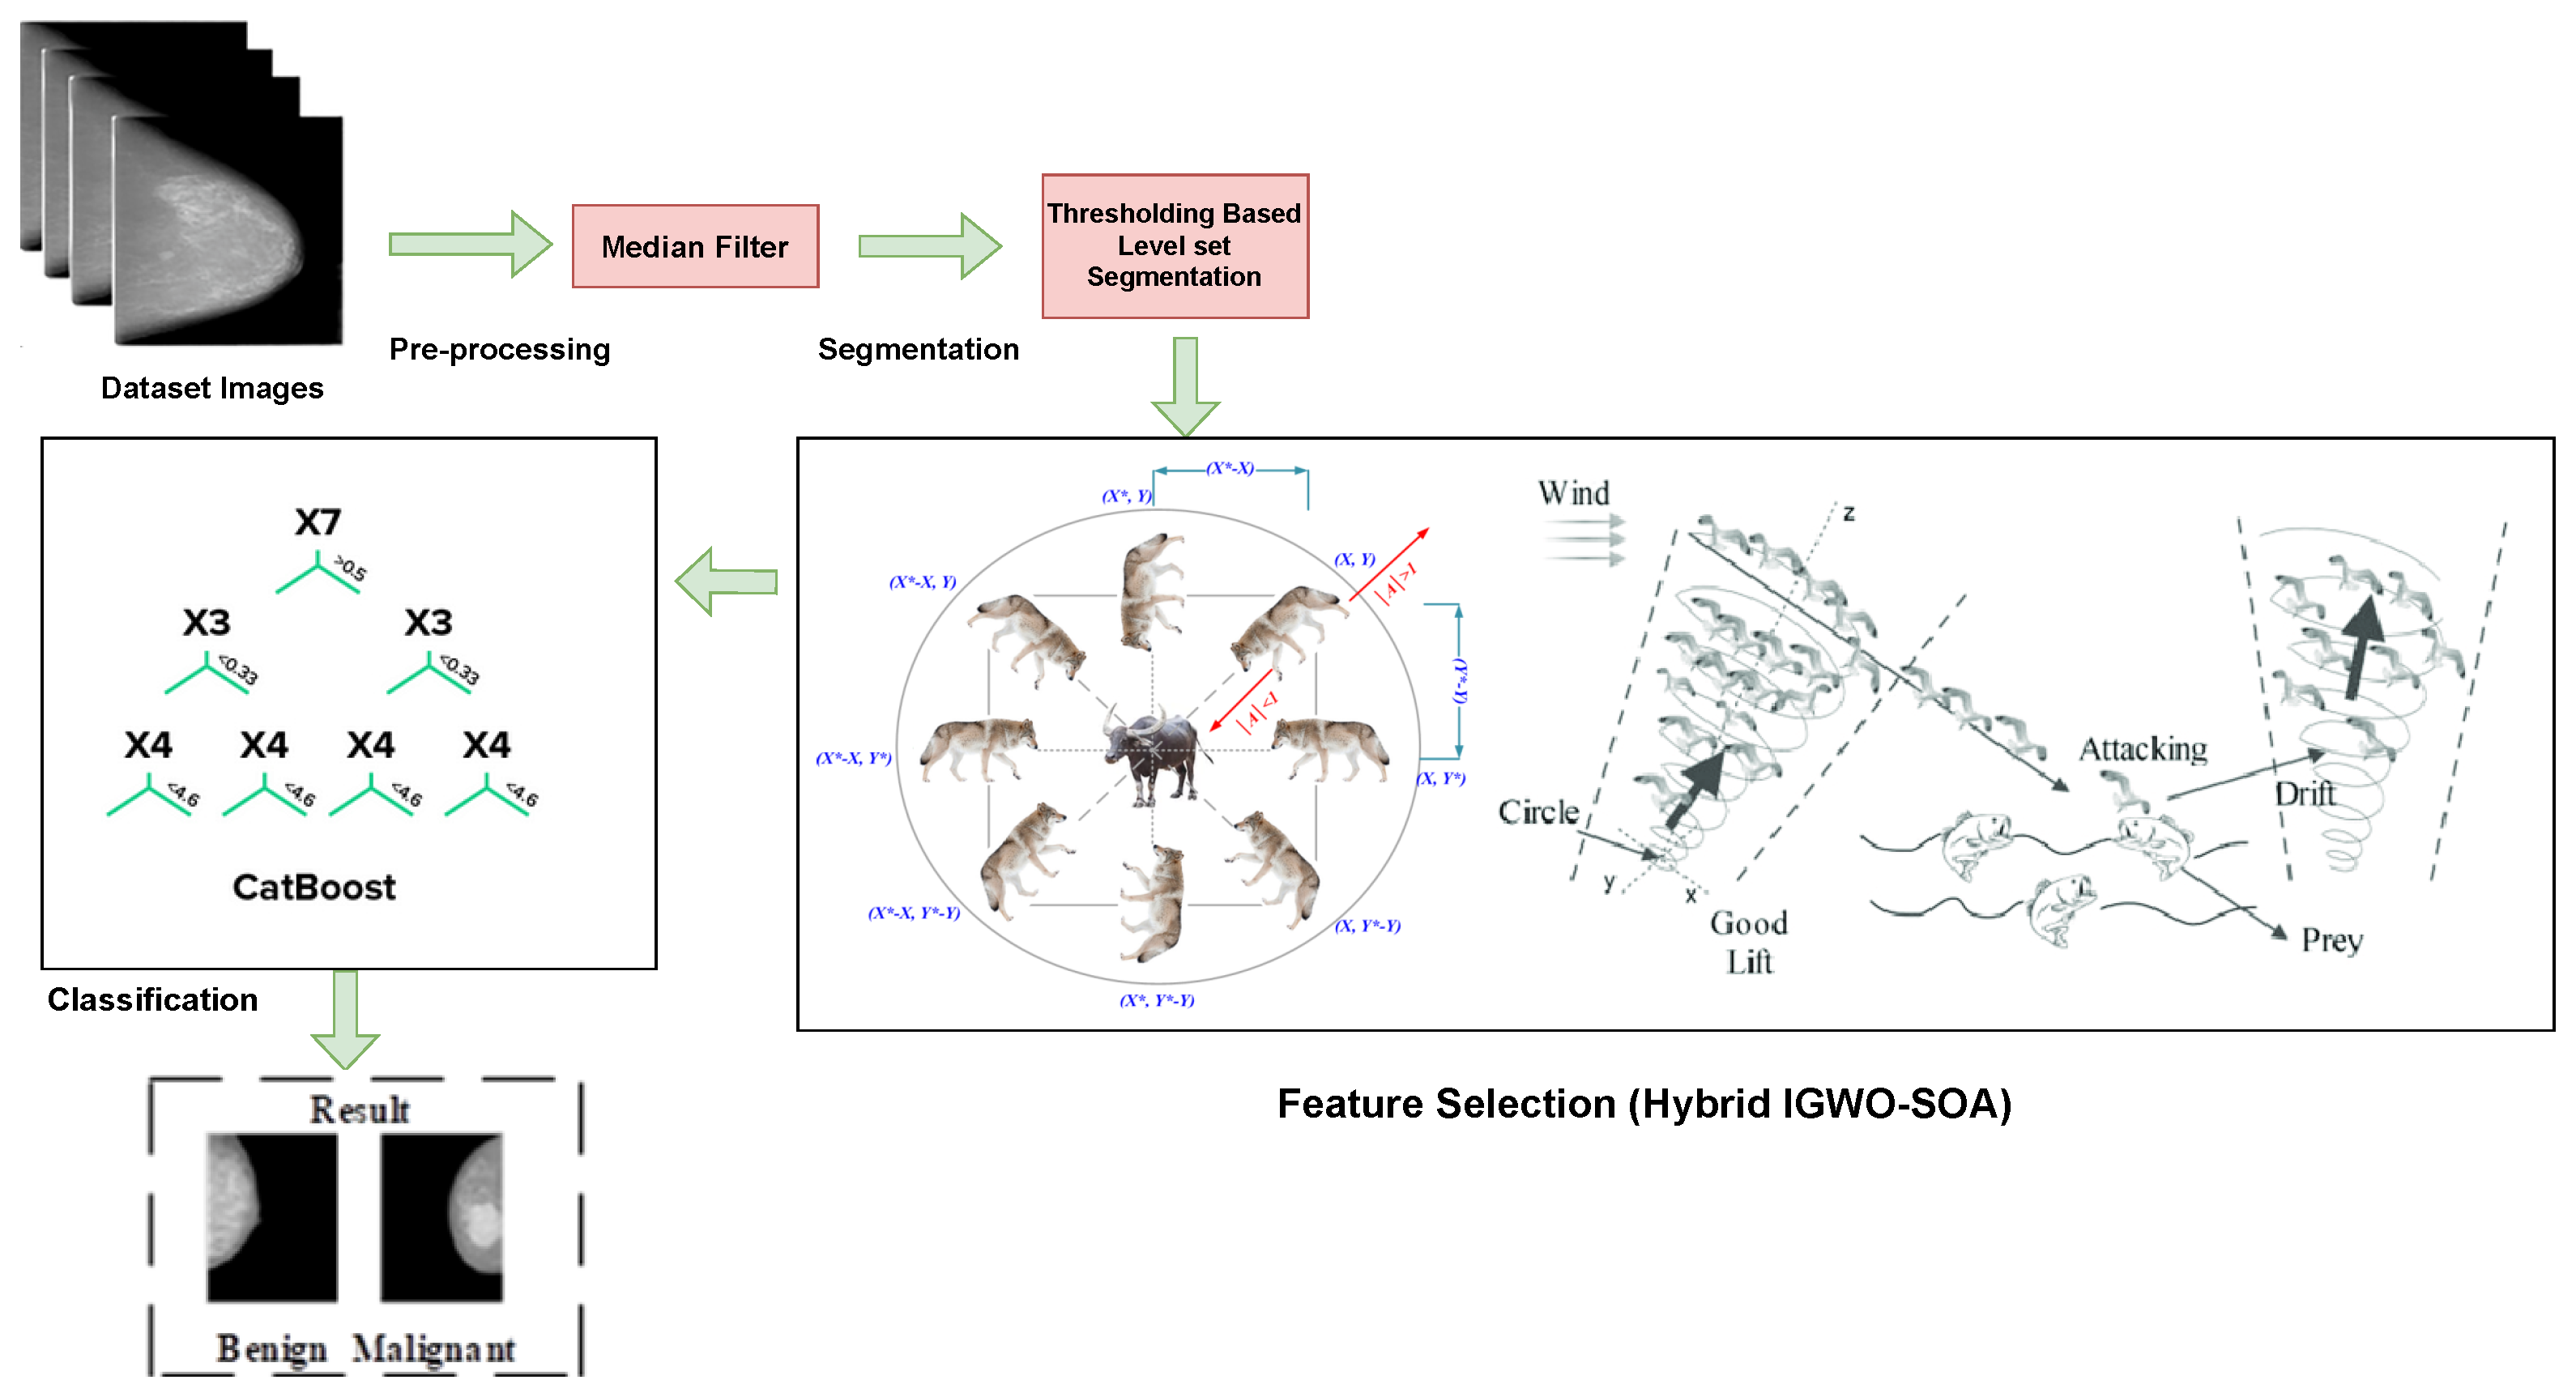
3. Proposed Methodology

Detecting and classifying BRCA involves a carefully structured four-step process: image pre-processing, breast segmentation, feature selection, and classification. The process begins by collecting mammogram images from the CBIS-DDSM dataset. These images undergo pre-processing to enhance their quality and remove noise that may obscure critical details. At this stage, a median filter is applied to boost contrast and eliminate impulse noise, all while maintaining the integrity of the breast tissue’s structure. Once the images are pre-processed, the next step is to segment the ROI from the image. This segmentation task uses a combination of level set methods and adaptive thresholding, which work together to precisely identify the region of interest that will be analyzed in the following stages. After segmentation, the focus shifts to selecting the most relevant features from the breast region. To accomplish this efficiently, a hybrid optimization algorithm IGWO–SOA, is introduced. Inspired by the natural behavior of seagulls, especially how they dynamically adjust their flight angles and speeds during migration, this method enhances the algorithm’s ability to perform a thorough global search. As a result, it focuses on the most important features, reduces data, and improves the performance of the final classifier. These selected features are then passed into a refined deep convolutional neural network (DCNN), which not only classifies the breast tissue but also learns deeper patterns and characteristics automatically. By integrating the IGWO–SOA optimization method with the DCNN model, the system achieves higher accuracy and reliability in diagnosing BRCA. The complete workflow of this proposed approach is illustrated in Figure 1 and explained in detail in the following sections.

3.1. Pre-Processing

The input mammogram images are processed using the median filtering method. This filter is used to reduce or identify the picture edges by limiting the pixels of low or high frequencies. It also removes noise from images. Noise in the mammogram image is reduced using a non-linear filtering method called median filtering. The main purpose of this filter is to replace disruptive pixels with the median value of neighboring pixels, which are organized based on the grayscale level of the image. Equation (1) yields the outcome of I n M F upon application of the median filter [25] to the input image I n H E .
I n M F ( a , b ) = m e d I n H E ( a x , b y ) x H
I n H E and I n M F are used to represent the median and original filtered image, respectively.

3.2. Integration of Thresholding-Based Level Set Segmentation

The region segmentation is carried out utilizing level set segmentation based on thresholding, and descriptions of each methodology are provided below. A technique for choosing a threshold based on a few visual properties is the integration of thresholding. The approach chooses a pixel if its threshold value differs from that of the discrete pictures. Furthermore, analyzing the image histograms is a standard method used to determine the threshold value. The integration of thresholding, the appropriate threshold value for bimodal pictures, is determined using a weight update unit. Given an image size of [ M × N ] , the terms μ 1 and μ 2 denote the initial assigned weights, which are subsequently compared to the pixel values of the [ M × N ] image. The weight of each input pixel is updated by selecting the weight that is closest. The learning rate is multiplied by the variance between the nearest weight and the input pixel, which is then added to the nearest weight. The parameter μ 1 is updated when its proximity to the pixel value increases, whereas the parameter μ 2 is updated only when it is in very close proximity to the pixel value. Equation (2)’s mathematical formula can be used to represent it.
μ new = μ old + β · ( pixel μ old )
The equation denotes the learning rate, with the weight given by β = 256 px 256 . The updated weights are then exposed to the image pixel further, and finally, the average of these two weights is taken into account as the threshold value. The method is illustrated by the expression denoted as Equation (3).
I n A T = μ 1 + μ 2 2
The conversion of the image into binary form can be achieved by utilizing a threshold value. In image processing, pixels falling within a certain range below a designated I n A T value are typically classified as background, while those falling above the I n A T value are classified as object. This approach facilitates the discrimination of objects from their background in an image. The utilization of level set segmentation proves to be efficient and advantageous in this particular scenario for the purpose of photo segmentation. The fundamental concept involves characterizing surfaces or curves as a zero-level subset of a hypersurface with higher dimensions. The method of categorization using level sets not only provides accurate numerical results but also allows for convenient topological modifications. The following is the definition of the surface’s smoothing function φ ( a , b , t ) , whereas the curve definitions are written as φ ( a , b , t ) = 0. Consequently, the creation of a 3D level set function is derived from the creation of the curve. Consider a level set function denoted by φ ( a , b , t ) = 0. The curve is represented by the symbol of its zero-level set. The surface is partitioned into two sections, one internal and one external, using the curve as the dividing line. Equation (4) yields the SDF at the surface. Here, s d stands for the shortest distance between the curve and the point x on the surface.
φ ( a , b , t ) = 0 = s d
During the development phase, Equation (5) accurately represents the points on the curve. The movement equation for the common level set is represented by SF in Equation (6). The term “SF” is commonly used to describe a process that plays a role in generating surface and image characteristics. The gradient flow that results from the level set function is what minimizes the overall energy functional, and the level set’s associated energy function is indicated in Equation (7).
φ ( a , b , t ) = 0
φ t S F | Δ φ | = 0
E n g ( φ ) = μ Int ( φ ) + ε ed λ , 0 ( φ ) = μ Ω 0 1 2 ( | Δ φ | 1 ) 2 d x d y + λ Ω 0 ed W ( φ ) d x d y
The equation displayed above represents the internal and external energy as Int ( φ ) and ε ( φ ) , respectively . Furthermore, the symbol μ > 0 represents the factor that penalizes the difference between φ and SDF, while the function ed, which indicates the edge, is defined by Equation (8).
e d = 1 1 + Δ G S σ × I n A T 2
The internal and exterior energy components in the equation above are indicated by Int ( φ ) and ε ( φ ) , respectively. It offers the edge indicator function ed, which incorporates a parameter μ > 0 that determines the extent to which deviations from SDF are penalized.

3.3. Mammogram Image Feature Selection Using Hybrid Meta-Heuristic Algorithm (IGWO–SOA Optimization)

The following is a description of the methodology used for the feature selection using the IGWO–SOA, a hybrid algorithm for tackling global optimization problems, which is a novel contribution to the feature extraction. While both the Improved Grey Wolf Optimizer (IGWO) [26] and the Seagull Optimization Algorithm (SOA) have been individually applied to various optimization problems, their combination into a unified hybrid (IGWO–SOA) model marks a novel methodological advancement. This fusion leverages the exploitation strength of IGWO with the exploration ability of SOA, enabling a more balanced and efficient feature selection process. Although these algorithms exist independently in the literature, no prior study has effectively integrated them into a single framework for medical imaging applications. The true novelty lies not just in the hybrid design but also in its targeted use for breast cancer detection, a domain where early diagnosis is critical and high-dimensional imaging data demands sophisticated feature selection. By applying the IGWO–SOA model to extract the most relevant features from mammographic or histopathological images, this study introduces a fresh approach to reducing computational load while improving classification accuracy. To the best of our knowledge, this is the first attempt to deploy the IGWO–SOA hybrid in the context of breast cancer diagnosis, filling a significant research gap and offering a valuable tool for clinical decision support systems. The primary explanation is that while migrating, seagulls may continuously adjust their attack angle and speed, and the SOA [27] has superior global search capabilities. This primarily combines the IGWO’s grey wolf prey-attacking mechanism with the SOA’s spiral attack behaviours, considerably enhancing both the algorithm’s local and global search capabilities. This subsection presents the mathematical models for the social hierarchy, surrounding prey, hunting, attacking prey, and seeking prey.

3.3.1. Social Hierarchy

When constructing the IGWO, the alpha ( α ), beta ( β ), and delta ( δ ) positions in the social hierarchy of wolves are used to denote the second and third best solutions, respectively. Omega ( ω ) is said to represent the last possible solutions. These three wolves lead, follow, and follow the pack of wolves.

3.3.2. Encircling Prey

During the hunt, the grey wolves surround their victim. The encircling behavior can be described using the subsequent mathematical model, as shown in Equations (9)–(12):
S = R · X α ( t ) X ( t )
α ( t + 1 ) = X α ( t ) P · S
P = 2 · m · r 1 m
R = 2 · r 2

3.3.3. Hunting

The alpha, beta, and delta are usually the ones who lead the hunt since they are more knowledgeable about where the possible prey could be. The leading search agent’s position has changed, so the other search agents need to update their positions accordingly. The update of an agent position can be formulated as follows in Equations (13)–(15):
S m = R 1 · X r 1 X r 3 ; S β = R 2 · X r 2 X r 1 ; S δ = R 3 · X r 3 X r 1
X 1 = X m P 1 · ( D α ) ; X 2 = X β P 2 · ( S β ) ; X 3 = X δ P 3 · ( S )
X ( t + 1 ) = X 1 + X 2 + X 3 3

3.3.4. Attacking Prey

Seagulls use a spiral motion behavior in the air when attacking prey to create a mathematical model for their attack. The following is a description of this behavior in the a, b, and c planes, as shown in Equations (16)–(19):
a = r × cos ( k ) ,
b = r × sin ( k ) ,
c = r × k ,
r = u × e k v
The variables used in the spiral equation are k, which represents a random number between 0 and 2 π , and r, which represents the radius of each turn of the spiral. The letter “e” represents the base of the natural logarithm, while the constants “u” and “v” are used to define the spiral shape. Equations are used to calculate the new position of the search agent. Assuming r is the radius of each turn of the spiral and k is a random number within the interval [0, 2 π ], the base of the standard logarithm is represented by e, while the constants u and v are utilized to determine the spiral’s form. Equation (20) is utilized to calculate the current location of the search agent.
P s ( x ) = D s × a × b × c + P b s ( x )
The distance between the search agent and best-fit search agent is represented by D s . The best solution is saved by P s ( x ) , and the position of other search agents is updated. P b s ( x ) is the best-fit search agent.

3.3.5. Search Prey

Grey wolves [28] have the ability to hunt from different positions relative to prey which is an aptitude that involves exploration. To force the search agent to move away from the prey, A is randomly assigned. The grey wolves are forced to diverge from the prey when |A| > 1. Table 1 offers the pseudo-code for the hybrid (IGWO–SOA) shown in Table 1.

3.4. BRCA Classification System Using Proposed DL Algorithm

Due to its DL parameters in convolution layers, the proposed learning method necessitates a large number of training samples. However, exposing such large training samples causes overfitting concerns with the network. Therefore, in order to avoid overfitting problems, feature extraction is performed before the training process begins. In this publication, a classification method using an optimized DCNN [29] is suggested. The number of DCLs, pooling layers, and epochs are only a few of the hyperparameters that the DCNN passes, along with others like the loss function, activation function, and optimization function.

3.4.1. System Architecture

A distinctive classification system is created that uses convolutional layers, input layers, activation functions, pooling layers, dense layers, and SoftMax output layers to produce multi-stage learning models. The suggested DCNN architecture uses rectified linear units, multiple activation functions, and window widths for non-linearities. A total of five pooling layers with corresponding activation functions were used. A dense/fully linked activation function is created during the classification step. The suggested BRCA classification method uses the SoftMax classification layer. The detailed step-by-step approach is as follows:
The output convolution layer’s size is given by Equation (21):
S OUT = ( 1 K + 2 P ) S + 1
The DCNN model comprises a total of five convolutional layers in its architecture. The initial two strata of the model are responsible for extracting the minimal features of the selected attributes, whereas the ultimate two strata are tasked with acquiring the advanced features. The standard Equation (22) shown below is typically used to represent the convolutional layer’s output:
Y j n = f i C j y i n 1 k i j n + ζ j n
where n = n t h layer. The DCNN network employs the tanh activation function, along with an additive bias that is expressed as a mathematical formulation in Equation (23).
h n i x y = tanh ζ n i + w = 0 w i 1 h = 0 h j W i j w h h i 1 ( x + w ) ( y + h )
The probability is given by Equation (24):
x w , h n , k = max ( w , h , i , j ) p x w , h n 1 , k u ( i , j )
This BRCA classification system is a multi-class classification problem. The hypothesis function h ϕ ( x ) for the SoftMax regression layer is being utilized, as in Equations (25) and (26).
h ϕ ( x ) = 1 1 + e ( ϕ T x )
J ( Φ ) = 1 m i = 1 m j = 0 l l { y i = j } log p y i = Z | x i ; Φ
In the SoftMax regression layer, the classification probability for classifying an input x as category Z is given as Equation (27):
p ( y i = Z | x i ; Φ ) = e Φ j T x i l = 1 k e Φ j T x i
In this suggested technique, IGWO–SOA is used for adjusting the suitable hyperparameters in order to achieve lower design parameters, a quick convergence rate, and high efficiency, as shown in Table 2. As a result, the suggested technique is highly effective in increasing classification accuracy. The subsequent section provides a full overview of the proposed IGWO–SOA algorithm.

3.4.2. Hyper-Parameter Tuning Using LWO

The selection of hyperparameters is a crucial step in improving the performance of DL models. As such, it is important to employ appropriate techniques to enhance the tuning process. Particularly challenging is the process of tuning complex architectures such as DCNNs. Furthermore, the utilization of a hybrid approach that combines the IGWO algorithm with SOA for the purpose of addressing optimization problems related to the selection and tuning of hyperparameters yields significant distinctions when compared to alternative optimization methods. The explanation for choosing a hybrid IGWO–SOA approach is to improve the rate of convergence of SOA.
The reality of hyperparameter tuning has a significant impact on the preparation of a DL approach for BRCA classification. An optimization-driven classification model is developed going forward to allow the hyperparameters in the proposed classification system to be tuned. Table 3 shows the flow of the hybrid IGWO–SOA for adjusting hyper-parameters. A shared population space between IGWO and SOA is managed by the suggested algorithm, the hybrid IGWO–SOA. In order to maintain population diversity, it is imperative to prevent premature convergence, while expediting convergence is a crucial aspect of the seagull optimisation process. Due to the expedited convergence rate facilitated by this approach, the efficacy and results could be maximized. As was discussed in the section above, adjusting the parameters of the DCNN results in enhanced performance.

4. Results and Discussions

4.1. Dataset Description: CBIS-DDSM

The mammogram images used in this study were sourced from the CBIS-DDSM dataset [30], which includes a total of 891 cases showing breast masses captured in both mediolateral oblique (MLO) and craniocaudal (CC) views. For analysis purposes, the dataset was divided into two parts: 691 cases were allocated to the training set, while the remaining 200 cases formed the test set. Each image in the collection comes with detailed annotations, providing insights into the nature and classification of the detected abnormalities. Among the 200 test cases, 152 were specifically examined, with 89 identified as benign and 63 diagnosed as malignant. Some samples of the used dataset are shown in Figure 2.
The proposed model suggested here employs data augmentation to increase the number of images used in different phases. A total of 1920 ROIs were generated and used for both the healthy and cancerous categories during the training process. The dataset has been randomly partitioned into three groups. The training set comprises 75% of the data, with 720 benign and 720 malignant cases. The validation set contains 8.33% of the data, with 80 benign and 80 malignant cases. Finally, the testing set consists of 16.67% of the data, with 160 healthy and 160 cancerous cases.

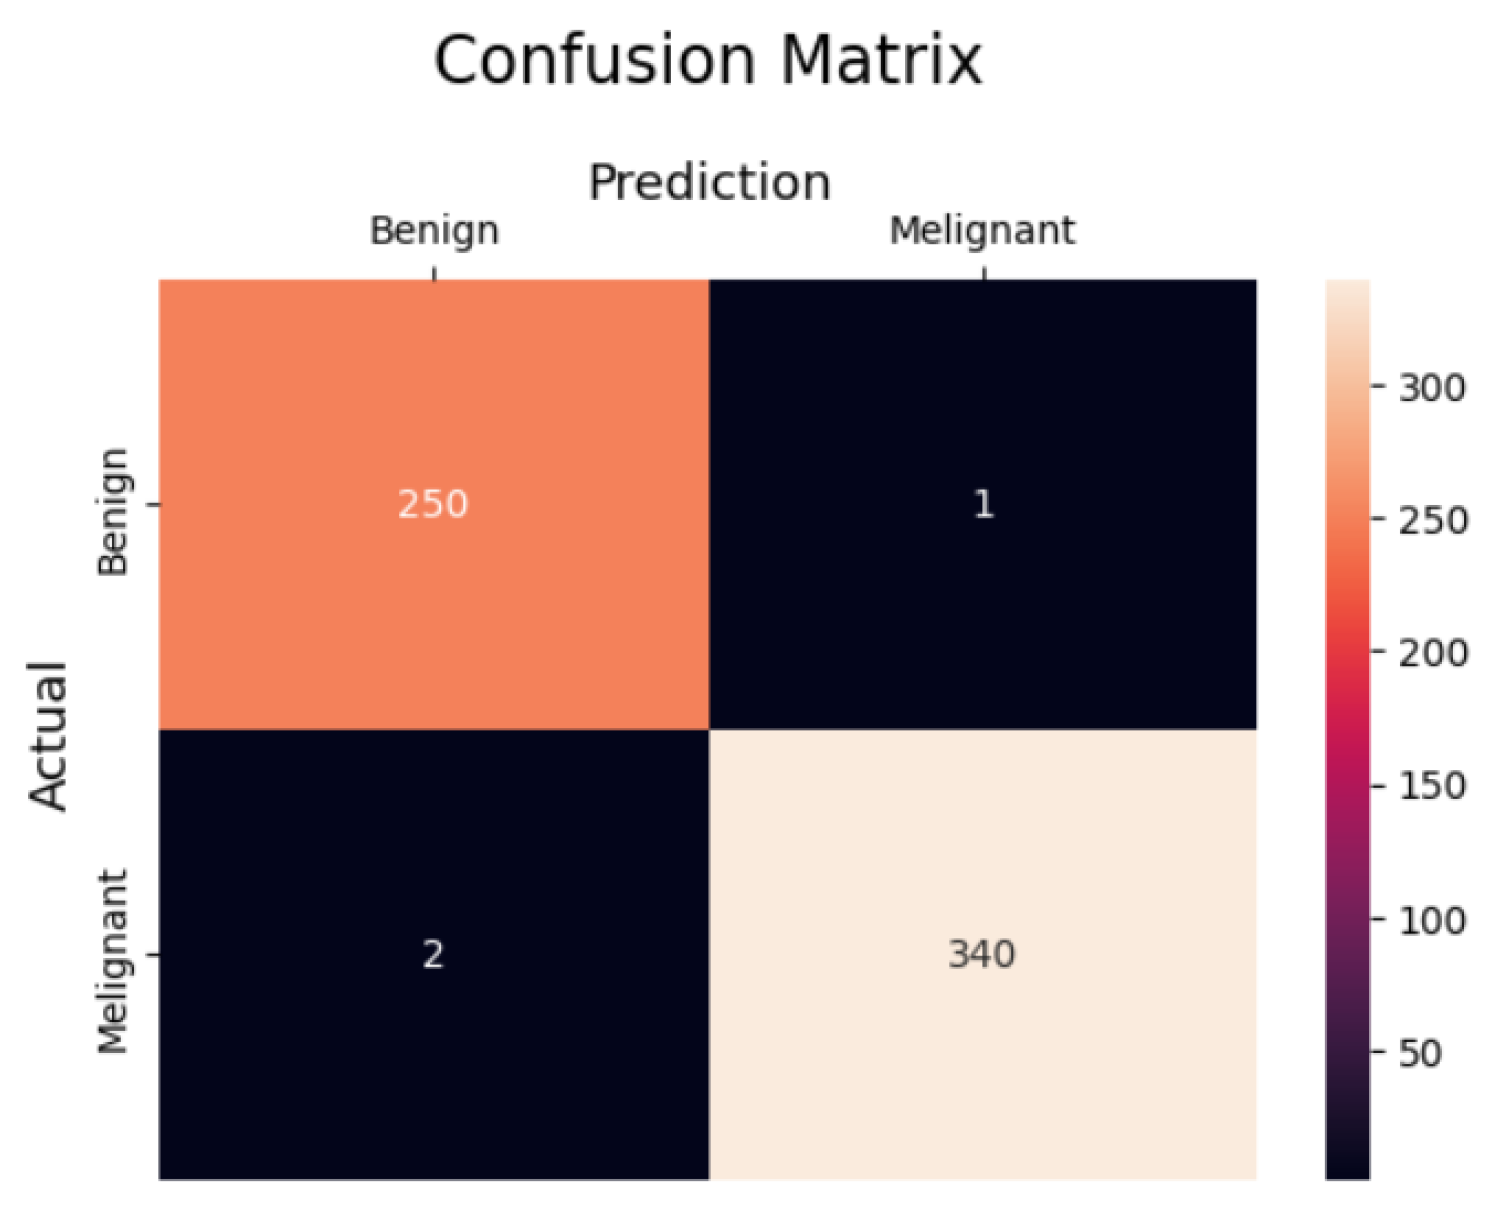
4.2. Evaluation Metrics

Accuracy: The accuracy is the ratio of correctly classified mammogram images to the total number of mammogram images, as in Equation (28).
A c c u r a c y = ( T P + T N ) ( T P + T N + F P + F N )
Precision: The precision is the proportion of accurately classified positive mammogram images to the overall number of mammogram images that were predicted as positive in Equation (29).
P r e c i s i o n = T P ( T P + F P )
Recall: The recall metric refers to the proportion of correctly classified positive mammogram images out of the total number of positive mammogram images, as in Equation (30).
R e c a l l = T P ( T P + F N )
F1_Score: The F1 Score is the mean harmonic value of recall and precision, as in Equation (31).
F 1 s c o r e = 2 × ( R e c a l l × P r e c i s i o n ) R e c a l l + P r e c i s i o n
Specificity: The term specificity refers to the proportion of accurately classified negative mammogram images to the total number of negative mammogram images, as in Equation (32).
S p e c i f i c i t y = T N ( T N + F P )
FDR: The term FDR represents the rate of false discoveries. To determine the FDR, divide the total number of positively categorized mammogram images by the number of falsely categorized positive mammogram images, as in Equation (33).
F D R = F P ( F P + T P )
FNR: FNR refers to the proportion of false negatives. The false negative rate (FNR) represents the percentage of negative mammogram images that are incorrectly classified as positive, as in Equation (34).
F N R = F N ( F N + T P )
FPR: The term FPR denotes the rate of false positives. The FPR is calculated by dividing the number of negative mammogram images by the number of mammogram images that were incorrectly classified as positive in Equation (35).
F P R = F P ( F P + T N )
MCC: The term MCC represents the Matthews correlation coefficient. The MCC is a measure of correlation that is computed using four values: TP, TN, FP, and FN, as in Equation (36).
M C C = ( T P × T N ) ( F P × F N ) ( T P + F P ) ( T P + F N ) ( T N + F P ) ( T N + F N )
NPV: NPV stands for the inverse of positive predictive value, also known as the false negative rate. The negative predictive value (NPV) refers to the ratio of correctly identified negative mammogram images to the total number of mammogram images that were identified as negative in Equation (37).
P r e c i s i o n = T P ( T P + F P )
AC: The accuracy coefficient (AC), as in Equation (38), plays a key role in evaluating mass detection performance. The accuracy coefficient (AC) serves as a vital compass in gauging how well a mass detection system performs. Rather than relying on raw counts of true positives or false alarms alone, AC blends precision and recall into a single value, revealing the system’s ability to pinpoint true masses without being misled by noise. A higher AC not only means the algorithm is adept at catching actual masses but also that it minimizes unnecessary alerts, striking a balance that is crucial in clinical settings. By summarizing both sensitivity and specificity, the accuracy coefficient offers a transparent, straightforward measure to trust, compare, and ultimately improve mass detection methods.
A C = Number of correctly detected images Total number of images × 100 %

4.3. Experimental Setup

This section outlines the dataset employed in the study and presents an analysis of the experimental outcomes, along with an evaluation of the effectiveness of the proposed computer-aided detection (CAD) system designed for mammogram image analysis. The CAD system is fully automated, capable of handling mammogram images from four separate databases without requiring any manual input. All experiments were carried out using a system configured with an Intel Core i7 processor, 16 GB of RAM, and an NVIDIA GeForce GTX 1060 GPU, running in a Python environment. To ensure reproducibility of the proposed IGWO–SOA-based breast cancer detection framework, the implementation was carried out using Python 3.8, along with key libraries such as NumPy (1.21.2), Pandas (1.3.3), TensorFlow (2.6.0), Scikit-learn (0.24.2), and OpenCV (4.5.3). To assess the model’s performance, learning curves were analyzed to monitor accuracy and loss throughout the training and testing phases of various algorithms. These evaluations were essential in guiding refinements to the model’s setup, ensuring that the framework could effectively detect BRCA tumors. The primary objective was to construct a DCNN framework that not only delivers high performance but also adapts well to practical applications. Particular attention was given to minimizing the generalization gap between training and testing results to prevent overfitting. Signs of overfitting, such as a much lower training loss compared to validation loss or significantly higher training accuracy, were carefully monitored. The experiments aimed to achieve a balanced model configuration where both training and testing losses remain close and stable, minimizing any erratic behavior. Upon the completion of each experiment, the various model configurations were compared to identify the most robust and reliable DCNN model across the pre-trained architectures. This is achieved by evaluating the results based on the specified criteria:
1.
Test accuracy;
2.
Test loss;
3.
Generalization gap;
4.
The difference in accuracy between the training and testing sets.
At first, the DCNN model is trained using the Adam optimizer with hyper-parameters that are chosen in the following manner:
  • Batch size (BS) = 32;
  • Learning rate (LR) = 1 × 10 4 ;
  • L2-Regularization (l2-Reg.) = 1 × 10 4 ;
  • Number of Iteration = 100;
  • Number of Epoch = 50;
  • Population Size = 30.

4.4. Experimental Results

An essential step in assessing classification performance is the construction of a confusion matrix. Figure 3 presents the confusion matrix generated from the test images used in this study. This matrix provides a detailed breakdown of the model’s predictions for distinguishing between healthy and cancerous breast tissue. The results indicate that the model accurately classified 250 benign cases and 340 malignant cases, closely matching the actual labels. However, there were a few misclassifications: one benign case was incorrectly identified as malignant (false positive), and two malignant cases were misclassified as benign (false negatives). Overall, the model exhibits a strong ability to accurately detect both benign and malignant BRCA cases, reflecting its reliability and effectiveness in clinical classification tasks.

4.4.1. Performance of the Classifier Without and with Feature Selection

The performance metrics of the BRCA classification model are summarized in Table 4, comparing results obtained using two approaches: with feature selection and without feature selection. When feature selection was applied, the model achieved an impressive accuracy of 99.4%, which indicates that nearly all predictions were correct. Precision reached 99.2%, indicating that the vast majority of predicted positive cases were accurately classified. The recall stood at 99.1%, showing the model’s strong ability to correctly identify actual positive cases. The F1-score, which balances precision and recall, was 99%, and the specificity, reflecting accuracy in identifying negative cases, was also high at 99.1%. In contrast, the model without feature selection showed a reduced performance. It achieved an accuracy of 96.5%, with a precision of 96.2% and a recall of 97%. The F1-score was slightly lower at 96.4%, and specificity dropped to 96%, suggesting a modest decline in the model’s ability to distinguish negative cases. These findings highlight that incorporating feature selection significantly enhances the model’s performance across all key metrics, leading to more accurate and reliable classification of BRCA cases.

4.4.2. 5-Fold Cross-Validation Analysis

The 5-fold cross-validation method [31] was employed to assess the performance of the classification model developed for BRCA detection. This approach involves dividing the dataset into five equal parts, or folds. During each iteration, one fold is designated as the test set, while the remaining four are used for training. This process is repeated five times, ensuring that each fold serves as the test set once. Table 5 presents the evaluation metrics for the model before applying feature selection, based on this cross-validation process. In this work, 5-fold cross-validation was selected over the more common tenfold method to ensure a balance between computational efficiency and reliable performance evaluation. Due to the high computational demands of the hybrid IGWO–SOA optimization and DNN training, using 10 folds would have significantly increased the training time without offering substantial improvement in result stability. Prior research also indicates that 5-fold cross-validation provides comparable reliability to 10-fold, particularly in complex models, while considerably reducing computational overhead. The metrics include accuracy, precision, recall, F1-score, and specificity, reported for each fold as well as the overall average. The results reveal that the model maintained consistent and solid performance across all folds. On average, the model achieved an accuracy of 96.46%, indicating that the majority of its predictions were correct. The average precision was 96.44%, reflecting a high proportion of correctly predicted positive cases. The recall averaged 95.76%, demonstrating the model’s ability to effectively identify actual positive cases. The F1-score, which provides a balanced view of both precision and recall, had an average of 96.7%. Meanwhile, the average specificity was 96.22%, showcasing the model’s reliability in correctly identifying negative cases. These findings suggest that, even before feature selection, the model exhibited a strong and balanced performance across key classification metrics.
The results of the cross-validation analysis are summarized in the accompanying Table 6, which highlights the performance of the model at each level. The model achieved an impressive average accuracy of 99.46%, underscoring its strong ability to make reliable predictions. Precision scores ranged from 98.6% to 99.5%, reflecting the model’s consistent accuracy in identifying true positive cases. Similarly, recall values between 99% and 99.5% indicate a high level of sensitivity in detecting actual positive instances. The F1-score, which balances precision and recall, varied from 98.9% to 99.2%, further emphasizing the model’s stable and effective classification performance. In addition, specificity values spanning from 99% to 99.4% highlight the model’s accuracy in recognizing negative cases. Collectively, these metrics demonstrate the strength and reliability of the BRCA classification approach, particularly when feature selection is applied, enabling the model to perform consistently well across all folds of the dataset.

4.4.3. Comparison Results
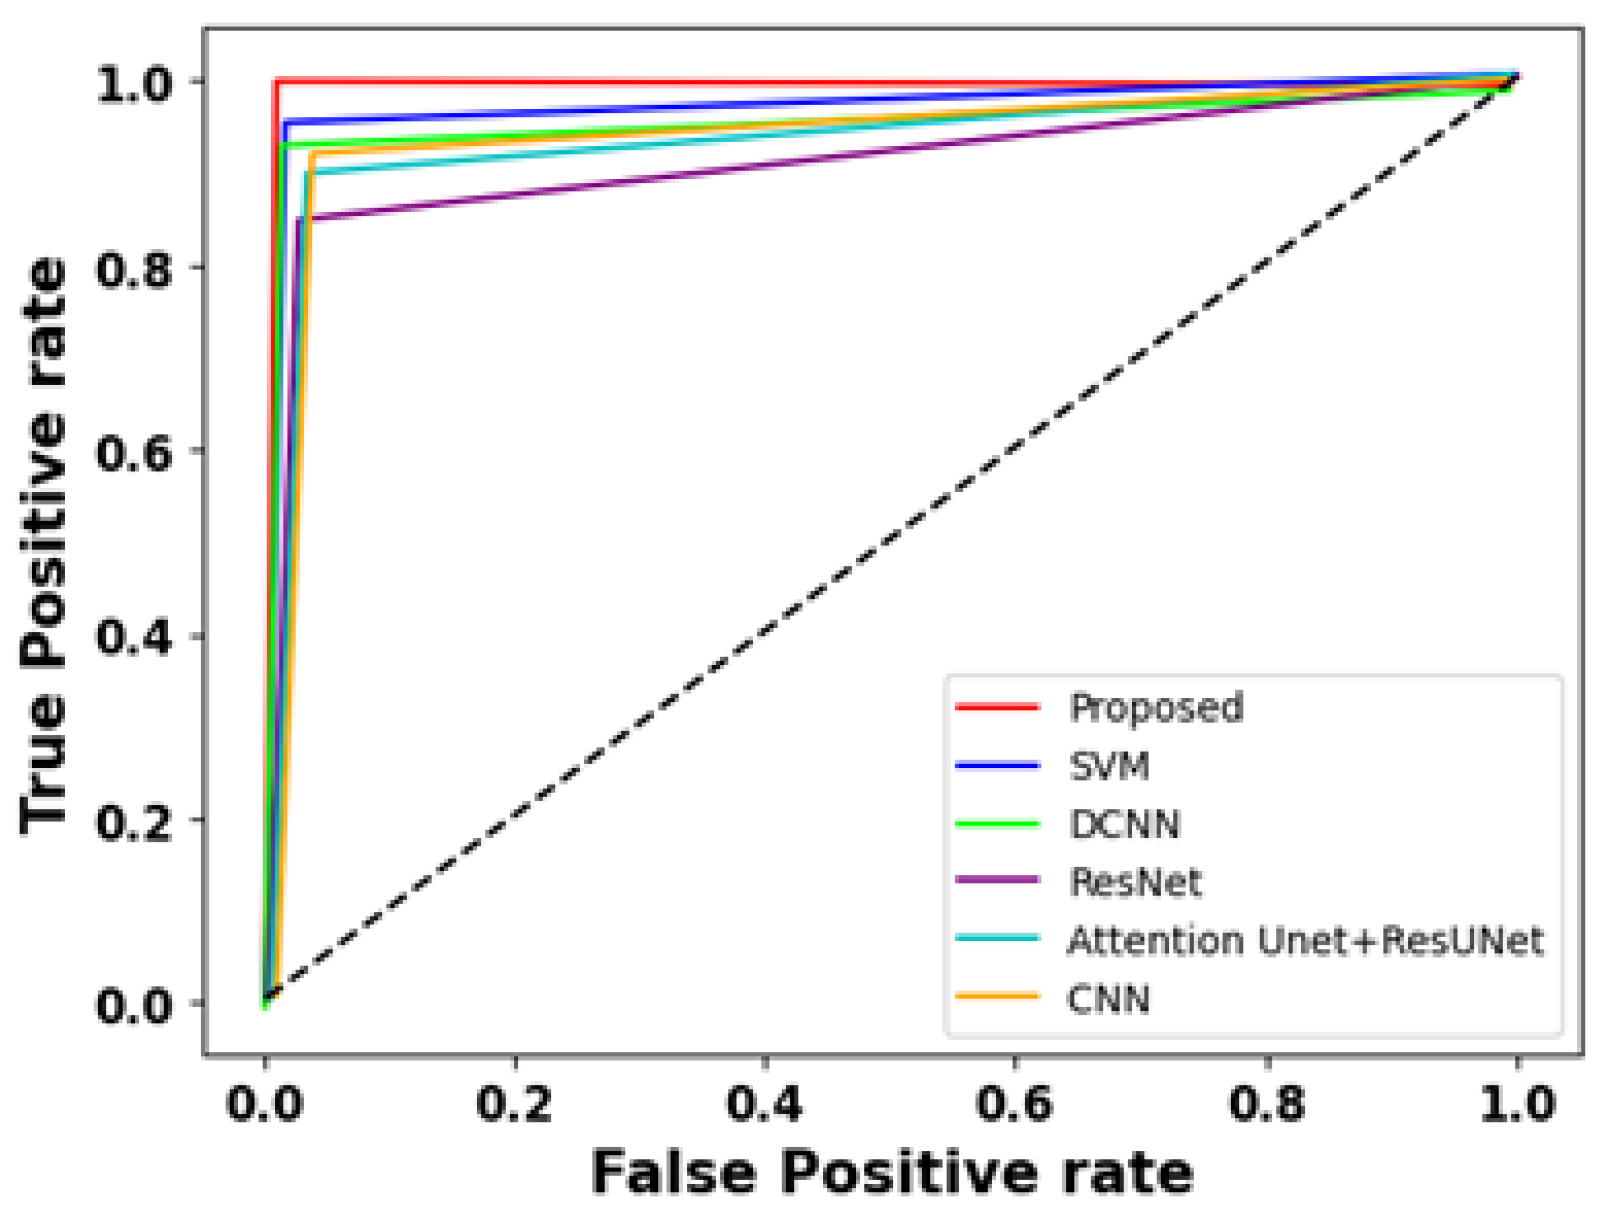
The tabular column displays the performance metrics of several techniques used for BRCA classification in Table 7, including the proposed technique, SVM [32], DCNN [33], ResNet [34], Attention Unet+ResUNet [35], CNN [36], and three recently developed deep learning models: PTr (Pyramid Transformer + SAM) [37], CBAM-EfficientNetV2 [38], and PRMS-Net [39]. The metrics assessed are accuracy, precision, recall, F1-score, and specificity, which provide a comprehensive evaluation of each technique’s effectiveness. Starting with the proposed technique, it achieved the highest accuracy of 99.4%. This indicates that the model’s predictions aligned with the actual labels in 99.4% of the cases. It also demonstrated high precision (99.2%), indicating a low rate of false positives, and high recall (99.1%), suggesting a low rate of false negatives. The F1-score of 99% signifies a balanced performance between precision and recall. Additionally, the proposed technique showed a specificity of 99.1%, indicating its proficiency in correctly identifying negative cases. In comparison, PTr recorded an accuracy of 99.3%, precision of 99.1%, recall of 98.9%, F1-score of 98.8%, and specificity of 99.0%, positioning it closely behind the proposed technique in terms of overall performance. PRMS-Net also demonstrated strong performance, with an accuracy of 99.2%, precision of 99.0%, recall of 98.8%, F1-score of 98.9%, and specificity of 98.7%. CBAM-EfficientNetV2 showed slightly lower yet competitive results, with an accuracy of 99.1%, precision of 98.6%, recall of 98.4%, F1-score of 98.3%, and specificity of 98.5%. Moving on to the other techniques, SVM achieved an accuracy of 98.4%, reflecting its ability to classify BRCA cases with a high level of accuracy. It exhibited a precision of 97.5%, a recall of 98%, and an F1-score of 97.5%, indicating its effectiveness in both identifying positive cases and minimizing false positives. However, its specificity was only 96.5%. DCNN demonstrated an accuracy of 95.4%, precision of 94.20%, recall of 94.30%, and an F1-score of 95%. These metrics indicate its capability to identify positive cases, although it had a relatively lower performance compared to the proposed technique and SVM. Its specificity was 95.2%. ResNet achieved an accuracy of 96.5% and displayed a precision of 96.4%, recall of 96.2%, and an F1-score of 95.4%. These results suggest its effectiveness in classifying BRCA cases, although it had a slightly lower specificity of 95%. Attention Unet+ResUNet achieved an accuracy of 96.8%. It demonstrated a precision of 95.4%, recall of 92.5%, and an F1-score of 93.5%, indicating its ability to identify positive cases with relatively good precision. However, it had a lower recall and specificity of 92.5% and 94.5%, respectively. CNN achieved an accuracy of 97.5% and demonstrated a precision of 96.3%, recall of 96%, and an F1-score of 96.8%. These metrics indicate its capability to identify positive cases with a good balance between precision and recall. Its specificity was 97%. In summary, the proposed technique achieved the highest accuracy and demonstrated excellent performance across all metrics.
Table 8 displays the results for various performance metrics of a BRCA classification model. The FDR value of 0.003 indicates that the predicted positive cases are false positives, suggesting a relatively lower rate of incorrect positive predictions. The FNR value of 0.001 indicates a very low rate of false negatives, implying that the model is effective in correctly identifying the majority of positive cases. The FPR value of 0.002 signifies a low rate of incorrectly classifying negative cases as positive. The MCC value of 0.987 reflects a strong correlation between the predicted and actual labels, indicating the model’s effectiveness in capturing the true relationship between the features and the BRCA classification. Finally, the NPV value of 0.997 indicates a high probability of accurately identifying negative cases, emphasizing the model’s effectiveness in correctly classifying the majority of negative cases. Overall, the results suggest that the model performs well in terms of minimizing false negatives, maintaining a low false positive rate, and demonstrating a strong overall correlation between predicted and actual labels.
An ablation study was conducted to isolate and evaluate the individual contributions ofIGW O, SOA, and their hybrid combination (IGWO–SOA) within the proposed BRCA classification framework, as shown in Table 9. Separate experiments were performed using each optimization technique independently, as well as using the hybrid model, while maintaining identical experimental settings to ensure a fair comparison. The performance of each approach was assessed using key evaluation metrics such as accuracy, precision, recall, F1-score, and specificity. The results revealed that the IGWO-based model achieved an accuracy of 97.8%, while the SOA-based model achieved 97.1%. Although both algorithms individually enhanced the model’s classification ability, the hybrid IGWO–SOA model achieved significantly higher accuracy of 99.4%, along with improved precision, recall, F1-score, and specificity. This indicates that the hybrid approach offers a more effective balance between exploration and exploitation during the optimization process, leading to superior hyperparameter tuning and improved generalization of the DNN. The ablation study confirms that the enhanced performance of the proposed technique is primarily driven by the combined strengths of both IGWO and SOA, rather than the isolated contribution of either algorithm.

4.4.4. ROC Analysis

The receiver operating characteristic (ROC) curve, as shown in Figure 4, offers a visual representation of a binary classification model’s effectiveness across different threshold settings. It plots the true positive rate (sensitivity) against the false positive rate (1-specificity), providing a comprehensive view of a model’s performance. A key metric derived from the ROC curve is the area under the curve (AUC), which quantifies the model’s ability to distinguish between classes. A higher AUC indicates stronger discrimination and overall classification accuracy. In this study, the proposed method demonstrated exceptional performance, achieving an AUC of 0.99, highlighting its strong capability to differentiate between malignant and benign BRCA cases. Comparatively, the SVM achieved an AUC of 0.95, while both the DCNN and CNN models recorded AUC values of 0.92, reflecting solid classification performance. The ResNet model, with an AUC of 0.84, showed a relatively lower but still acceptable ability to distinguish between classes. Meanwhile, the Attention U-Net combined with ResUNet achieved an AUC of 0.89, indicating moderate effectiveness. Overall, AUC values derived from ROC analysis serve as a reliable metric for evaluating and comparing the performance of different models, offering valuable insight into their ability to accurately classify BRCA cases.
BRCA remains a significant cause of mortality among women, particularly in developing and underdeveloped regions, where early detection is crucial for effective treatment. This study introduces an innovative hybrid model that combines IGWO with SOA, forming the IGWO–SOA technique to enhance BRCA detection accuracy. The hybrid model draws inspiration from the adaptive and strategic behaviors of seagulls, especially their ability to dynamically change attack angles, to effectively tackle complex global optimization challenges. A DNN is fine-tuned using this hybrid optimization method to address the challenges of hyperparameter selection and overfitting, which are common in DL approaches for BRCA classification. The proposed IGWO–SOA model demonstrates exceptional performance in identifying key attributes that contribute to accurate cancer detection using the CBIS-DDSM dataset. Its effectiveness is validated using performance metrics such as loss, F-measure, precision, accuracy, and recall. Notably, the model achieved an impressive accuracy of 99.4%, outperforming existing methods in the domain. By optimizing both the learning parameters and model structure, the IGWO–SOA approach presents a robust and reliable framework for early BRCA detection, offering significant potential in improving diagnostic precision and saving lives through timely medical intervention.

4.4.5. Limitations

Although the IGWO–SOA-based DNN exhibits outstanding performance in BRCA detection, several technical limitations should be acknowledged. Primarily, the model’s generalizability remains a concern, as it has been exclusively trained and validated on the CBIS-DDSM dataset. This raises the possibility of reduced robustness when applied to other datasets with different imaging modalities, resolutions, or demographic distributions. Furthermore, the hybrid optimization process, while effective in fine-tuning hyperparameters, shows a strong dependence on the initial parameter ranges and control factors specific to IGWO and SOA. Slight deviations in these settings could lead to suboptimal convergence or degraded performance, particularly when applied to unseen clinical data. The computational demand for the hybrid model increases significantly with network complexity, posing challenges for scalability and real-time diagnostic applications. Another important limitation is that the proposed model is specifically designed for binary classification, focusing on distinguishing between benign and malignant cases. This is because widely used BRCA datasets such as CBIS-DDSM typically present the classification task as a two-class problem. Binary classification offers a more straightforward model design, simpler decision boundaries, and a less complex performance evaluation. However, adapting the model to multiclass classification would introduce greater complexity, requiring the handling of more intricate patterns, class-specific features, and possible adjustments to both the neural network structure and the optimization strategy to maintain high accuracy across all classes. Future studies should aim to validate the model across multi-institutional datasets, investigate its suitability for multiclass problems, and explore adaptive or automated tuning mechanisms to minimize sensitivity to hyperparameter initialization.

5. Conclusions

AI in the medical field is expected to be a significant trend in the future, particularly in the autonomous measurement of breast characteristics. This study employed a distinct DL technique to anticipate the detection and categorization of BRCA. A series of mammogram images was taken, and an improved DCNN is beneficial for understanding the patterns in this particular data. Therefore, the suggested approach proved to be more effective by employing the DCNN model in detecting BRCA. The primary concern in determining normality or abnormality is the need for extensive breast image data to enhance classification accuracy. To achieve a DCNN with a minimal error rate and time, it is crucial to have a feature subset that is high-dimensional. In order to improve the accuracy of mammogram image prediction, this study employs pre-processing, segmentation, hybrid IGWO–SOA optimization for feature selection, and a DCNN classifier trained using the CBIS-DDSM dataset. The proposed method demonstrates improved precision and computational speed for detecting and categorizing BRCA. We plan to expand our efforts in the future and create a model that can effectively forecast pixel labels for BRCA classification, even with minimal training data.

Author Contributions

Conceptualization, A.D. (Aniruddha Deka), D.D.M., A.D. (Anindita Das) and M.J.S.; methodology, A.D. (Aniruddha Deka), D.D.M., A.D. (Anindita Das) and M.J.S.; software, A.D. (Aniruddha Deka), D.D.M. and A.D. (Anindita Das); validation, A.D. (Aniruddha Deka) and M.J.S.; formal analysis, A.D. (Aniruddha Deka), D.D.M. and A.D. (Anindita Das); investigation, M.J.S.; resources, A.D. (Aniruddha Deka) and M.J.S.; data curation, A.D. (Aniruddha Deka), D.D.M. and A.D. (Anindita Das); writing—original draft preparation, A.D. (Aniruddha Deka), D.D.M. and A.D. (Anindita Das); writing—review and editing, M.J.S.; visualization, A.D. (Anindita Das); supervision, M.J.S.; project administration, A.D. (Aniruddha Deka) and M.J.S.; funding acquisition, M.J.S. All authors have read and agreed to the published version of the manuscript.

Funding

This research and the APC were funded by the Biomedical Sensors & Systems Lab, University of Memphis, Memphis, TN 38152, USA.

Institutional Review Board Statement

Not applicable.

Informed Consent Statement

Not applicable.

Data Availability Statement

The mammogram images used in this study were sourced from the CBIS-DDSM dataset [30].

Conflicts of Interest

The authors declare no conflicts of interest.

References

  1. Zhang, L.; Zhu, F.; Xie, L.; Wang, C.; Wang, J.; Chen, R.; Jia, P.; Guan, H.Q.; Peng, L.; Chen, Y. Clinical characteristics of COVID-19-infected cancer patients: A retrospective case study in three hospitals within Wuhan, China. Ann. Oncol. 2020, 31, 894–901. [Google Scholar] [CrossRef] [PubMed]
  2. Hameed, Z.; Zahia, S.; Garcia-Zapirain, B.; Javier Aguirre, J.; María Vanegas, A. Breast cancer histopathology image classification using an ensemble of DL models. Sensors 2020, 20, 4373. [Google Scholar] [CrossRef] [PubMed]
  3. Fang, Y.; Zhao, J.; Hu, L.; Ying, X.; Pan, Y.; Wang, X. Image classification toward breast cancer using deeply-learned quality features. J. Vis. Commun. Image Represent. 2019, 64, 102609. [Google Scholar] [CrossRef]
  4. Zheng, J.; Lin, D.; Gao, Z.; Wang, S.; He, M.; Fan, J. Deep learning assisted efficient AdaBoost algorithm for breast cancer detection and early diagnosis. IEEE Access 2020, 8, 96946–96954. [Google Scholar] [CrossRef]
  5. Titoriya, A.; Sachdeva, S. Breast cancer histopathology image classification using AlexNet. In Proceedings of the 2019 4th International Conference on Information Systems and Computer Networks (ISCON), Mathura, India, 21–22 November 2019; pp. 708–712. [Google Scholar]
  6. Mittal, S.; Wrobel, T.P.; Walsh, M.; Kajdacsy-Balla, A.; Bhargava, R. Breast cancer histopathology using infrared spectroscopic imaging: The impact of instrumental configurations. Clin. Spectrosc. 2021, 3, 100006. [Google Scholar] [CrossRef]
  7. Mahbod, A.; Ellinger, I.; Ecker, R.; Smedby, Ö.; Wang, C. Breast cancer histological image classification using fine-tuned deep network fusion. In Proceedings of the International Conference on Image Analysis and Recognition, Póvoa de Varzim, Portugal, 27–29 June 2018; Springer: Cham, Switzerland, 2018; pp. 754–762. [Google Scholar]
  8. Yao, H.; Zhang, X.; Zhou, X.; Liu, S. Parallel structure deep neural network using CNN and RNN with an attention mechanism for breast cancer histology image classification. Cancers 2019, 11, 1901. [Google Scholar] [CrossRef] [PubMed]
  9. Farrokh, A.; Goldmann, G.; Meyer-Johann, U.; Hille-Betz, U.; Hillemanns, P.; Bader, W.; Wojcinski, S. Clinical differences between invasive lobular breast cancer and invasive carcinoma of no special type in the German mammography-screening-program. Women Health 2022, 62, 144–156. [Google Scholar] [CrossRef] [PubMed]
  10. Hu, Q.; Liu, Y.; Chen, C.; Kang, S.; Sun, Z.; Wang, Y.; Xiang, M.; Guan, H.; Xia, L. Application of computer-aided detection (CAD) software to automatically detect nodules under SDCT and LDCT scans with different parameters. Comput. Biol. Med. 2022, 146, 105538. [Google Scholar] [CrossRef] [PubMed]
  11. Kumar, A.; Singh, S.K.; Saxena, S.; Lakshmanan, K.; Sangaiah, A.K.; Chauhan, H.; Shrivastava, S.; Singh, R.K. Deep feature learning for histopathological image classification of canine mammary tumors and human breast cancer. Inf. Sci. 2020, 508, 405–421. [Google Scholar] [CrossRef]
  12. Alirezazadeh, P.; Hejrati, B.; Monsef-Esfahani, A.; Fathi, A. Representation learning-based unsupervised domain adaptation for classification of breast cancer histopathology images. Biocybern. Biomed. Eng. 2018, 38, 671–683. [Google Scholar] [CrossRef]
  13. Budak, Ü.; Cömert, Z.; Rashid, Z.N.; Şengür, A.; Çıbuk, M. Computer-aided diagnosis system combining FCN and Bi-LSTM model for efficient breast cancer detection from histopathological images. Appl. Soft Comput. 2019, 85, 105765. [Google Scholar] [CrossRef]
  14. Singla, S.; Ghosh, P.; Kumari, U. Breast cancer detection using genetic algorithm with correlation-based feature selection: Experiment on different datasets. Int. J. Comp. Sci. Eng. 2019, 7, 406–410. [Google Scholar] [CrossRef]
  15. George, K.; Faziludeen, S.; Sankaran, P. Breast cancer detection from biopsy images using nucleus-guided transfer learning and belief-based fusion. Comput. Biol. Med. 2020, 124, 103954. [Google Scholar] [CrossRef] [PubMed]
  16. Singh, R.; Ahmed, T.; Kumar, A.; Singh, A.K.; Pandey, A.K.; Singh, S.K. Imbalanced breast cancer classification using transfer learning. IEEE/ACM Trans. Comput. Biol. Bioinform. 2020, 18, 83–93. [Google Scholar] [CrossRef] [PubMed]
  17. Hirra, I.; Ahmad, M.; Hussain, A.; Ashraf, M.U.; Saeed, I.A.; Qadri, S.F.; Alghamdi, A.M.; Alfakeeh, A.S. Breast Cancer Classification from Histopathological Images Using Patch-Based Deep Learning Modeling. IEEE Access 2021, 9, 24273–24287. [Google Scholar] [CrossRef]
  18. Li, G.; Li, C.; Wu, G.; Ji, D.; Zhang, H. Multi-view Attention-Guided Multiple Instance Detection Network for Interpretable Breast Cancer Histopathological Image Diagnosis. IEEE Access 2021, 9, 79671–79684. [Google Scholar] [CrossRef]
  19. Das, A.; Mohanty, M.N.; Mallick, P.K.; Tiwari, P.; Muhammad, K.; Zhu, H. Breast cancer detection using an ensemble deep learning method. Biomed. Signal Process. Control 2021, 70, 103009. [Google Scholar] [CrossRef]
  20. Gupta, V.; Vasudev, M.; Doeger, A.; Sambyal, N. Breast cancer detection from histopathology images using modified residual neural networks. Biocybern. Biomed. Eng. 2021, 41, 1272–1287. [Google Scholar] [CrossRef]
  21. Mohiuddin, N.; Dar, R.A.; Rasool, M.; Assad, A. Breast cancer detection using deep learning: Datasets, methods, and challenges ahead. Comput. Biol. Med. 2022, 149, 106073. [Google Scholar] [CrossRef] [PubMed]
  22. Khalid, A.; Mehmood, A.; Alabrah, A.; Alkhamees, B.F.; Amin, F.; AlSalman, H.; Choi, G.S. Breast Cancer Detection and Prevention Using Machine Learning. Diagnostics 2023, 13, 3113. [Google Scholar] [CrossRef] [PubMed]
  23. Sharafaddini, A.M.; Esfahani, K.K.; Mansouri, N. Deep learning approaches to detect breast cancer: A comprehensive review. Multimed. Tools Appl. 2024, 84, 24079–24190. [Google Scholar] [CrossRef]
  24. Nassih, R.; Berrado, A. Breast Cancer Classification Using an Adapted Bump-Hunting Algorithm. Algorithms 2025, 18, 136. [Google Scholar] [CrossRef]
  25. Erkan, U.; Gökrem, L.; Enginoğlu, S. Different applied median filter in salt and pepper noise. Comput. Electr. Eng. 2018, 70, 789–798. [Google Scholar] [CrossRef]
  26. Sathiyabhama, B.; Kumar, S.U.; Jayanthi, J.; Sathiya, T.; Ilavarasi, A.K.; Yuvarajan, V.; Gopikrishna, K. A novel feature selection framework based on grey wolf optimizer for mammogram image analysis. Neural Comput. Appl. 2021, 33, 14583. [Google Scholar] [CrossRef]
  27. Dhiman, G.; Kumar, V. Seagull optimization algorithm: Theory and its applications for large-scale industrial engineering problems. Knowl.-Based Syst. 2019, 165, 169–196. [Google Scholar] [CrossRef]
  28. Faris, H.; Aljarah, I.; Al-Betar, M.A.; Mirjalili, S. Grey wolf optimizer: A review of recent variants and applications. Neural Comput. Appl. 2018, 30, 413–435. [Google Scholar] [CrossRef]
  29. Kumar, A.; Zhou, Y.; Gandhi, C.P.; Kumar, R.; Xiang, J. Bearing defect size assessment using wavelet transform-based Deep Convolutional Neural Network (DCNN). Alex. Eng. J. 2020, 59, 999–1012. [Google Scholar] [CrossRef]
  30. Falconi, L.G.; Pérez, M.; Aguilar, W.G.; Conci, A. Transfer learning and fine tuning in breast mammogram abnormalities classification on CBIS-DDSM database. Adv. Sci. Technol. Eng. Syst. 2020, 5, 154–165. [Google Scholar] [CrossRef]
  31. Sejuti, Z.A.; Islam, M.S. A hybrid CNN–KNN approach for identification of COVID-19 with 5-fold cross-validation. Sens. Int. 2023, 4, 100229. [Google Scholar] [CrossRef] [PubMed]
  32. Lbachir, I.A.; Daoudi, I.; Tallal, S. Automatic computer-aided diagnosis system for mass detection and classification in mammography. Multimed. Tools Appl. 2021, 80, 9493–9525. [Google Scholar] [CrossRef]
  33. Ragab, D.A.; Sharkas, M.; Marshall, S.; Ren, J. Breast cancer detection using deep convolutional neural networks and support vector machines. PeerJ 2019, 7, e6201. [Google Scholar] [CrossRef] [PubMed]
  34. Baccouche, A.; Garcia-Zapirain, B.; Elmaghraby, A.S. An integrated framework for breast mass classification and diagnosis using stacked ensemble of residual neural networks. Sci. Rep. 2022, 12, 12259. [Google Scholar] [CrossRef] [PubMed]
  35. Baccouche, A.; Garcia-Zapirain, B.; Castillo Olea, C.; Elmaghraby, A.S. Connected-UNets: A deep learning architecture for breast mass segmentation. NPJ Breast Cancer 2021, 7, 151. [Google Scholar] [CrossRef] [PubMed]
  36. Tsochatzidis, L.; Koutla, P.; Costaridou, L.; Pratikakis, I. Integrating segmentation information into CNN for breast cancer diagnosis of mammographic masses. Comput. Methods Programs Biomed. 2021, 200, 105913. [Google Scholar] [CrossRef] [PubMed]
  37. Wang, J.; Quan, H.; Wang, C.; Yang, G. Pyramid-based self-supervised learning for histopathological image classification. Comput. Biol. Med. 2024, 165, 107336. [Google Scholar] [CrossRef] [PubMed]
  38. Huang, P.W.; Ouyang, H.; Hsu, B.Y.; Chang, Y.R.; Lin, Y.C.; Chen, Y.A.; Hsieh, Y.H.; Fu, C.C.; Li, C.F.; Lin, C.H.; et al. Deep-learning based breast cancer detection for cross-staining histopathology images. Heliyon 2024, 9, e13171. [Google Scholar] [CrossRef] [PubMed]
  39. Khan, M.; Su’ud, M.M.; Alam, M.M.; Karimullah, S.; Shaik, F.; Subhan, F. Enhancing Breast Cancer Detection Through Optimized Thermal Image Analysis Using PRMS-Net Deep Learning Approach. J. Imaging Inform. Med. 2025. [Google Scholar] [CrossRef] [PubMed]
Figure 1. Proposed methodology.
Ai 06 00167 g001
Figure 2. Sample images from the dataset.
Ai 06 00167 g002
Figure 3. Confusion matrix for BRCA classification model performance.
Ai 06 00167 g003
Figure 4. Comparison of AUC values for BRCA classification techniques.
Ai 06 00167 g004
Table 1. Pseudocode for proposed IGWO–SOA algorithms.
IGWO–SOA Algorithm Pseudocode
Randomly initiate the grey wolf population within the designated search area.
Initialize the maximum number of iterations, population size, and other control parameters.
Initialize the self-organizing architecture parameters.
Initialize the best solution and set its fitness to infinity.
Continue iterating until the maximum number of cycles has been reached:
   Evaluate the fitness of each grey wolf in the population.
Update the best solution if a better solution is found.
Apply the self-organizing architecture to adjust the positions of grey wolves:
   For each grey wolf:
      Update the position based on the grey wolf’s current position, the best solution,
         and the self-organizing architecture parameters.
      Apply boundary constraints to ensure the new position remains within the search space.
Apply the self-organizing architecture to adjust the population size:
   For each grey wolf:
      Determine the fitness ratio of every individual grey wolf.
      Sort the grey wolves based on their fitness ratio.
      Determine the new population size based on the self-organizing architecture parameters and the current iteration.
      Remove the lowest-ranking grey wolves from the population until the desired population size is achieved.
   Perform optional local search or other refinement techniques.
   Update the convergence curve or other performance metrics.
Return the best solution found.
Table 2. DCNN classification technique.
Layer CountLayerTypeOutput ShapeParameters
1Conv2d-28Conv2D222 × 222 × 32896
2Activation-36Activation24 × 24 × 2560
3Max-pooling2d-25Max-Pooling112 × 112 × 640
4Conv2d-29Conv2D109 × 109 × 6418,496
5Max-pooling2d-29Max-Pooling5 × 5 × 5120
6Activation-40Activation54 × 54 × 640
7Conv2d-32Conv2D10 × 10 × 51273,856
8Max-pooling2d-28Activation24 × 24 × 2560
9Max-pooling2d-27Max-Pooling26 × 26 × 1280
10Conv2d-31Conv2D24 × 24 × 256295,168
11Activation-39Activation52 × 52 × 1280
12Activation-38Max-Pooling12 × 12 × 2560
13Conv2d-30Conv2D52 × 52 × 1281,180,160
14Max-pooling2d-26Max-Pooling54 × 54 × 640
15Activation-37Activation109 × 109 × 640
Table 3. Flow of hybrid IGWO–SOA for tuning parameters.
Flow of Hybrid IGWO–SOA for Tuning Parameters
Start
   • Randomly begin the grey wolf population in the search area.
   • Initialize the maximum number of iterations and other control parameters.
   • Initialize the self-organizing architecture parameters.
   • Determine each population’s grey wolves’ level of fitness.
   • Set the best solution as the grey wolf with the highest fitness.
   • Continue until the maximum number of iterations has been completed:
   • Apply the self-organizing architecture to adjust the positions of grey wolves based on their fitness values and the current iteration.
   • Apply the self-organizing architecture to adjust the population size based on the current iteration.
   • Perform optional local search or other refinement techniques.
   • Update the convergence curve or other performance metrics.
   • Determine each population’s level of fitness for grey wolves.
   • Update the best solution if a better solution is found.
   • Return the best solution found.
End
Table 4. Performance metrics of BRCA classification model with and without feature selection.
MetricsWith Feature SelectionWithout Feature Selection
Accuracy99.4%96.5%
Precision99.2%96.2%
Recall99.1%97%
F1-Score99.0%96.4%
Specificity99.1%96%
Table 5. Performance metrics of BRCA classification model using fivefold cross-validation (before FS).
Fold TestAccuracyPrecisionRecallF1-ScoreSpecificity
1st fold96.797.19895.997.1
2nd fold95.695.595.196.995.0
3rd fold97.596.59497.095.4
4th fold95.595.596.297.296.2
5th fold97.097.695.596.597.4
Average96.4696.4495.7696.796.22
Table 6. Performance metrics of BRCA classification model using fivefold cross-validation (after FS).
Fold TestAccuracyPrecisionRecallF-ScoreSpecificity
1st fold99.799.19998.999.1
2nd fold99.699.599.198.999
3rd fold99.599.5999999
4th fold99.599.599.29999.2
5th fold9998.699.599.299.4
Average99.4699.2499.169999.14
Table 7. Performance metrics of BRCA classification techniques.
TechniqueAccuracy (%)Precision (%)Recall
(%)
F1-Score
(%)
Specificity
(%)
Proposed Technique99.4%99.2%99.1%99.0%99.1%
PTr (Pyramid Transformer + SAM) [37]99.3%99.1%98.9%98.8%99.0%
CBAM-EfficientNetV2 [38]99.1%98.6%98.4%98.3%98.7%
PRMS-Net [39]99.2%99.0%98.8%98.9%98.7%
SVM [32]98.4%97.5%98.0%97.5%96.5%
DCNN [33]95.4%94.2%94.3%95.0%95.2%
ResNet [34]96.5%96.4%96.2%95.4%95.0%
Attention Unet
+ResUNet [35]96.8%95.4%92.5%93.5%94.5%
CNN [33]97.5%96.3%96.0%96.8%97.0%
Table 8. Evaluation of performance metrics for BRCA classification.
MetricsResults
FDR0.54
FNR0.001
FPR0.002
MCC0.987
NPV0.997
Table 9. Ablation study results for BRCA classification.
Optimization TechniqueAccuracy (%)Precision (%)Recall (%)F1-Score (%)Specificity (%)
IGWO97.8%97.5%97.3%97.4%97.0%
SOA97.1%96.8%96.5%96.6%96.2%
IGWO–SOA (Proposed Method)99.4%99.2%99.1%99.0%99.1%
Disclaimer/Publisher’s Note: The statements, opinions and data contained in all publications are solely those of the individual author(s) and contributor(s) and not of MDPI and/or the editor(s). MDPI and/or the editor(s) disclaim responsibility for any injury to people or property resulting from any ideas, methods, instructions or products referred to in the content.

