1. Introduction
Artificial Intelligence (AI) has started to play an increasingly important role in higher education. AI-based predictive models built from existing datasets, such as admissions data, provide insight into the policies, practices, and biases in the U.S. higher education system. At the same time, AI models have limitations and the potential to create harm, such as introducing new biases towards sensitive populations. It is therefore important to understand these limitations and be able to detect and mitigate biases to truly integrate AI tools into higher education applications. Further, the concept of fairness is broader than bias, and is subjective and context-dependent, motivating the need for human input as part of the bias mitigation process.
This paper describes a project where AI models were built using an existing student admission dataset and analyzed for the presence of algorithmic bias. Evidence of bias in the machine learning models was found, so an interactive method for mitigating this bias was implemented to allow the user to adjust the AI model so that the output it produces is more fair. This method was then evaluated under three scenarios.
Admissions data from the School of Science at a large urban research university was used to create machine learning-based AI models. These models predict whether a student would be directly admitted into the School of Science or not under a variety of scenarios. The dataset spans six years, and over this time, the admissions policy of the university changed from requiring students to submit standardized test scores as part of their application to making test scores optional.
Test-optional policies were designed to address the concern that standardized test scores are biased metrics for predicting student success and to increase equity in admissions procedures. But more research needs to be done to fully understand how these policies might change the demographics of the students admitted to the university and other impacts. Some preliminary results in identifying the important factors in admissions decisions and how test-optional policies might change admitted student demographics have been discussed in our previous work [
1].
As the next step toward understanding and mitigating bias in admissions policies, some college admissions officers may decide to use machine learning-based AI applications. However, when AI models are trained using existing datasets, the models can introduce new bias, unintentionally increasing inequity. This is something we must understand and prevent as AI becomes more widely used in higher education. The first step is to identify and measure bias in AI models built to predict admission decisions. A solution was proposed and discussed in our previous work in [
2]. In this paper, we include relevant background information from [
2], including
Figure 1, and
Table 1,
Table 2,
Table 3 and
Table 4, which form the basis for this new work. Then, we propose a new approach to the mitigation of these biases in AI models.
In our proposed bias mitigation approach, we begin by describing the construction of our AI predictive models. The predictive models contain a variety of demographic variables, and three (the “sensitive variables”): Gender, Race, and whether a student was the first in his/her family to attend college (“First-Generation”), were chosen to represent sensitive populations. We then carefully evaluate the AI models for the presence of potential biases with respect to performance relative to these three sensitive variables. The result of this analysis provides some evidence that AI algorithms can be harmful when used as part of the admission decision-making process if bias is not effectively mitigated.
We then propose a human-in-the-loop method that uses a second machine learning model for mitigating this bias. A user can evaluate bias and fairness statistics on the results given by an “Admissions Model”, an AI model that predicts admissions decisions. If the model is determined to be biased in a way that is unfair, the user can specify adjustments to be made to these statistics, which would make the model fairer. A second machine learning model, the “Bias Mitigation Model,” takes these user-adjusted statistics and predicts the adjustments needed to the training set to be used for constructing an adjusted Admissions Model. This adjusted Admissions Model is then built and reevaluated based on the updated bias and fairness statistics. This interactive adjustment process continues until the user is satisfied with the results.
This work makes the following contributions:
- (1)
College admissions data was used to generate AI predictive models, which were evaluated on their overall accuracy and effectiveness. The models were highly accurate overall; however, a thorough analysis reveals evidence of bias with respect to sensitive populations. This serves as a warning and contributes to an understanding of how bias can be defined and detected.
- (2)
A novel approach to bias mitigation is introduced and evaluated, which uses a combination of machine learning and user interaction. This work demonstrates how carefully designed interactive adjustments to the training sets used in the construction of an AI predictive model can effectively mitigate bias.
- (3)
Recognizing that the concept of fairness is subjective, the bias mitigation method presented here allows the user to interactively adjust various bias and fairness metrics used to construct the AI model to create a model that is fair within the context in which it is being used. To our knowledge, human-in-the-loop techniques have not been used for algorithmic bias mitigation in AI models.
The rest of this paper is organized as follows. In
Section 2, we provide an overview of the literature related to this work and its impact. In
Section 3, we discuss the methods used to analyze the admissions dataset and present evidence of bias. We then describe our bias mitigation method. In
Section 4, we evaluate our bias mitigation method using three scenarios. In
Section 5, we provide some concluding remarks and directions for future research.
2. Related Work
Students at urban universities face some unique challenges. For example, they are likely to experience the conflicting demands between work, family, and school, which can negatively affect their satisfaction with educational experiences [
3]. Students, especially minority students, may face barriers that undermine academic achievement, reduce their sense of belonging, and interfere with degree completion [
4]. Those who attend a university located in a city with a lack of affordable housing may struggle to find appropriate housing, which can negatively affect their academic lives, health, and well-being [
5]. Data collected about the impact of COVID-19 on urban college students showed that decreases in student earnings and household incomes led to significant disruptions in students’ lives, and that these disruptions had an especially negative impact on first-generation students [
6].
Recently, many universities have started to experiment with an admissions policy that allows students to apply without submitting standardized test scores. The hope is that these policies will address concerns of bias in the use of test scores as a metric to predict student success. One survey suggests that test-optional policies are changing enrollment demographics, especially with respect to underrepresented minorities, as Black and Hispanic students are 24% and 21% respectively, more likely to apply to a school with a test-optional policy [
7]. A second study found that test-optional admission increased the first-time enrollment by 10–12% of underrepresented minorities, and 6–8% by women [
8]. Another study of liberal arts schools found that although test-optional policies enhance the perceived selectivity of a school, they did not increase the diversity [
9]. Researchers are also exploring the nuances of the policy. For example, what are the implications of giving students the option to submit test scores when they are not required? Does it matter that some students choose not to submit scores because they are too low, while others choose not to take the test at all [
10]?
Artificial intelligence tools, particularly machine learning algorithms, are increasingly used in higher education applications. Using AI to assist with the college admission process can be more objective and efficient [
11]. Machine learning algorithms can also help universities better understand admission criteria and their impact in the admissions process [
12] as well as admissions yield [
13]. AI can also be used to predict the likelihood of admission for individual students [
14,
15] in some situations and can sometimes provide evidence for bias in human-centered admissions processes [
16].
While AI tools bring many benefits to higher education applications, they can also be biased towards sensitive populations due to the intrinsic bias in existing datasets and in the algorithms themselves [
17]. There are a variety of frameworks and taxonomies for classifying bias [
18] and although some bias can be neutral/unobjectionable, many biases are problematic and require a response [
19] Identifying and categorizing bias in AI is a first step toward creating methods for mitigating bias, an area of active research [
20,
21].
A variety of preprocessing, in-processing, and postprocessing techniques have been proposed for mitigating bias [
21]. One type of approach involves adjusting the labels in the training dataset when constructing an AI model to make it more fair [
22]. Other approaches involve pre-processing the dataset to suppress discriminatory variables while maintaining the quality of the data [
23,
24,
25,
26]. This can be difficult to accomplish because of the interactions between discriminatory variables and other variables in the dataset, leading to the need to better understand the relationships between these [
27,
28,
29] and methods for repairing the datasets [
30].
Another class of bias mitigation techniques focuses on preprocessing the training dataset by sampling the training set in a more fair way [
31] or splitting the training dataset according to discriminatory variables and developing AI models for each subset [
32,
33]. Because preprocessing the training set in various ways can cause side effects, such approaches often require additional steps at the in-processing or postprocessing stage [
34,
35].
The tradeoffs between various bias metrics, the subjective nature of fairness, and the difficulties involved in automating bias mitigation suggest a need for human input as part of the bias mitigation process. Interactive approaches are being used in AI applications [
36,
37], but so far have not been used for bias mitigation, motivating the work presented here.
In addition, the social implications of bias in AI for education are nuanced, further underscoring the need for human input in bias mitigation. For example, student perceptions of fairness with respect to the use of AI in college admissions can affect organizational reputation and the likelihood of students leaving the university [
38]. Algorithmic bias can also affect the degree to which people are comfortable accepting AI-based recommendations or adopting AI systems [
39]. Complicating this understanding is the gap in the literature between technical studies (which include jargon) and descriptive studies (aimed at the lay person) on algorithmic fairness in higher education [
40,
41], showing a need for scholarly work that bridges these disciplines. Not only would an interactive approach to bias mitigation have the potential to improve the fairness of the AI algorithm itself, but it could also lead to an increase in understanding and feeling of control over the use of AI in higher education.
3. Methods and Dataset
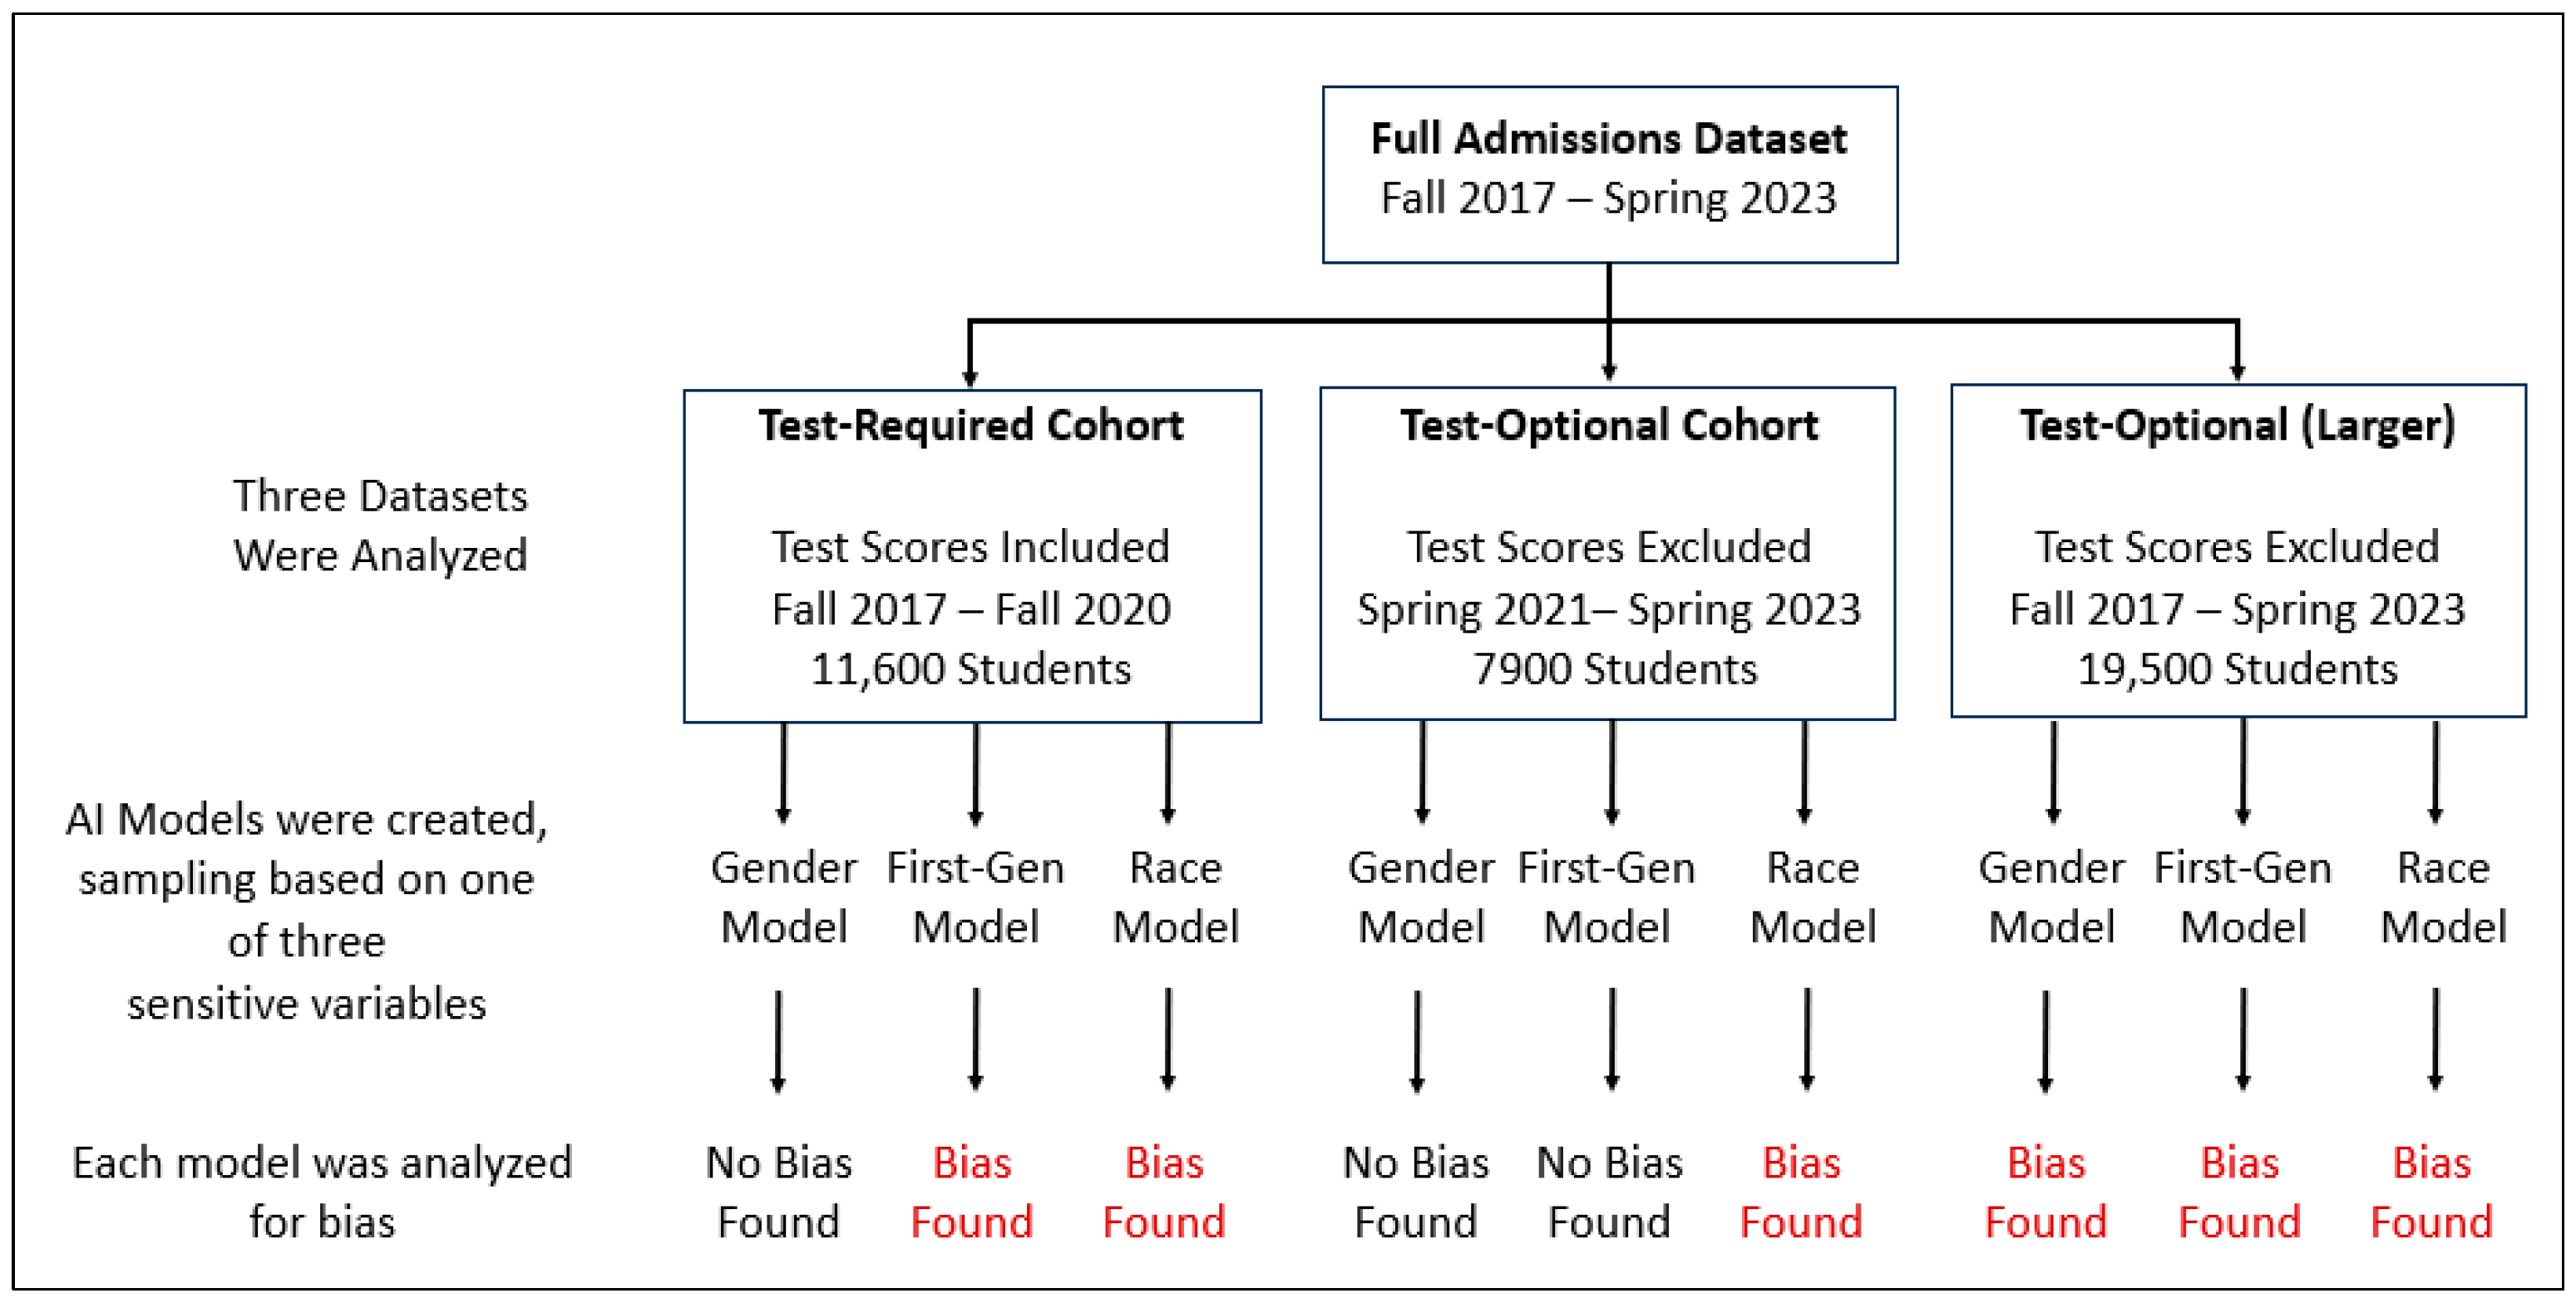
This research was conducted using admissions data from the School of Science at a large urban research university. Students in the dataset were applying for admission from Fall 2017 to Spring 2023. We built various machine learning-based models using information from student applications as input, which then predicted which students were admitted directly into the School of Science (“Direct Admits”). Students who are categorized as “Not Direct Admits” are those who were admitted into the university but not into the School of Science, and those who were not admitted to the university at all.
The admissions process became test-optional during this period; first-year students applying for admission from Spring 2021 forward could choose not to submit standardized test scores. Prior to test-optional admissions, Direct Admit decisions were based on grade point average (GPA) and standardized test scores. When the admissions process became test-optional, Direct Admit decisions for students who opted to exclude standardized test scores from their application were based on GPA and an assessment of “math readiness” based on performance in high-school math courses. The dataset used in this research contains approximately 11,600 students who were required to submit test scores, and approximately 7900 students who were applying under the new test-optional policy.
The features used in the predictive model were: whether the student is a beginning student, the number of campuses to which the student applied, age, gender, race/ethnicity, whether the student is a first-generation student, whether the student is an in-state resident, GPA, and standardized test scores (when students were applying when test scores were required). Standardized test scores include scores from the two prevalent American college admissions tests, the ACT and SAT. ACT scores were normalized to SAT scores. In this dataset, ethnicity (Hispanic/Latino) was part of the race variable. Through exploratory analysis, three variables were chosen to represent sensitive populations for further analysis: gender, race/ethnicity, and first-generation students.
We analyzed three groups of data:
Group 1: Test-Required Cohort (Fall 2017–Fall 2020)
Group 2: Test-Optional Cohort (Spring 2021–Spring 2023)
Group 3: Test-Optional (Larger), (Fall 2017–Spring 2023)
The Group 3 dataset, Test-Optional (Larger), is the full dataset with standardized test scores removed. Because the true Test-Optional Cohort contains only two-and-a-half years of data, and that data was confounded by the pandemic, we constructed the Group 3 dataset to simulate a larger test-optional dataset with which to test our methodology.
This is not a true test-optional cohort because the students applying for admission prior to Spring 2021 were required to submit test scores. Simply removing test scores from a dataset does not account for the effects of a change from a test-required to test-optional policy on the demographics of the applicants. This dataset is intended to be used to evaluate our predictive models with a larger dataset, and analysis of this data from the Test-Optional (Larger) dataset should not be used to inform policy.
The analyses for the Test-Required Cohort, the Test-Optional Cohort, and the Test-Optional (Larger) dataset were repeated three times: once with the sensitive variable set to Gender, once with the sensitive variable set to Race, and once with the sensitive variable set to First-Generation students. The goal was to understand how changing the value of a single sensitive variable affected the performance of the models.
The resulting models were evaluated for bias, and our analysis found evidence of bias as shown in
Figure 1 [
2]. A description of our bias and fairness metrics is provided in Section A below.
Figure 1.
Overview of Analysis.
Figure 1.
Overview of Analysis.
Demographic data with respect to the sensitive variables is summarized in
Table 1 [
2]. (Percentages add up to more than 100% due to rounding.) The demographic makeup of the applications is heavily skewed toward white, female students whose parents also attended a university.
Table 1.
Sensitive Variables, Full Dataset.
Table 1.
Sensitive Variables, Full Dataset.
| Gender | Race | First-Generation |
|---|
| Male (7145, 37%) | White (10,641, 55%) | No (15,034, 77%) |
| Female (12,389, 63%) | Hispanic (2556, 13%) | Yes (4500, 23%) |
| | Black (2289, 12%) | |
| | Asian (1461, 8%) | |
| | Other (2512, 13%) | |
3.1. Bias Metrics
The following metrics were used to identify the presence of bias in the models:
Overall Accuracy: This is the measure of agreement between the decisions the model makes and the ground truth data.
Specificity: In this context, a lower Specificity score means a greater number of students were incorrectly admitted.
Sensitivity: A lower Sensitivity score means a greater number of students were incorrectly denied admission.
As our main goal in this work was to identify bias in the AI models (as opposed to evaluating the fairness of admissions policies), we evaluate each model based on overall accuracy, as well as accuracies in each subgroup of the sensitive variables. A difference of 5% or more between Men/Women, White/Non-White students, or Non-First-Generation/First-Generation students on any of these metrics suggests bias. The 5% threshold is selected somewhat subjectively and can certainly be modified based on the application’s needs. Different sensitive variables can also be chosen based on the particular context. This is so the user has flexibility when evaluating the degree to which the machine learning model makes decisions that match ground truth data.
3.2. Detection of Bias
The predictive models were built using a linear support vector machine (kernel = linear, C = 1.0, primal optimization, random-state = none). Other machine learning models can also be applied here and may lead to better prediction accuracy, but as our accuracies were very high, that was beyond the scope of this research. We randomly selected two-thirds of the data for training each time, using proportionate stratified sampling with respect to the sensitive variable. Each model includes all of the variables described above: whether the student is a beginning student, the number of campuses to which the student applied, age, gender, race/ethnicity, whether the student is a first-generation student, whether the student is an in-state resident, GPA, and standardized test scores (when applicable). All three of the sensitive variables were included in each model, but only one was treated as a sensitive variable for sampling in each experiment. Each model was then validated using five-fold cross-validation.
The results for the bias metrics where Gender is the sensitive variable are summarized in
Table 2 below [
2]. None of the predictive models for Gender show bias.
Table 2.
Model Bias when Gender is a Sensitive Variable.
Table 2.
Model Bias when Gender is a Sensitive Variable.
| | Overall | Male | Female |
|---|
| Test-Required Cohort | | | |
| Model Accuracy: | 0.872 | 0.875 | 0.870 |
| Specificity: | 0.841 | 0.843 | 0.841 |
| Sensitivity: | 0.893 | 0.893 | 0.893 |
| Test-Optional Cohort | | | |
| Model Accuracy: | 0.890 | 0.883 | 0.893 |
| Specificity: | 0.732 | 0.756 | 0.716 |
| Sensitivity: | 0.953 | 0.943 | 0.957 |
| Test-Optional (Larger) | | | |
| Model Accuracy: | 0.804 | 0.815 | 0.798 |
| Specificity: | 0.682 | 0.703 | 0.671 |
| Sensitivity: | 0.879 | 0.883 | 0.877 |
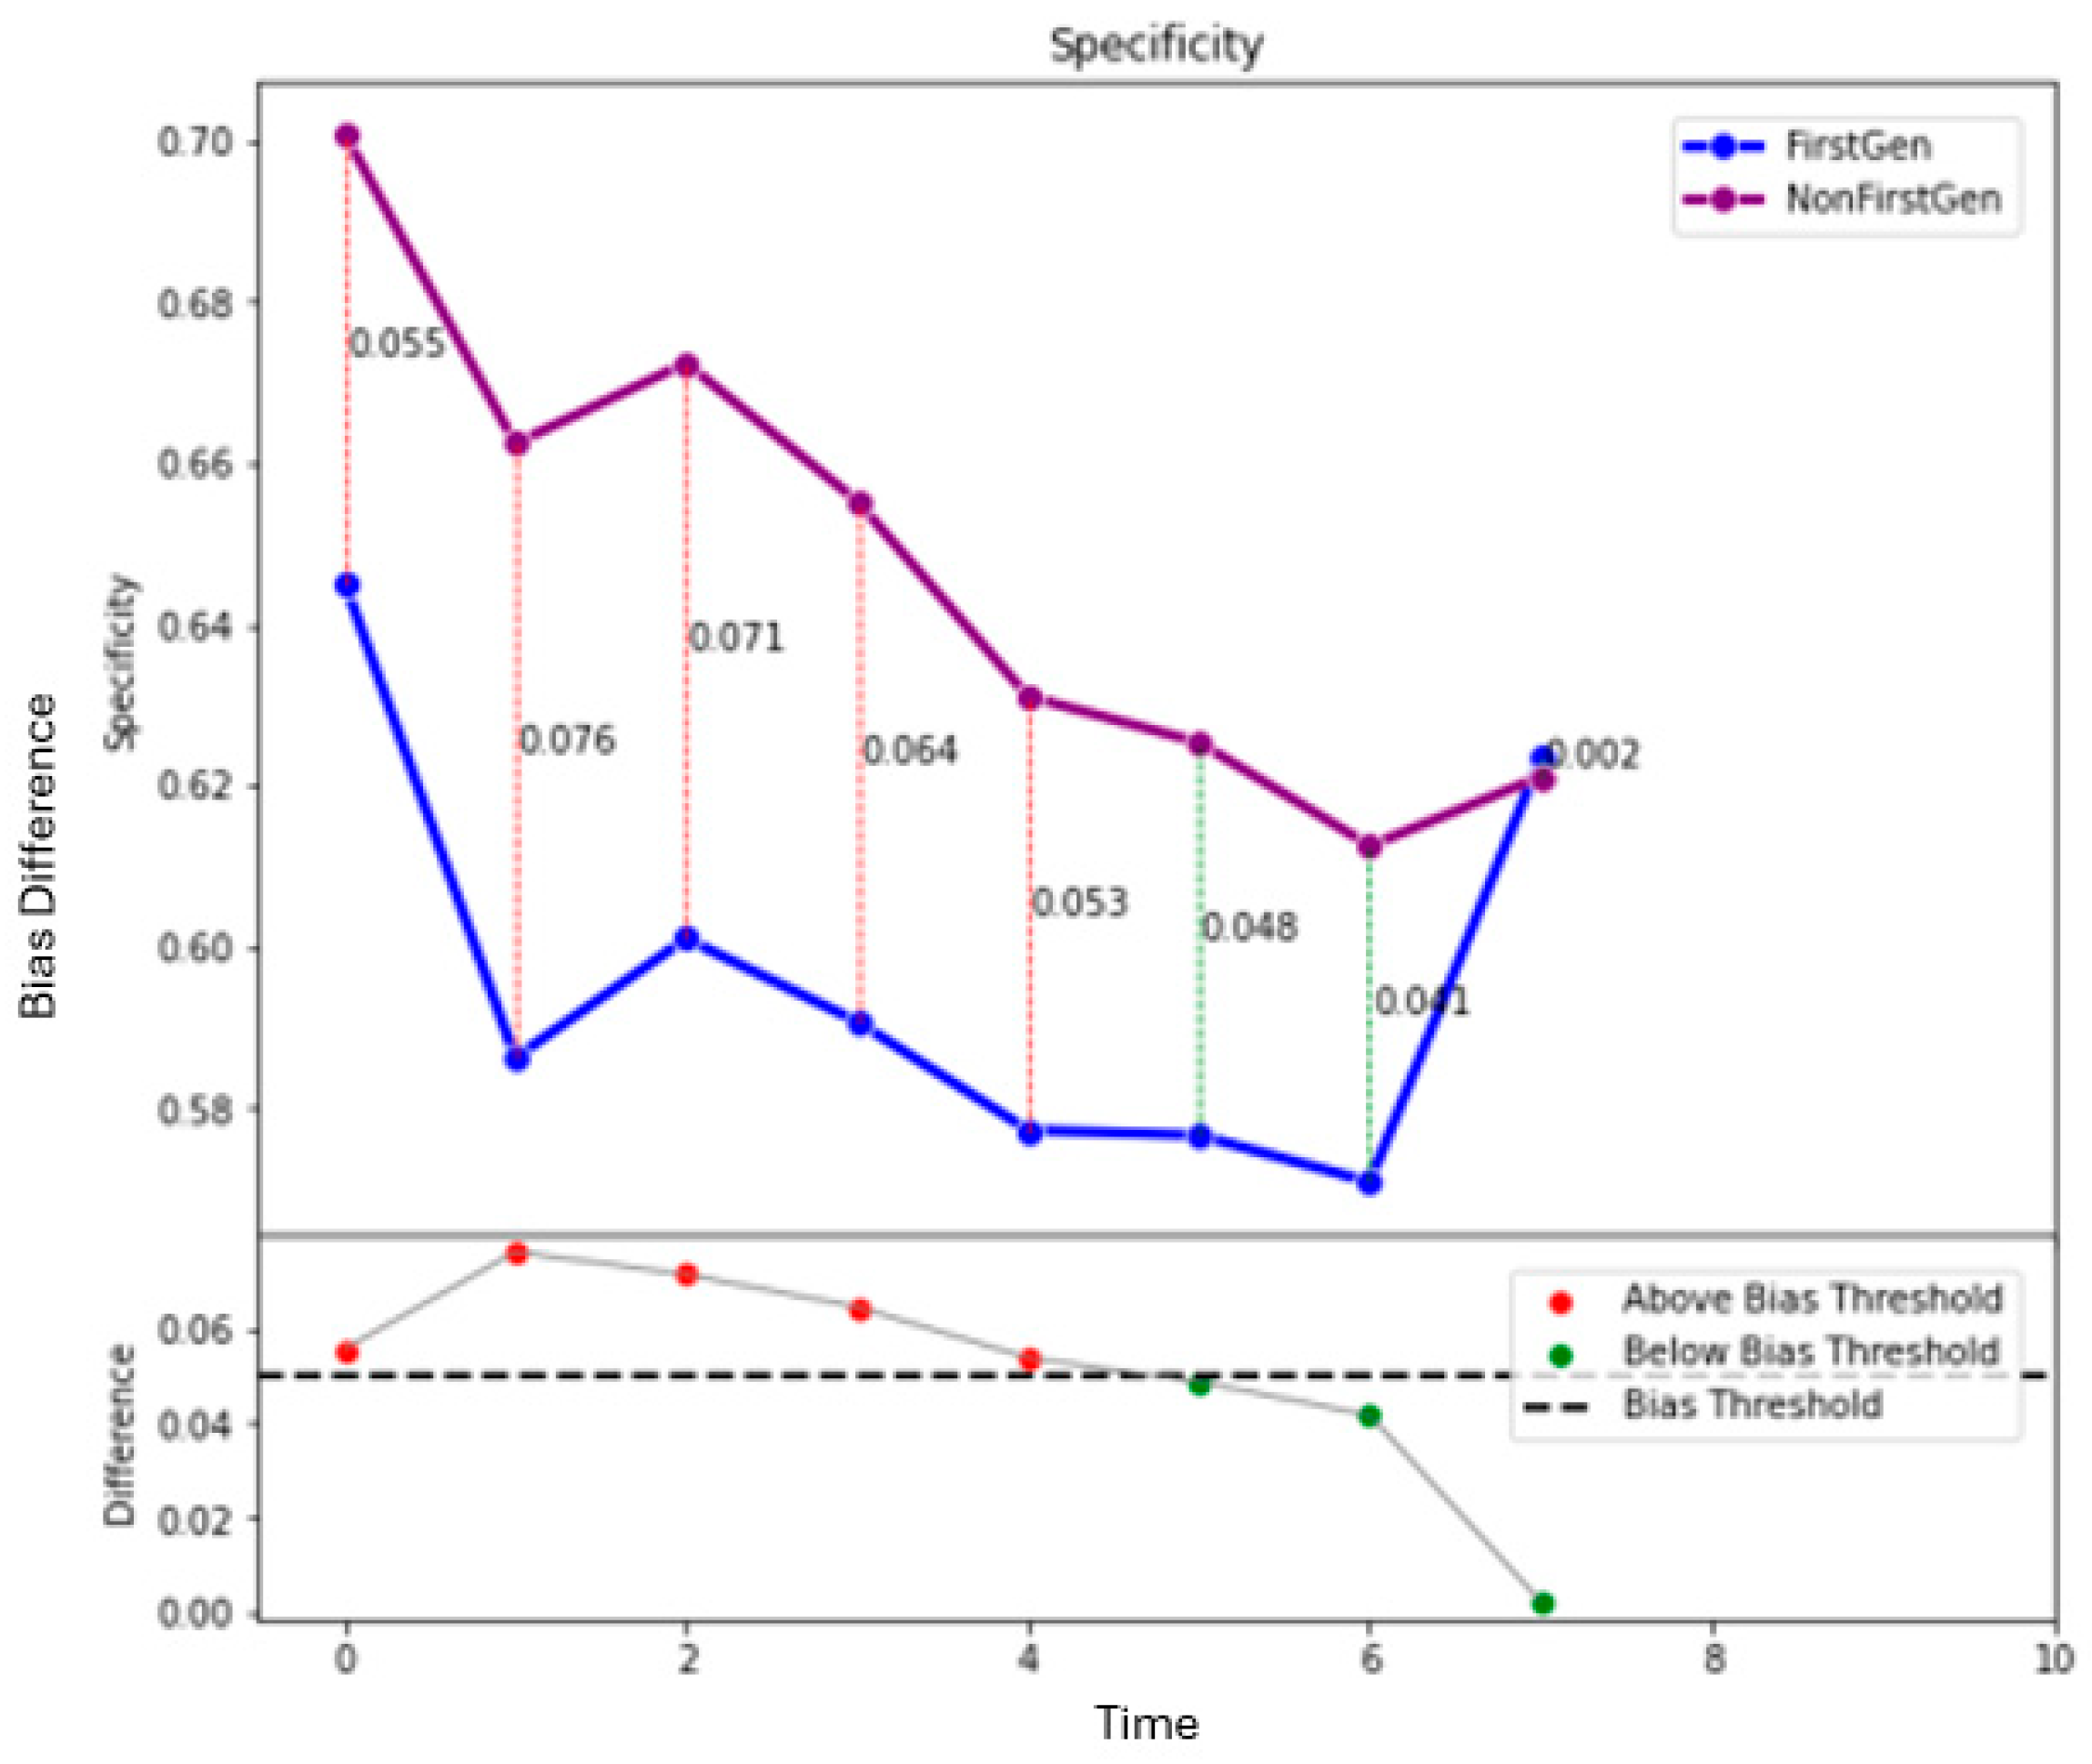
The results for the bias metrics, where First-Generation is the sensitive variable, are summarized in
Table 3 below [
2]. The predictive models for both the Test-Required Cohort and the larger Test-Optional dataset show bias. The Test-Optional (Larger) model predicts that non-first-generation students are accepted to the School of Science more often than in reality (Specificity bias), and the models for both the Test-Required Cohort and the Test-Optional (Larger) dataset predict that first-generation students are rejected more often than in reality (Sensitivity bias).
Table 3.
Model Bias when First-Gen is a Sensitive Variable.
Table 3.
Model Bias when First-Gen is a Sensitive Variable.
| | Overall | Non-FGen | FGen |
|---|
| Test-Required Cohort | | | |
| Model Accuracy: | 0.886 | 0.890 | 0.873 |
| Specificity: | 0.855 | 0.841 | 0.884 |
| Sensitivity *: | 0.908 | 0.920 | 0.861 |
| Test-Optional Cohort | | | |
| Model Accuracy: | 0.881 | 0.889 | 0.851 |
| Specificity: | 0.727 | 0.733 | 0.709 |
| Sensitivity: | 0.941 | 0.947 | 0.918 |
| Test-Optional (Larger) | | | |
| Model Accuracy: | 0.807 | 0.817 | 0.772 |
| Specificity *: | 0.678 | 0.655 | 0.731 |
| Sensitivity *: | 0.885 | 0.904 | 0.810 |
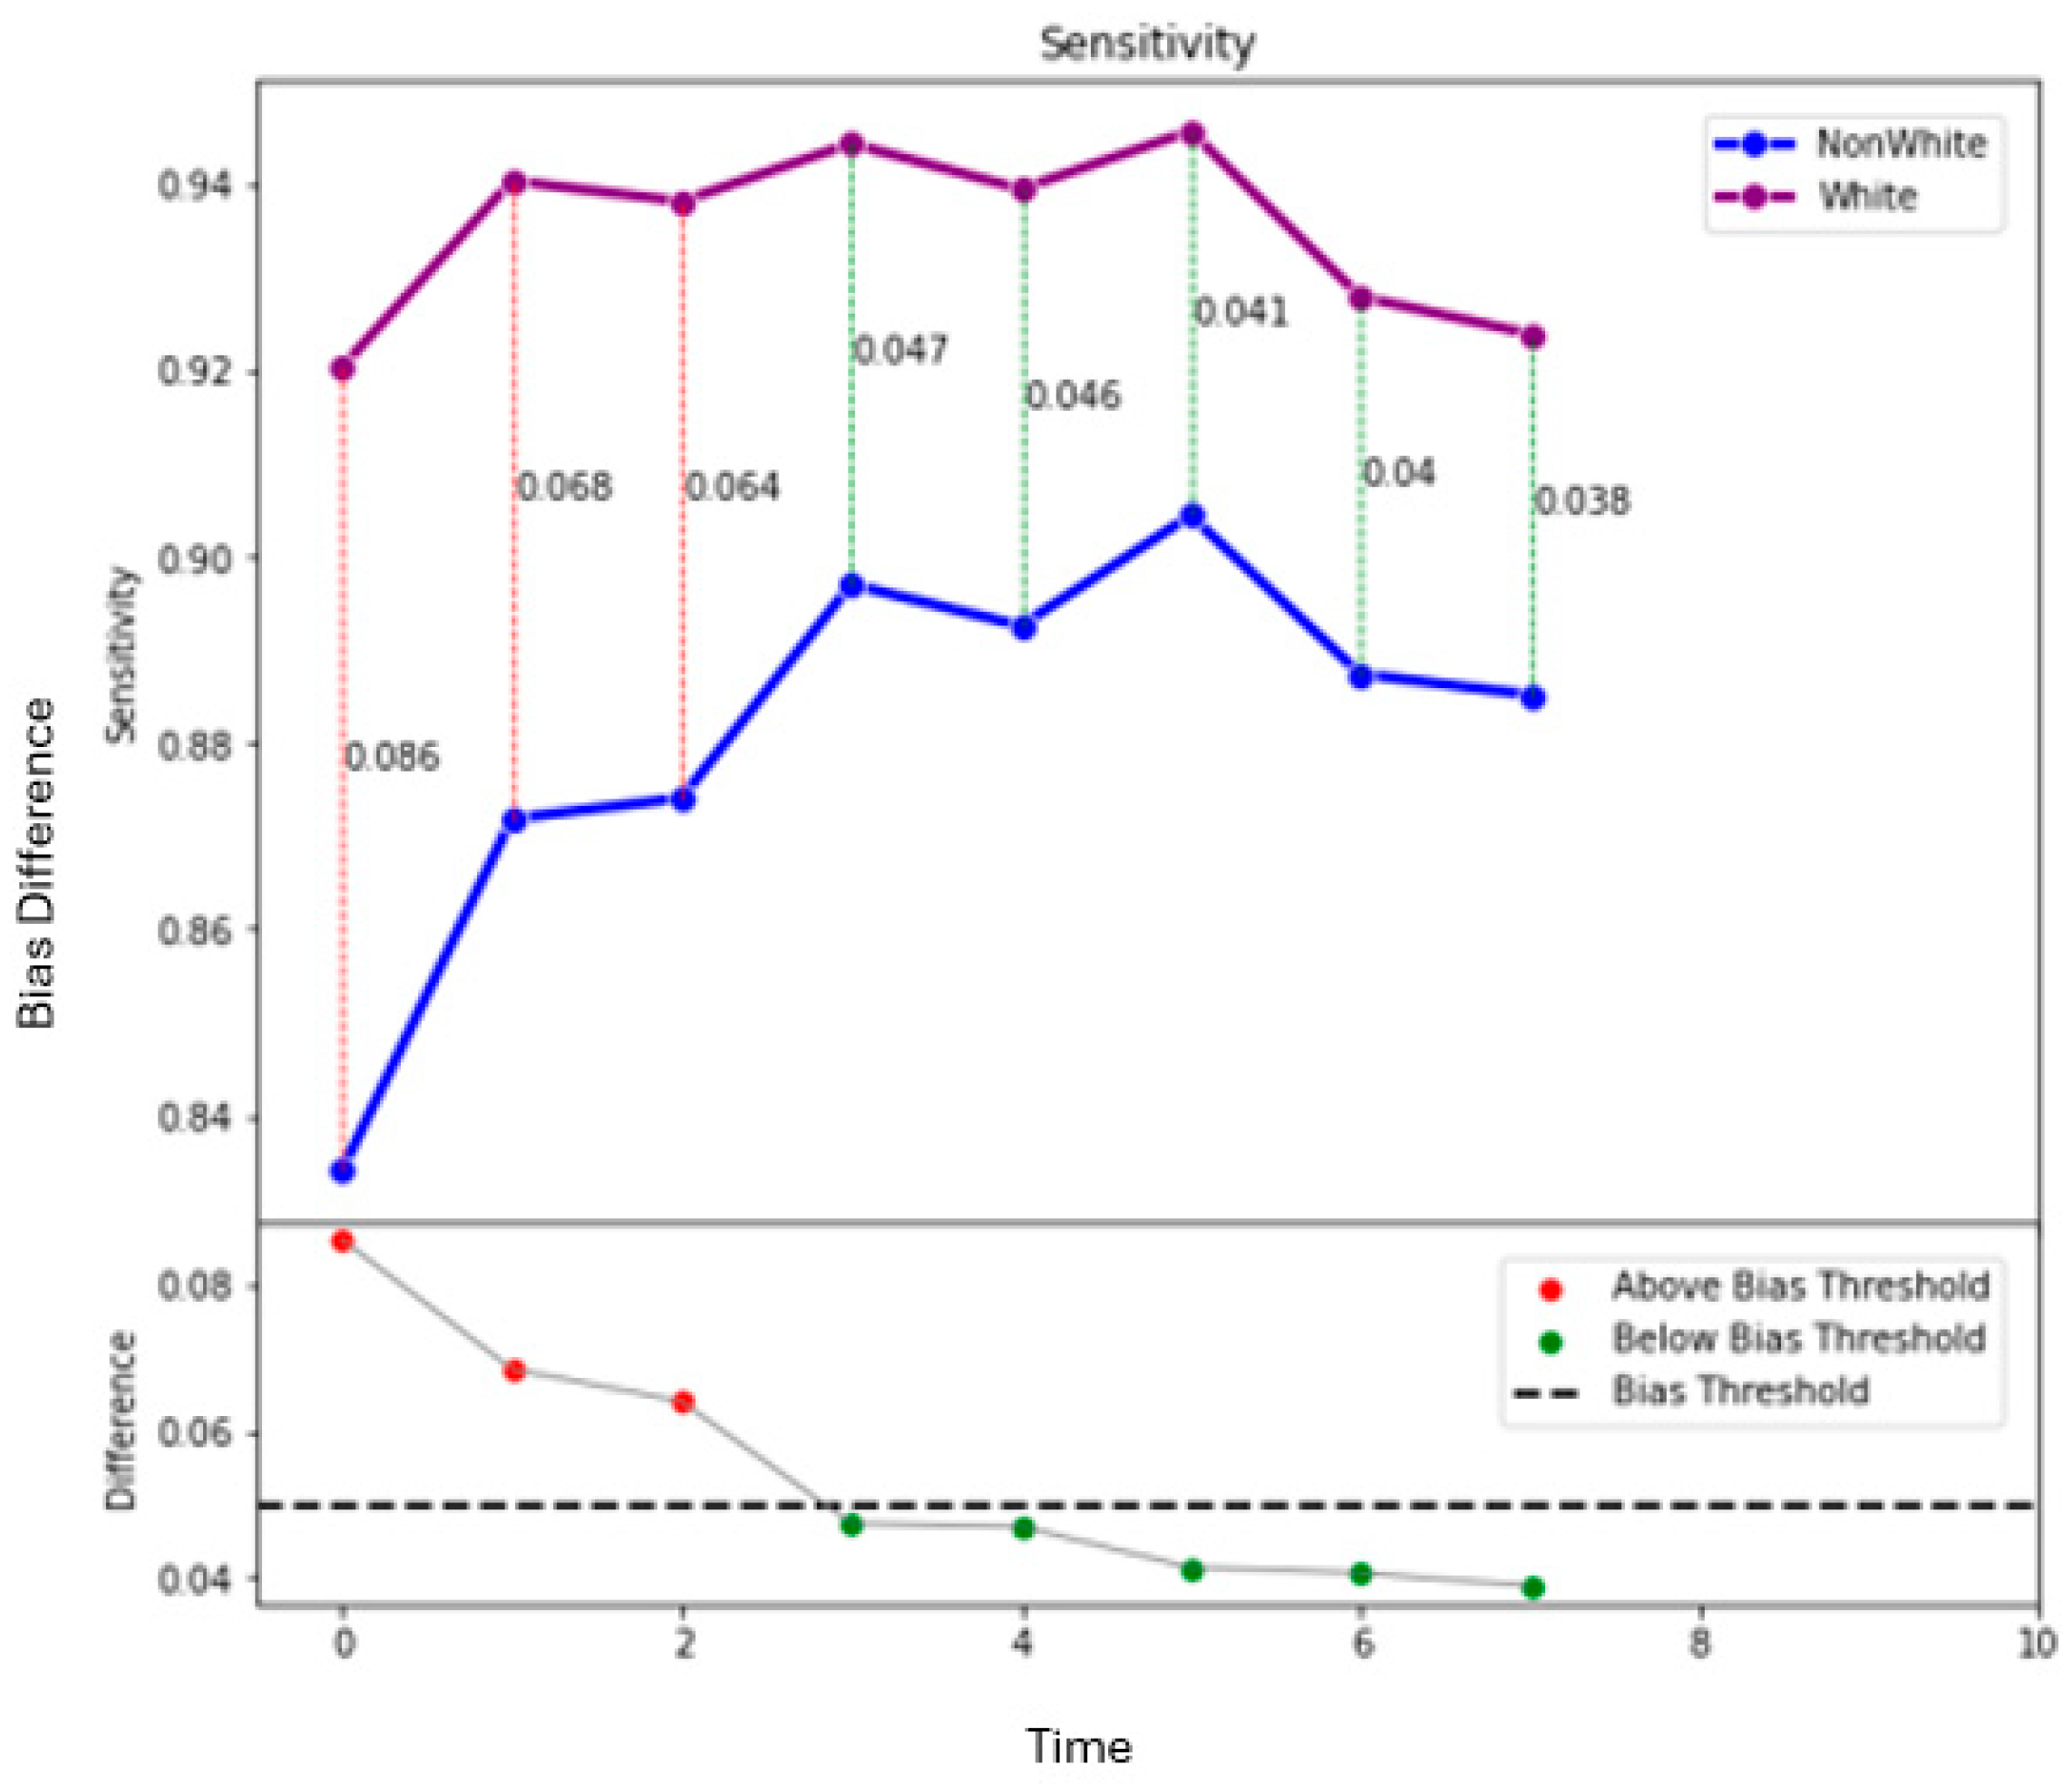
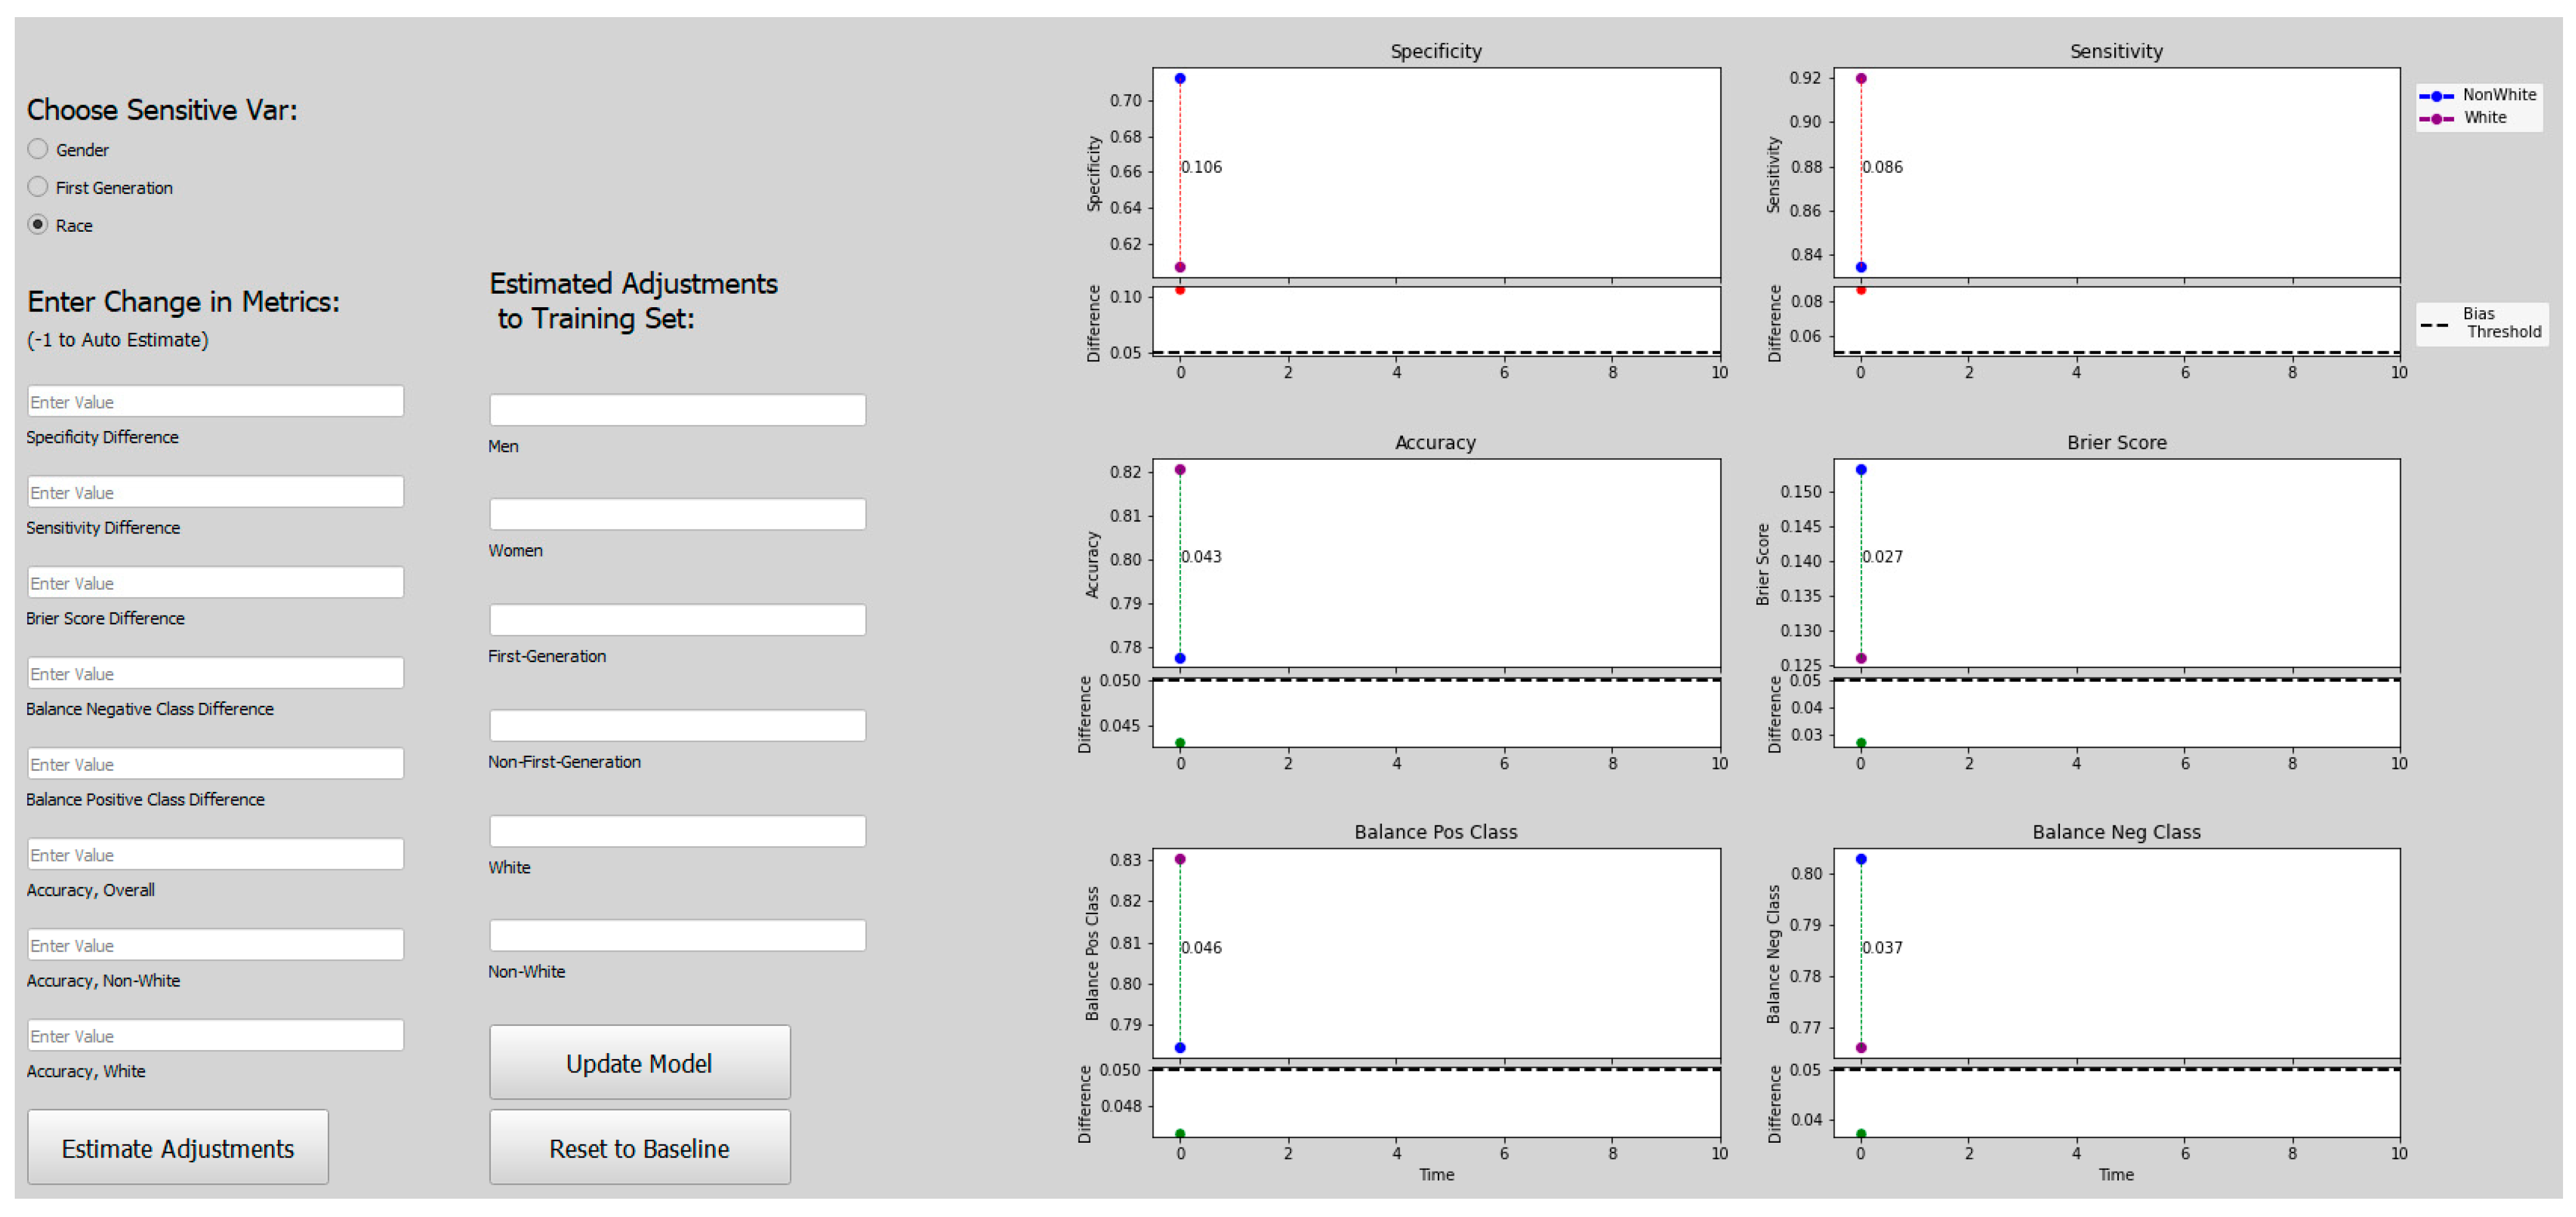
The results for Race are presented in
Table 4 [
2]. All three models show bias when Race is the sensitive variable. All three models predict that white students will be incorrectly admitted more than non-white students (Specificity bias). The model for the Test-Required Cohort and the model for the Test-Optional (Larger) dataset show that non-white students will be incorrectly rejected more than white students (Sensitivity bias).
Table 4.
Model Bias when Race is a Sensitive Variable.
Table 4.
Model Bias when Race is a Sensitive Variable.
| | Overall | Non-White | White |
|---|
| Test-Required Cohort | | | |
| Model Accuracy: | 0.879 | 0.873 | 0.884 |
| Specificity *: | 0.854 | 0.882 | 0.824 |
| Sensitivity *: | 0.899 | 0.86 | 0.918 |
| Test-Optional Cohort | | | |
| Model Accuracy: | 0.885 | 0.871 | 0.896 |
| Specificity *: | 0.725 | 0.751 | 0.694 |
| Sensitivity: | 0.950 | 0.937 | 0.960 |
| Test-Optional (Larger) | | | |
| Model Accuracy *: | 0.804 | 0.775 | 0.826 |
| Specificity *: | 0.673 | 0.717 | 0.622 |
| Sensitivity *: | 0.883 | 0.826 | 0.917 |
3.3. Threshold Adjustments
The Support Vector Machine used to create the predictive models returns a probability score representing the proximity of the data point to the decision threshold. Data with scores >= 0.5 represent students the model says to admit, and those with scores < 0.5 are those the model says not to admit. These scores can be used to infer the confidence of the model about a specific student. For example, a probability score of 0.9 means that the model is very confident a student should be admitted, while a probability score of 0.55 indicates the model thinks the student should be admitted, but is less confident in its decision.
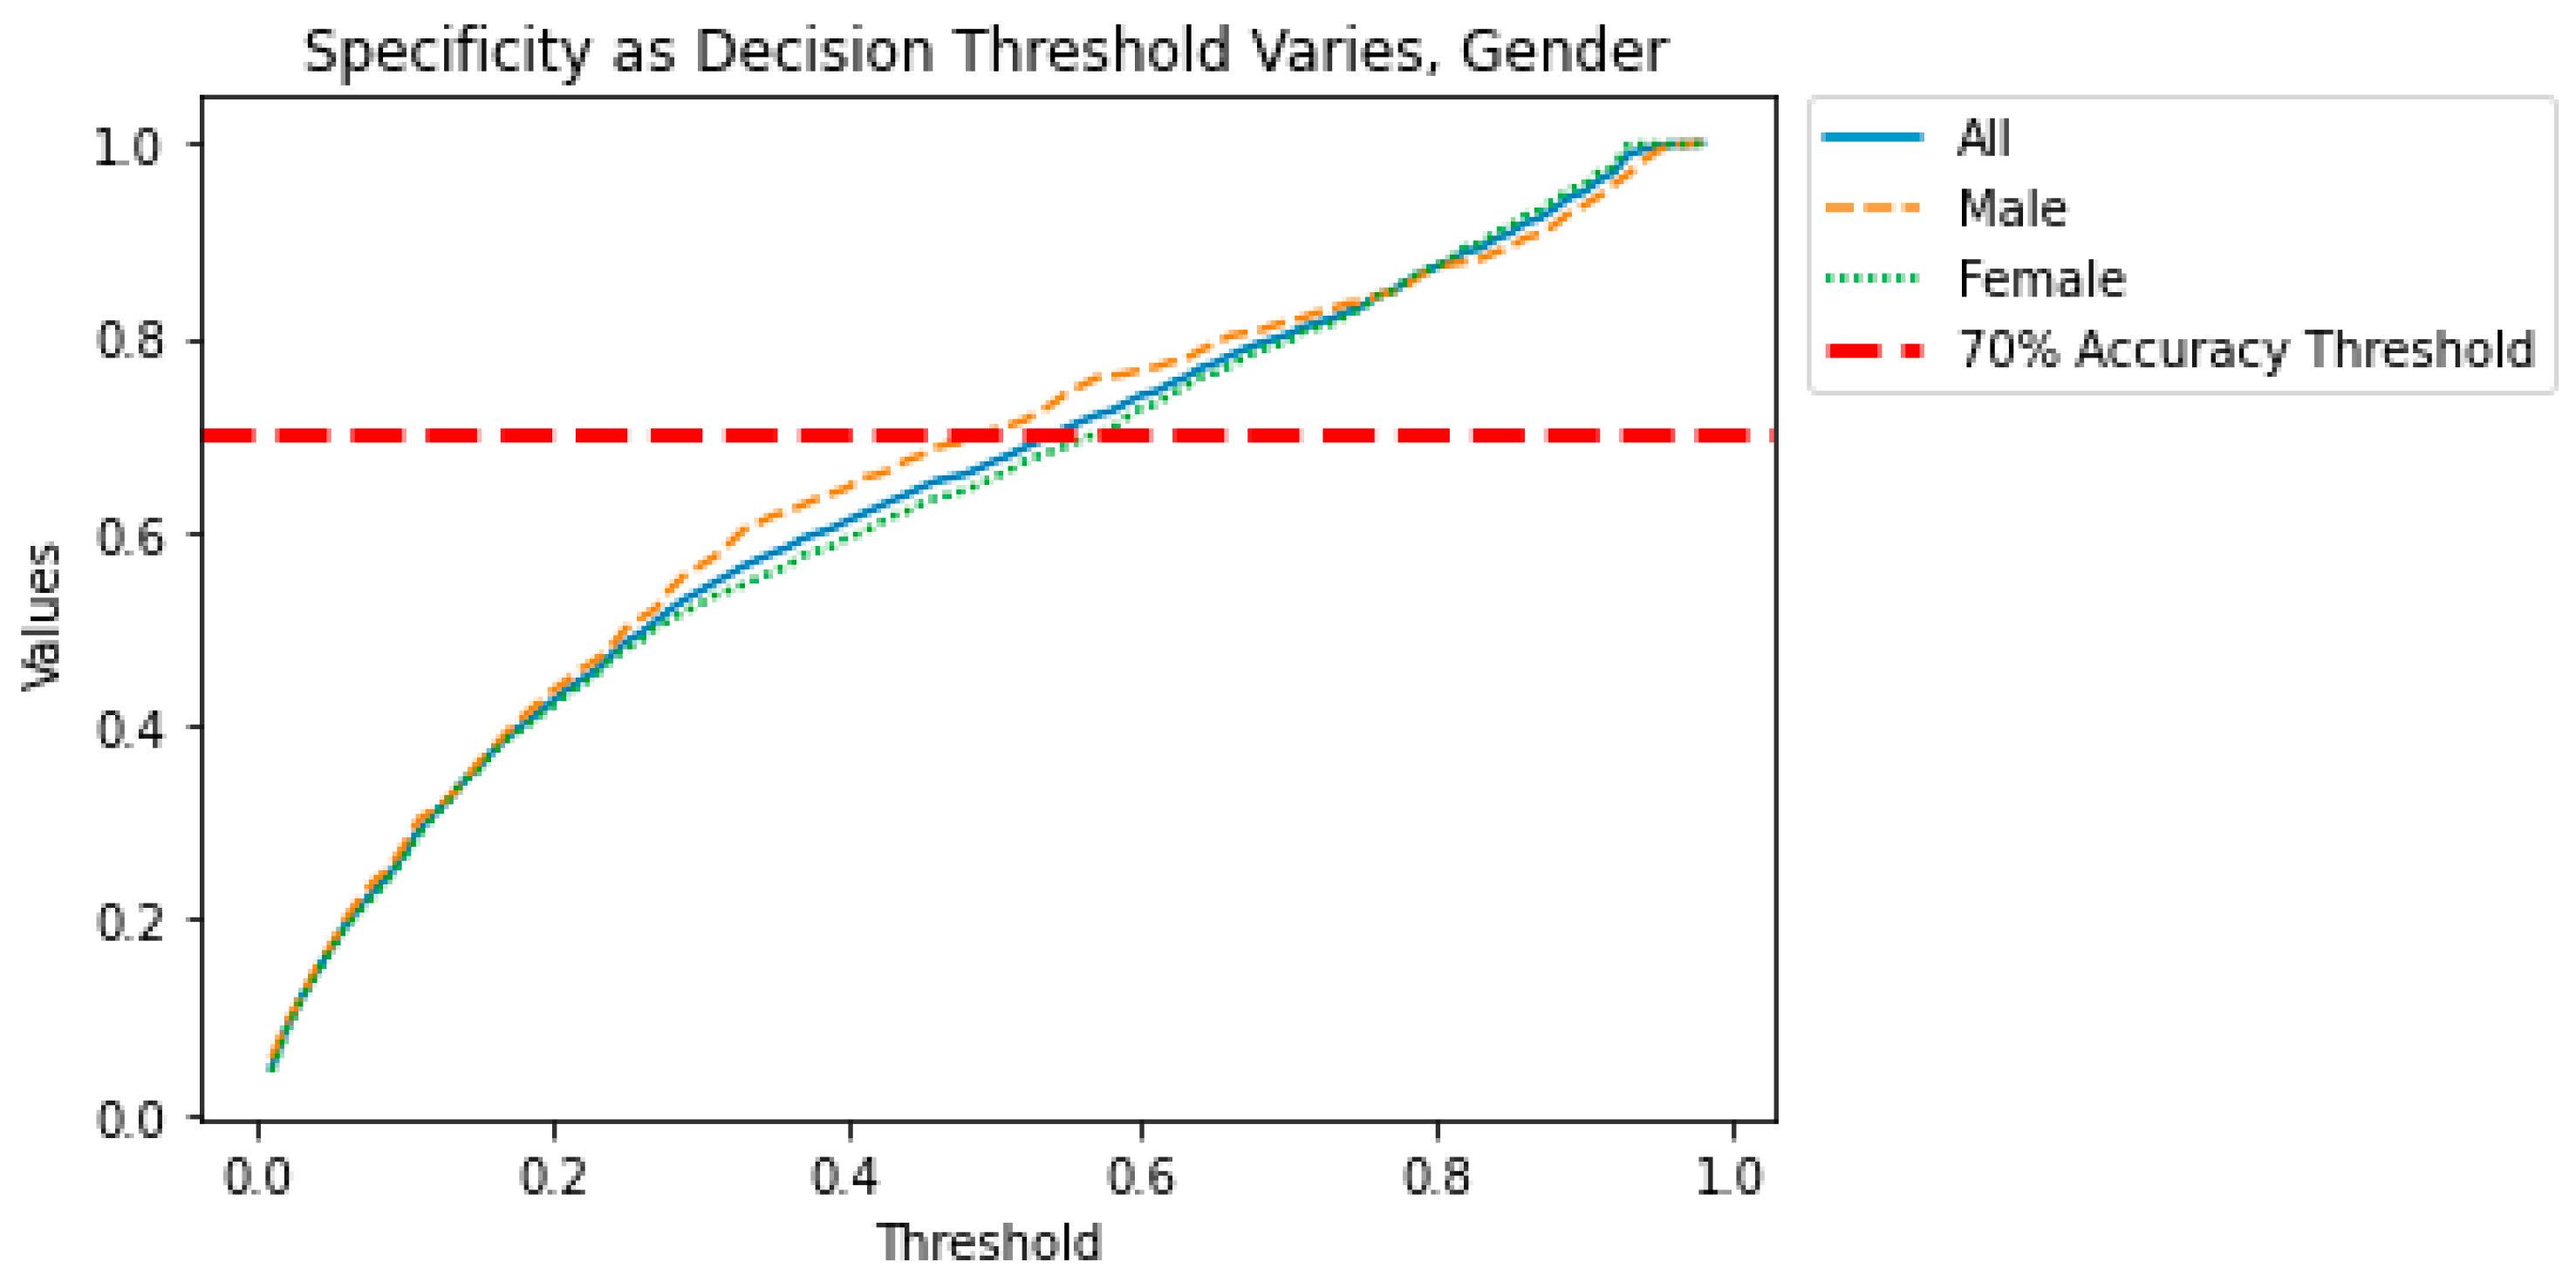
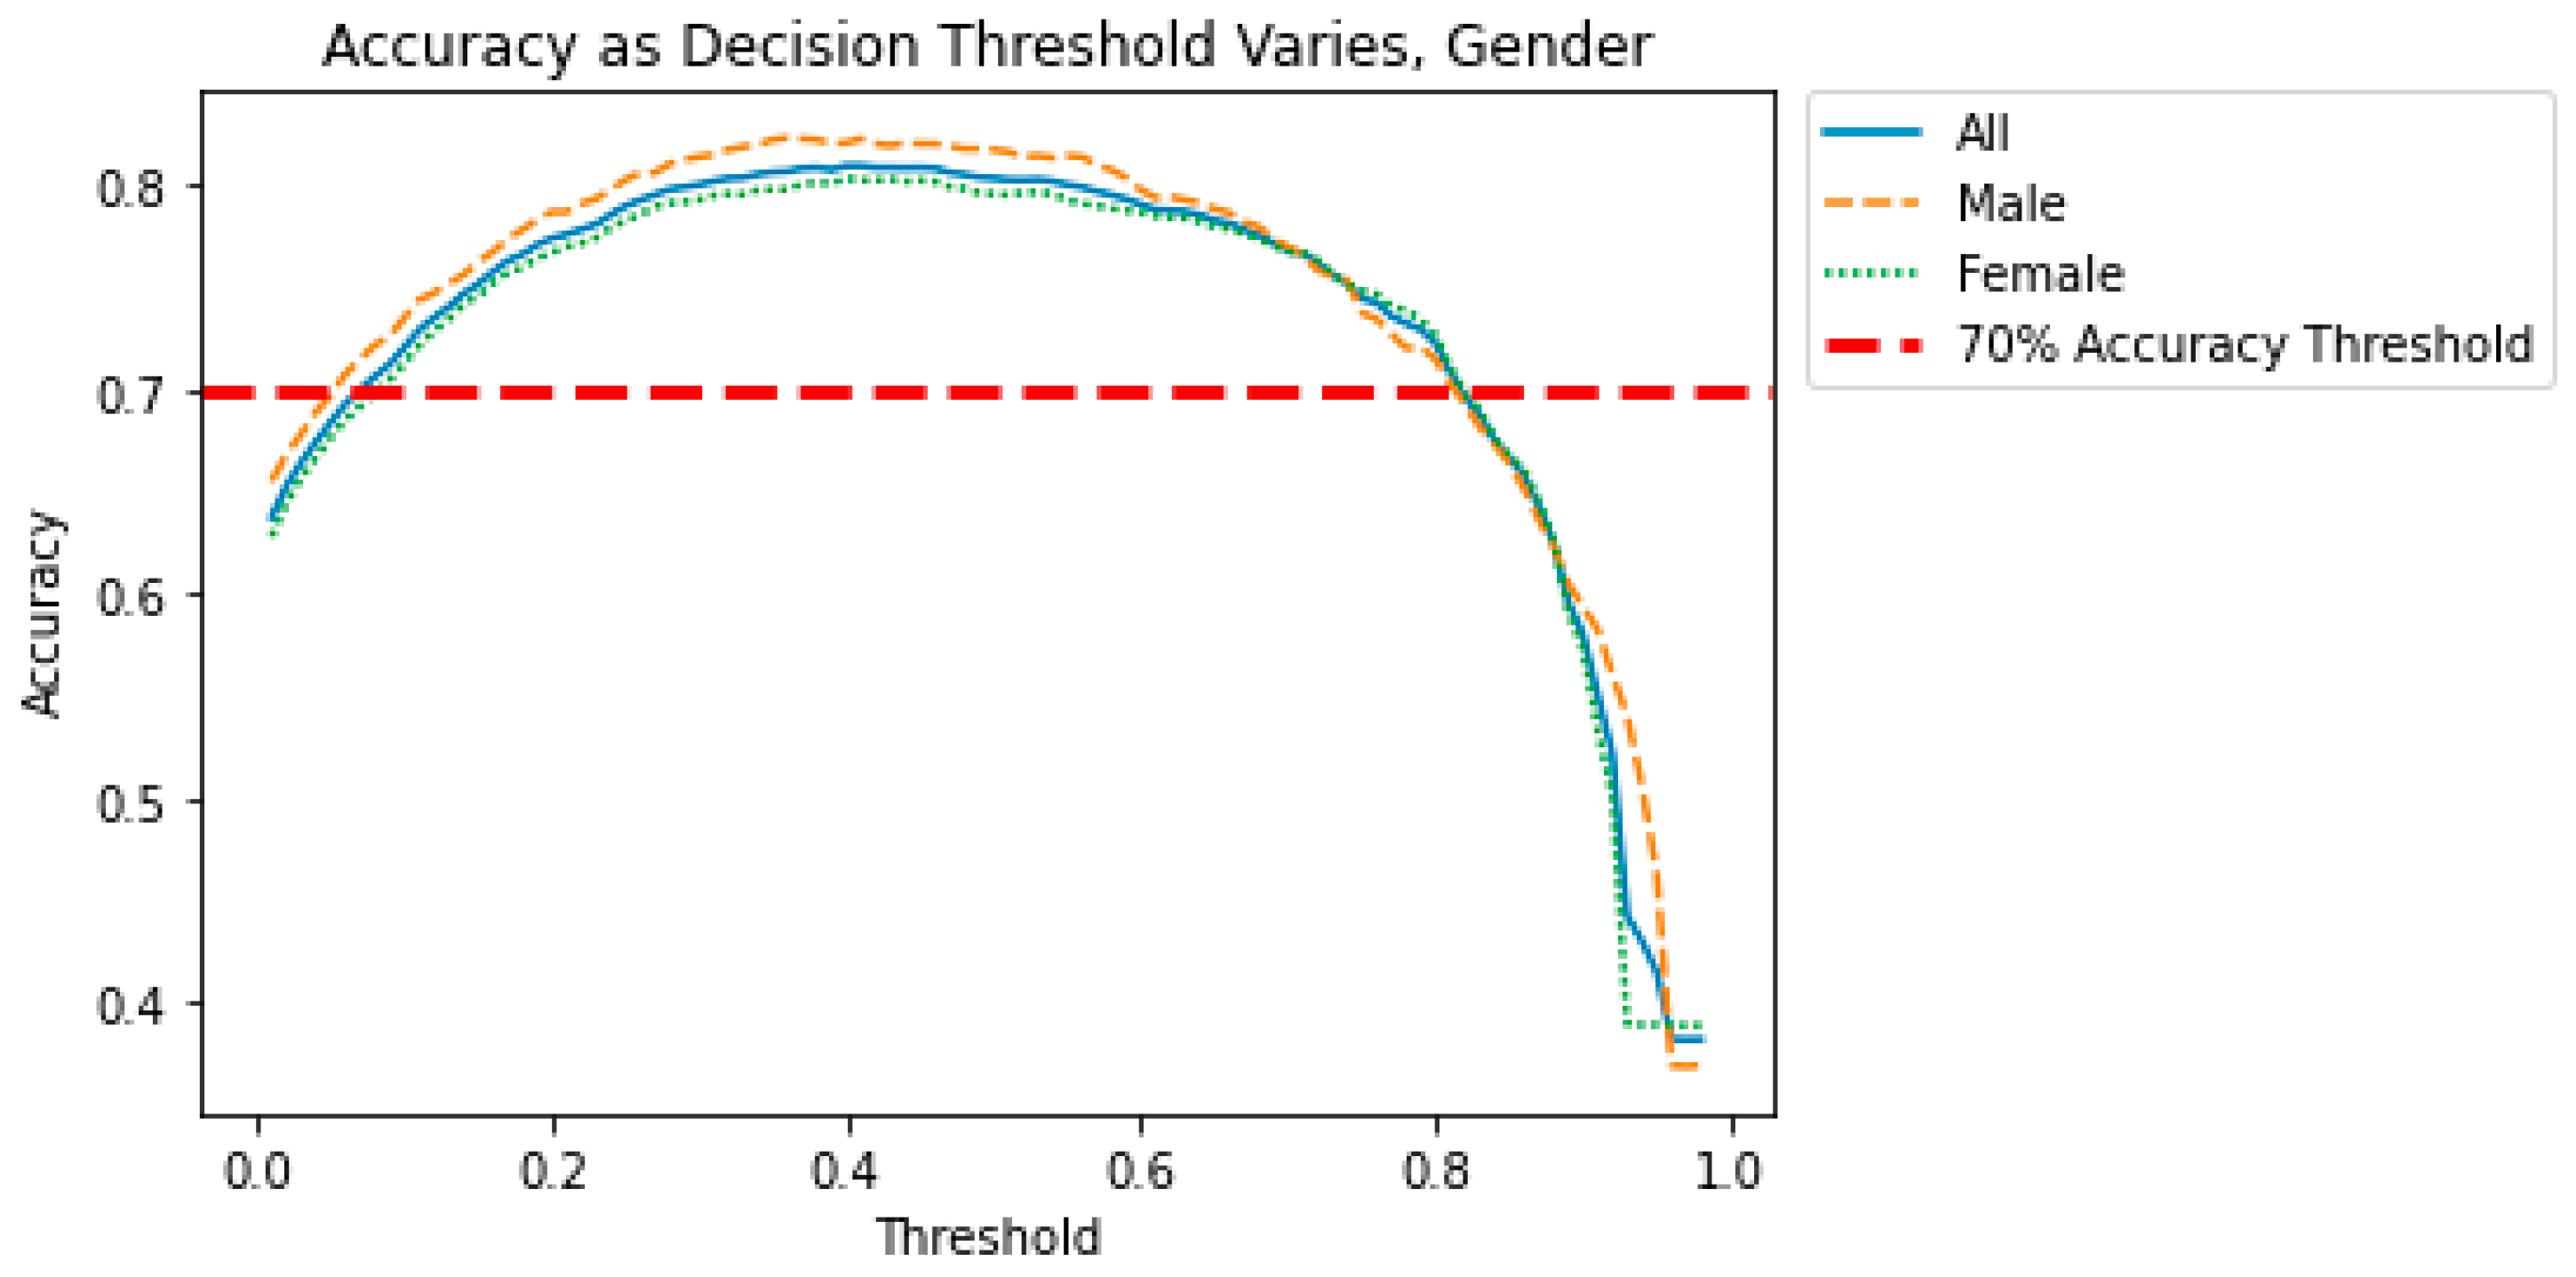
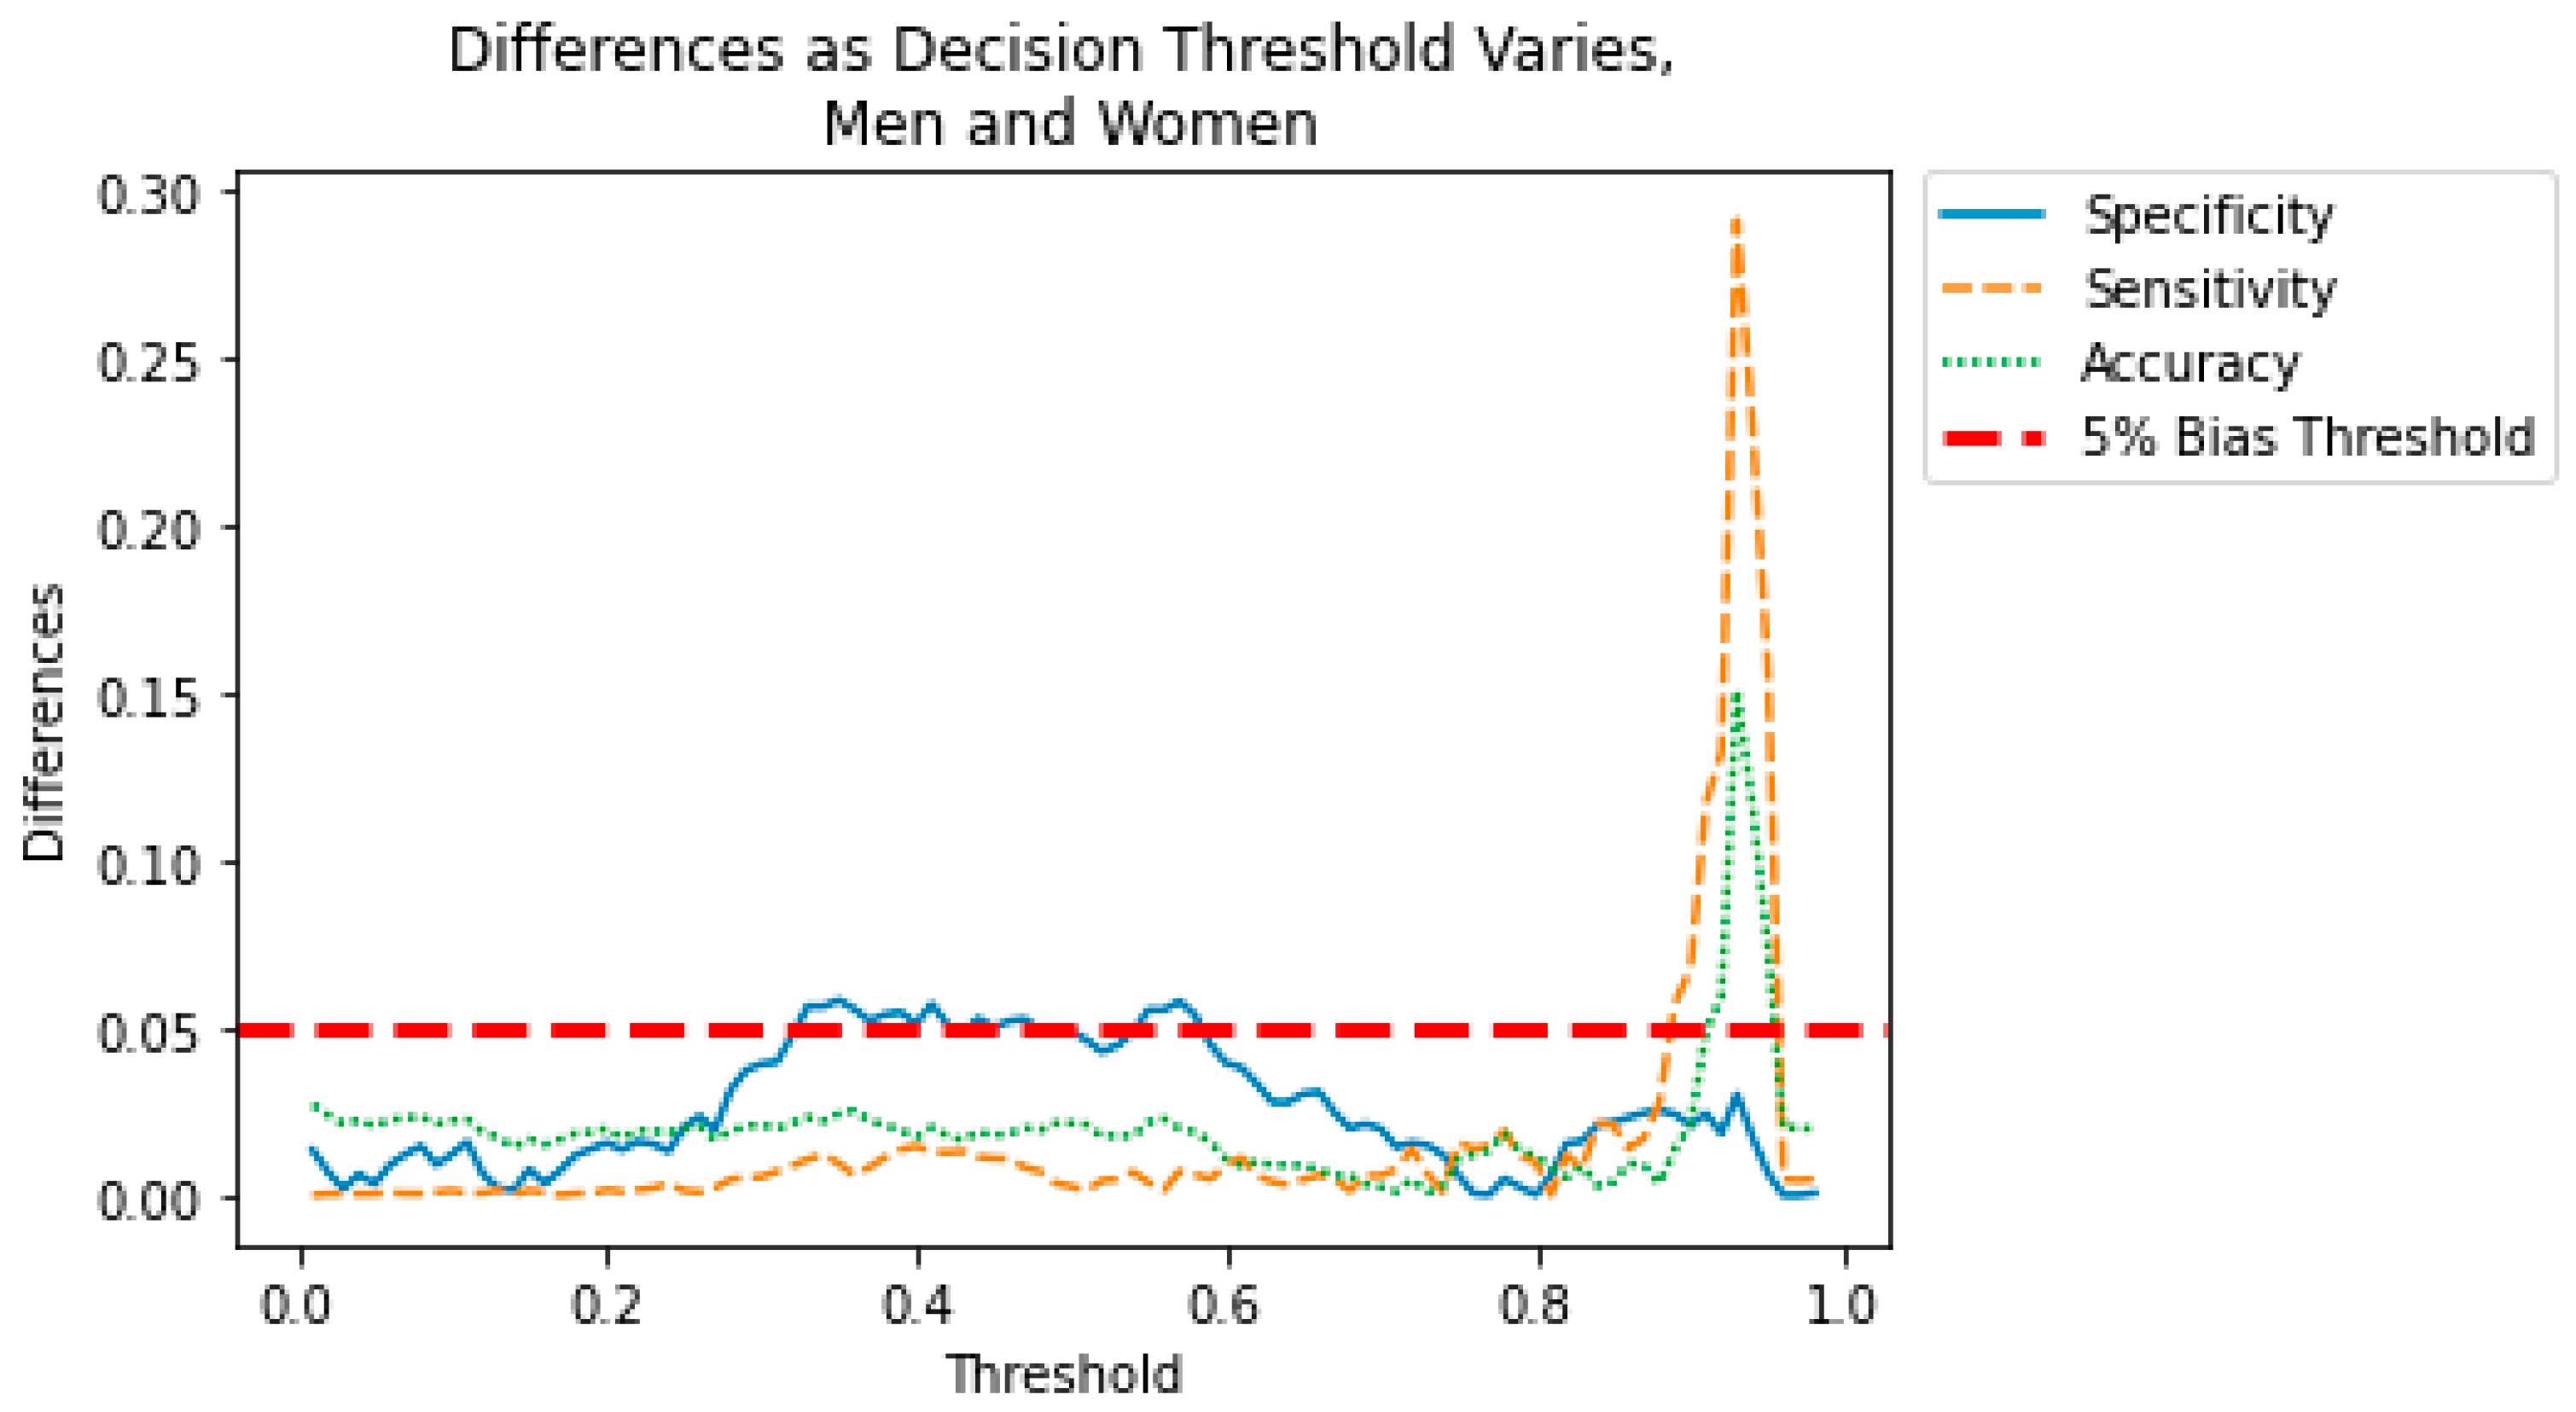
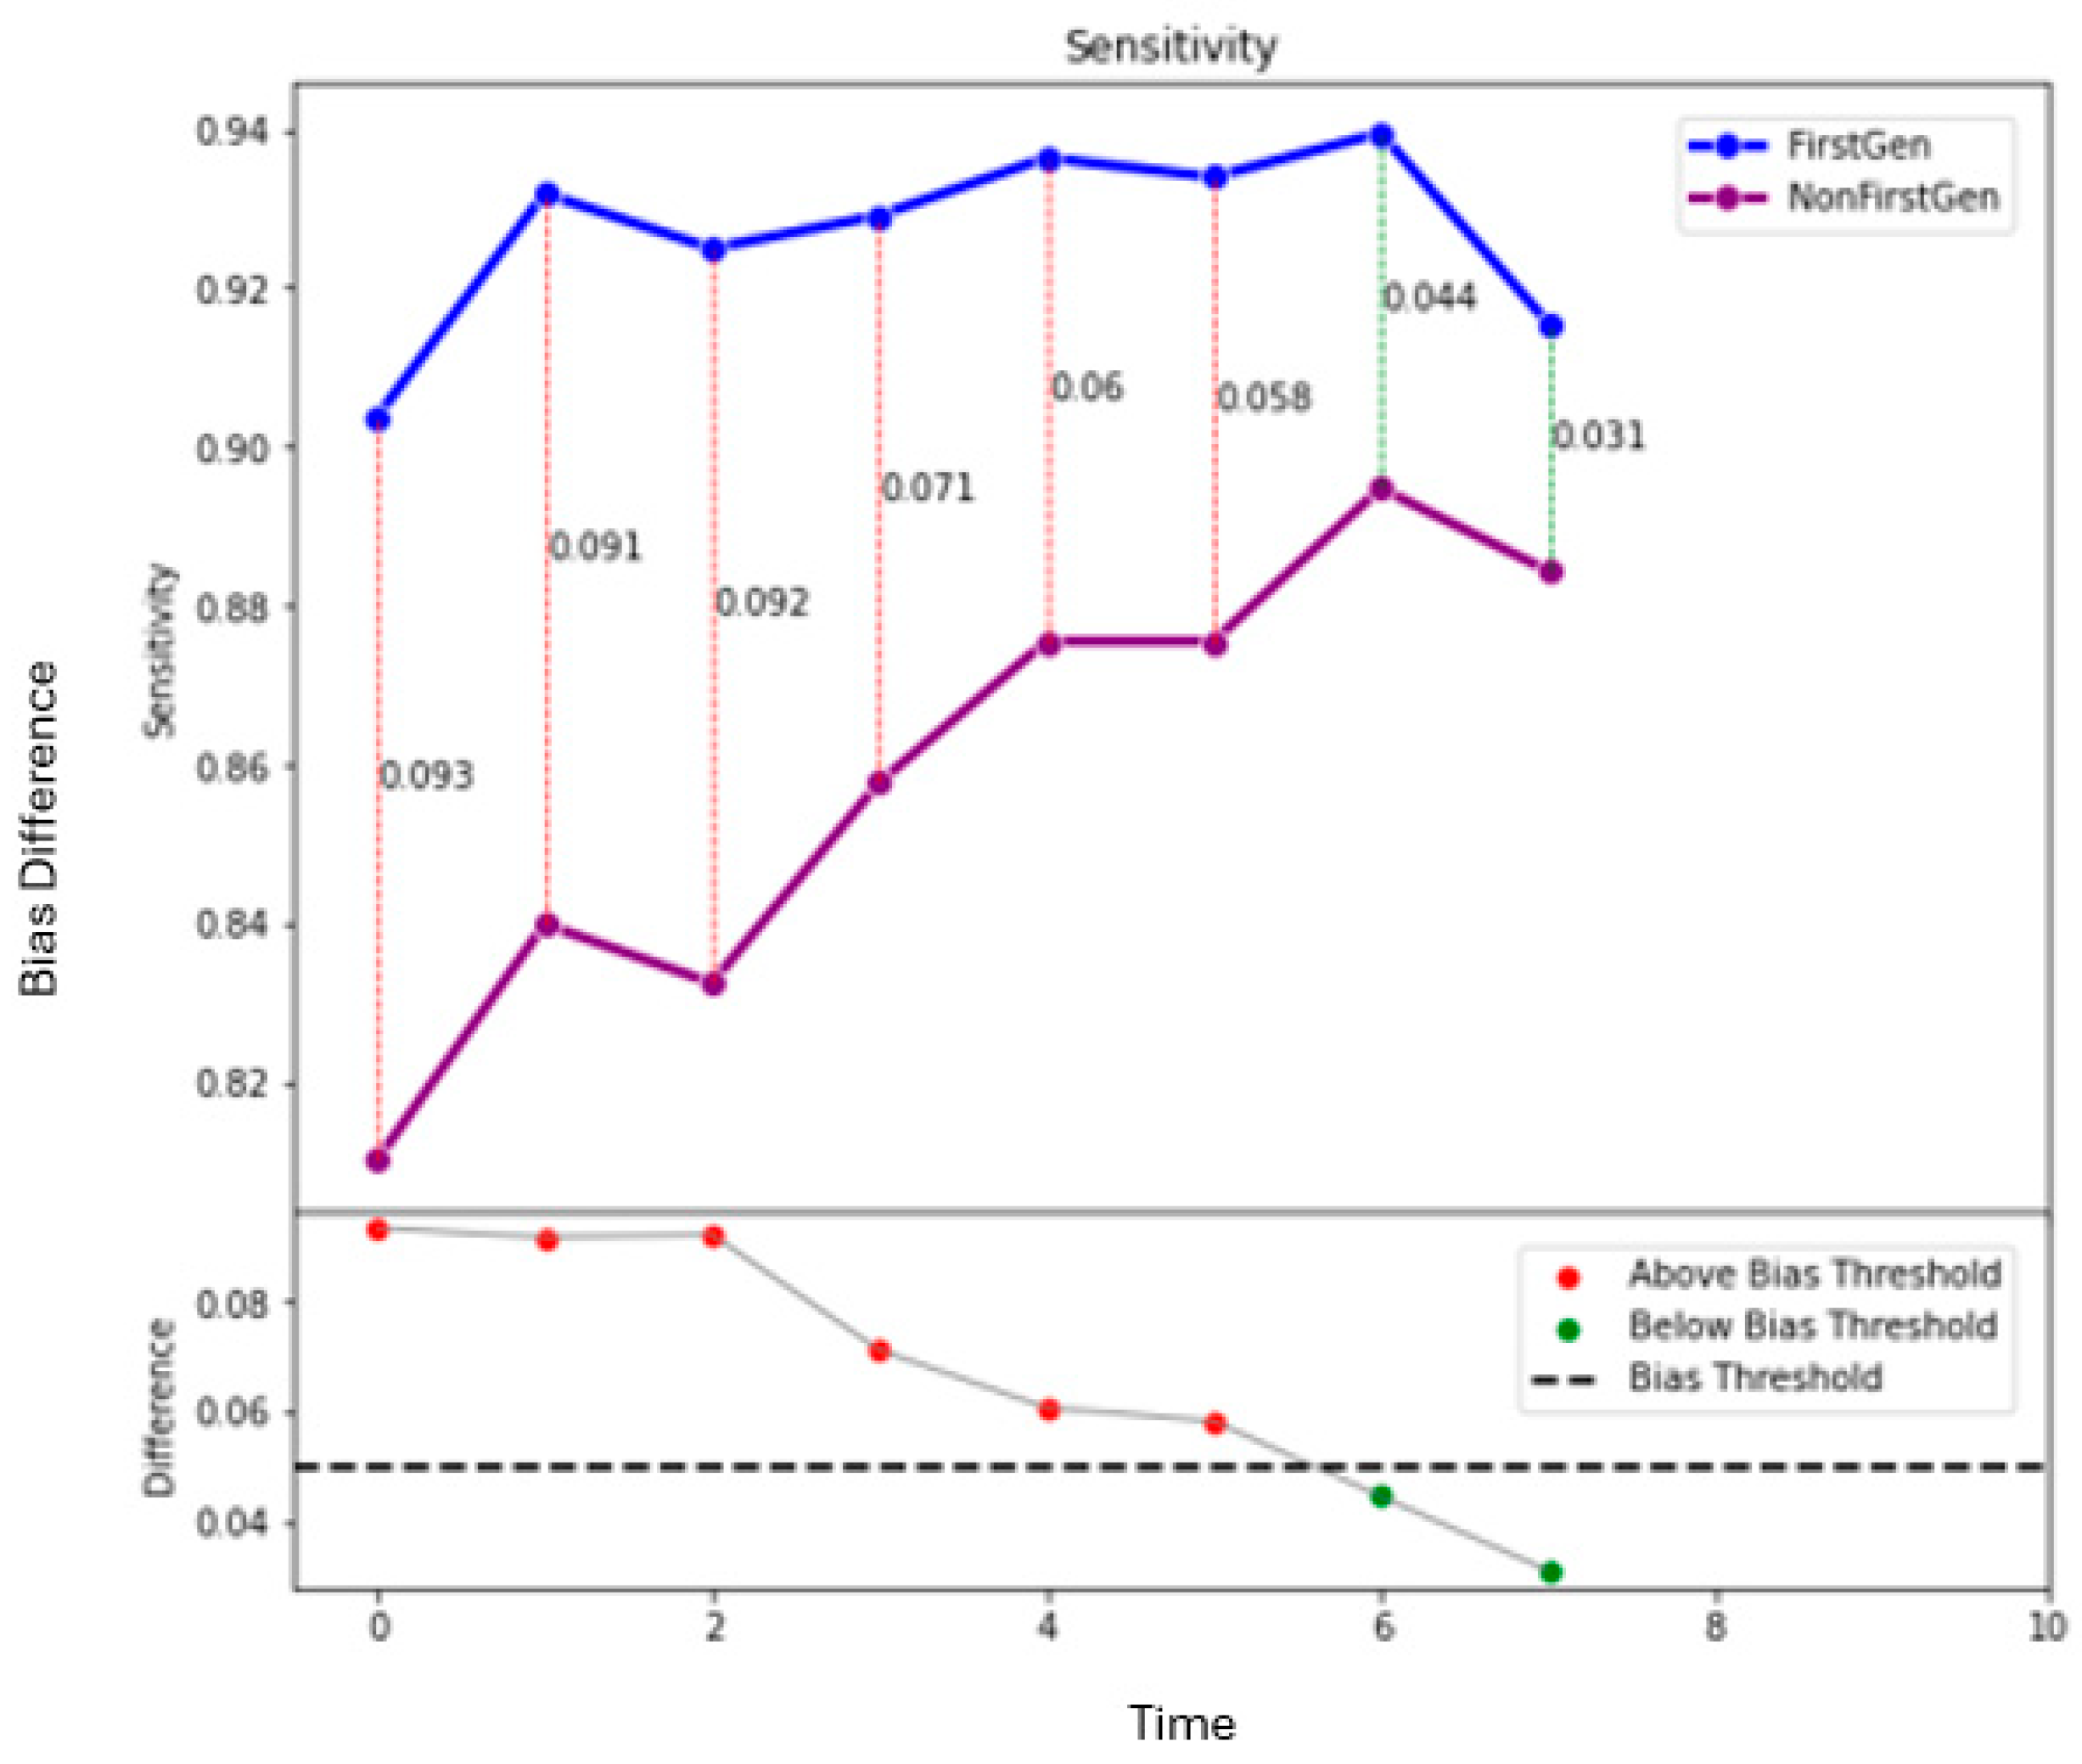
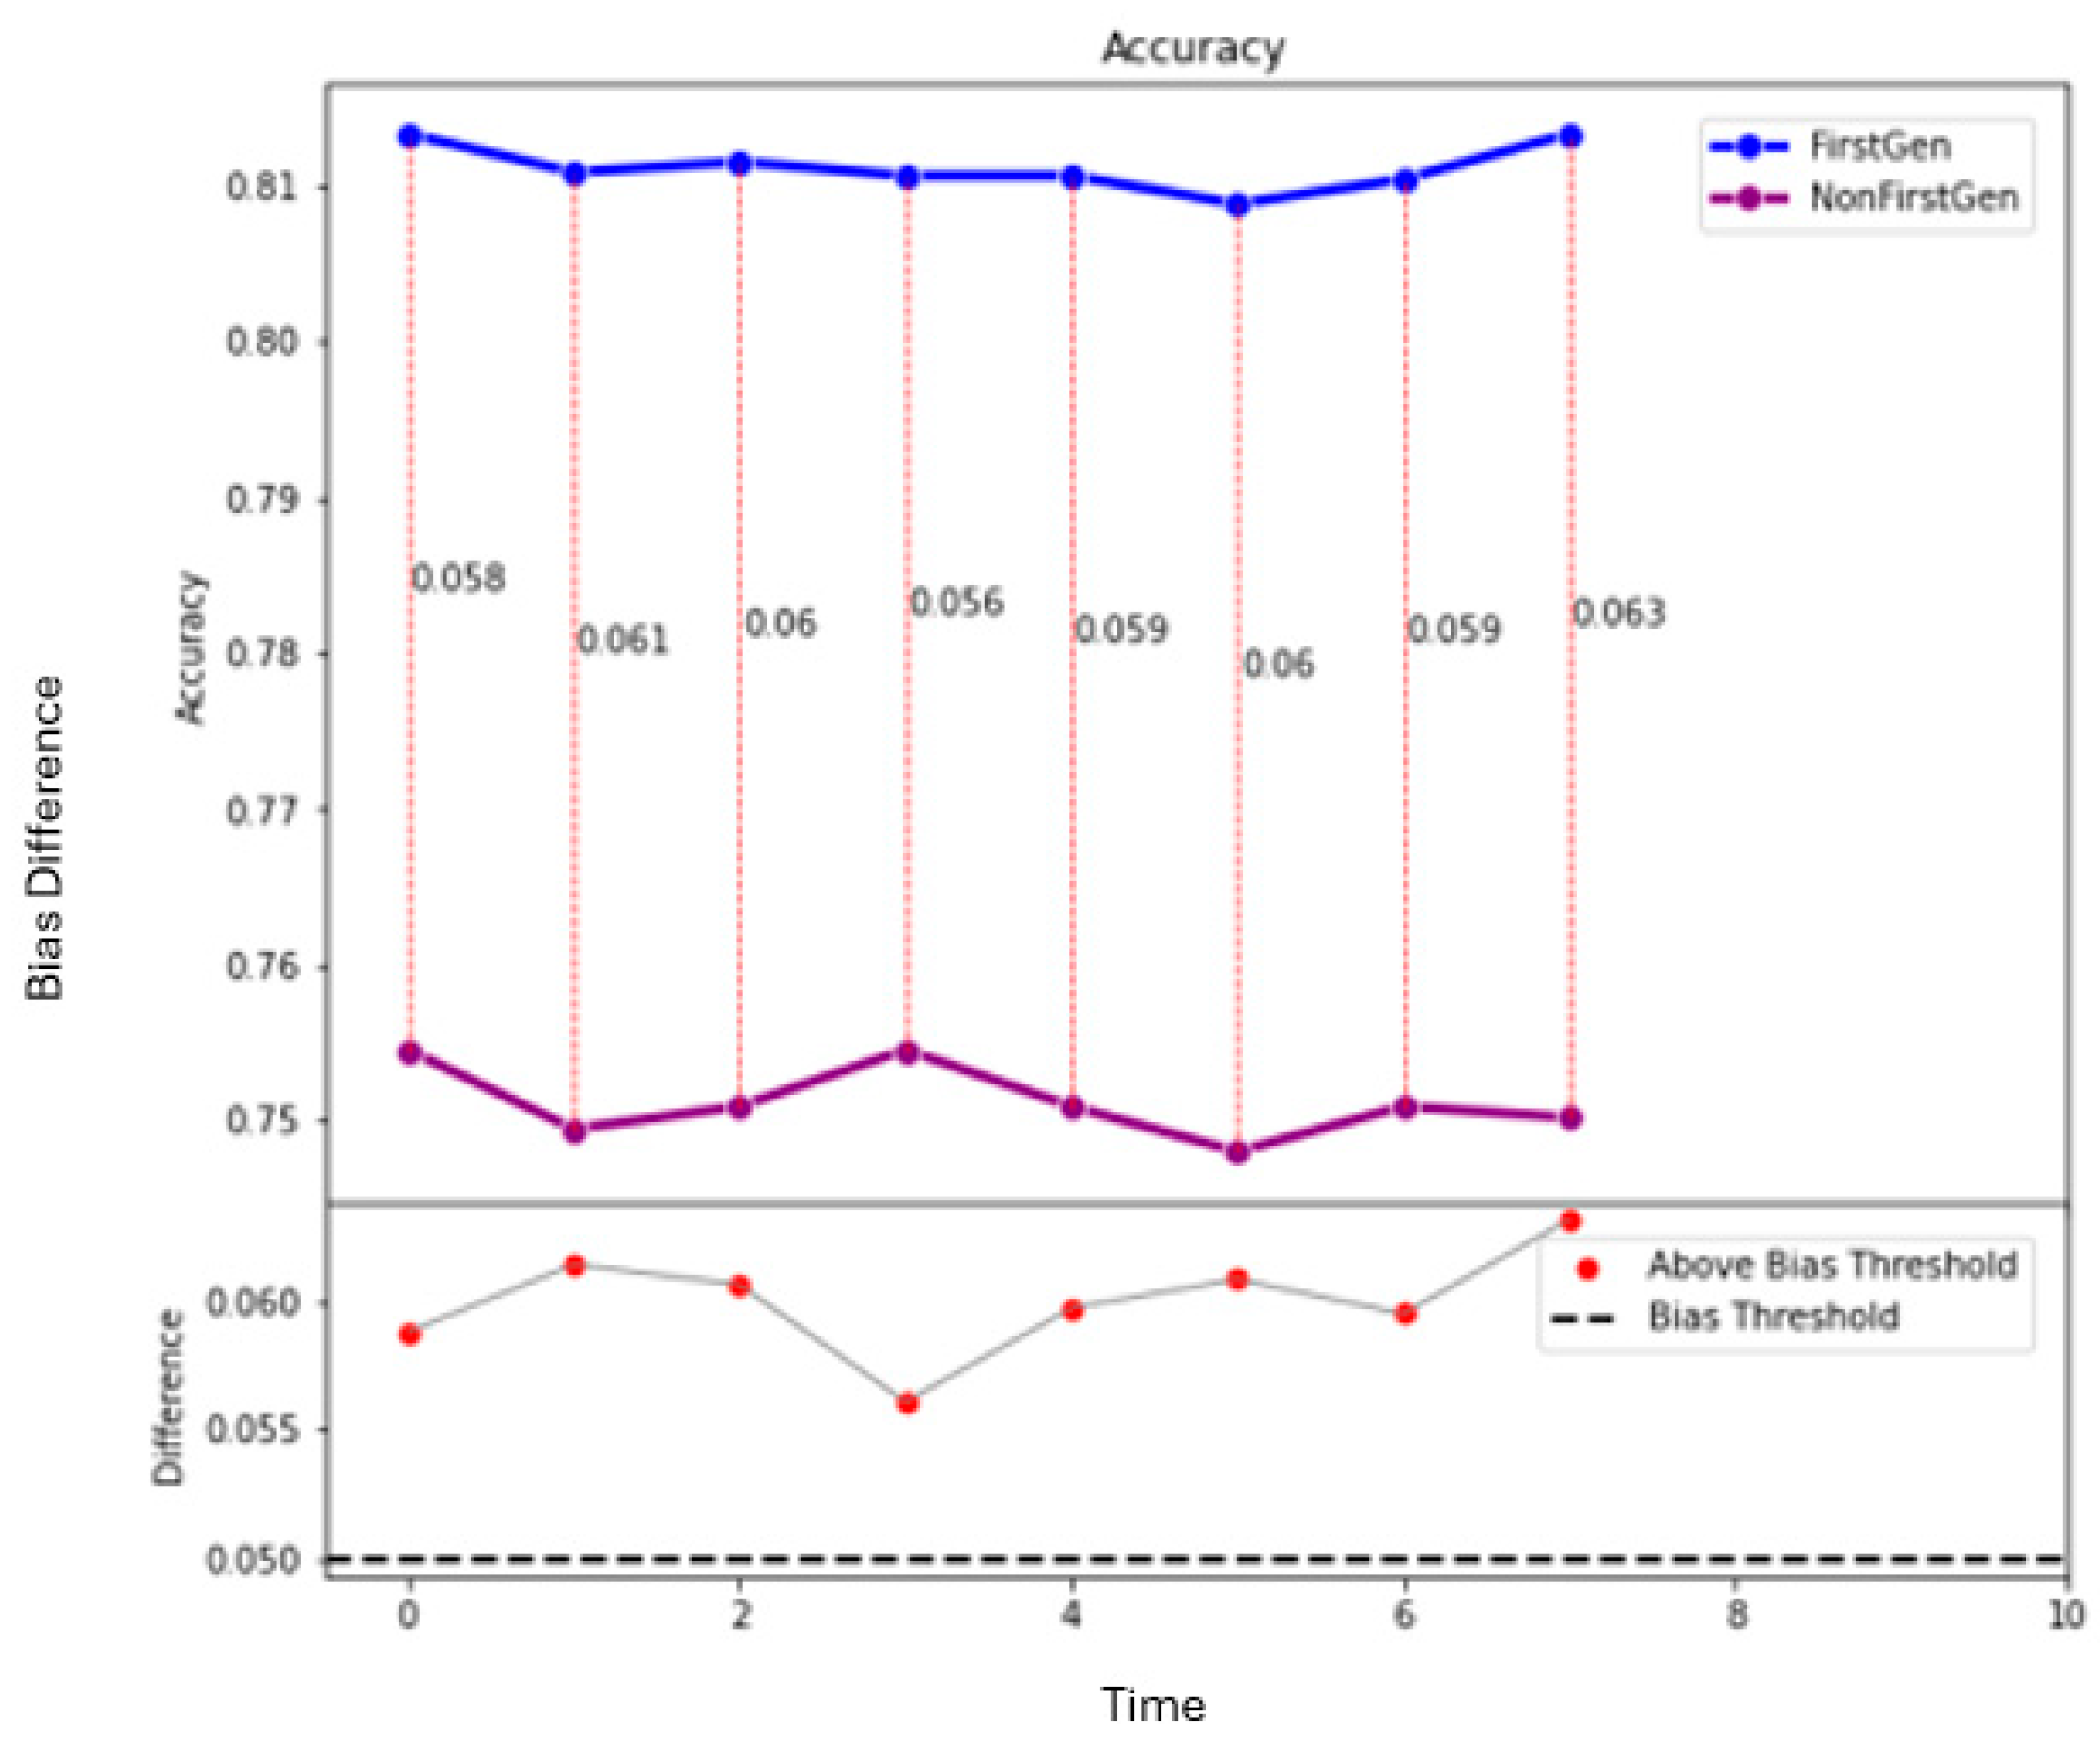
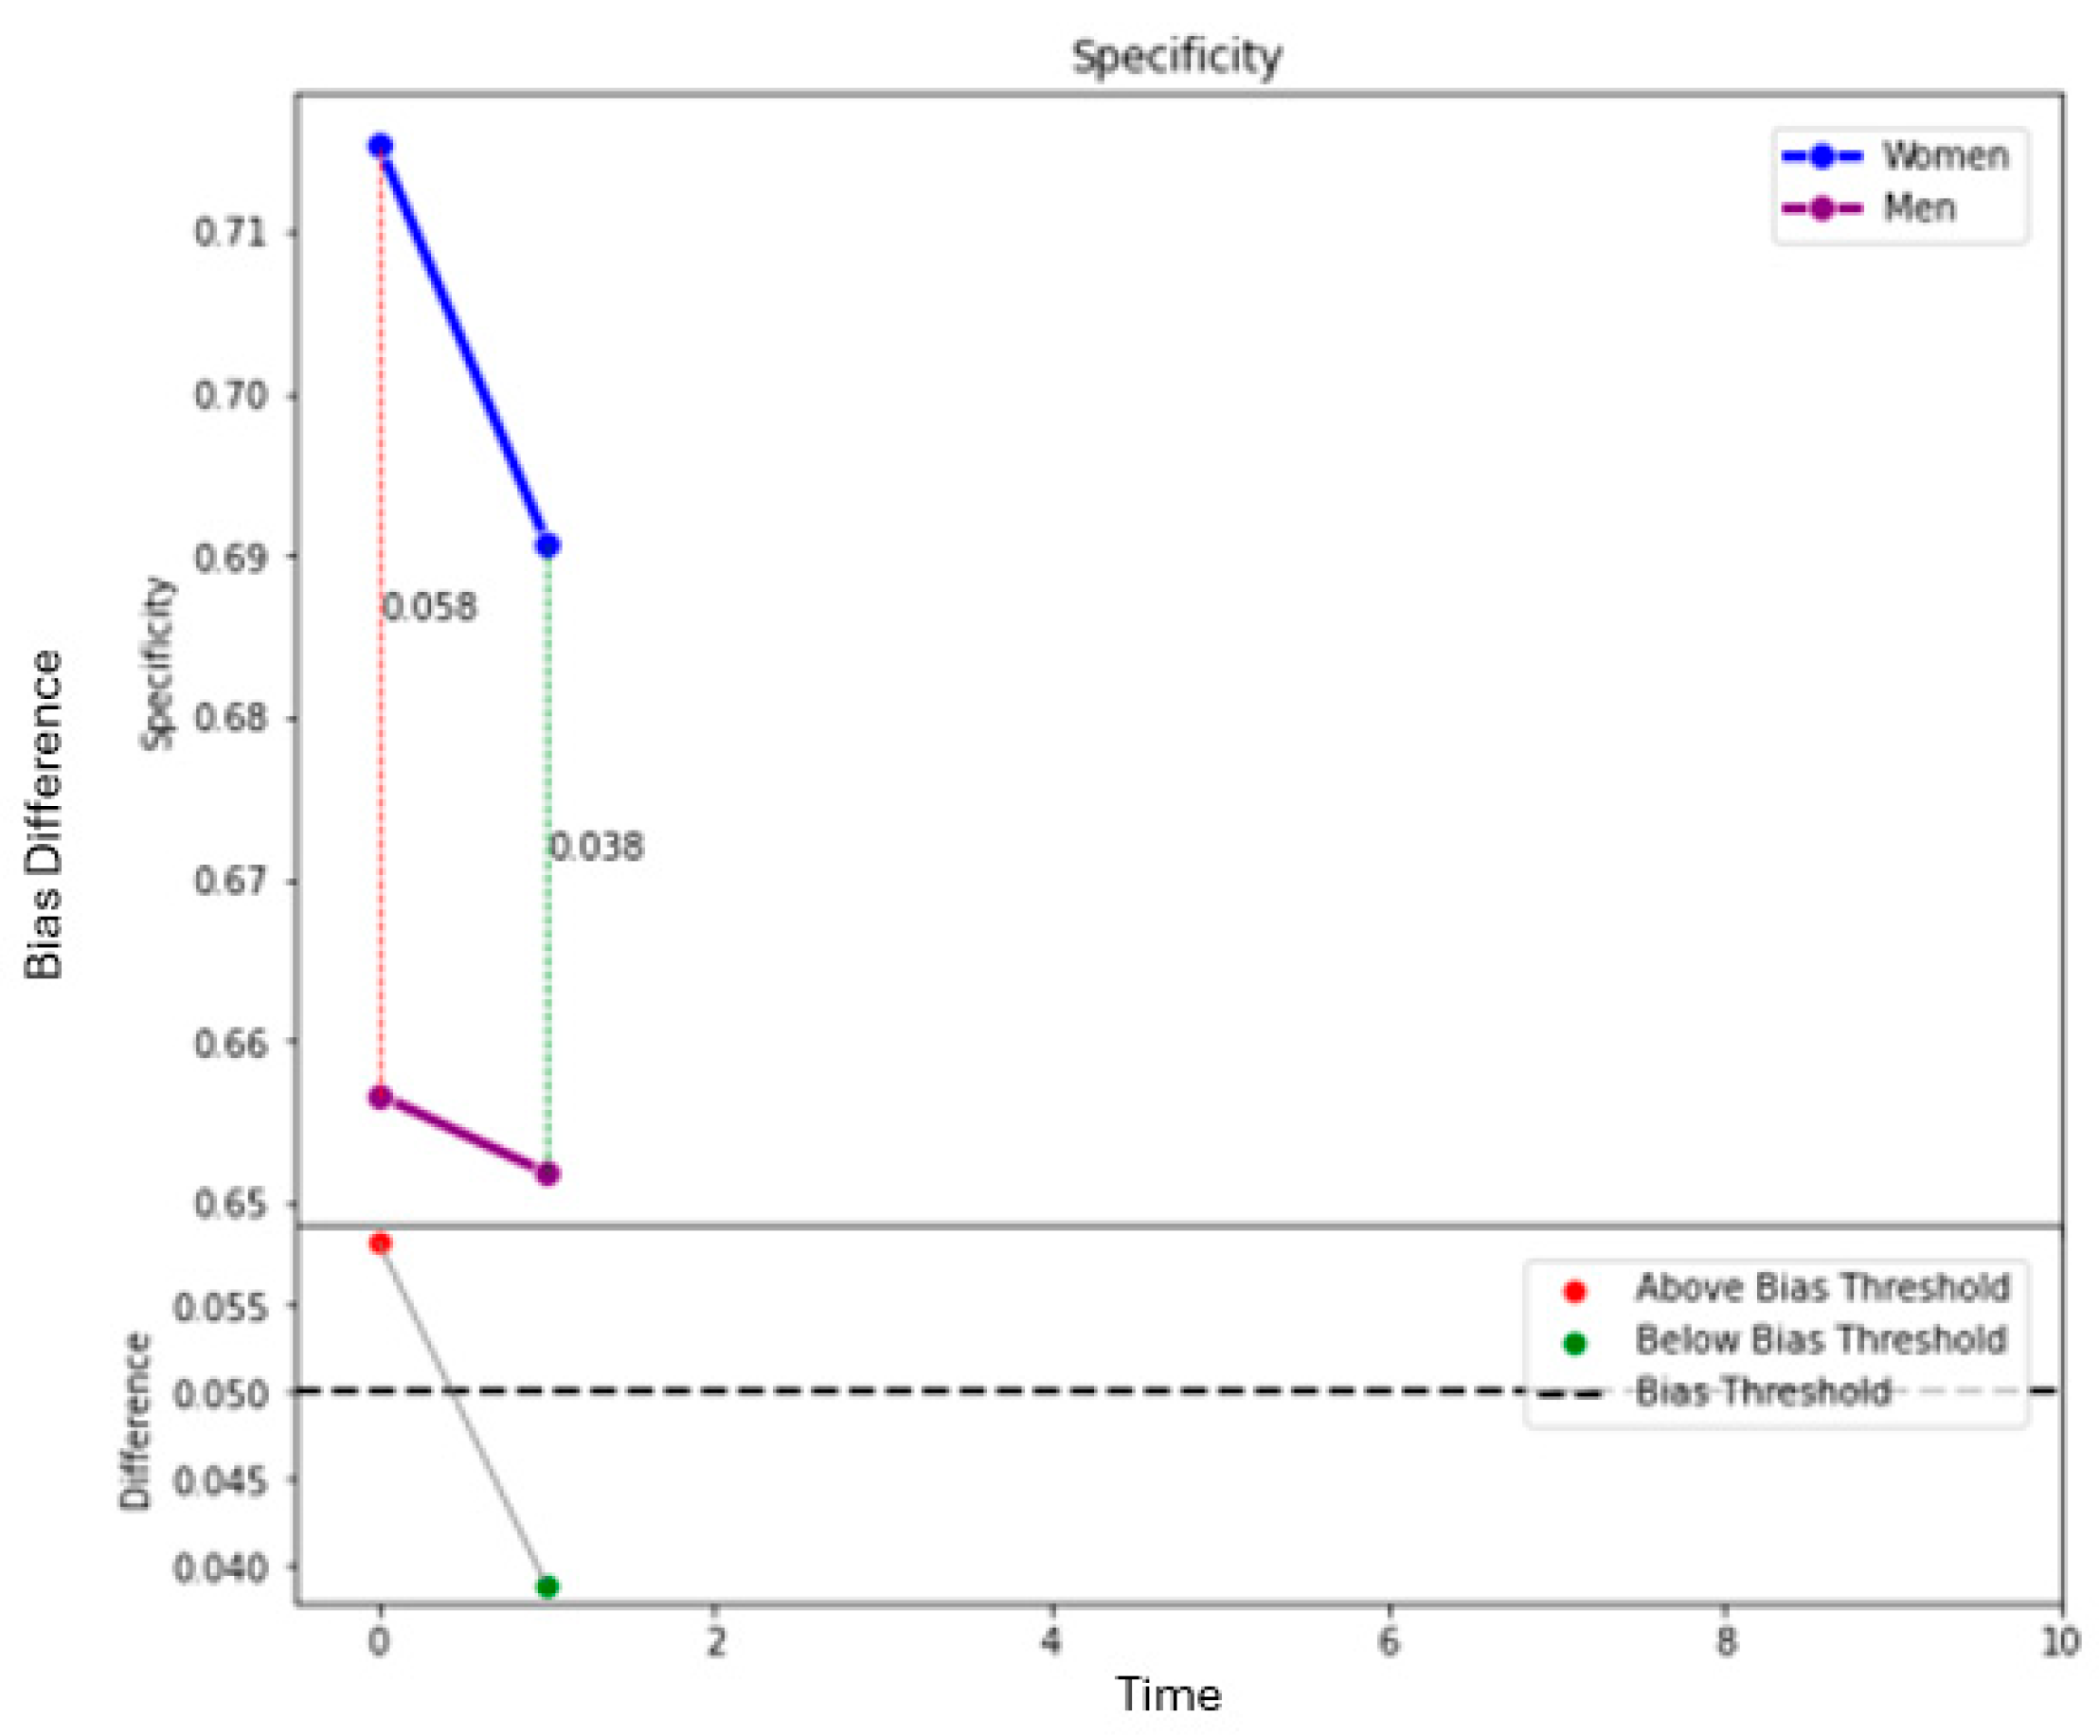
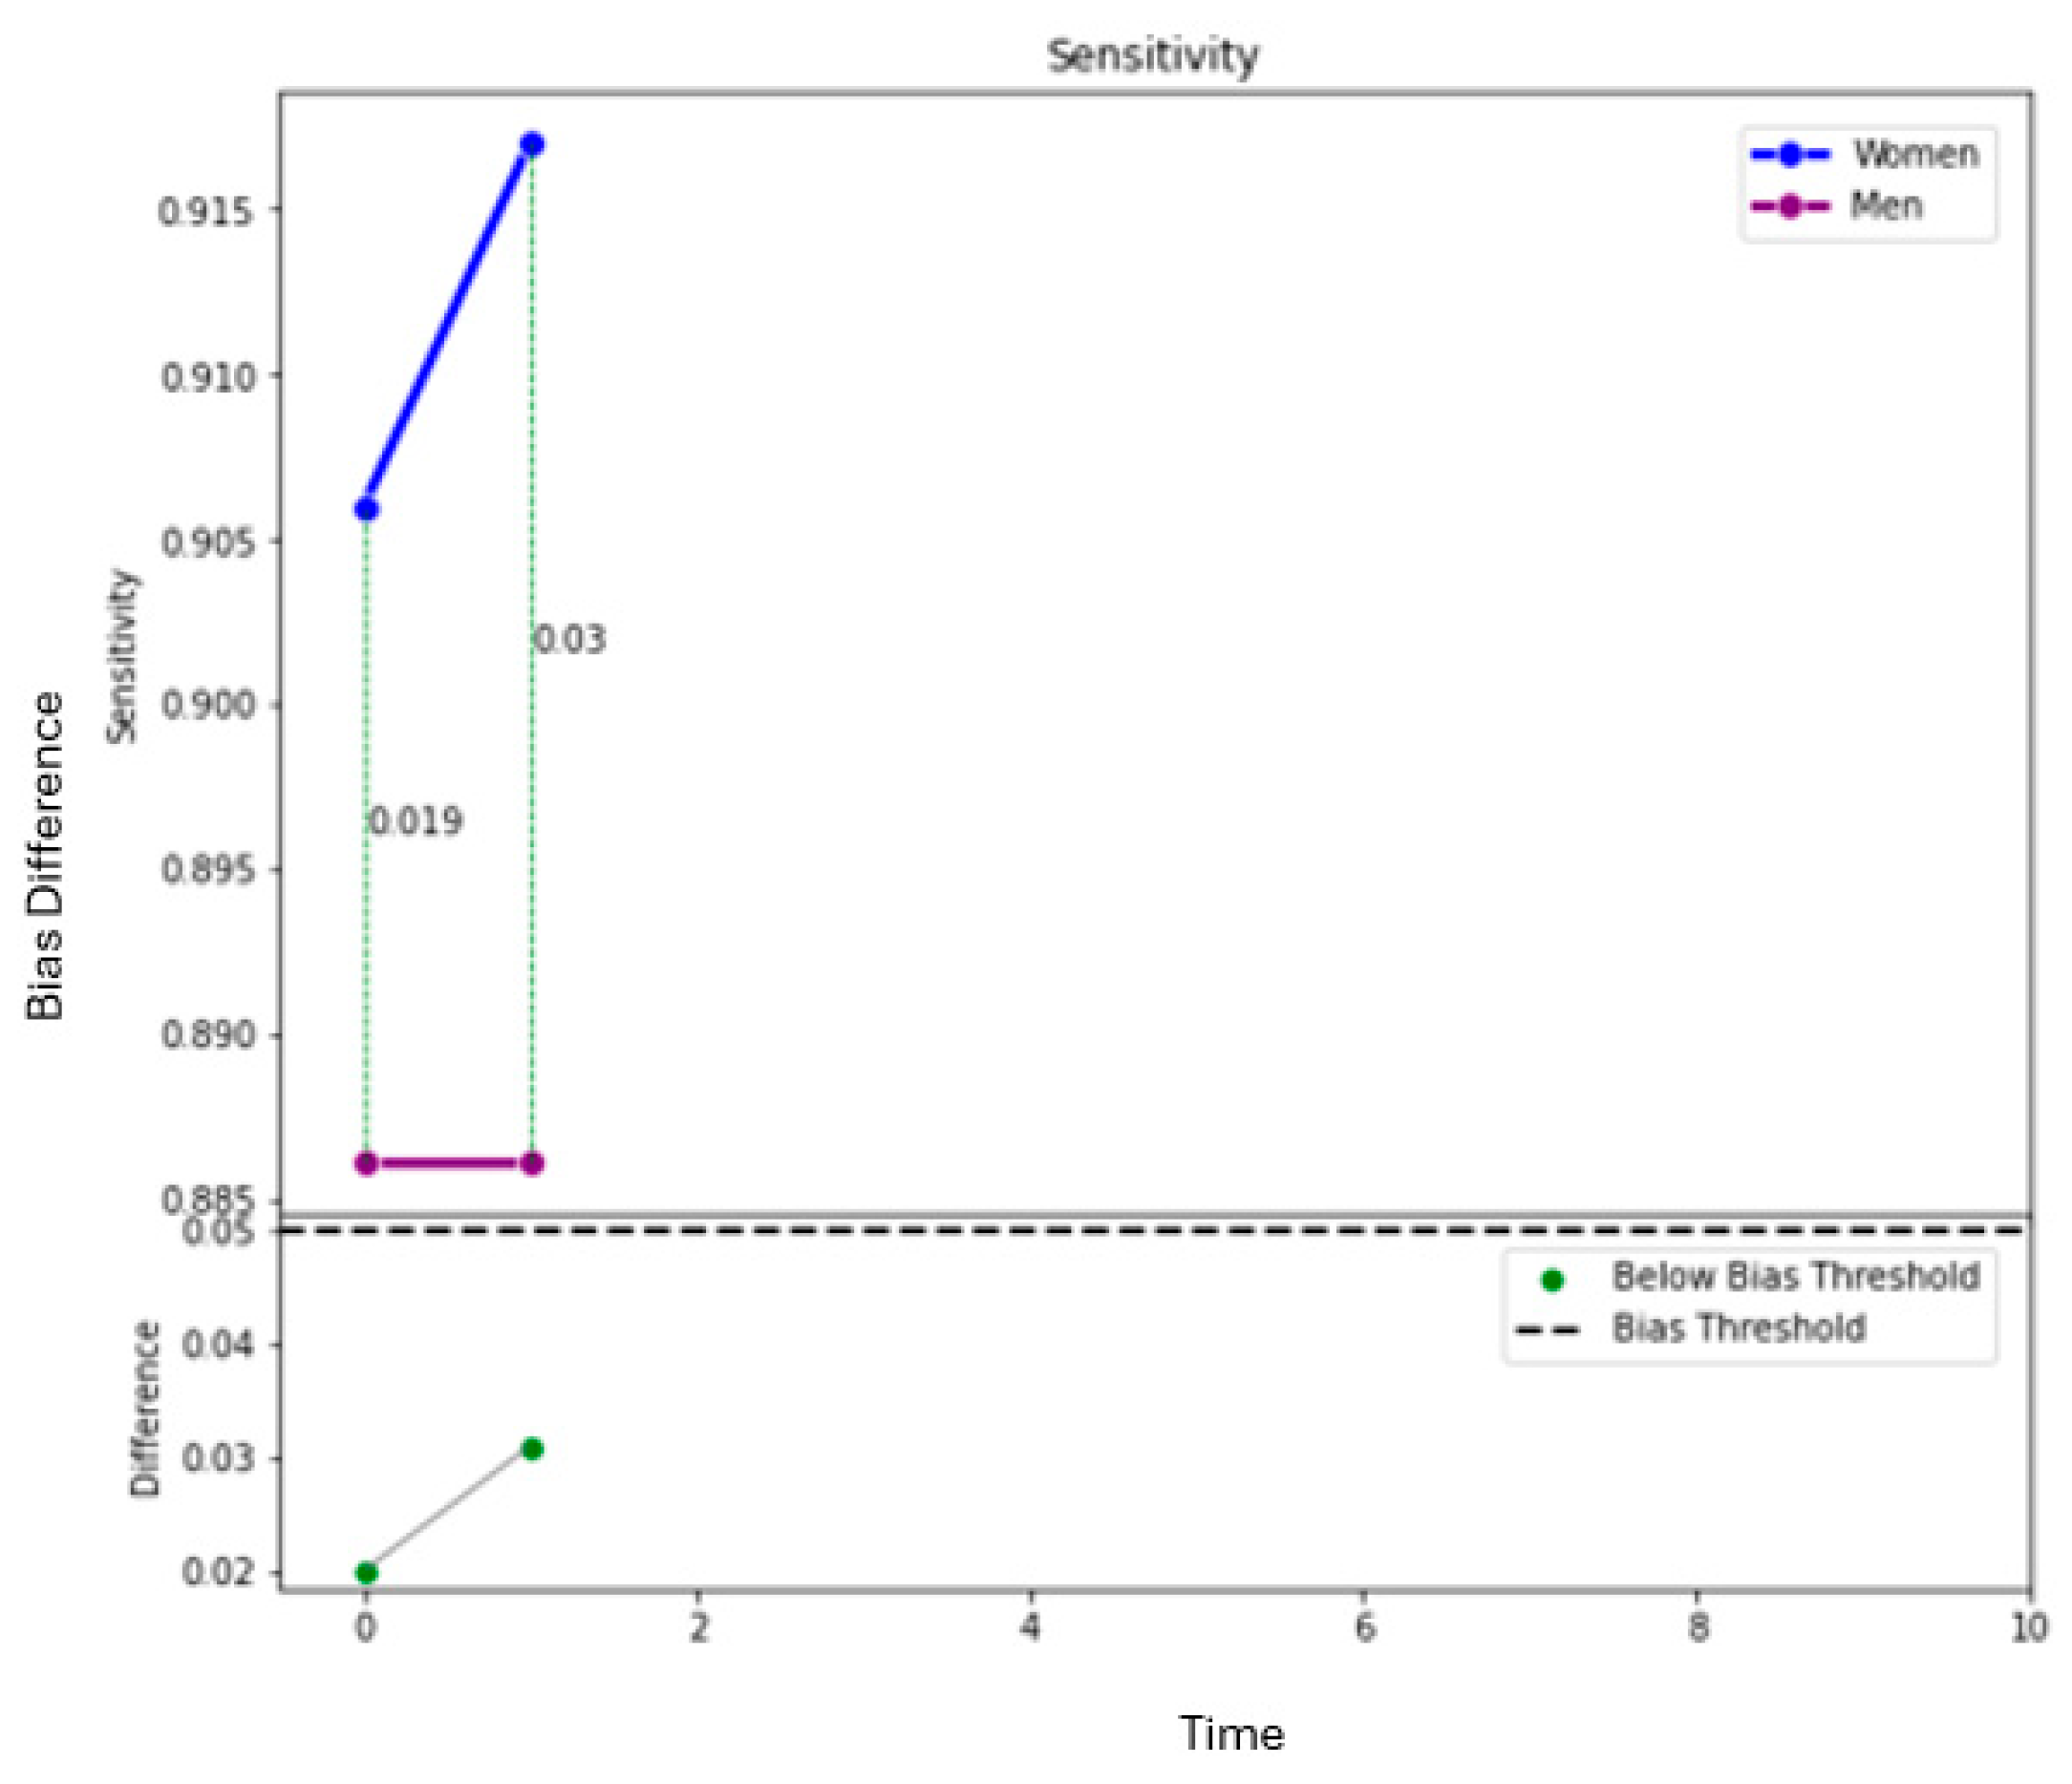
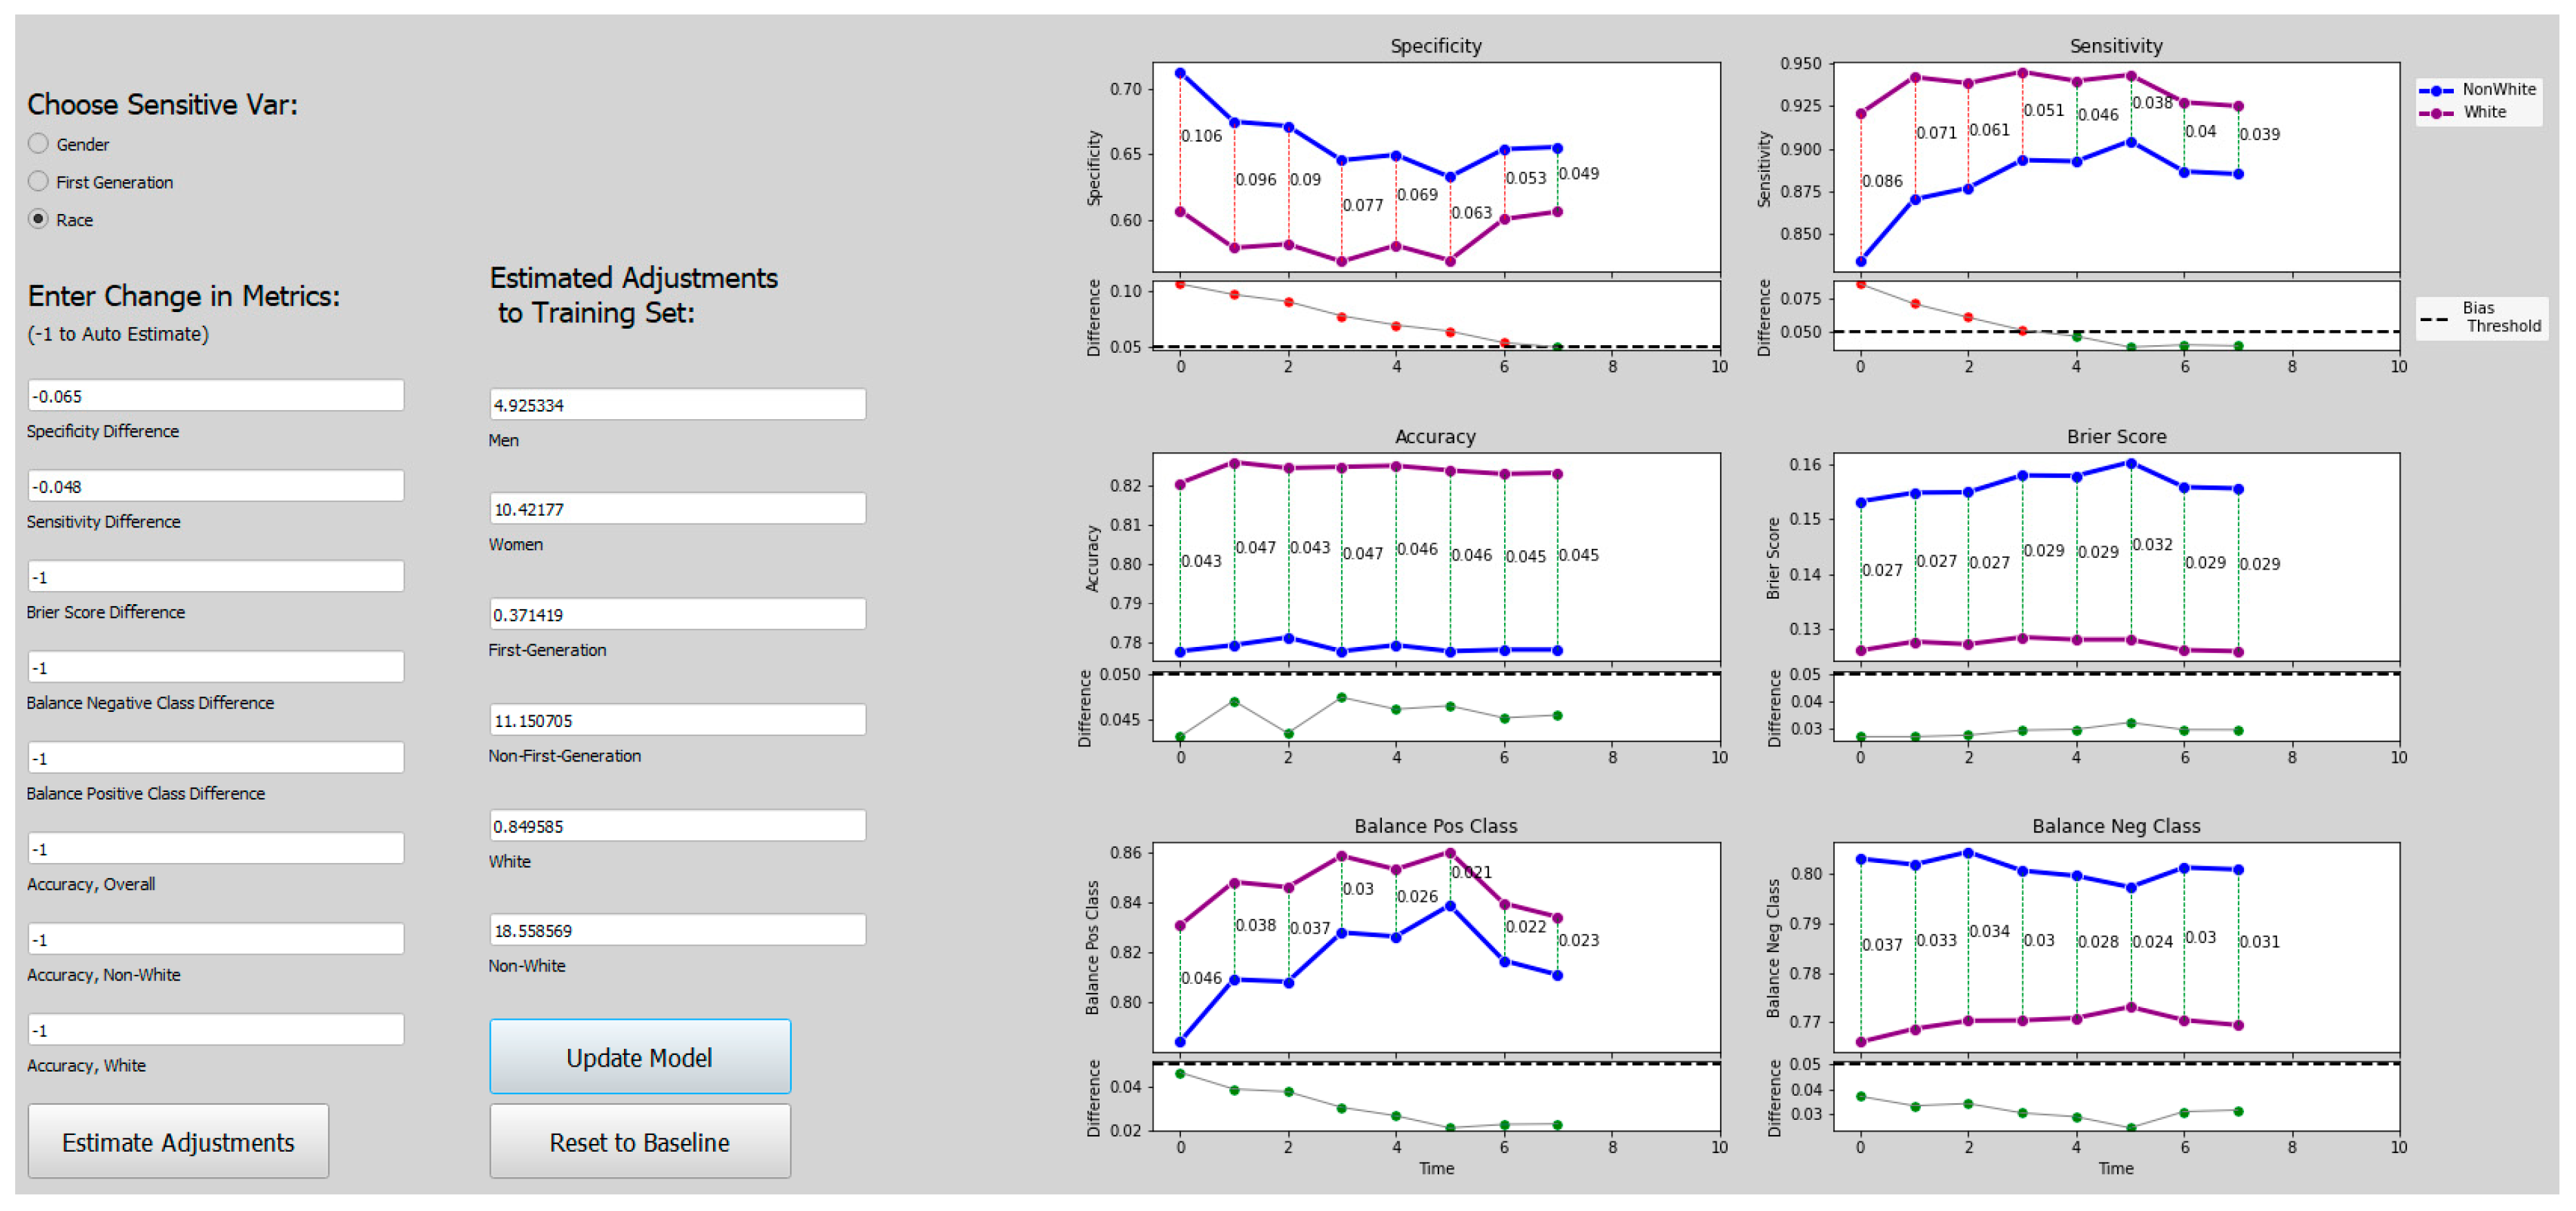
When evaluating a model for bias, it is important to understand how the bias changes as the decision threshold is manipulated. Perhaps a small tradeoff in accuracy would eliminate some of the biases seen in the models. In the figures below, we show the effect of the decision threshold on the bias metrics for each sensitive variable. Values above 0.70 indicate a “good” level of accuracy. (This threshold was again chosen somewhat arbitrarily and could be adjusted.) We also show the differences in Specificity, Sensitivity, and Accuracy as the decision threshold varies. Recall that a difference greater than 0.05 indicates the presence of bias. The goal is to determine if a decision threshold exists that keeps all of the accuracy metrics above 0.7 and all of the bias metrics below 0.05. These cutoffs are indicated in dashed red lines in the figures below.
Figure 2,
Figure 3,
Figure 4 and
Figure 5 show how the decision threshold affects the bias metrics for Gender. These results suggest that adjusting the decision threshold to approximately 0.60–0.70 could mitigate the bias with respect to this sensitive variable.
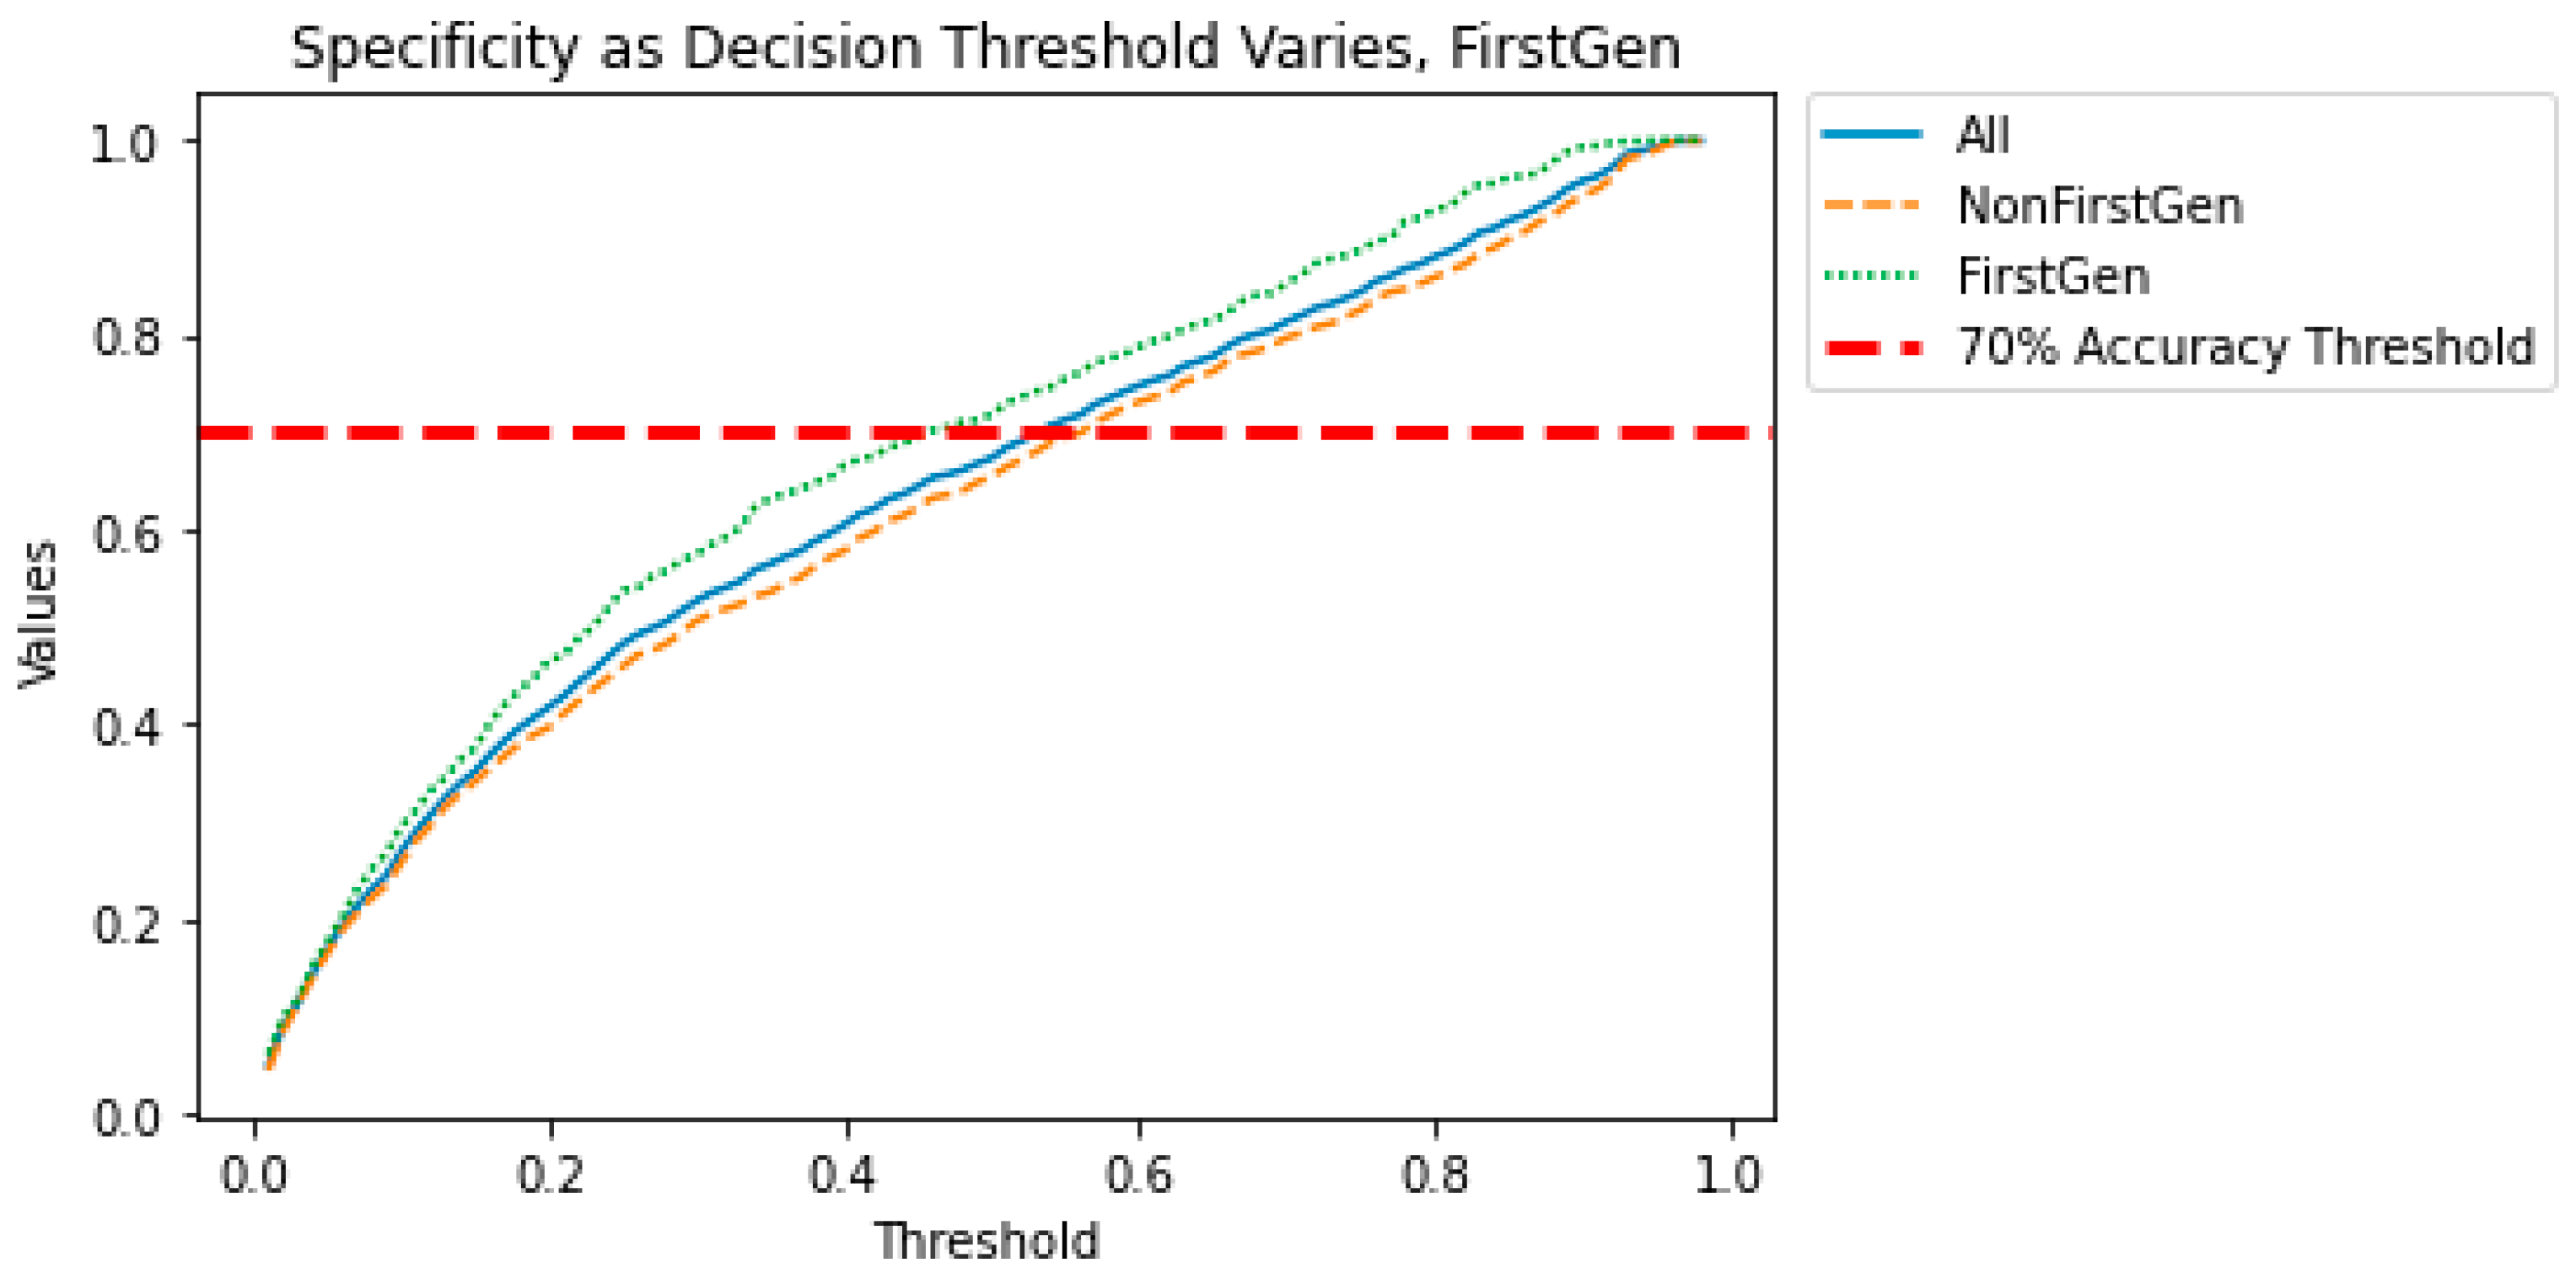
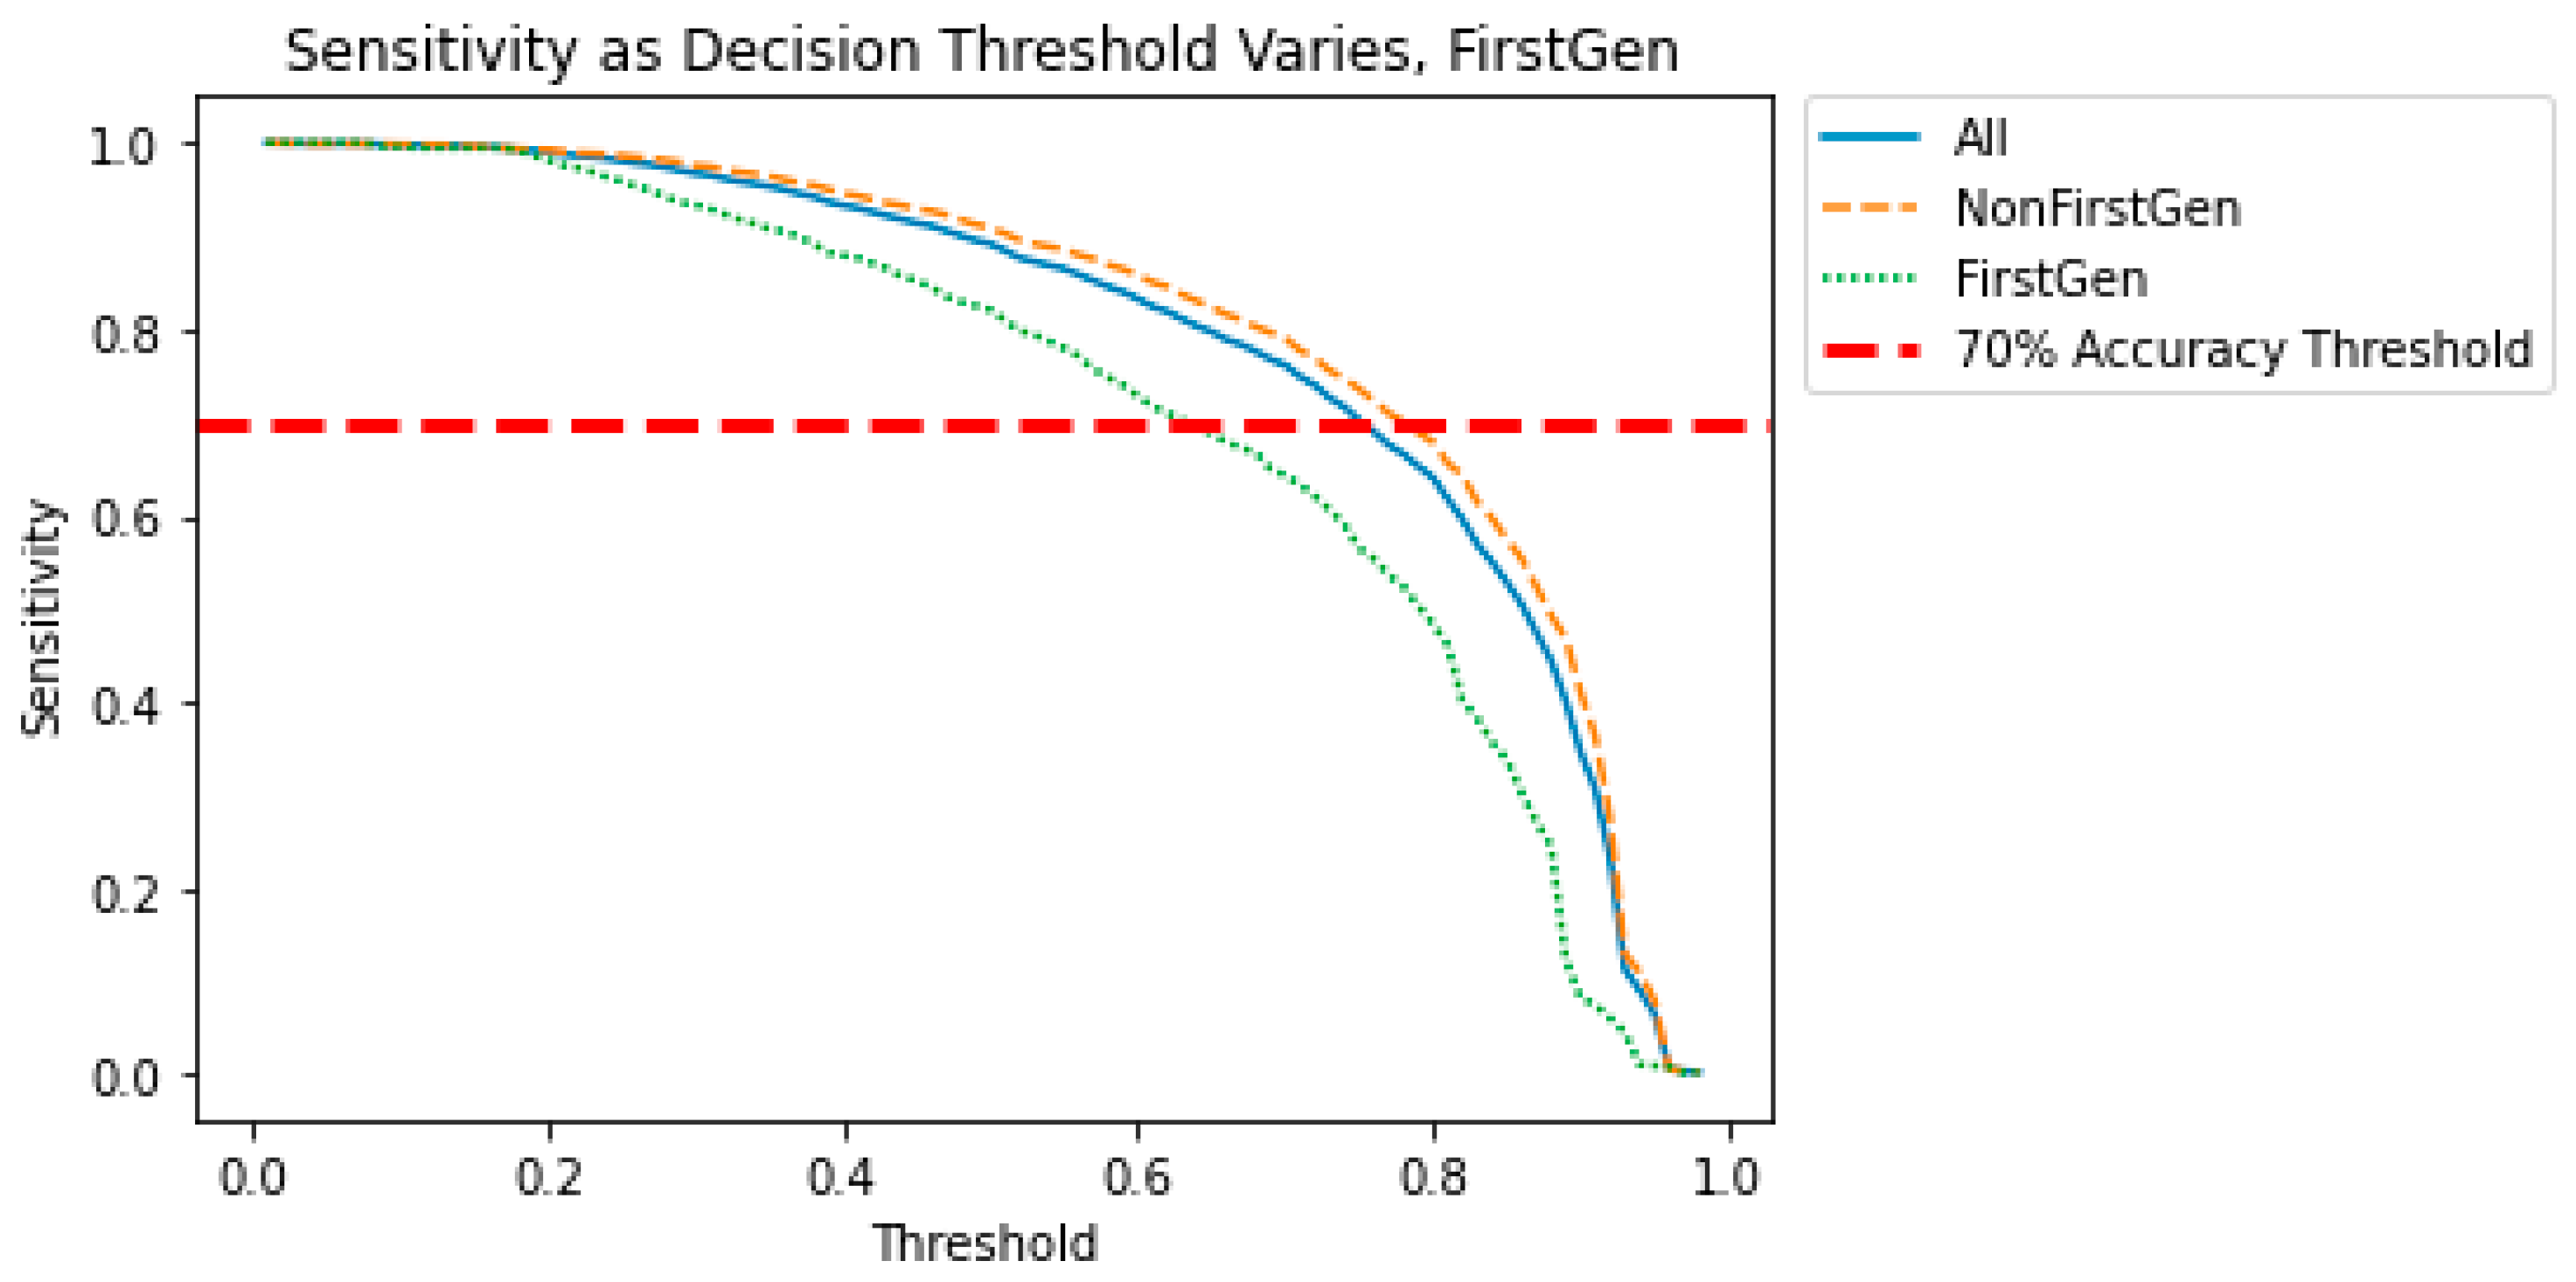
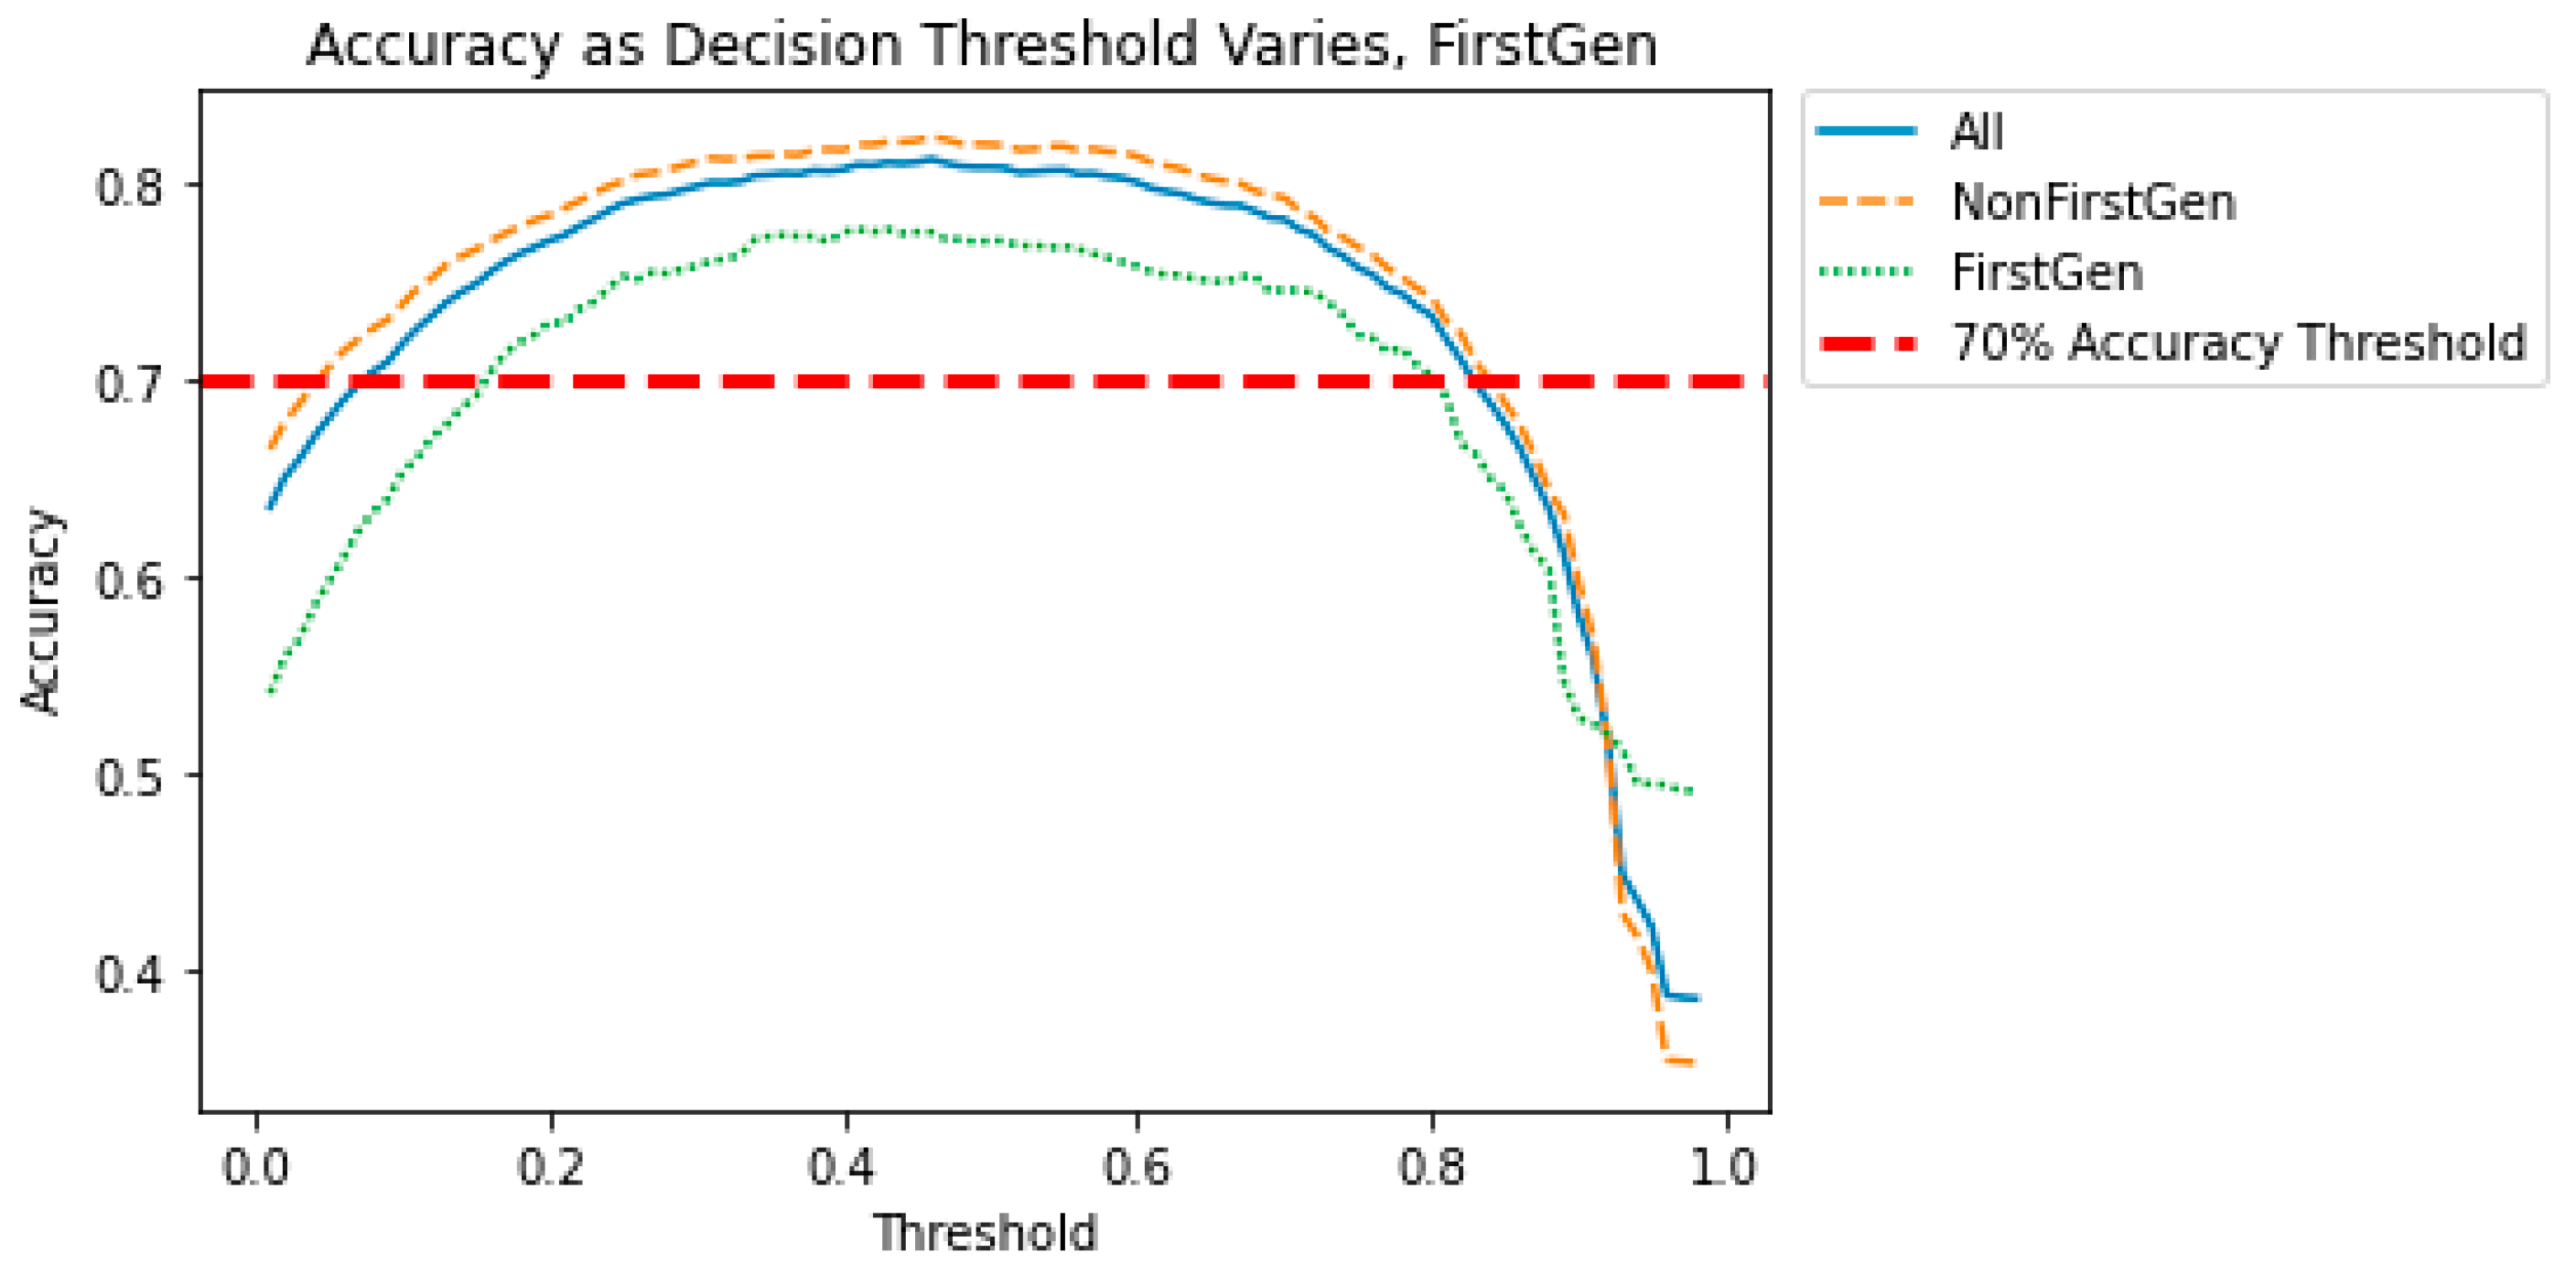
Figure 6,
Figure 7,
Figure 8 and
Figure 9 show how the decision threshold affects the bias metrics for First-Generation students. These results show that there is no decision threshold that eliminates all bias.
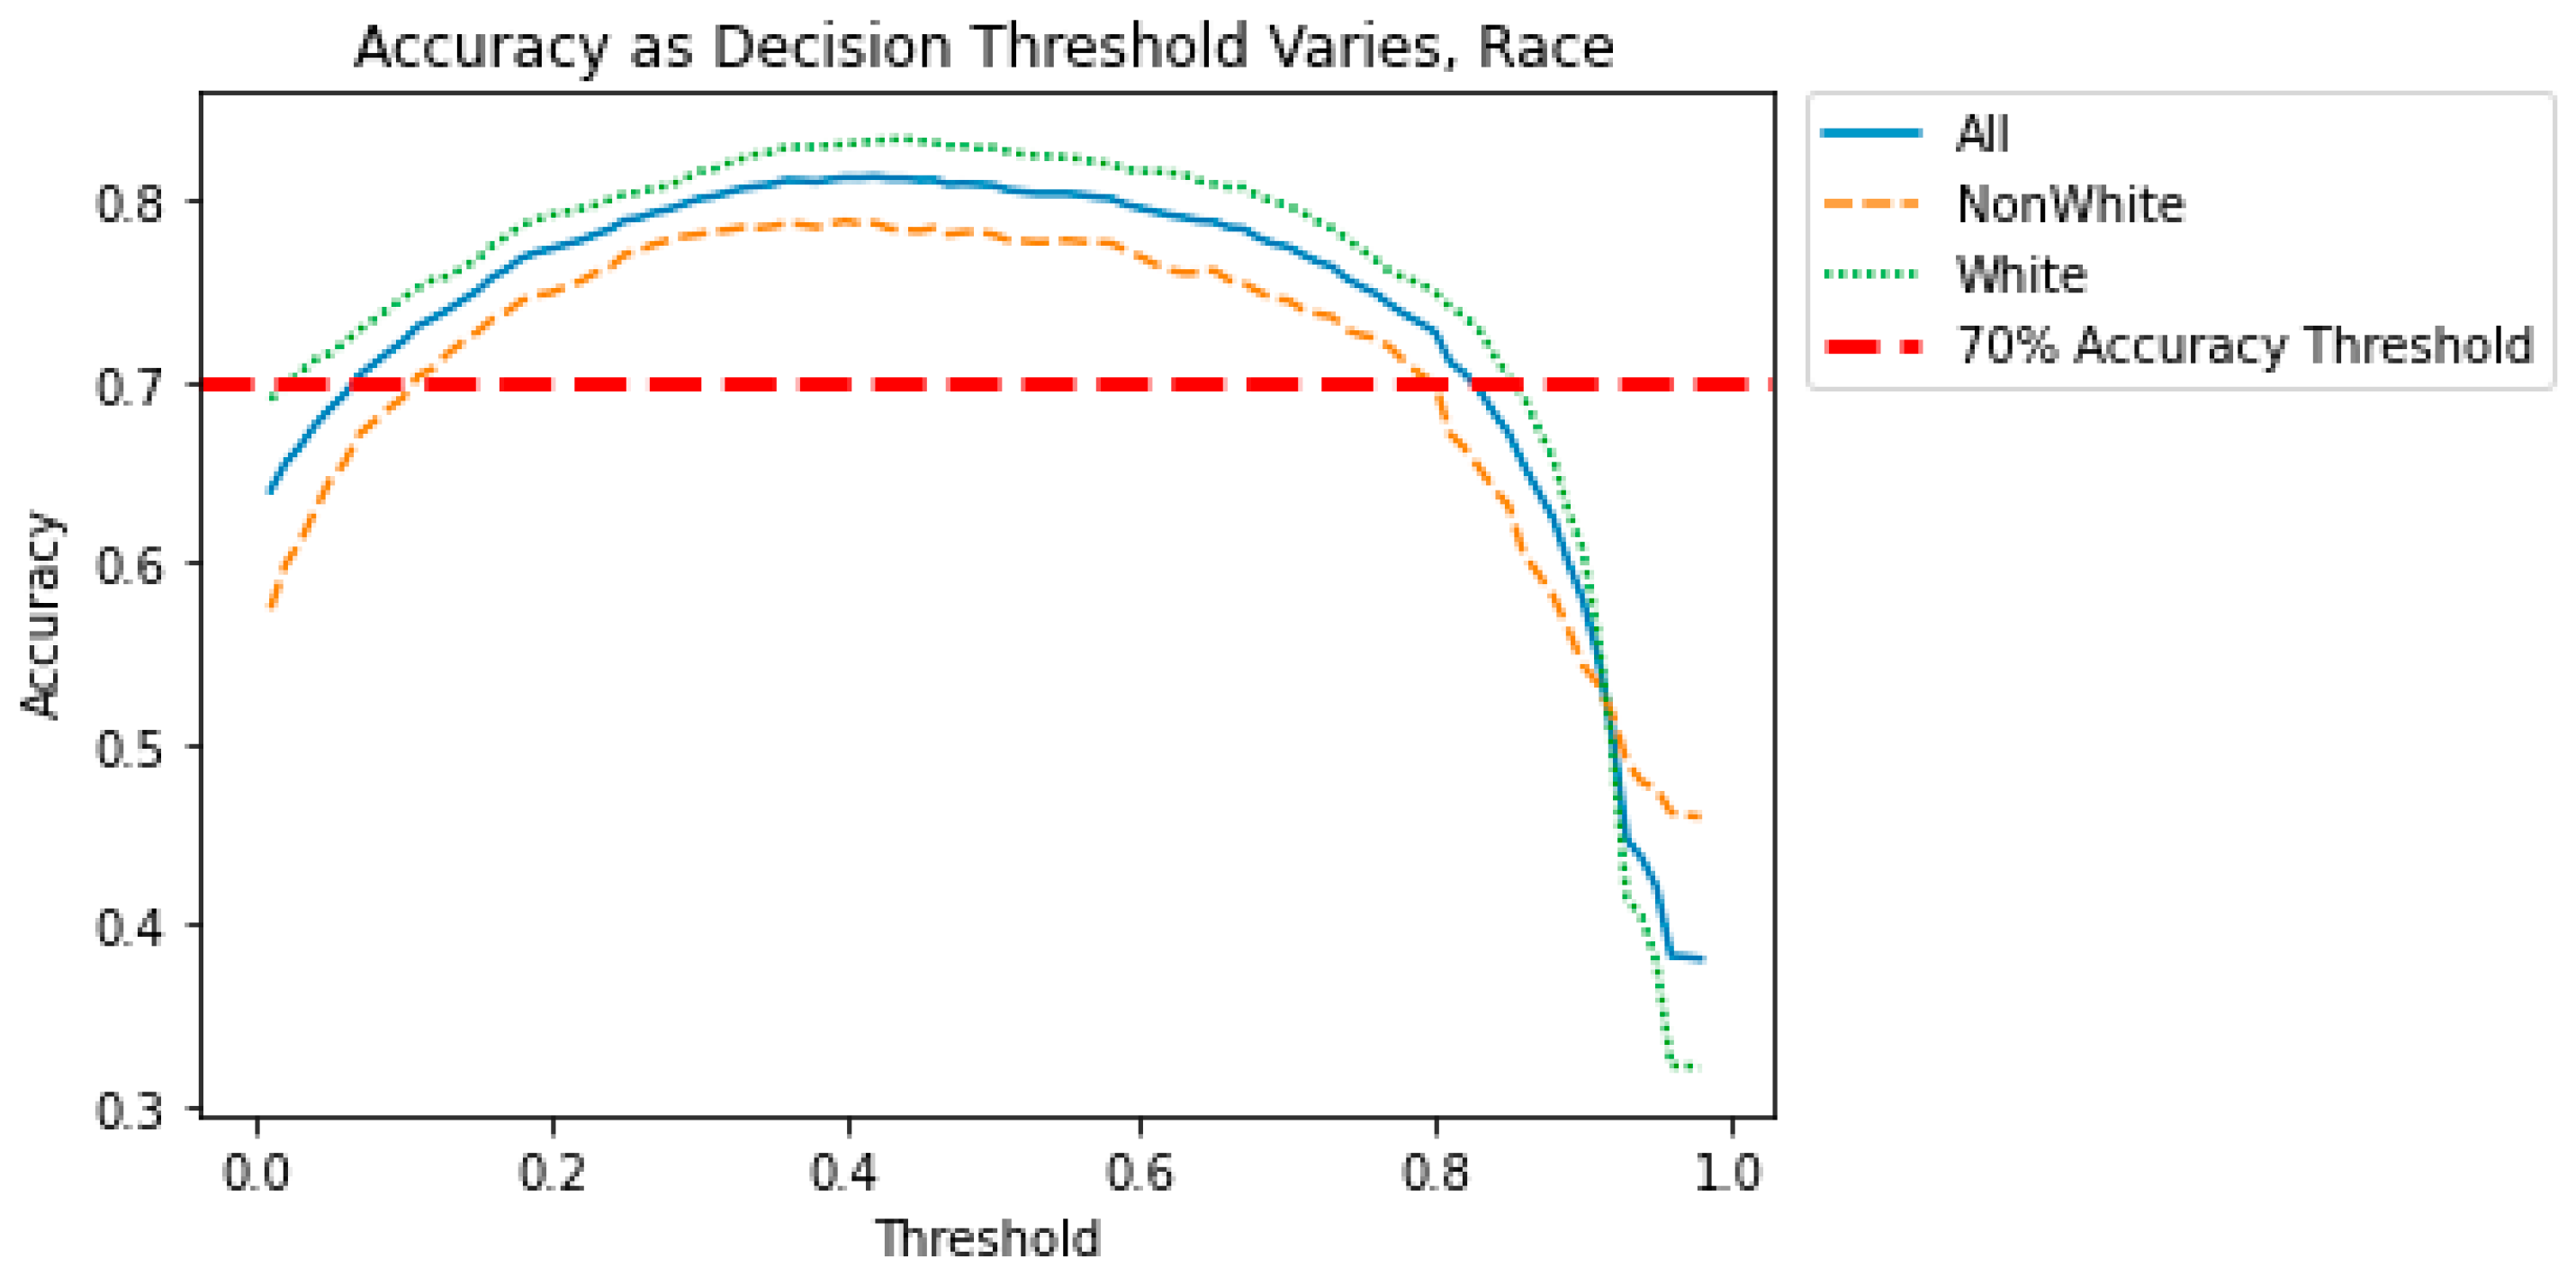
Figure 10,
Figure 11,
Figure 12 and
Figure 13 show how the decision threshold affects the bias metrics with respect to Race. These results also show that there is no decision threshold that eliminates all bias.
The above results show that when the sensitive variable is First-Generation or Race, a straightforward adjustment to the decision threshold does not eliminate the bias. This motivates a need for a more sophisticated method for bias mitigation in these models.
3.4. Fairness Metrics
Biases detected in Specificity and Sensitivity can lead to considerations of fairness, so we also include three fairness metrics:
Brier Score: This is the measure of the calibration between ground truth data and the predicted data. A lower score indicates that the model is highly calibrated.
Balance for the Negative Class: The average probability score assigned to students that the model predicts will not be admitted.
Balance for the Positive Class: The average probability score assigned to students that the model predicts will be admitted.
These three metrics can rarely be satisfied simultaneously [
42], leading to conflicts when considering what is fair. Fairness is a broader concept than bias; therefore, policies can be unfair under these definitions, but that does not imply bias in the AI algorithm itself. Similarly, a model can be biased towards a particular group, but also be considered fair. The bias mitigation method we present allows the user to determine what is fair in a given context.
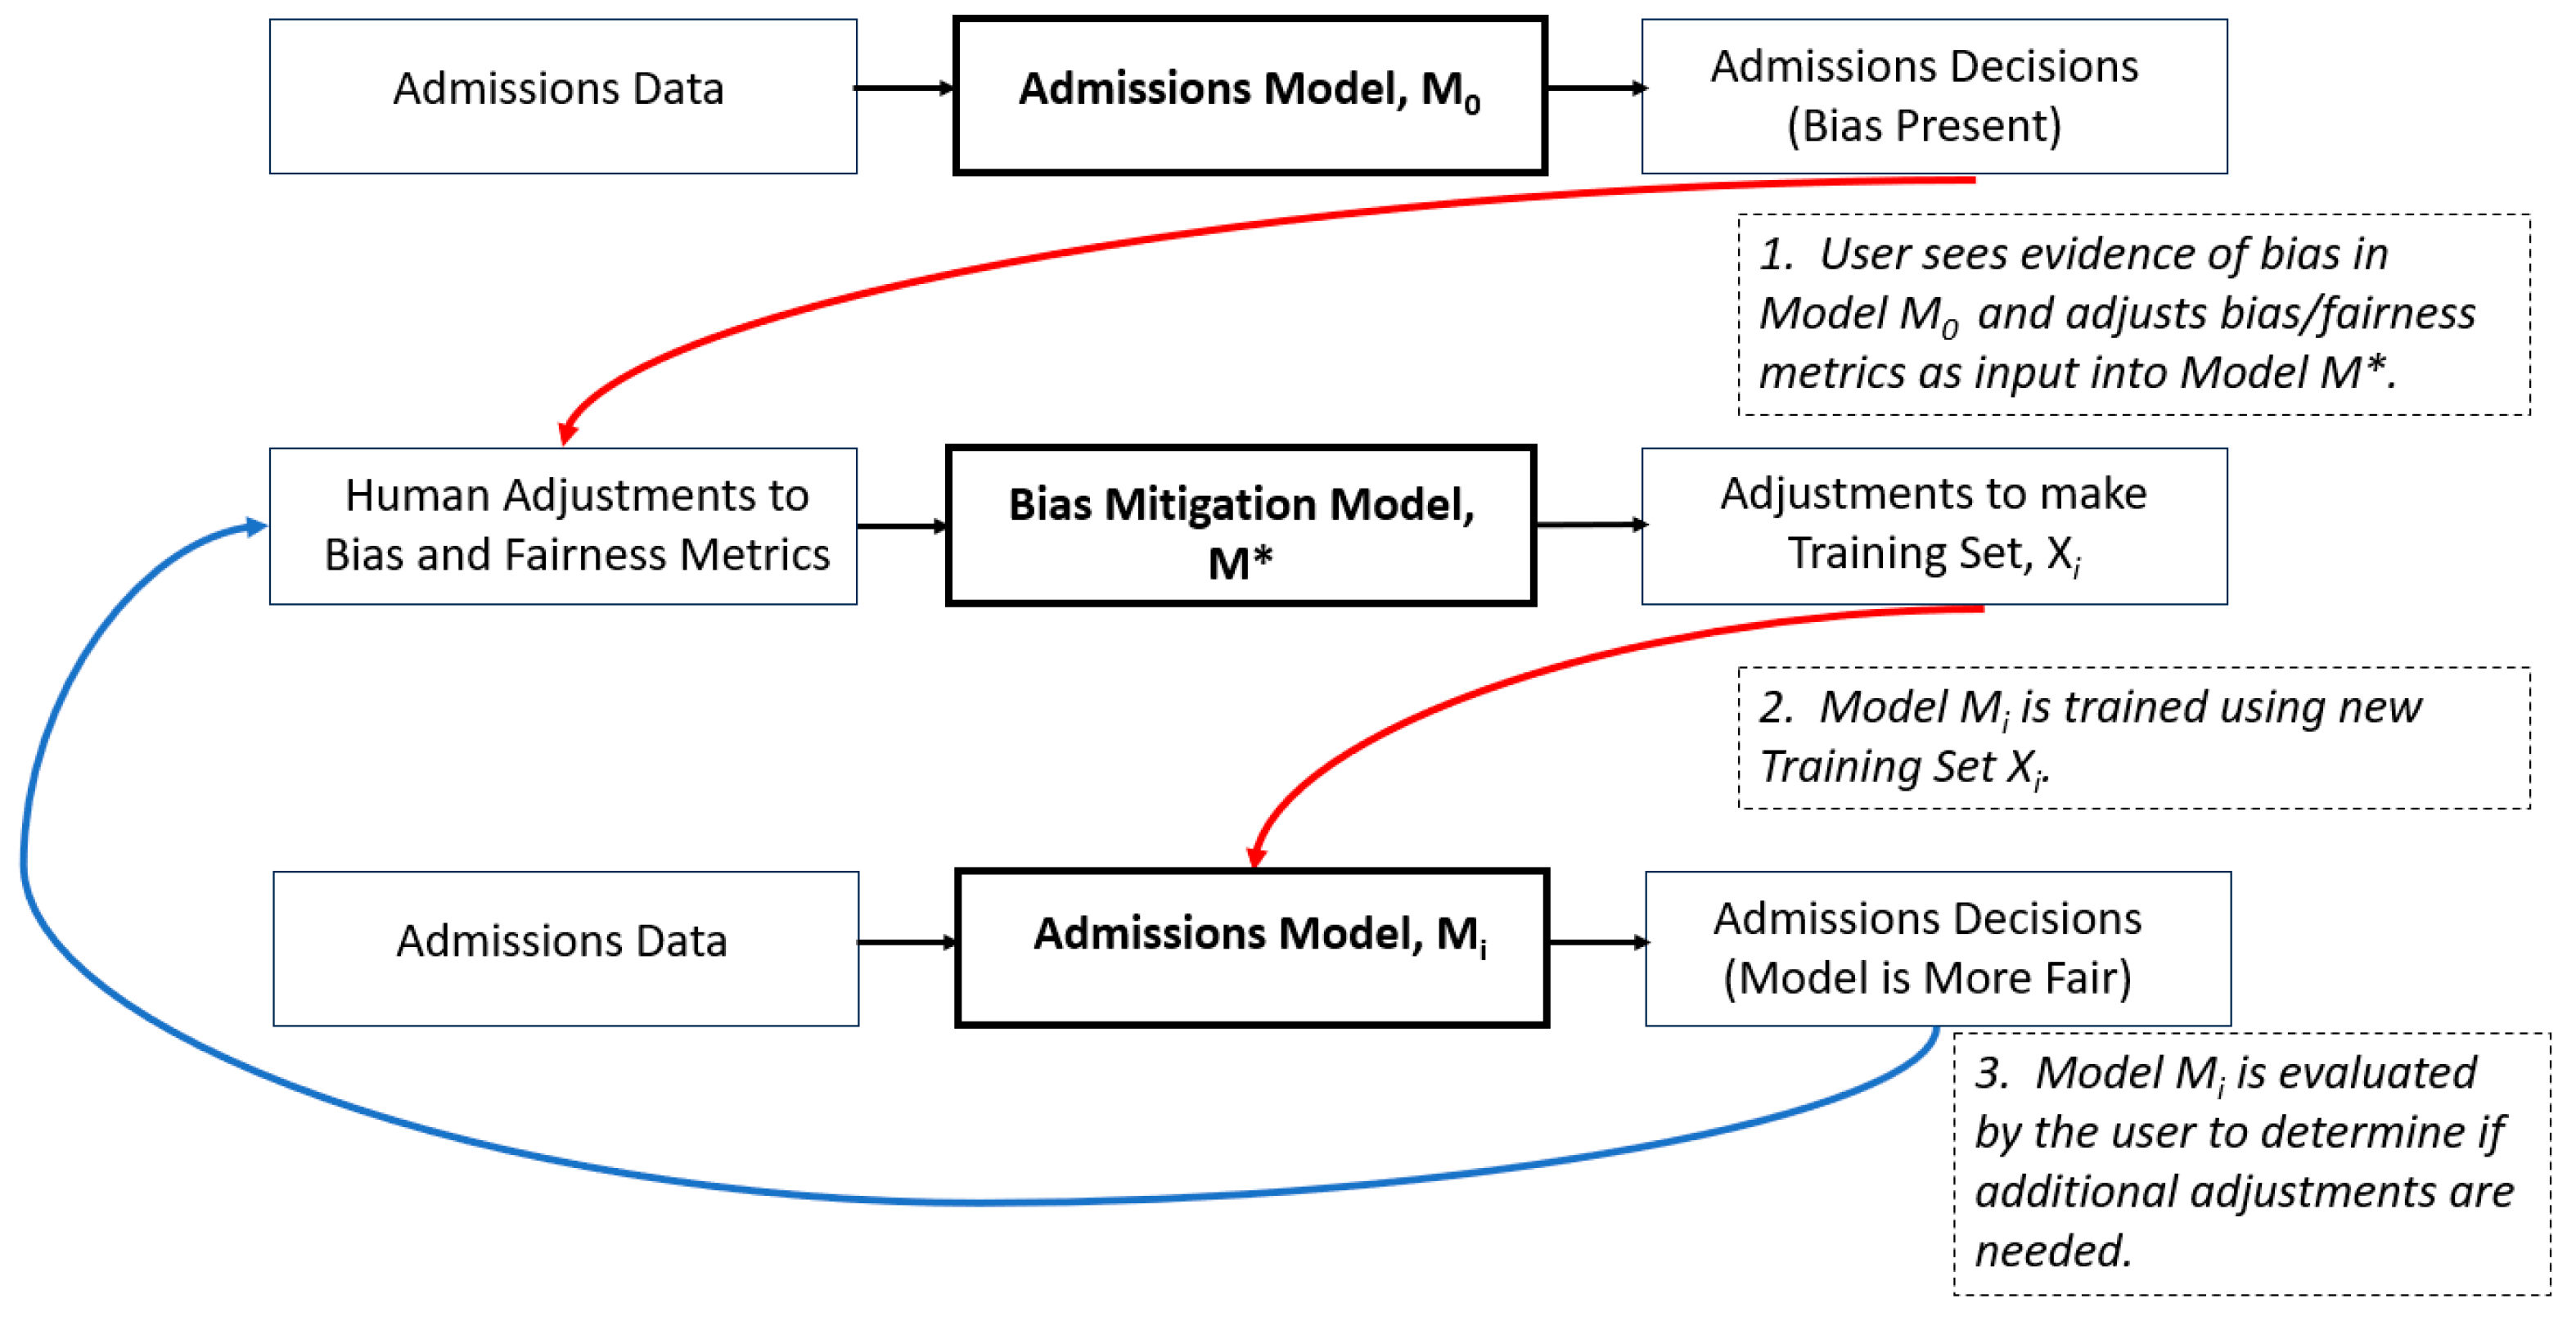
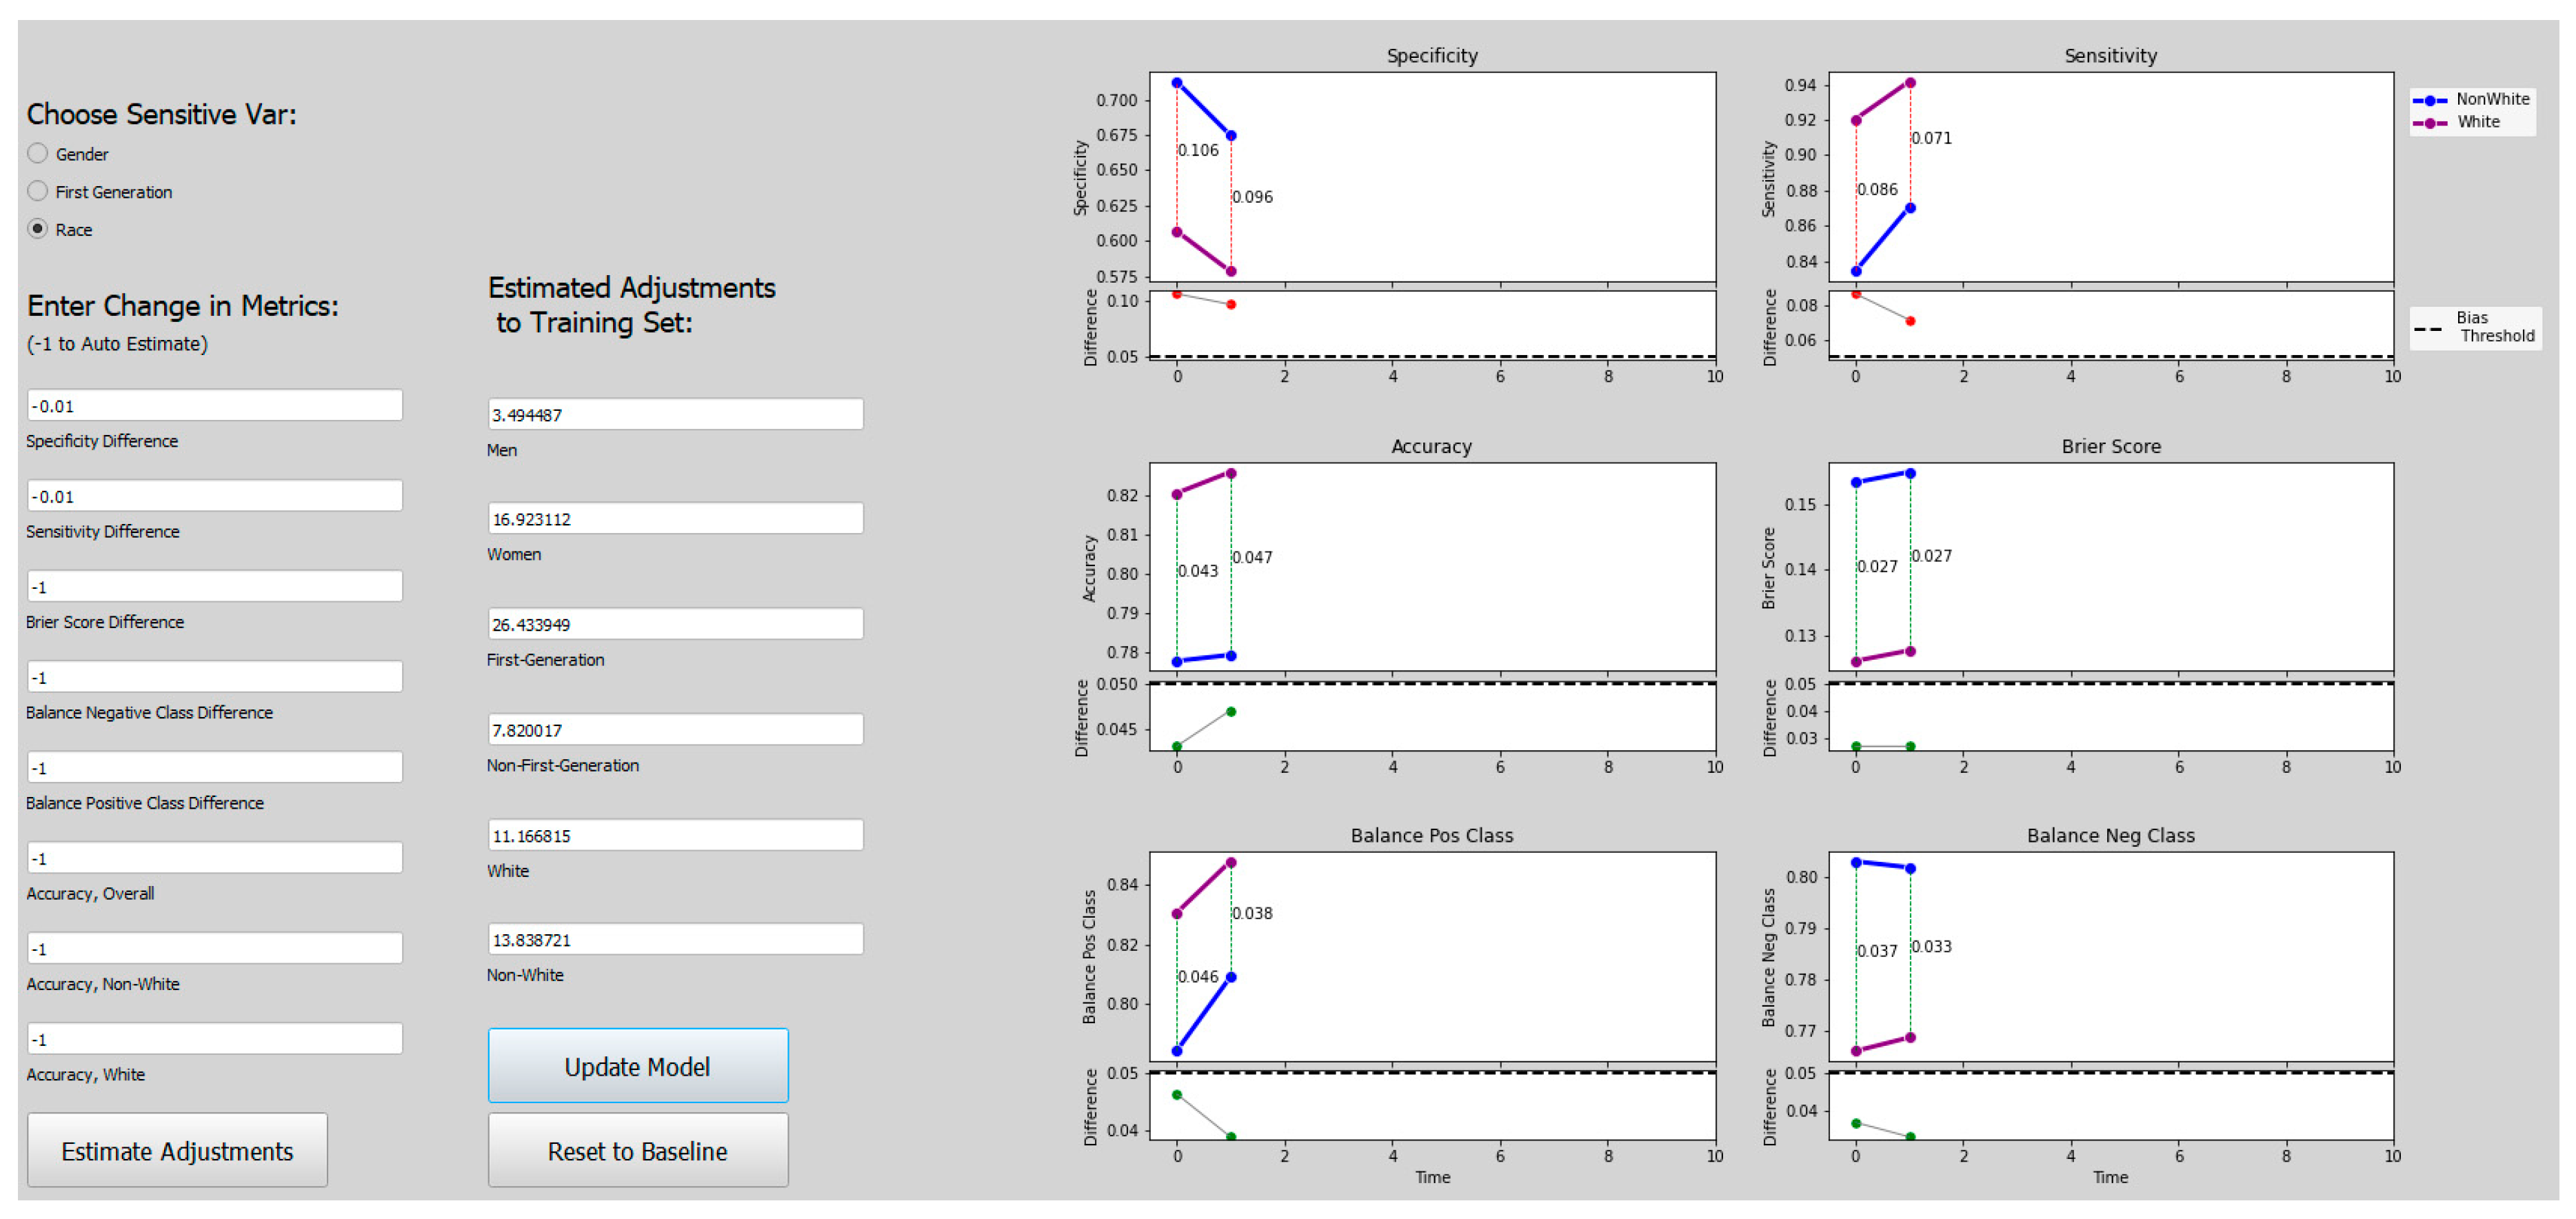
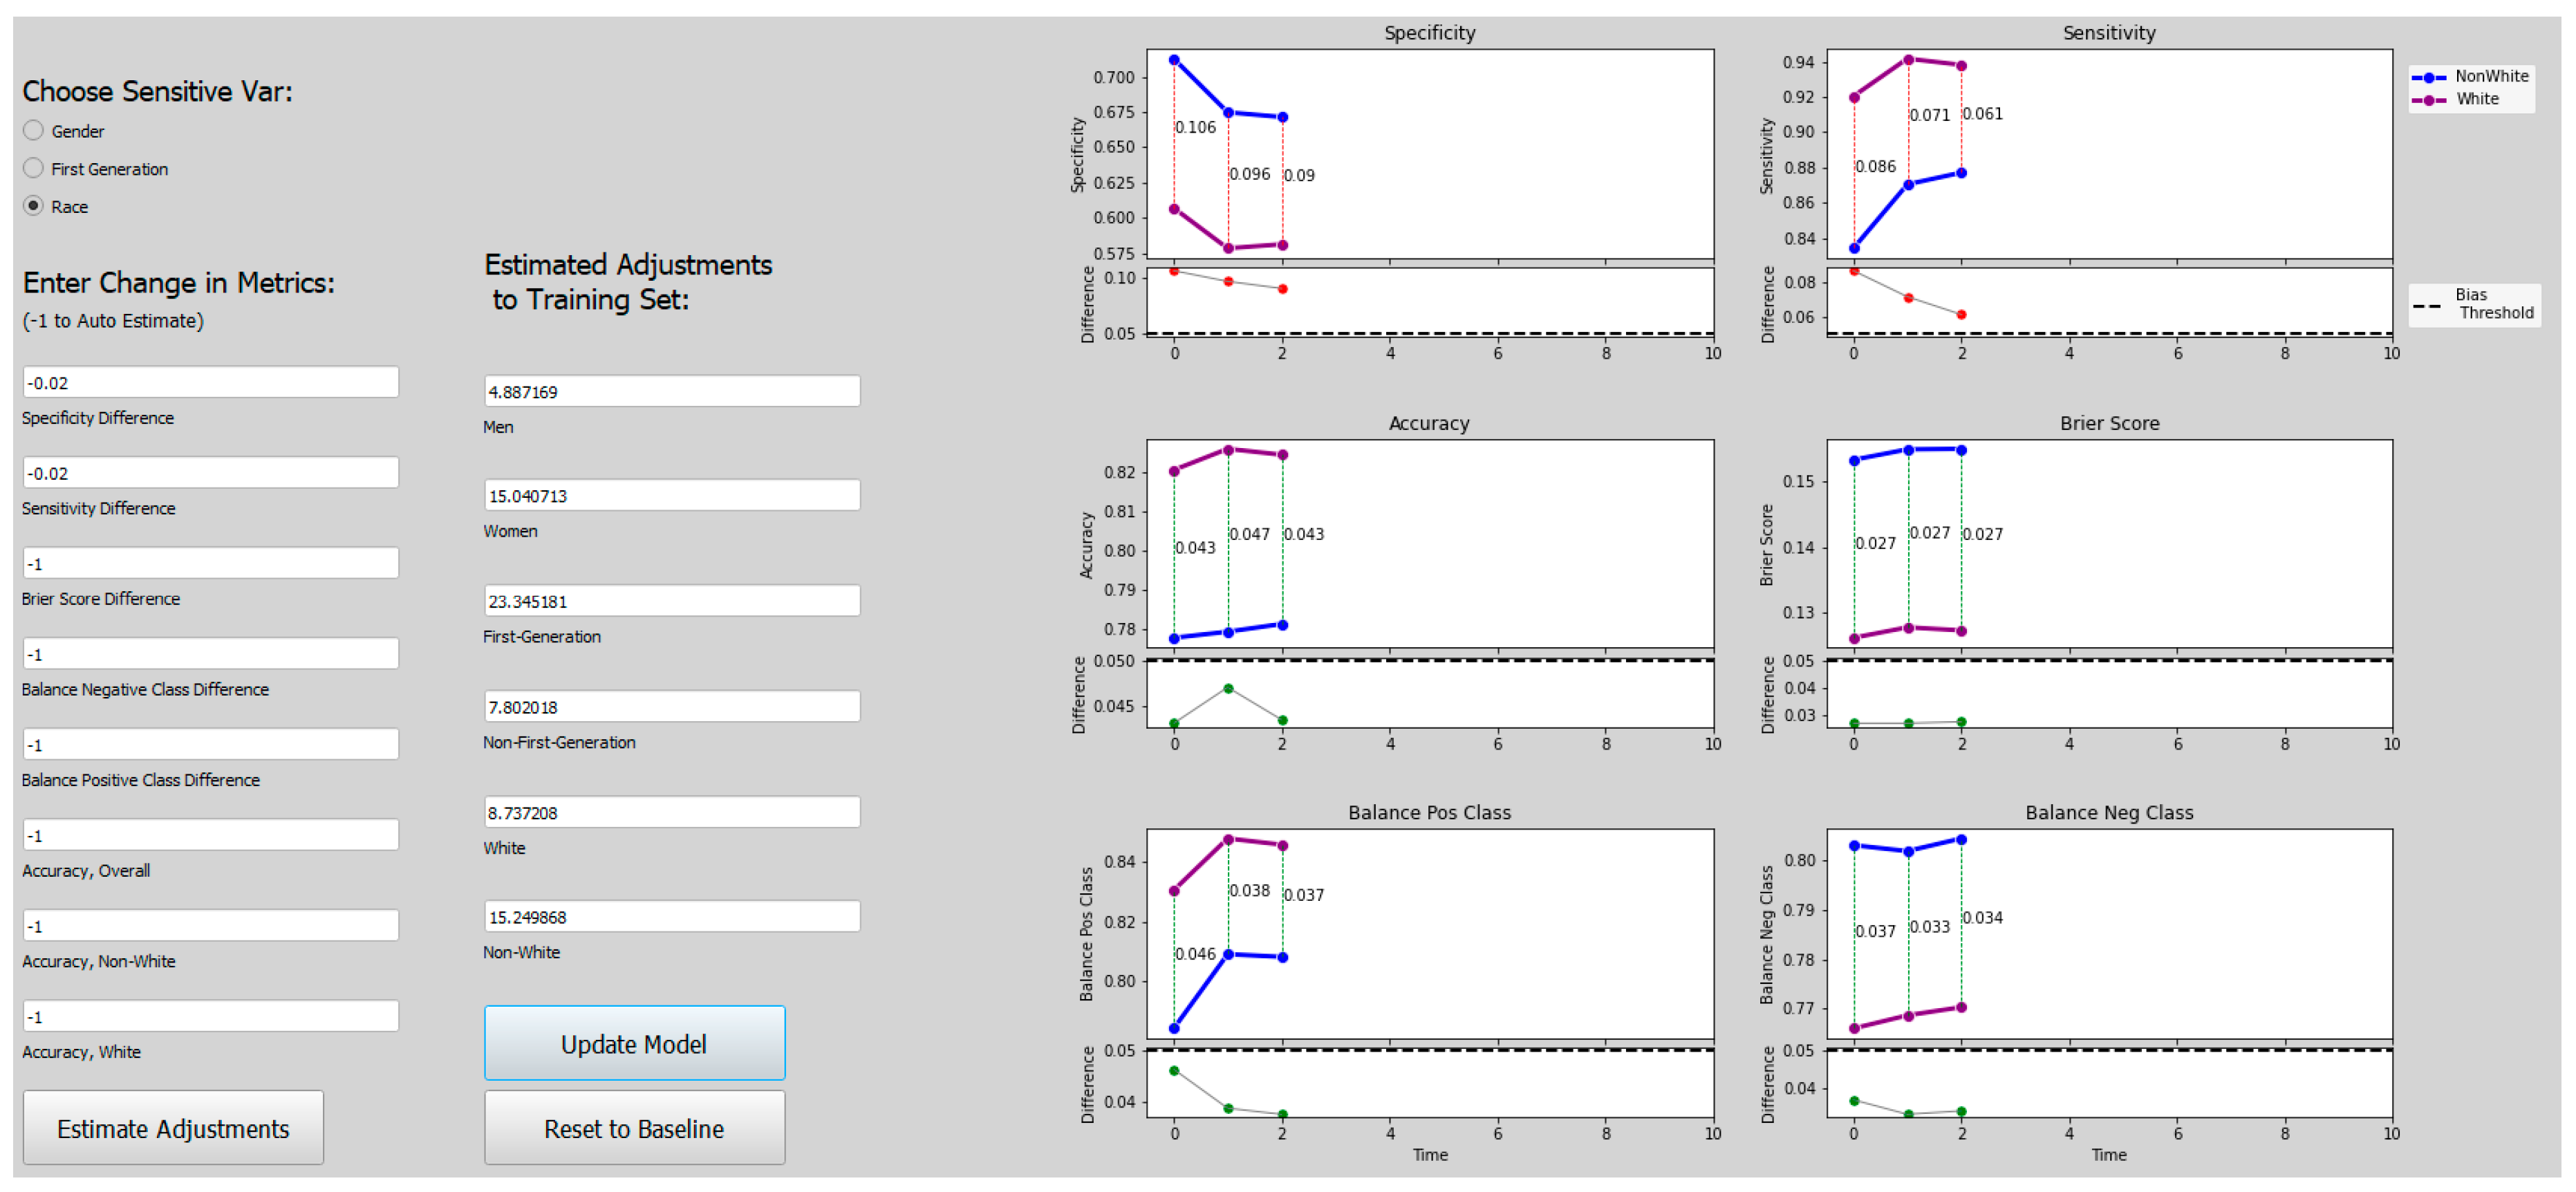
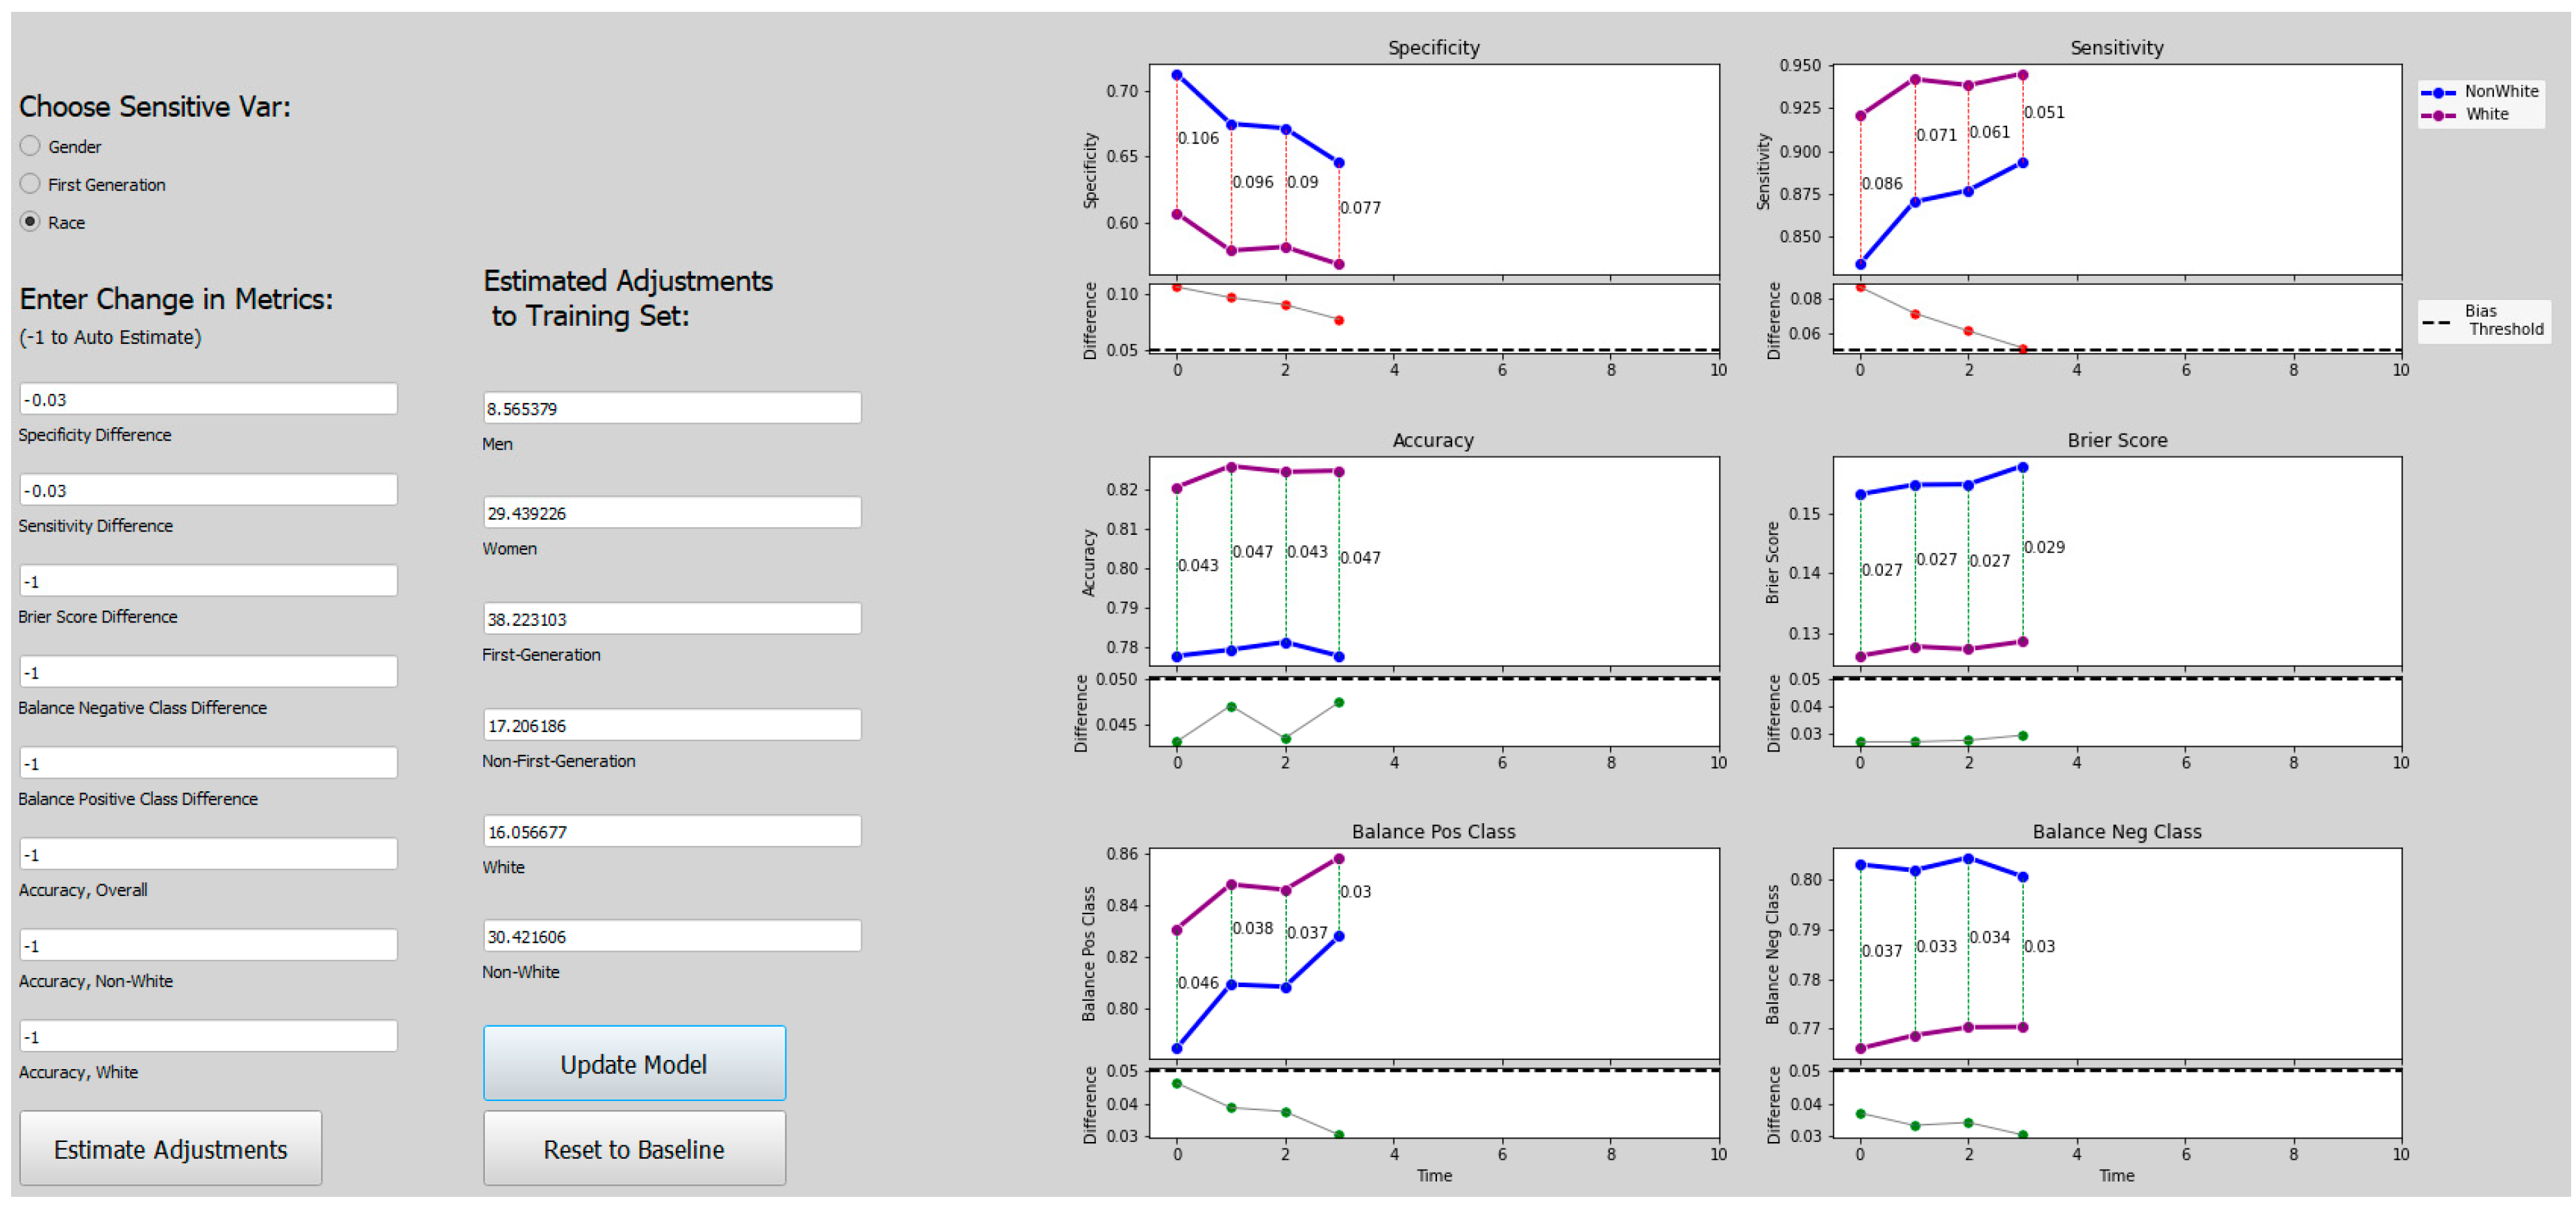
3.5. Bias Mitigation Algorithm, Overview
Our bias mitigation approach allows users to interactively adjust the training set for the Admissions Model to make it more fair (dependent upon the user’s definition of “fair”). For example, suppose that the admissions committee examines the AI model and sees that the model is introducing sensitivity bias with respect to a student’s race. This means that the AI model is denying students admission based on race, even when the admissions committee would admit the same students. Using an interactive interface, the admissions committee can specify that the model needs less sensitivity bias to be useful. The algorithm then automatically adjusts the training set and regenerates the AI model. The admissions committee can then re-evaluate the model and make other adjustments as necessary. This scenario and a description of how the interactive interface works are presented in more detail in
Section 4.
For now, we focus on the details of the bias mitigation algorithm (illustrated in
Figure 14 below):
- (1)
The user begins by examining the bias and fairness metrics in the original Admissions Model M0, constructed with the original Training Set X0. The user may see bias, but because fairness is subjective, we allow the user to decide if the presence of bias is unfair. If so, the user can indicate the desired adjustments to the bias and fairness metrics to make the model fairer.
- (2)
These adjustments to the bias and fairness metrics are used as input into a second machine learning model, the Bias Mitigation Model M*. The Bias Mitigation Model M* predicts the needed adjustments to the training set used to create the Admissions Model to achieve these adjusted bias and fairness metrics. The adjusted Training Set Xi is used to train an adjusted Admissions Model Mi.
- (3)
The adjusted Admissions Model Mi is evaluated by the user to determine if it is now fair or whether additional adjustments are needed. Steps 2 and 3 can be repeated until the user is satisfied with the results.
3.6. Construction of the Dataset for the Bias Correction Model M*
To create the Bias Mitigation Model M*, we first construct a dataset to train the model. Each row of the dataset consists of a set of bias/fairness statistics and the adjustments needed to the training set to achieve those statistics. Construction of this training set is done in three phases.
PHASE 1:
We start with the Test-Optional (Larger) dataset. Recall that this dataset is the full dataset with test scores removed. It is not intended to be a true test-optional dataset because it does not account for the demographic changes in the applicant pool when the admissions policy changed from test-required to test-optional. It is just meant to be a simulation of a test-optional dataset which is reasonably accurate and contains enough bias to evaluate our bias mitigation method.
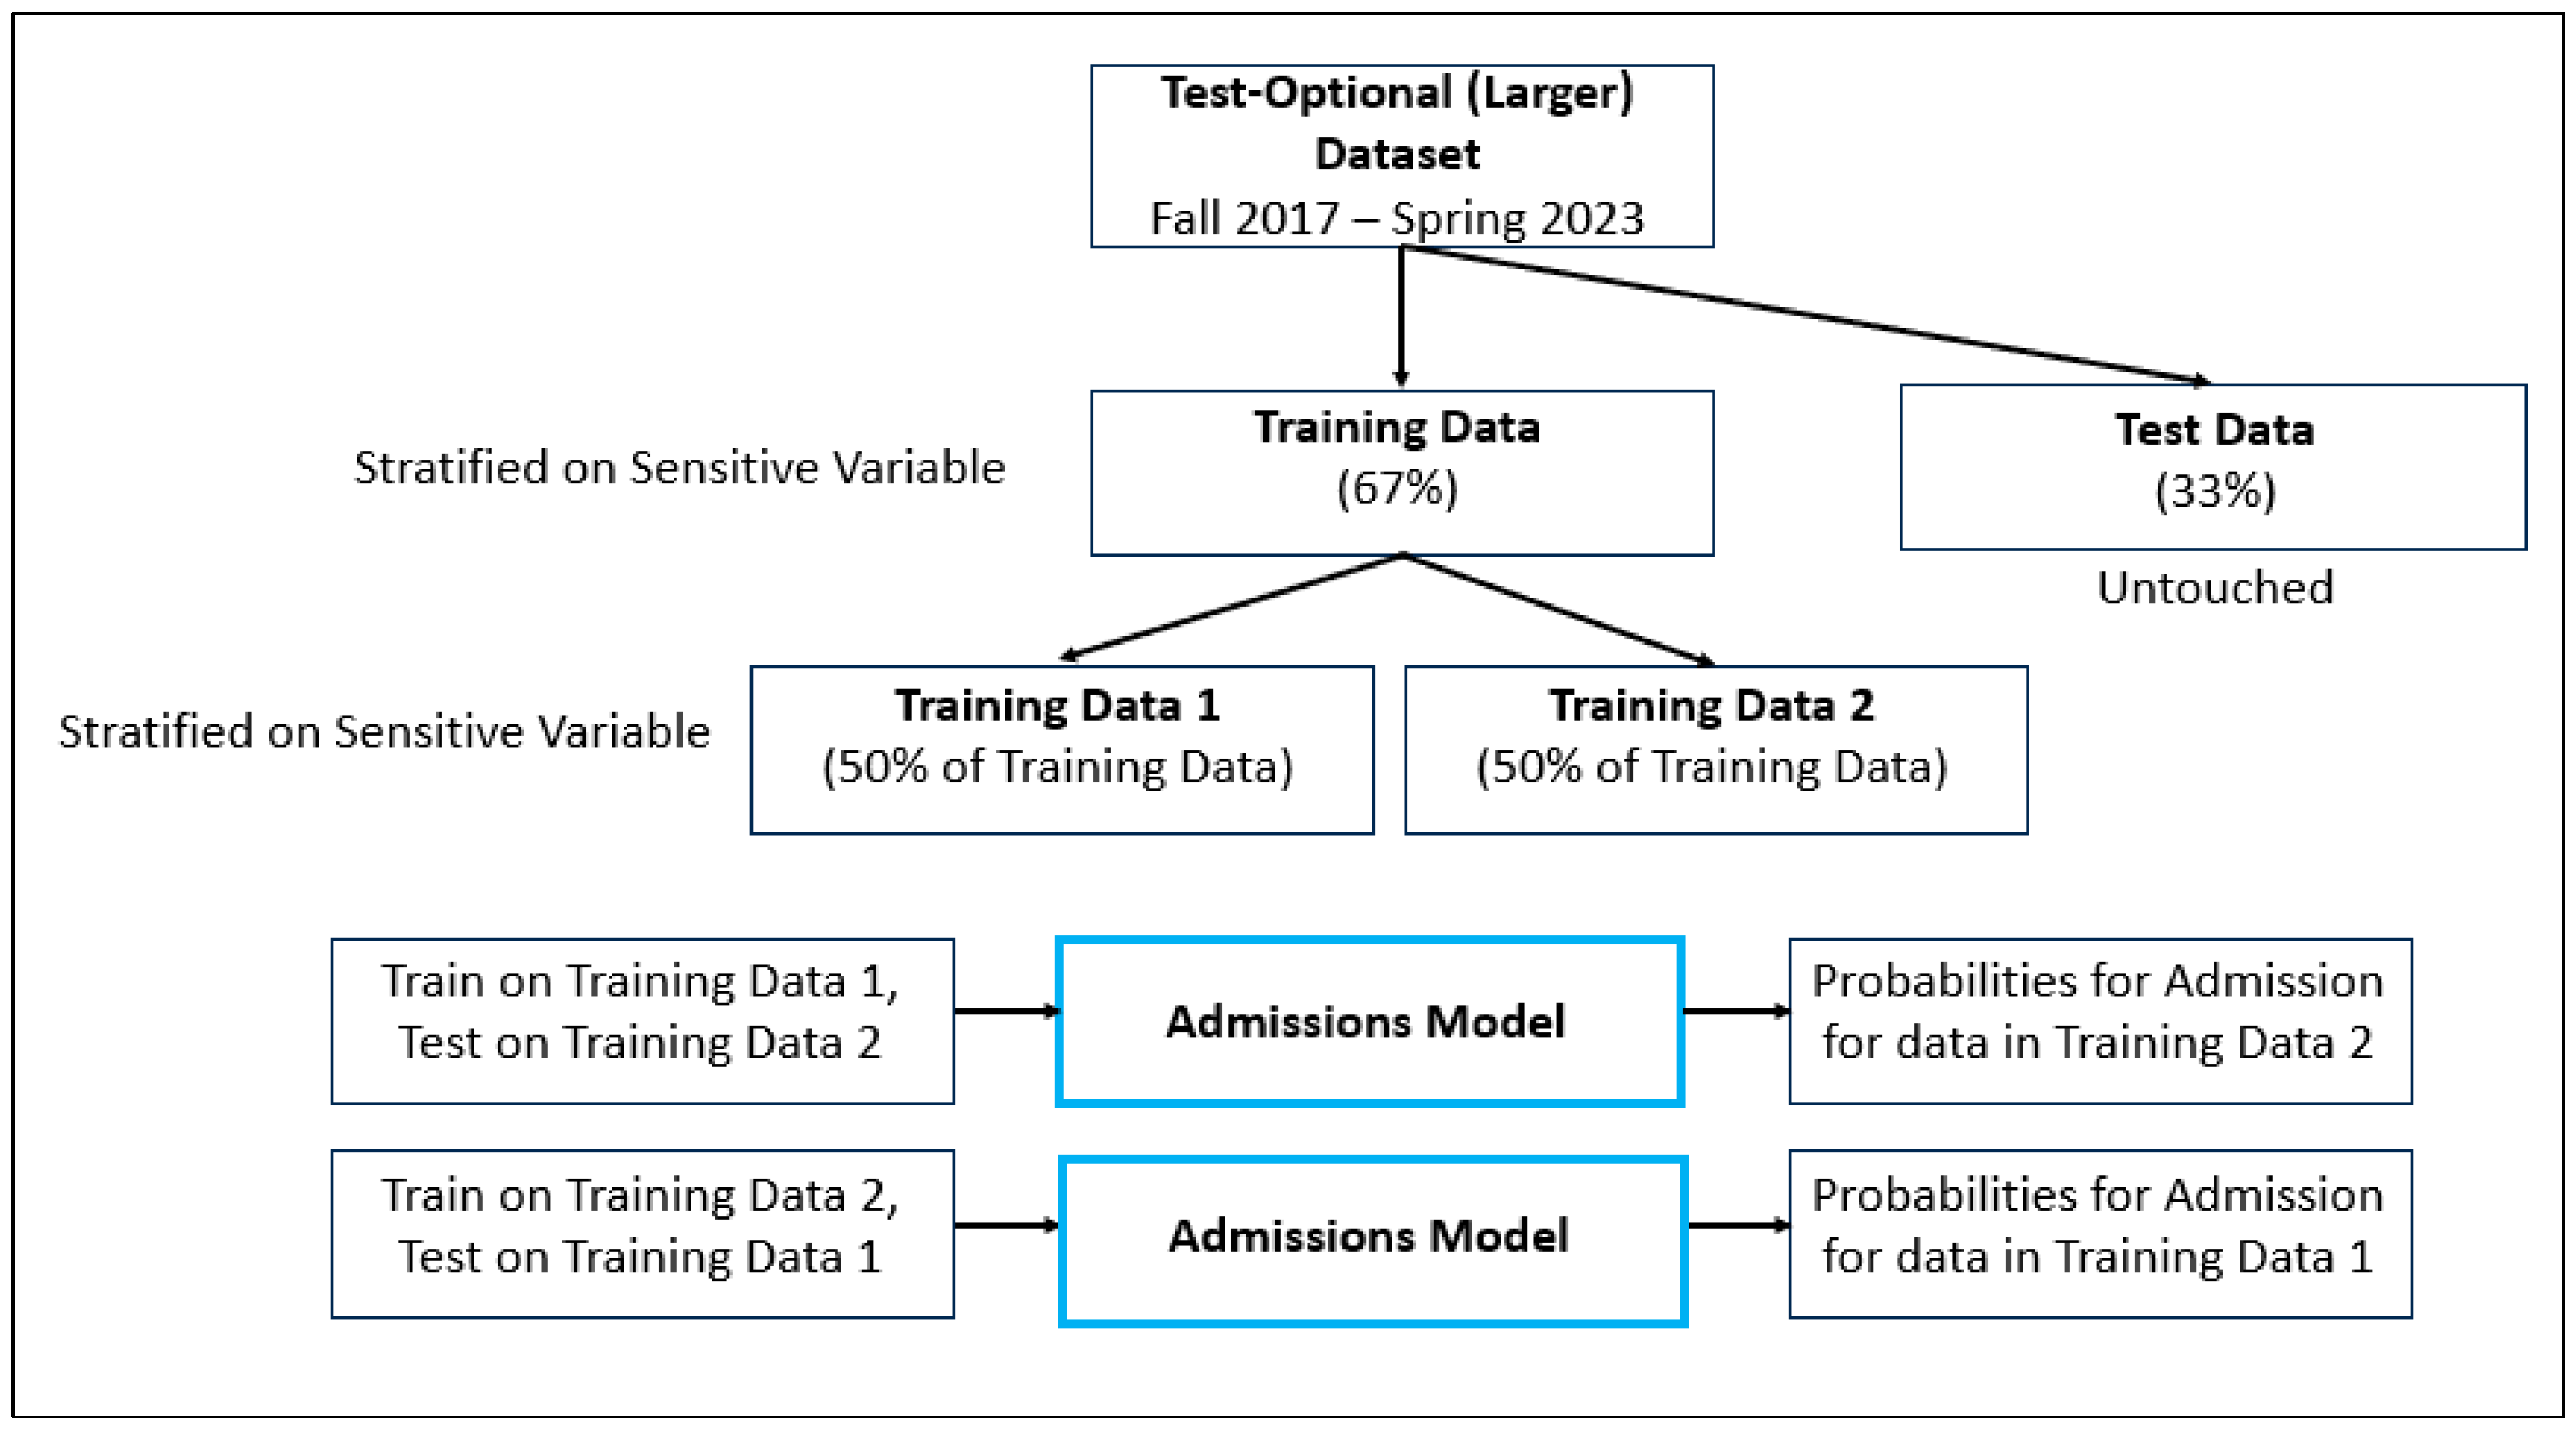
The goal of Phase 1 is to assign a probability for admission for each item in the training set, as described below and illustrated in
Figure 15.
(1) Begin with the Test-Optional (Larger) dataset.
(2) To train a new model, we need Training Data and Test Data. So, we divide the Test-Optional (Larger) dataset into Training Data (67%) and Test Data (33%), using stratified sampling on one of the sensitive variables.
(3) Next, we need a probability for admission for each item in the Training Data. (This will be used in a later step in the algorithm.) To accomplish this, we use half of the Training Data to generate probabilities for the other half of the Training Data. The Training Data is split into two datasets, Training Data 1 (50%) and Training Data 2 (50%), using stratified sampling on the same sensitive variable. The Test Data remains untouched. Then:
- •
The Admissions Model is trained using Training Data 1 and tested using Training Data 2. As a result, all of the students in Training Data 2 are assigned a probability representing the likelihood of admission.
- •
The Admissions Model is trained using Training Data 2 and tested using Training Data 1. As a result, all of the students in Training Data 1 are assigned a probability representing the likelihood of admission.
(4) Training Data 1 and Training Data 2 are recombined, resulting in a training dataset where each item has an associated probability for admission.
We note that this approach relies on using subsets of the original training set.
Table 5 shows that both overall and subset accuracy remain high (76% or higher) as the size of the training set decreases, so this is not a problem.
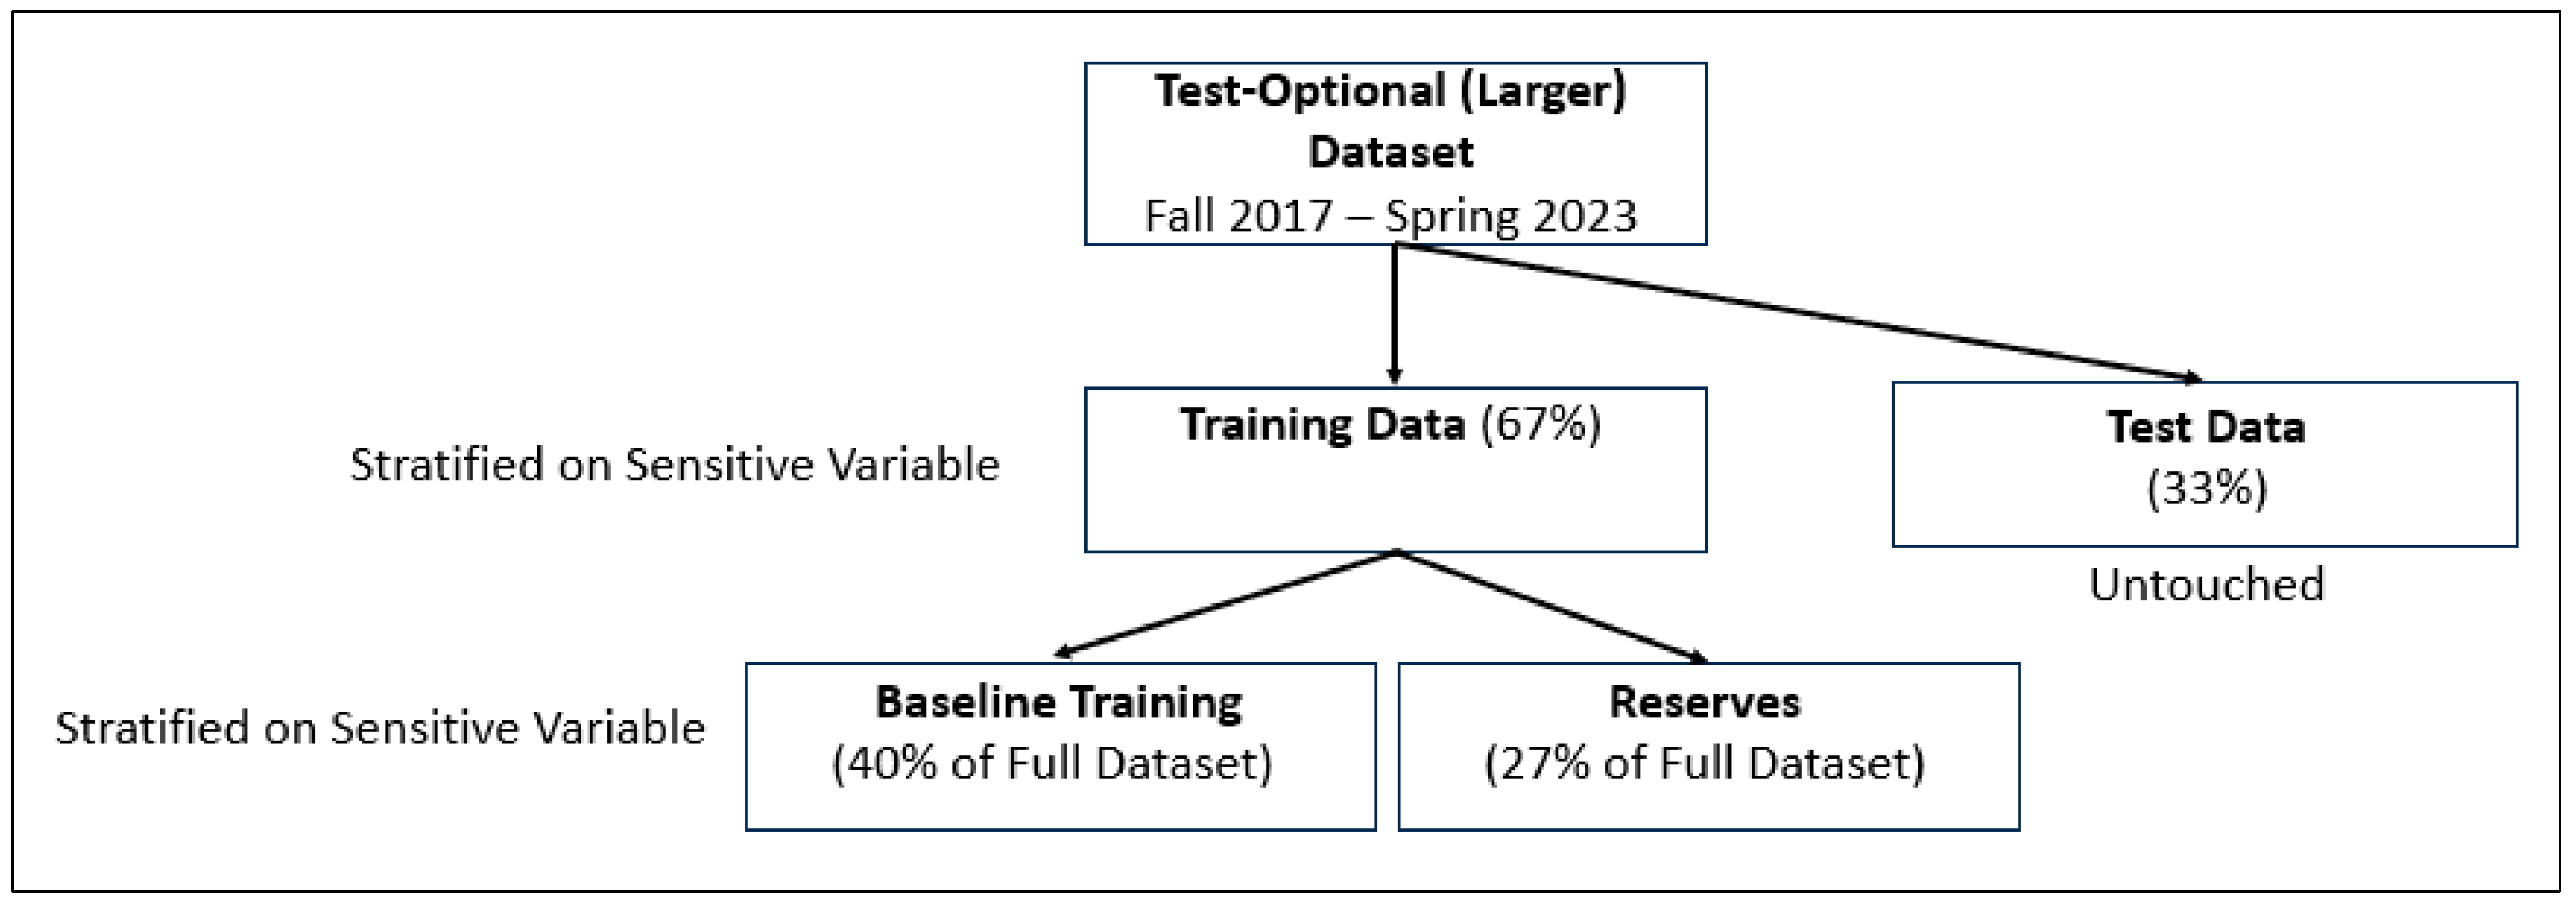
PHASE 2:
Phase 2 of the dataset construction for the Bias Mitigation Model M* generates a Baseline Training dataset and a Reserves dataset. The Reserves dataset will be used to make adjustments to the Baseline Training dataset. These datasets are constructed as described below and illustrated in
Figure 16:
(1) After Phase 1, the Training Data (67% of the full dataset) now includes a probability for admission for each student in the dataset.
(2) The Training Data is split into two datasets, Baseline Training (40%) and Reserves (27%), using stratified sampling based on one of the sensitive variables. Both the Baseline Training dataset and the Reserves dataset contain a probability of admission for each student. These probabilities can be compared against the Ground Truth data and provide a means for filtering data to be used from the Reserves dataset.
PHASE 3:
Phase 3 constructs the final dataset used to build the Bias Mitigation Model M*. Our algorithm for constructing this dataset is as follows:
(1) Start with a Baseline Training dataset, X0.
(2) Train the original Admissions Model M0, using the Baseline Training dataset X0. Test the Admissions Model, M0, using the Test dataset, and record the Baseline Bias/Fairness statistics S0.
(3) Iterate i times:
- (a)
Generate a random perturbation percentage for each sensitive variable [female, firstGen, nonWhite].
- (b)
Make adjustments Ai to the Baseline Training dataset from the Reserves dataset, based on the perturbation percentages above, to create an adjusted dataset Xi.
- (c)
Train an adjusted Admissions Model Mi using the adjusted dataset Xi.
- (d)
Test Admissions Model Mi using the Test dataset. Compute and record Bias/Fairness statistics Si on Admissions Model Mi.
- (e)
Reset to the Baseline Training dataset X0, and repeat.
The final dataset for Bias Mitigation Model M* consists of i rows of data. Each row [Si, Ai] in the dataset consists of Bias/Fairness statistics Si generated by making adjustments Ai to the Baseline dataset.
We constructed a dataset of size i = 5000. The size of the dataset was chosen because it was large enough to give good results but small enough to keep the running time of the algorithm reasonable. To create the perturbed dataset, we randomly generated perturbation percentages between 0% and 40% for each sensitive variable and then added data from the Reserves dataset to the Baseline Training dataset. Data chosen from the Reserves dataset were students who were actually admitted and had a predicted probability of admission of 50–80% (lower confidence True Positives). These parameters worked well for this dataset, but could be adjusted as needed.
3.7. Bias Mitigation Model M*, Construction and Evaluation
At this point, we have a dataset for the Bias Mitigation Model M*. This dataset was split into a Training dataset (67%) and a Testing dataset (33%). The model was constructed using a linear regression model and evaluated using R2 (the coefficient of determination), MSE (Mean Squared Error), MAE (Mean Absolute Error), and RMSE (Root Mean Squared Error).
The models performed well, showing high accuracy. The results are shown below in
Table 6:
5. Conclusions
This research analyzed college admissions data using a machine learning model, the Admissions Model, to predict whether a student was directly admitted into the School of Science at a large urban university. Bias and fairness metrics were computed on the model and analyzed with respect to three sensitive variables: Gender, First-Generation, and Race. Any difference above a threshold of 0.05 in any metric between subgroups of sensitive variables suggests evidence of algorithmic bias in the machine learning model.
Recognizing that bias and fairness are subjective, we developed an interactive human-in-the-loop method to help mitigate this bias. A second machine learning model, the Bias Mitigation Model, was constructed that allowed the user to specify desired adjustments to the bias and fairness metrics and then would predict the necessary adjustments to the training set for the Admissions Model. The Admissions Model was then trained on the adjusted training set, and the bias and fairness statistics were reevaluated. The user could make incremental adjustments repeatedly until satisfied with a more fair adjusted Admissions Model.
The conclusions we can draw from this study include:
Detecting and mitigating bias in machine learning models is important, especially in educational settings. Universities are increasingly using AI in a variety of contexts, including assistance in college admissions decisions, and want to be able to trust the use of this technology.
Carefully designed adjustments to the datasets used to train machine learning models can effectively mitigate bias.
Fairness is complex and subjective, and motivates the need for human input into the bias mitigation process. This research describes an approach that interactively allows a user to specify and adjust the metrics used to measure bias and fairness.
One limitation of this study is that although it was developed to be a generalizable framework, we have only evaluated it on one dataset. Our next step is to evaluate this interactive bias mitigation methodology using a financial dataset. We have shown this method works well using admissions data, but exploring its use on a dataset from other domains could lead to additional insights. For example, there are many parameters in this methodology that could be tuned, and experimenting with a variety of datasets could lead to information about which of these parameters are most important.
A second area for future work is to modify the machine learning model to use reinforcement learning-assisted algorithms to improve initial model performance. In its current state, this method looks at all bias and fairness metrics equally when the initial model is constructed. However, a user may have a priori knowledge of the relative importance of various bias and fairness metrics, which could lead to a more fair model before any bias mitigation is done.
A third area for future work is to better evaluate our interactive interface by designing and conducting a user study. Creating a useful interface is a challenge because, for example, most members of an admissions committee are probably unfamiliar with the statistics involved in constructing machine learning models. So, if such a user is provided with too much information, it is likely to feel overwhelming. But if the user is provided with too little information, it will be difficult to tweak the machine learning model in a meaningful way.
AI software is becoming ubiquitous because it can lead to greater insight, efficiency, accuracy, and consistency. It can also introduce new bias and reveal fairness issues, so having a clear understanding of these issues and the process for resolving them is critical. The interactive bias mitigation process described here is a step towards helping ensure information given by AI systems is reliable, just, and trustworthy.


