

A GPT-Based Approach for Cyber Threat Assessment


COEUS Institute, New Market, VA 22844, USA
AI 2025, 6(5), 99; https://doi.org/10.3390/ai6050099
Submission received: 25 February 2025
/
Revised: 18 April 2025
/
Accepted: 6 May 2025
/
Published: 13 May 2025
(This article belongs to the Special Issue The Application of Machine Learning and AI Technology Towards the Sustainable Development Goals)
Abstract
Background: The increasing prevalence of cyber threats in industrial cyber–physical systems (ICPSs) necessitates advanced solutions for threat detection and analysis. This research proposes a novel GPT-based framework for assessing cyber threats, leveraging artificial intelligence to process and analyze large-scale cyber event data. Methods: The framework integrates multiple components, including data ingestion, preprocessing, feature extraction, and analysis modules such as knowledge graph construction, clustering, and anomaly detection. It utilizes a hybrid methodology combining spectral residual transformation and Convolutional Neural Networks (CNNs) to identify anomalies in time-series cyber event data, alongside regression models for evaluating the significant factors associated with cyber events. Results: The system was evaluated using 9018 cyber-related events sourced from 44 global news portals. Performance metrics, including precision (0.999), recall (0.998), and F1-score (0.998), demonstrate the framework’s efficacy in accurately classifying and categorizing cyber events. Notably, anomaly detection identified six significant deviations during the monitored timeframe, starting from 25 September 2023 to 25 November 2024, with a sensitivity of 75%, revealing critical insights into unusual activity patterns. The fully deployed automated model also identified 11 correlated factors and five unique clusters associated with high-rated cyber incidents. Conclusions: This approach provides actionable intelligence for stakeholders by offering real-time monitoring, anomaly detection, and knowledge graph-based insights into cyber threats. The outcomes highlight the system’s potential to enhance ICPS security, supporting proactive threat management and resilience in increasingly complex industrial environments.
1. Introduction
Cybersecurity research has traditionally relied on diverse data sources to understand, detect, and mitigate threats. These include network traffic data [1,2,3,4], simulation environments [5], open-source anti-virus vendor databases [6], surveys [7,8], and even social media [9]. More recently, global news media has emerged as a promising source for cyber intelligence, providing real-time and contextual insights into cyber incidents. For instance, studies like [10] examined 25 years of news articles from Swedish newspapers without using any Natural Language Processing (NLP) techniques. While [11] utilized data from 14 news portals and used preliminary NLP techniques like LDA-based topic modeling, Ref. [12] employed both sentiment analysis and LDA. However, these approaches predominantly relied on keyword-based extraction techniques, which often fail to capture semantically relevant content that lacks explicit keywords. For example, critical topics such as “Data Breach at Global Bank Affects Millions” or “Hackers Exploit Zero-Day Vulnerability” are directly related to cybersecurity but may be overlooked due to the absence of predefined keywords like “Cybersecurity” or “Cyber Safety”. These limitations necessitate a shift toward more advanced techniques capable of extracting meaningful insights from large, heterogeneous datasets.
Industrial cyber–physical systems (ICPSs), which integrate computational and physical processes, are foundational to modern industries such as manufacturing, energy, and transportation [8,13]. While ICPSs enable operational efficiency and innovation, their interconnected nature also exposes them to sophisticated cyber threats, including ransomware attacks and Advanced Persistent Threats (APTs) [14]. The growing reliance on ICPSs underscores the need for effective threat detection and mitigation strategies. Traditional cybersecurity tools often lack the scalability, semantic depth, and analytical rigor required to process and analyze the vast volumes of data ICPSs generate, leaving them vulnerable to operational disruptions and data breaches [15]. The challenges of real-time monitoring, accurate classification, and actionable insights for ICPS security call for a comprehensive, innovative approach.
To comprehensively address the pressing challenges in cybersecurity, this study poses the following research question: “How can a GPT-based framework enhance the accuracy and efficiency of cyber threat detection and analysis in industrial cyber–physical systems?” Subsequently, to this research question, we propose a Generative Pretrained Transformer (GPT)-based framework that integrates multiple advanced technologies into a cohesive system for cyber threat detection and analysis. Unlike prior studies that focused on isolated techniques like keyword-based topic extraction [10,11,12], clustering [16], or anomaly detection [1,2], our framework combines semantic classification using GPT, knowledge graph construction [17], clustering, regression analysis [18], and anomaly detection using spectral residual (SR) transformation and Convolutional Neural Networks (CNNs) [19]. Evaluated on a dataset of 9018 cyber events from 44 global news sources, the system achieved exceptional performance with a precision of 0.999, recall of 0.998, and an F1-score of 0.998. This work not only advances the theoretical understanding of applying AI in cybersecurity but also provides a scalable, actionable tool for improving ICPS resilience, setting a new benchmark in cyber threat intelligence and analysis.
In summary, the following are the core contributions:
- The introduction of a comprehensive framework for delivering actionable intelligence, including visualization of prominent attack types and affected industries, the identification of correlated factors and unique event clusters, and anomaly detection in ICPS data, supporting enhanced cyber resilience and proactive threat management.
- With mathematical rigor, this study lays the theoretical foundation of a novel framework integrating GPT with advanced AI techniques, including semantic classification, knowledge graph construction, clustering, regression analysis, and anomaly detection, to provide a comprehensive approach to cyber threat analysis (as shown in Figure 1).
- The production of extensive cyber intelligence data from 44 news media sources through a fully automated process over an extended period, spanning from 25 September 2023 to 25 November 2025 (14 months), demonstrating practical applicability.
- A comprehensive evaluation of the proposed system with a fully automated GPT-based categorization of 9018 cyber events (i.e., precision, recall, and F1-score of 0.999, 0.998, and 0.998, respectively) into four categories; visualizations of the most prominent attack types and the affected industries along with their intricate relationships via knowledge graphs; the identification of 11 correlated factors associated with significant cyber events; the detection of five unique clusters with AI-driven insights on significant cyber events; and the automated identification six anomalies from time-series cyber data.
Section 2 details the system architecture, explaining each layer involved in the cyber analytics system. Section 3 discusses the mathematical modeling techniques employed for cyber threat categorization and analysis. Section 4 outlines our experimentation process and data collection methodologies. Section 5 presents the results, including detailed analyses of knowledge graphs, regression, clustering, and anomaly detection. In Section 6, the discussion synthesizes findings and contextualizes them within the broader field of cyber threat intelligence. Finally, Section 7 concludes the paper by summarizing the research contributions and suggesting directions for future research.
2. System Architecture
The cyber analytics system is organized into five main layers, each responsible for specific functions that process and analyze cyber-related news data, culminating in a user-facing interface for visualization and insights (as seen in Figure 2).
2.1. Data Ingestion Layer
The data ingestion layer gathers cyber news data from multiple sources, including RSS feeds, APIs, and web scrapers. It should be noted that real-time cyber-related news acquisition is not depicted in existing studies like [10,11,12]. The proposed system continuously collects articles from trusted outlets like BBC and CNN, storing them in a raw data repository. This layer ensures that the data flow is consistent, providing fresh input for further processing.
2.2. Data Preprocessing and Feature Extraction
Once ingested, data move to the data preprocessing and feature extraction layer, where they undergo NLP-based cleaning and structuring using GPT [20]. The GPT-based model identifies and classifies relevant features within each article, extracting key information like industry category, attack type, event location, and significance attributes. The processed and enriched data are now structured and ready for analysis.
2.3. Analysis Modules
The analysis module layer consists of several core components that handle deeper processing and relationship modeling. The significance scoring module evaluates each event’s impact by calculating a significance score based on affected countries’ geopolitical strengths. The geopolitical strengths of the affected countries are calculated by the critical consideration of multiple dimensions like Diplomatic, Information, Military, Economic, Financial, Intelligence, and Legal (DIMEFIL), as shown in [21]. This score is assigned a discrete level, providing an impact metric for each event. The knowledge graph construction module builds a semantic network connecting industries and attack types as nodes, with edge weights representing event significance. This graph structure enables a contextual understanding of how specific industries and attack types are interlinked by cyber incidents [17]. The clustering and pattern detection module identifies patterns across the dataset by grouping similar events based on shared features, revealing common themes and trends in cyber threats [16]. Finally, the regression analysis module explores relationships between event attributes, using statistical models to determine how specific factors influence event significance and to analyze temporal trends in cyber incidents [18].
2.4. Query and Anomaly Detection
The query and anomaly detection layer enables dynamic exploration and monitoring of cyber data. The query matching and retrieval module allows users to search the database using natural language queries, retrieving relevant articles based on cosine similarity matching. The anomaly detection module monitors time-series data for irregular patterns [1,2], utilizing a combination of SR transformation and CNN-based classification (as shown in [19]). This component detects anomalies in the frequency of cyber incidents, flagging unusual spikes or drops that may signal significant events.
2.5. User Interface and Visualization
At the top, the user interface and visualization layer presents insights to users through an interactive dashboard. Users can view knowledge graphs, cluster maps, and time-series trends, interact with the query system, and receive anomaly alerts. Visual tools allow for a clear presentation of complex patterns, enabling users to explore interconnected data and monitor significant changes in cyber threat activity.
This layered architecture ensures that data are systematically processed, enriched, analyzed, and presented, providing a comprehensive platform for cyber threat analysis and monitoring.
3. Mathematical Modeling
This section presents the mathematical foundations of our cyber analytics system, which processes, categorizes, and analyzes cyber-related news articles. Key components include classification, significance scoring, knowledge graph construction, clustering, query matching, regression analysis, and anomaly detection. The notation used throughout is summarized in Table 1.
3.1. Industry and Attack Type Classification
Given each article i with content , we classify it by industry and attack type using probabilistic classification. Define industry categories and attack types . For each , classification maximizes the conditional probabilities:
Using GPT-based embeddings, each probability and is computed within a high-dimensional feature space. This classification has a complexity of , where d is the dimensionality of the embedding space.
3.2. Significance Score Calculation
To evaluate the importance of each event, we define a significance score based on affected countries and their geopolitical strengths:
The score is then mapped to a discrete level based on thresholds :
3.3. Knowledge Graph Construction
The knowledge graph represents relationships between attack types and industries . The weight of each edge is calculated based on aggregated significance levels:
where is the set of articles linking and . Sparse matrix representations and regularization via penalty can be used to stabilize values.
3.4. Clustering Analysis
Each article i is represented by a feature vector . Clustering minimizes within-cluster variance using K-means, given by
where is the centroid of cluster k. The complexity is , where N is the number of articles, d is the feature dimension, K is the number of clusters, and T the number of iterations.
3.5. Cosine Similarity for Query Matching
To match user queries q, cosine similarity is calculated between query vector and each article vector :
It is important to clarify that cosine similarity was chosen primarily for its efficiency and appropriateness in dealing with relatively short texts, such as news titles and descriptions typically under 800 words. This metric effectively captures the angular similarity between text vectors, which is suitable for our dataset where document length variability is limited, thus minimizing the impact of its sensitivity to document length. However, we acknowledge that cosine similarity may not fully capture deeper semantic meanings and is susceptible to issues in high-dimensional sparsity [22].
For large datasets, Approximate Nearest Neighbors (ANNs) optimize comparisons, making retrieval efficient even with high-dimensional vectors. To address the implementation of ANNs for mitigating high-dimensional sparsity in our cyber threat assessment framework, we integrated the Annoy library, which is designed for memory-efficient and fast querying in high-dimensional spaces. The ANN method uses a forest of trees to approximate the nearest neighbors, significantly reducing query time with minimal loss of accuracy. We tuned the parameters such as the number of trees and the search-k parameter based on empirical tests that optimized for both speed and memory usage. This approach allowed us to efficiently handle sparse data by enhancing the scalability and responsiveness of our system without the need for exhaustive search methods [23].
FetchXML Query: In the context of our research, it is imperative to retrieve a precise subset of records from the news database dfs_newsanalytics entity. These records must be unprocessed and related to specific types of cyber events. To formalize this in our study, we define Equation (7) as follows:
where the following are denoted:
- E represents the entity dfs_newsanalytics, from which records are fetched.
- is an indicator function that equals 1 if the record x has not been processed (i.e., crd69_cyberprocessed ), and 0 otherwise.
- is another indicator function that equals 1 if the event code of record x is within the specified critical cyber event categories {Nation State Hacking, Globally Disruptive Cyber Attack, Ransomware Attack News, Cybersecurity News}, and 0 otherwise.
This equation succinctly captures the filtering logic applied to select relevant records for our analysis, ensuring that only pertinent, unprocessed data are considered in the ensuing stages of our cyber threat assessment framework. An actual implementation of FetchXML query out of the mathematical model represented in Equation (7) is shown in Appendix A.
3.6. Regression Analysis for Significance Prediction
Regression models quantify relationships between features (e.g., industry, country) and the significance level .
Linear Regression: We can model the significance level as a linear function of factors such as industry , attack type , and country c:
where are regression coefficients and is the error term.
Logistic Regression: To estimate the probability of a significant attack, we use logistic regression:
where are logistic regression coefficients.
Time-Series Regression for Trend Analysis To analyze temporal trends, we apply a time-series regression model on the significance scores :
where T is the period, are parameters, and is the error term.
3.7. Anomaly Detection Using SR + CNN
Anomaly detection in time-series data uses SR and CNN to detect spikes or dips in cyber incident frequencies.
Spectral Residual Transformation: Given as the incident frequency over time, the Discrete Fourier Transform (DFT) is applied:
Log-transformed amplitude and residual are calculated:
Reconstructed spectrum combines with the original phase:
Apply inverse DFT to generate the saliency map :
CNN-Based Anomaly Classification: A CNN classifies segments of as normal or anomalous, using overlapping windows of length w:
The CNN produces an anomaly score , with threshold :
3.8. Unified Loss Function for Optimization
To optimize the system, a combined loss function incorporates feature extraction, relationship modeling, and anomaly detection:
where is defined by
The weights are optimized via cross-validation, ensuring a balanced performance across tasks.
4. Experimentation
To assess the efficacy of the proposed GPT-based cyber analytics framework, an extensive monitoring initiative was conducted across 44 prominent news portals, including but not limited to BBC, CNN, Dark Reading, The Hacker News, and Security Weekly, over a duration extending from 25 September 2023 to 25 November 2024. These news sources were systematically incorporated into the monitoring list over time, employing Web Scraping, Application Programming Interface (API), and Really Simple Syndication (RSS) methodologies for efficient and comprehensive news data extraction. As depicted in Figure 3, Microsoft Power Automate was utilized throughout the data acquisition phase spanning approximately 15 months, functioning primarily as an orchestrator to process and manage the retrieval of news articles via API interactions with OpenAI’s GPT-3.5 Turbo model. The term “GPT model” refers broadly to the class of Generative Pretrained Transformer architectures, encompassing open-source variants such as GPT-J, GPT-NeoX, and others. Within the context of this paper, all references to “GPT model” explicitly denote GPT-3.5 Turbo (OpenAI).
Given the inherent unstructured characteristics of news articles, conventional analytical techniques such as knowledge graph construction, regression analysis, and anomaly detection are typically not directly applicable. To address this limitation, the GPT-3.5 Turbo model was employed to systematically transform these unstructured articles into structured data formats, thus facilitating subsequent analytical processes involving knowledge graphs, regression analyses, and anomaly detection methodologies. It is noteworthy that while prior research efforts have applied analytical models such as anomaly detection and regression primarily to structured cybersecurity datasets [18,20], this research distinctly extends these analytical capabilities to unstructured news articles through the proposed GPT-based analytic framework.
Upon successful conversion into structured datasets, the news articles pertinent to cybersecurity, hacking, or information warfare were specifically filtered, resulting in the generation of a dedicated cybersecurity dataset. This dataset, developed explicitly for this research initiative, is publicly accessible and available at https://github.com/DrSufi/CyberNews (accessed on 15 March 2025). Subsequently, the newly compiled dataset underwent rigorous analytical procedures aimed at fulfilling the overarching objectives of this study. As illustrated in Figure 3, the dataset was securely stored within Microsoft Dataverse. FetchXML queries (such as the one shown in Appendix A) were used to obtain data from the tables in Microsoft Dataverse. Subsequently, Microsoft Power BI was leveraged for robust data analysis and sophisticated visualization purposes. The analytical outcomes were derived through the execution of Python scripts embedded within the Power BI environment.
Finally, leveraging the versatile capabilities of Microsoft Power BI for data visualization and analysis ensured that the resultant dashboards and analytical reports could be conveniently disseminated to diverse decision-making stakeholders concerned with cybersecurity issues. This accessibility extended across various operating environments (including Windows, iOS, and Android) and multiple device form factors, such as desktops, tablets, and mobile devices.
In regard to data protection, prior to transmission to data pipeline, news records were sanitized to remove IP addresses, user credentials, identifiable organization-specific information, and any confidential metadata. Only news headers and description were passed for classification using the GPT-3.5 Turbo model. On the OpenAI side, data privacy was assured by OpenAI’s data privacy agreement located at https://openai.com/enterprise-privacy/ (accessed on 18 April 2025). After the classification and categorization, outputs are stored in a compliance-hardened Microsoft Dataverse environment with controlled user access, role-based permissions, and activity logging. These measures collectively ensure the ethical and secure usage of external generative models, thereby mitigating data exposure risks during semantic classification.
5. Results
GPT APIs classified and categorized the news reports into four main categories, as shown in Table 2. Furthermore, GPT APIs classified each of these cyber events into 15 effected industries (i.e., ‘Critical Infrastructure’, ‘Healthcare and Public Health’, ‘Financial Services’, ‘Government and Public Administration’, ‘Information Technology and Telecommunications’, ‘Manufacturing and Industrial’, ‘Retail and E-commerce’, ‘Education and Research’, ‘Media and Entertainment’, ‘Hospitality and Tourism’, ‘Energy and Utilities’, ‘Transportation and Logistics’, ‘Agriculture and Food Services’, ‘Real Estate and Construction’, ‘Professional Services’) and 15 attack types (i.e., ‘Malware’, ‘Phishing’, ‘Denial-of-Service (DoS) and Distributed Denial-of-Service (DDoS) Attacks’, ‘Man-in-the-Middle (MitM) Attacks’, ‘SQL Injection (SQLi)’, ‘Cross-Site Scripting (XSS)’, ‘Password Attacks’, ‘Insider Threats’, ‘Advanced Persistent Threats (APTs)’, ‘Zero-Day Exploits’, ‘Social Engineering Attacks’, ‘Business Email Compromise (BEC)’, ‘Supply Chain Attacks’, ‘Drive-By Downloads’, ‘Cryptojacking’). GPT also extracted the locations of these events as portrayed in Figure 4. Eventually, these 9018 cyber-related events were used for evaluating knowledge graphs, regression-based correlation, clustering-based pattern matching, and CNN-based anomaly detection.
5.1. Comprehensive Insights with Knowledge Graph
Knowledge graphs within the cyber domain have been demonstrated to be highly effective in elucidating complex relationships for scientists, analysts, strategists, and policymakers [17]. However, current research has yet to explore the direct generation of knowledge graphs from cyber-related news reports. Figure 5 and Figure 6 illustrate nuanced relationships between various attack types and the impacted industries within a specific timeframe, spanning from 1 March 2024 to 19 March 2024.
During this period, the “Information Technology and Telecommunications” industry experienced the highest incidence of cyber-related events, followed by “Government and Public Administration”, “Financial Services”, and “Healthcare and Public Health” (Figure 5). Concurrently, attack types such as “Zero-Day Exploits”, “Malware”, “Social Engineering Attacks”, “Advanced Persistent Threats (APTs)”, “Supply Chain Attacks”, and “Ransomware” emerged as the most prevalent (Figure 6). These visualizations underscore the critical role of knowledge graphs in capturing intricate patterns and trends within cyber threat landscapes on any given timeframe.
To ensure robustness in the knowledge graphs’ construction, particularly when aggregated significance levels exhibit high variability or sparsity, the proposed system implements several methodological safeguards. Firstly, normalization techniques such as min–max scaling or z-score normalization are applied to stabilize the variability of significance scores across diverse cyber events, thus maintaining consistency in edge weighting. Secondly, thresholding mechanisms are employed to mitigate the impact of sparse connections by retaining only relationships that surpass statistically validated significance thresholds. Additionally, robustness is further enhanced by incorporating frequency-based filtering, wherein nodes or edges that consistently demonstrate sparse or erratic significance scores across the dataset are systematically evaluated or excluded. Collectively, these methodological strategies guarantee the structural stability, reliability, and interpretability of the resulting knowledge graph.
5.2. Regression Analysis to Identify Key Influencers
The regression analysis module identifies the factors influencing the significance (S) of events by quantifying the relationship between event attributes (industries in Figure 7, attack types in Figure 8, and impacted countries in Figure 9) and their average significance score (S). Logistic regression was used on all the categorical values within Microsoft Power BI environment, enabling the determination of key factors driving significance, as shown in Figure 7, Figure 8 and Figure 9. Given the diverse set of explanatory variables (e.g., industry categories, attack types, impacted countries), potential multicollinearity may influence the robustness and interpretability of our regression model. To mitigate this risk, Variance Inflation Factor (VIF) was computed to detect multicollinearity among predictors. Variables exhibiting VIF values greater than five were considered highly collinear, prompting either feature selection or regularization techniques like ridge regression. These approaches ensured reliable inference of each factor’s impact on event significance.
Through this process, we examined how changes in attributes (independent variables) influence S (dependent variable). The regression model generated insights by measuring the average increase () in significance for specific factors. The relationships are presented in a structured manner using a notation system portrayed in Table 3).
The key relationships derived from the regression analysis are presented in two tables (Table 4 and Table 5): one for the descriptive factors and another for the corresponding equations (capturing the factors that influence the increase in S).
The regression analysis highlights the significant influence of specific factors on event significance. Industries such as critical infrastructure and attack types such as Advanced Persistent Threats () exhibit the highest increases in S. Similarly, geopolitical contexts, as seen in events affecting countries like Iran (), also show strong impacts.
These insights provide actionable knowledge for prioritizing response strategies and resource allocation, ensuring focused efforts on high-impact factors. Therefore, regression techniques have been used in previous cyber-related studies [18]. However, according to the existing literature, this study represents the first documented application of regression analysis on cyber data aggregated from open-source news media.
5.3. Clustering Intricate Patterns on Cyber Events
Cluster analysis was conducted to identify top segments based on factors influencing the significance (S) of events. Using Power BI’s visualization of top segments (as shown in Figure 10), five distinct clusters were identified, each representing a group of factors contributing to high significance scores. The results are summarized below.
Table 6 highlights the segmentation of high-significance events based on attack types, impacted countries, and industries. Segment 1 emphasizes the criticality of Advanced Persistent Threats (APTs), while segment 2 showcases the compound impact of Zero-Day Exploits and multiple impacted countries.
To provide a structured, quantitative representation, the relationships in each cluster are expressed mathematically as shown in Table 7. Table 7 provides the mathematical representation of the segments, clearly defining the conditions under which the average significance (S) for each cluster is observed.
This K-means clustering analysis highlights the segmentation of high-significance events based on attack types, impacted countries, and industries. The optimal number of clusters (K) was determined using Silhouette analysis, where the average Silhouette width was calculated for cluster sizes ranging from 2 to 10. The optimal K was selected based on the highest average Silhouette score, ensuring maximum cohesion within clusters and separation between them. This systematic determination of K significantly enhanced the interpretability and robustness of our clustering analysis, although slight variations in K could moderately influence cluster characteristics.
In segment 1, events involving Advanced Persistent Threats (APTs) exhibit the highest significance, with an average , surpassing the overall average by 0.67 units. In segment 2, events with Zero-Day Exploits and multiple countries impacted demonstrate high significance (), 0.63 units above the average. In segment 3, events where attack types are specified (not None), the United States is impacted, and the industry is neither IT nor Government result in , 0.40 units above the average. In segment 4, events with Zero-Day Exploits but not involving multiple impacted countries score , 0.34 units higher than the average. In segment 5, events excluding specific attack types (e.g., Social Engineering, Zero-Day Exploits, or APTs), countries (e.g., United States), and industries (e.g., IT or Government) have , 0.22 units above the average.
Insights leveraged with clustering can guide the prioritization of resources and risk mitigation strategies in cyber incident management, and hence, it was utilized by other researchers in the cyber domain [16]. However, this study is the first to report the application of clustering analysis on cyber data synthesized from open-source news media, as identified in the existing body of literature.
5.4. Anomaly Detection for Identifying Abnormal Patterns in Cyber Events
An anomaly detection algorithm was applied to analyze cyber-related event data, utilizing a sensitivity setting of 75%. The analysis identified significant deviations from expected event counts over the observation period, as shown in Figure 11. Notably, a pronounced spike was detected on 19 July 2024, where the observed count reached 166, significantly exceeding the expected range of 22 to 34. Such anomalies provide critical insights into unusual activity patterns, potentially indicating heightened cyber threats or significant events within that timeframe. This result highlights the effectiveness of anomaly detection in isolating periods of abnormal activity, which can guide further investigation into underlying causes and facilitate timely response strategies. As depicted in Figure 11, there were six anomalies identified during the selected timeframe by the CNN+SR algorithms [19]. Even though anomaly detection algorithms have been used to harness insights on cyber data [1,2], this study marks the first instance in the literature where anomaly detection has been applied to cyber data aggregated from open-source news media.
It should be noted that in this anomaly detection approach, overlapping windows in the saliency map were used to ensure that transient anomalies are not missed. A sliding window of length w with an overlap of 50% was employed, balancing anomaly detection sensitivity and computational efficiency. Computationally, the CNN classification step has complexity , where N represents the number of window segments, w is the window length, and f is the CNN’s feature dimension. Although larger overlaps provide finer temporal resolution, they incrementally increase computation; thus, the 50% overlap was chosen as a practical trade-off between accuracy and computational overhead.
6. Discussion
This section evaluates the system’s ability to categorize and identify cyber-related events using a novel dataset created specifically for this study, consisting of 9018 cyber events. To establish a robust ground truth, 2000 records were selected for detailed evaluation to test the system’s effectiveness across varied cyber threat scenarios. This subset approach allows for a concentrated analysis while maintaining the integrity of ongoing and future validations.
To assess the efficacy of the proposed system in categorizing and identifying cyber-related events, the performance metrics—precision, recall, and F1-score—were evaluated across four primary categories: Cybersecurity News, Nation State Hacking, Ransomware Attack News, and Globally Disruptive Cyber Attacks. The evaluation results are summarized in Table 8.
The evaluation of precision, recall, and F1-score was conducted using the following equations:
Here, TP represents the value of true positives, TN the true negatives, FP the false positives, and FN the false negatives. These metrics provide an evaluation of the system’s ability to correctly classify and identify relevant cyber-related incidents while minimizing false positives and negatives.
The system demonstrated high accuracy, as evidenced by the overall precision, recall, and F1-score values of 0.999, 0.998, and 0.998, respectively. Among the individual categories, the Nation State Hacking category achieved the highest recall of 0.999, indicating the system’s ability to correctly identify nearly all relevant instances of this event type. Meanwhile, the Globally Disruptive Cyber Attack category achieved a perfect precision score of 1.000, reflecting its exceptional ability to avoid false positives.
Although the Ransomware Attack News category exhibited slightly lower performance metrics compared to the others, its precision (0.978), recall (0.971), and F1-score (0.975) remained consistently high, highlighting the robustness of the classification process. The marginally lower scores in this category can be attributed to the more nuanced characteristics of ransomware-related events, which pose additional challenges for accurate classification.
Figure 12 illustrates a 3D surface plot that depicts the performance metrics of recall, precision, and F1-score for four different types of cyber attacks: Zero-Day Exploits, APTs, Malware, and Social Engineering Attacks. This offers a comprehensive view of the effectiveness of the GPT-based classification of these metrics across varied attack scenarios.
On the other hand, the 3D surface plot in Figure 13 presents a detailed visualization of performance metrics—recall, precision, and F1-score—across four key industries vulnerable to cyber attacks: Information Technology and Telecom, Financial Services, Government and Public Administration, and Healthcare and Public Health.
It should be noted that the GPT-based categorization and classification method demonstrated in this research has achieved an impressive F1-score of up to 98%. To mitigate potential hallucinations or inconsistencies arising from GPT-3.5 Turbo model outputs (for categorization and classification), Schema-Constrained Prompt Engineering was integrated into the system. The prompts submitted to GPT were designed using a constrained vocabulary of 15 industry sectors and 15 attack types, effectively guiding the model to choose from a closed label space. As shown in Table 8, this mechanism empirically contributed to the exceptionally high observed precision (ranging between 0.979 and 1) and recall (ranging between 0.933 and 0.999), substantiating the reliability of GPT-assisted classification for cyber threat analysis. Compared to other NLP-based methods such as topic extraction, the results of this study are substantially higher [24,25]. This study leverages Microsoft Power BI’s visualization tools for regression, clustering, as well as anomaly detection. Power BI enhances these methods with explainable AI technology, providing users with clear, natural language explanations of how insights are derived, including confidence levels and the specific data subsets used from the total 9018 records. This approach not only enhances transparency but also allows users to precisely evaluate and trust the decision-making process facilitated by the framework.
The comprehensive evaluation confirms the robustness and reliability of the system in identifying and categorizing diverse cyber-related incidents. These metrics underscore the potential of the proposed approach for real-time monitoring and analysis of cyber events, providing actionable insights for stakeholders.
7. Conclusions
For cyber-related studies, GPT was used in [20], the aggregation of news articles was used in [10,11,12], anomaly detection was used in [1,2], regression was used in [18], clustering was used in [16], and knowledge graph construction was used in [17]. However, this paper introduces the first fully automated solution integrating these technologies. Beyond proposing a robust framework underpinned by mathematical rigor, this research also demonstrates the extraction and valuation of cyber intelligence from open-source news articles, leveraging AI-driven analytical insights.
The primary users of this cyber threat assessment framework are cybersecurity teams, risk management professionals, and strategic decision-makers in sectors utilizing industrial cyber–physical systems (ICPS) such as manufacturing, energy, and transportation. These stakeholders use the framework to proactively detect and mitigate cyber threats, inform strategic planning, and ensure regulatory compliance. Additionally, researchers in cybersecurity can leverage the system’s analytical outputs to advance the development of new security technologies and methodologies.
This study, while offering a comprehensive GPT-based framework for cyber threat analysis, is limited by its reliance on predefined attack and industry categories, potentially overlooking emerging or unconventional threats [26,27]. Future research will aim to enhance the framework by incorporating dynamic learning mechanisms to adapt to novel attack patterns and expanding the temporal and contextual scope of data sources for greater applicability. Moreover, future research endeavors should investigate innovative uses of language models (as shown in [28,29,30,31]) for better categorization and classification of cyber-related news articles.
Funding
This research received no external funding.
Institutional Review Board Statement
Not applicable.
Informed Consent Statement
Not applicable.
Data Availability Statement
This research generated original data of 9018 cyber-related news articles structured with 95 attack types, 29 industries, locations, countries, event date as well as significance. The data are part of the submission as a supplementary document. For supporting research reproducibility and for extending this dataset with other cyber-related data, researchers and scientists can publicly access this dataset from https://github.com/DrSufi/CyberNews, accessed on 4 April 2025.
Acknowledgments
The aggregation of 9018 cyber-related news articles was facilitated by Coeus Institute’s flagship product GERA (https://coeus.institute/gera/, accessed on 4 April 2025). As the CTO of Coeus Institute, the author, Fahim Sufi, would like to extend his gratitude to all members of Coeus Institute, US.
Conflicts of Interest
The author declares no conflicts of interest.
Abbreviations
The following abbreviations are used in this manuscript:
| API | Application Programming Interface |
| APT | Advanced Persistent Threat |
| BEC | Business Email Compromise |
| CNN | Convolutional Neural Network |
| DDoS | Distributed Denial-of-Service |
| DFT | Discrete Fourier Transform |
| DOS | Denial-of-Service |
| ICPS | Industrial Cyber–Physical Systems |
| GPT | Generative Pretrained Transformer |
| NLP | Natural Language Processing |
| SR | Spectral Residual |
| RSS | Really Simple Syndication |
| IDFT | Inverse Discrete Fourier Transform |
| ANN | Approximate Nearest Neighbor |
| F1-Score | F1 Measure Score |
| MITM | Man-in-the-Middle Attacks |
| SQLi | SQL Injection |
| XSS | Cross-Site Scripting |
| TLA | Three Letter Acronym |
| LD | Linear Dichroism |
Appendix A
The FetchXML query used in our research for retrieving unprocessed records associated with specific cyber event types is detailed below. This XML code effectively filters the desired data directly from the dfs_newsanalytics entity within our database system:
<fetch version=“1.0” output-format=“xml-platform” distinct=“false”>
    <entity name=“dfs_newsanalytics”>
        <attribute name=“dfs_newsanalyticsid” />
        <attribute name=“dfs_title” />
        <attribute name=“createdon” />
        <attribute name=“dfs_description” />
        <attribute name=“dfs_eventcode” />
        <attribute name=“dfs_sourceurl” />
        <attribute name=“dfs_firsteventcountry” />
        <attribute name=“dfs_secondeventcountry” />
        <attribute name=“dfs_rating” />
        <order attribute=“createdon” descending=“false” />
        <filter type=“and”>
            <condition attribute=“crd69_cyberprocessed” operator=“neq”
            value=“true” />
            <filter type=“or”>
                <condition attribute=“dfs_eventcode” operator=“in”>
                    <value>Nation State Hacking</value>
                    <value>Globally Disruptive Cyber Attack</value>
                    <value>Ransomware Attack News</value>
                    <value>Cybersecurity News</value>
                </condition>
            </filter>
        </filter>
    </entity>
</fetch>
This XML structure ensures the precise selection of data required for further analysis, adhering to the criteria specified in our study’s methodology.
References
- Ten, C.W.; Hong, J.; Liu, C.C. Anomaly detection for cybersecurity of the substations. IEEE Trans. Smart Grid 2011, 2, 865–873. [Google Scholar] [CrossRef]
- Yang, J.; Zhou, C.; Yang, S.; Xu, H.; Hu, B. Anomaly detection based on zone partition for security protection of industrial cyber-physical systems. IEEE Trans. Ind. Electron. 2017, 65, 4257–4267. [Google Scholar] [CrossRef]
- Xu, S.; Qian, Y.; Hu, R.Q. Data-driven network intelligence for anomaly detection. IEEE Netw. 2019, 33, 88–95. [Google Scholar] [CrossRef]
- Keshk, M.; Sitnikova, E.; Moustafa, N.; Hu, J.; Khalil, I. An integrated framework for privacy-preserving based anomaly detection for cyber-physical systems. IEEE Trans. Sustain. Comput. 2019, 6, 66–79. [Google Scholar] [CrossRef]
- Shi, D.; Guo, Z.; Johansson, K.H.; Shi, L. Causality countermeasures for anomaly detection in cyber-physical systems. IEEE Trans. Autom. Control 2017, 63, 386–401. [Google Scholar] [CrossRef]
- Sufi, F. A new social media-driven cyber threat intelligence. Electronics 2023, 12, 1242. [Google Scholar] [CrossRef]
- Khan, N.F.; Ikram, N.; Saleem, S.; Zafar, S. Cyber-security and risky behaviors in a developing country context: A Pakistani perspective. Secur. J. 2023, 36, 373–405. [Google Scholar] [CrossRef]
- Chae, J.; Lee, S.; Jang, J.; Hong, S.; Park, K.J. A survey and perspective on Industrial Cyber-Physical Systems (ICPS): From ICPS to AI-augmented ICPS. IEEE Trans. Ind.-Cyber-Phys. Syst. 2023, 1, 257–272. [Google Scholar] [CrossRef]
- Pattnaik, N.; Li, S.; Nurse, J.R. Perspectives of non-expert users on cyber security and privacy: An analysis of online discussions on twitter. Comput. Secur. 2023, 125, 103008. [Google Scholar] [CrossRef]
- Boholm, M. Twenty-five years of cyber threats in the news: A study of Swedish newspaper coverage (1995–2019). J. Cybersecur. 2021, 7, tyab016. [Google Scholar] [CrossRef]
- Wu, T.; Ma, W.; Wen, S.; Xia, X.; Paris, C.; Nepal, S.; Xiang, Y. Analysis of trending topics and text-based channels of information delivery in cybersecurity. ACM Trans. Internet Technol. (TOIT) 2021, 22, 1–27. [Google Scholar] [CrossRef]
- Quinlan, M.; Ceross, A.; Simpson, A. The efficacy potential of cyber security advice as presented in news articles. Interact. Comput. 2025, 37, 30–48. [Google Scholar] [CrossRef]
- Zhang, K.; Shi, Y.; Karnouskos, S.; Sauter, T.; Fang, H.; Colombo, A.W. Advancements in industrial cyber-physical systems: An overview and perspectives. IEEE Trans. Ind. Inform. 2022, 19, 716–729. [Google Scholar] [CrossRef]
- Al-Hawawreh, M.; Den Hartog, F.; Sitnikova, E. Targeted ransomware: A new cyber threat to edge system of brownfield industrial Internet of Things. IEEE Internet Things J. 2019, 6, 7137–7151. [Google Scholar] [CrossRef]
- Atat, R.; Liu, L.; Wu, J.; Li, G.; Ye, C.; Yang, Y. Big data meet cyber-physical systems: A panoramic survey. IEEE Access 2018, 6, 73603–73636. [Google Scholar] [CrossRef]
- Jacobs, N.; Hossain-McKenzie, S.; Sun, S.; Payne, E.; Summers, A.; Al-Homoud, L.; Layton, A.; Davis, K.; Goes, C. Leveraging graph clustering techniques for cyber-physical system analysis to enhance disturbance characterisation. IET Cyber-Phys. Syst. Theory Appl. 2024, 9, 392–406. [Google Scholar] [CrossRef]
- Wang, G.; Liu, P.; Huang, J.; Bin, H.; Wang, X.; Zhu, H. KnowCTI: Knowledge-based cyber threat intelligence entity and relation extraction. Comput. Secur. 2024, 141, 103824. [Google Scholar] [CrossRef]
- Sufi, F. A New Time Series Dataset for Cyber-Threat Correlation, Regression and Neural-Network-Based Forecasting. Information 2024, 15, 199. [Google Scholar] [CrossRef]
- Ren, H.; Xu, B.; Wang, Y.; Yi, C.; Huang, C.; Kou, X.; Xing, T.; Yang, M.; Tong, J.; Zhang, Q. Time-series anomaly detection service at microsoft. In Proceedings of the 25th ACM SIGKDD International Conference on Knowledge Discovery & Data Mining, Anchorage, AK, USA, 4–8 August 2019; pp. 3009–3017. [Google Scholar]
- Sufi, F. An innovative GPT-based open-source intelligence using historical cyber incident reports. Nat. Lang. Process. J. 2024, 7, 100074. [Google Scholar] [CrossRef]
- Levy, K.P. Striking a Balance: Sof’s Role in Balancing Lethality with Other Instruments of National Power. Ph.D. Thesis, Naval Postgraduate School, Monterey, CA, USA, 2021. [Google Scholar]
- Venkatesh Sharma, K.; Ayiluri, P.R.; Betala, R.; Jagdish Kumar, P.; Shirisha Reddy, K. Enhancing query relevance: Leveraging SBERT and cosine similarity for optimal information retrieval. Int. J. Speech Technol. 2024, 27, 753–763. [Google Scholar] [CrossRef]
- Yang, M.; Cai, Y.; Zheng, W. CSPG: Crossing Sparse Proximity Graphs for Approximate Nearest Neighbor Search. Adv. Neural Inf. Process. Syst. 2024, 37, 103076–103100. [Google Scholar]
- Sufi, F. Social media analytics on Russia–Ukraine cyber war with natural language processing: Perspectives and challenges. Information 2023, 14, 485. [Google Scholar] [CrossRef]
- Bertl, M. News analysis for the detection of cyber security issues in digital healthcare: A text mining approach to uncover actors, attack methods and technologies for cyber defense. Young Inf. Sci. 2019, 4, 1–15. [Google Scholar]
- Ellinitakis, R.A.; Fysarakis, K.; Bountakas, P.; Spanoudakis, G. Uncovering Hidden Threats: Automated, Machine Learning-based Discovery & Extraction of Cyber Threat Intelligence from Online Sources. In Proceedings of the 2024 IEEE International Conference on Cyber Security and Resilience (CSR), London, UK, 2–4 September 2024; pp. 1–6. [Google Scholar]
- Zaidi, T.; Garai, S. Emerging Trends in Cybersecurity: A Holistic View on Current Threats, Assessing Solutions, and Pioneering New Frontiers. Blockchain Healthc. Today 2024, 7. [Google Scholar] [CrossRef]
- Yang, J.; Xu, H.; Mirzoyan, S.; Chen, T.; Liu, Z.; Liu, Z.; Ju, W.; Liu, L.; Xiao, Z.; Zhang, M.; et al. Poisoning medical knowledge using large language models. Nat. Mach. Intell. 2024, 6, 1156–1168. [Google Scholar] [CrossRef]
- Luo, J.; Luo, X.; Chen, X.; Xiao, Z.; Ju, W.; Zhang, M. SemiEvol: Semi-supervised Fine-tuning for LLM Adaptation. arXiv 2024, arXiv:2410.14745. [Google Scholar]
- Zheng, K.; Liang, S.; Yang, J.; Feng, B.; Liu, Z.; Ju, W.; Xiao, Z.; Zhang, M. SMI-Editor: Edit-based SMILES Language Model with Fragment-level Supervision. arXiv 2024, arXiv:2412.05569. [Google Scholar]
- Zheng, K.; Yang, J.; Liang, S.; Feng, B.; Liu, Z.; Ju, W.; Xiao, Z.; Zhang, M. ExLM: Rethinking the Impact of [MASK] Tokens in Masked Language Models. arXiv 2025, arXiv:2501.13397. [Google Scholar]
Figure 1.
Conceptual diagram of the proposed cyber threat analysis system using GPT-based semantic classification, knowledge graph construction, clustering, regression analysis, and anomaly detection.
Figure 1.
Conceptual diagram of the proposed cyber threat analysis system using GPT-based semantic classification, knowledge graph construction, clustering, regression analysis, and anomaly detection.
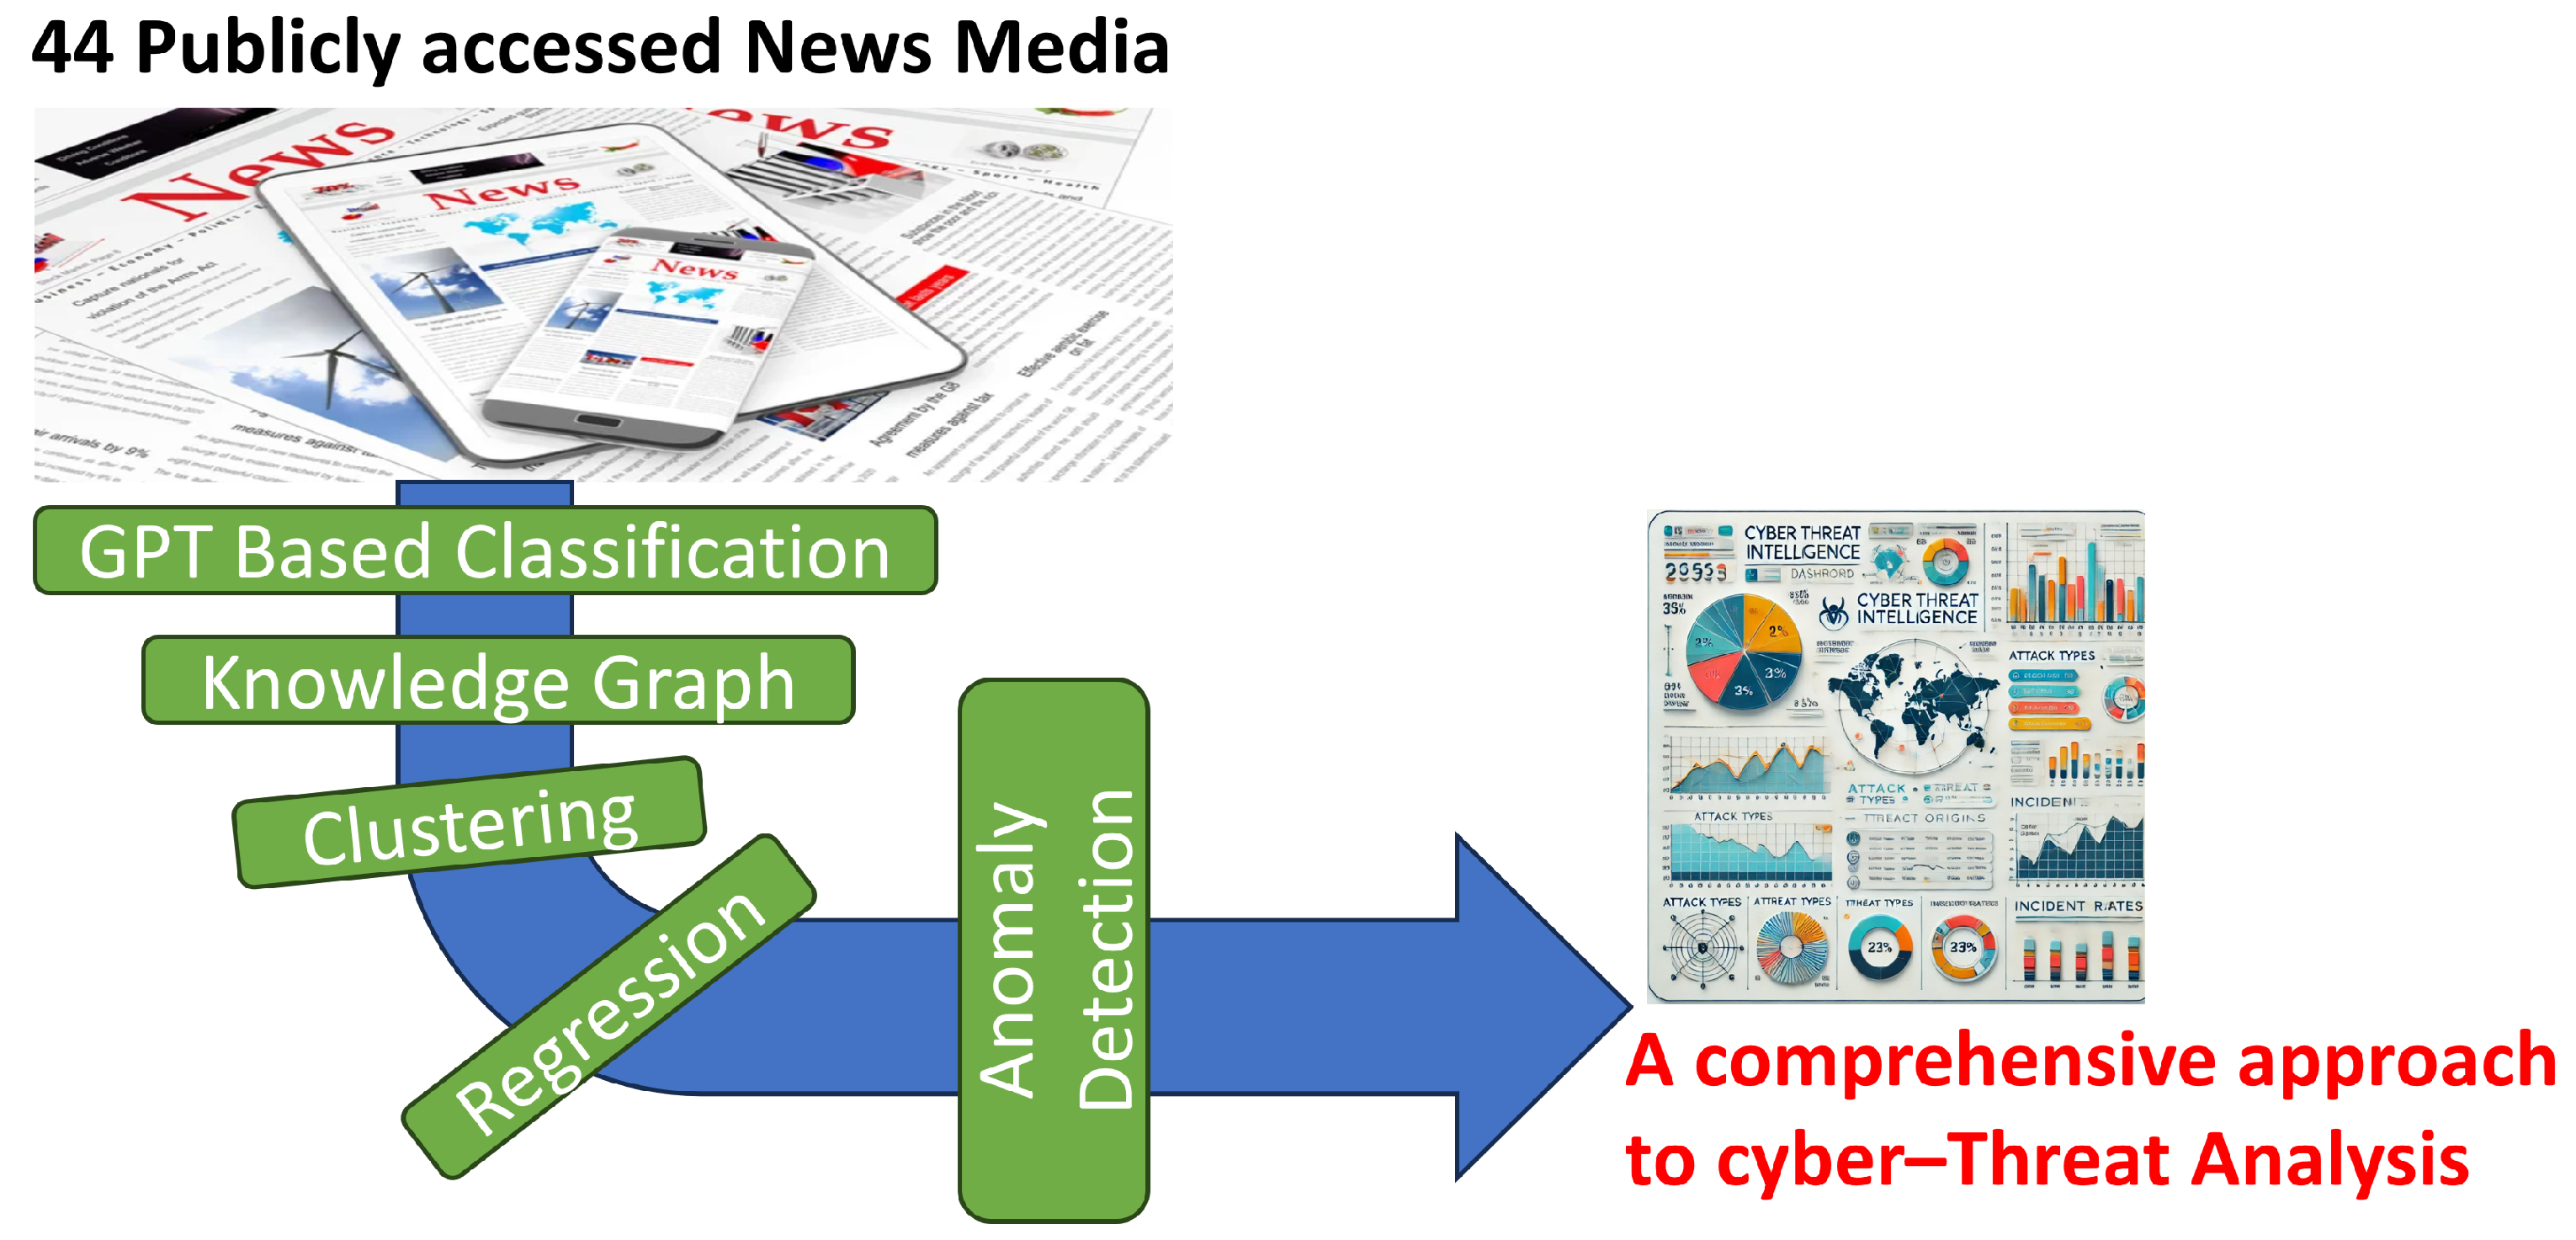
Figure 2.
Architecture of the cyber analytics system.
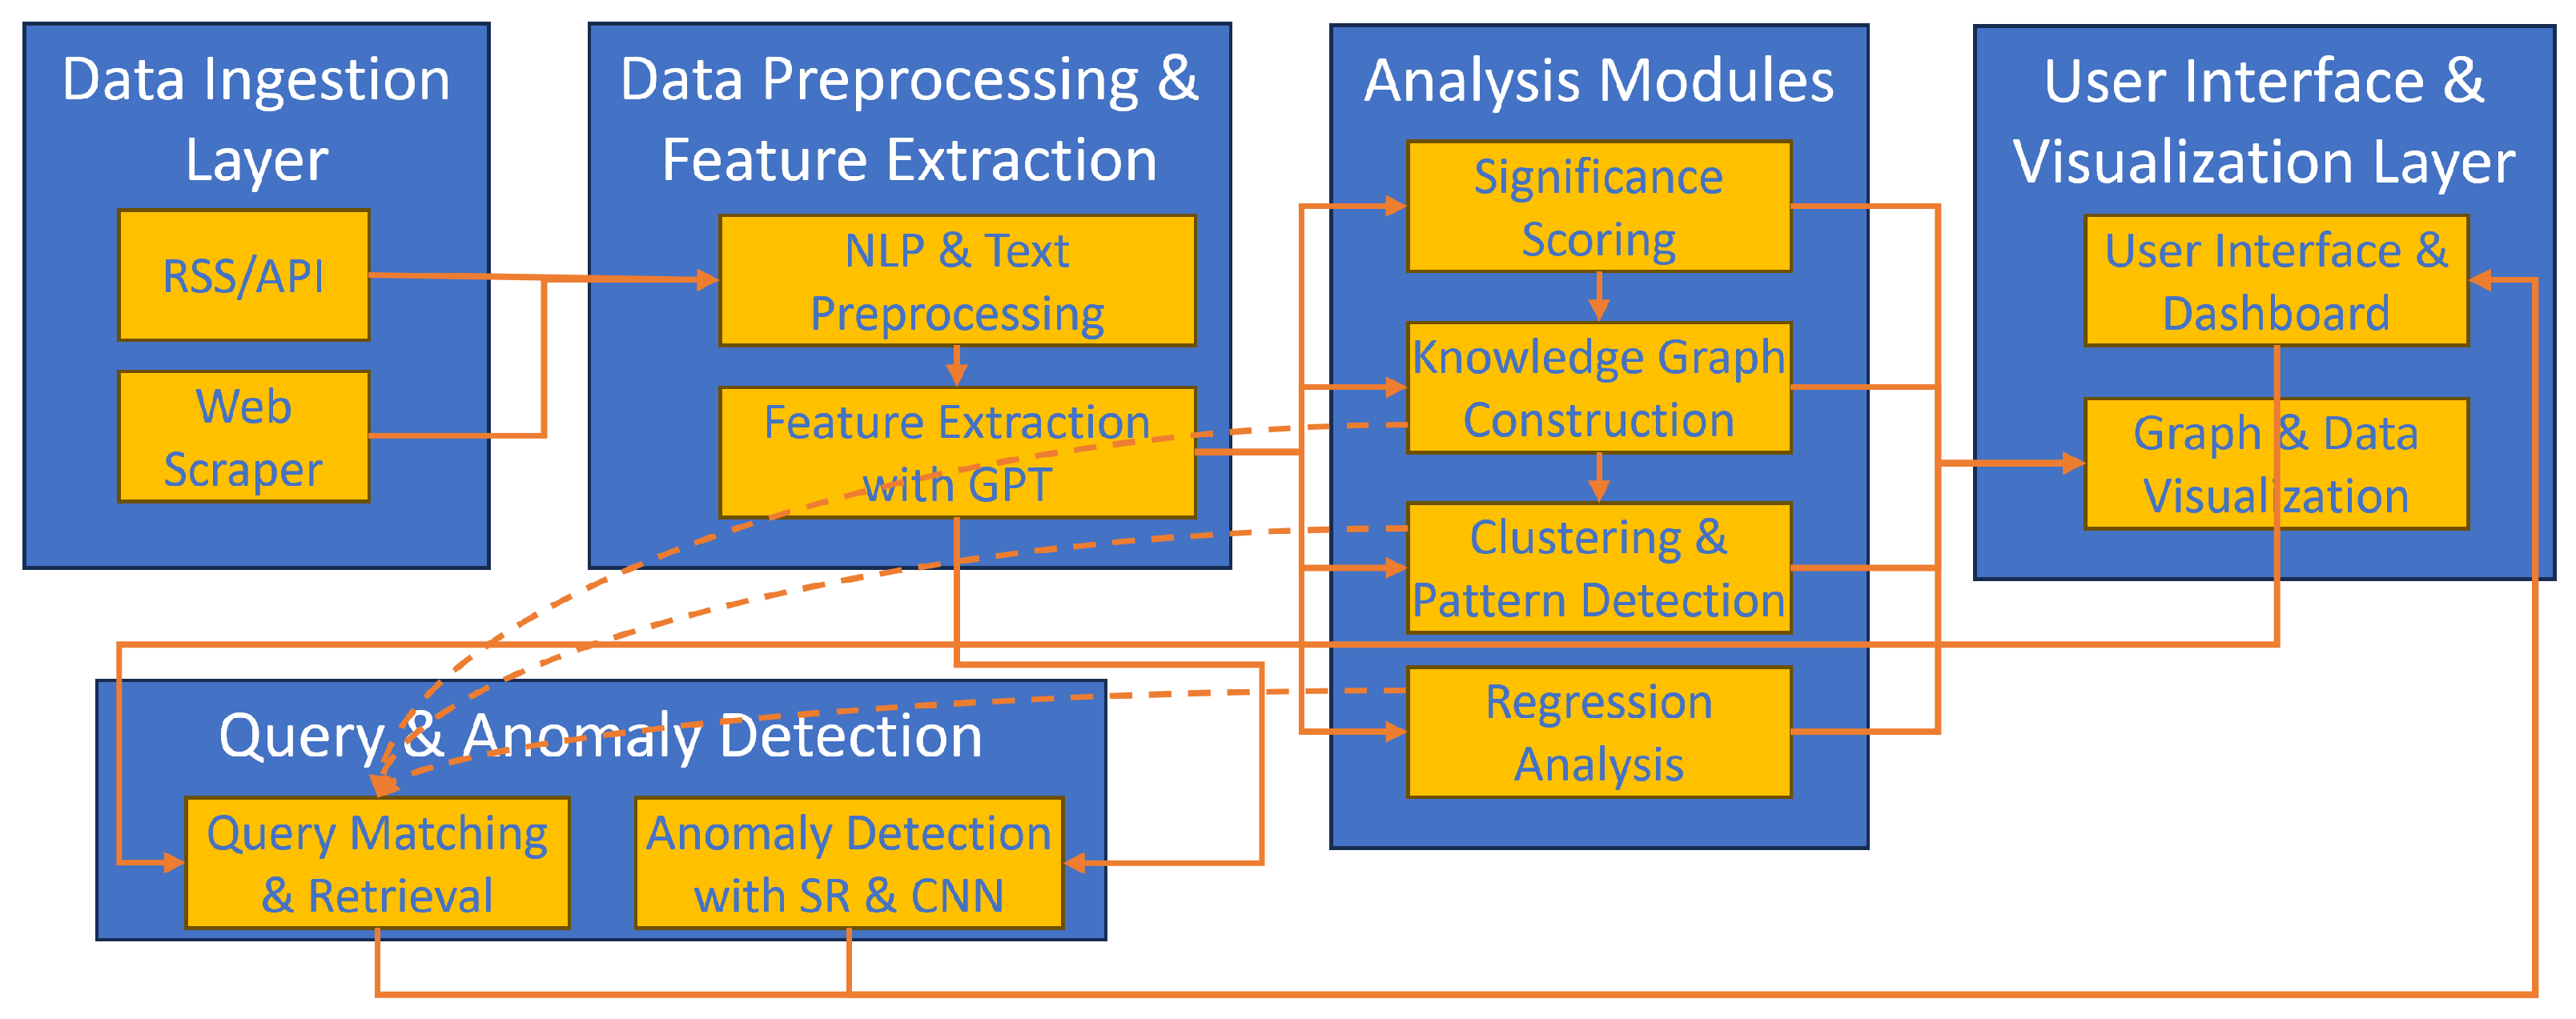
Figure 3.
The workflow diagram of the overall data ingestion, preparation/feature extraction, storage, analysis, and visualization.
Figure 3.
The workflow diagram of the overall data ingestion, preparation/feature extraction, storage, analysis, and visualization.
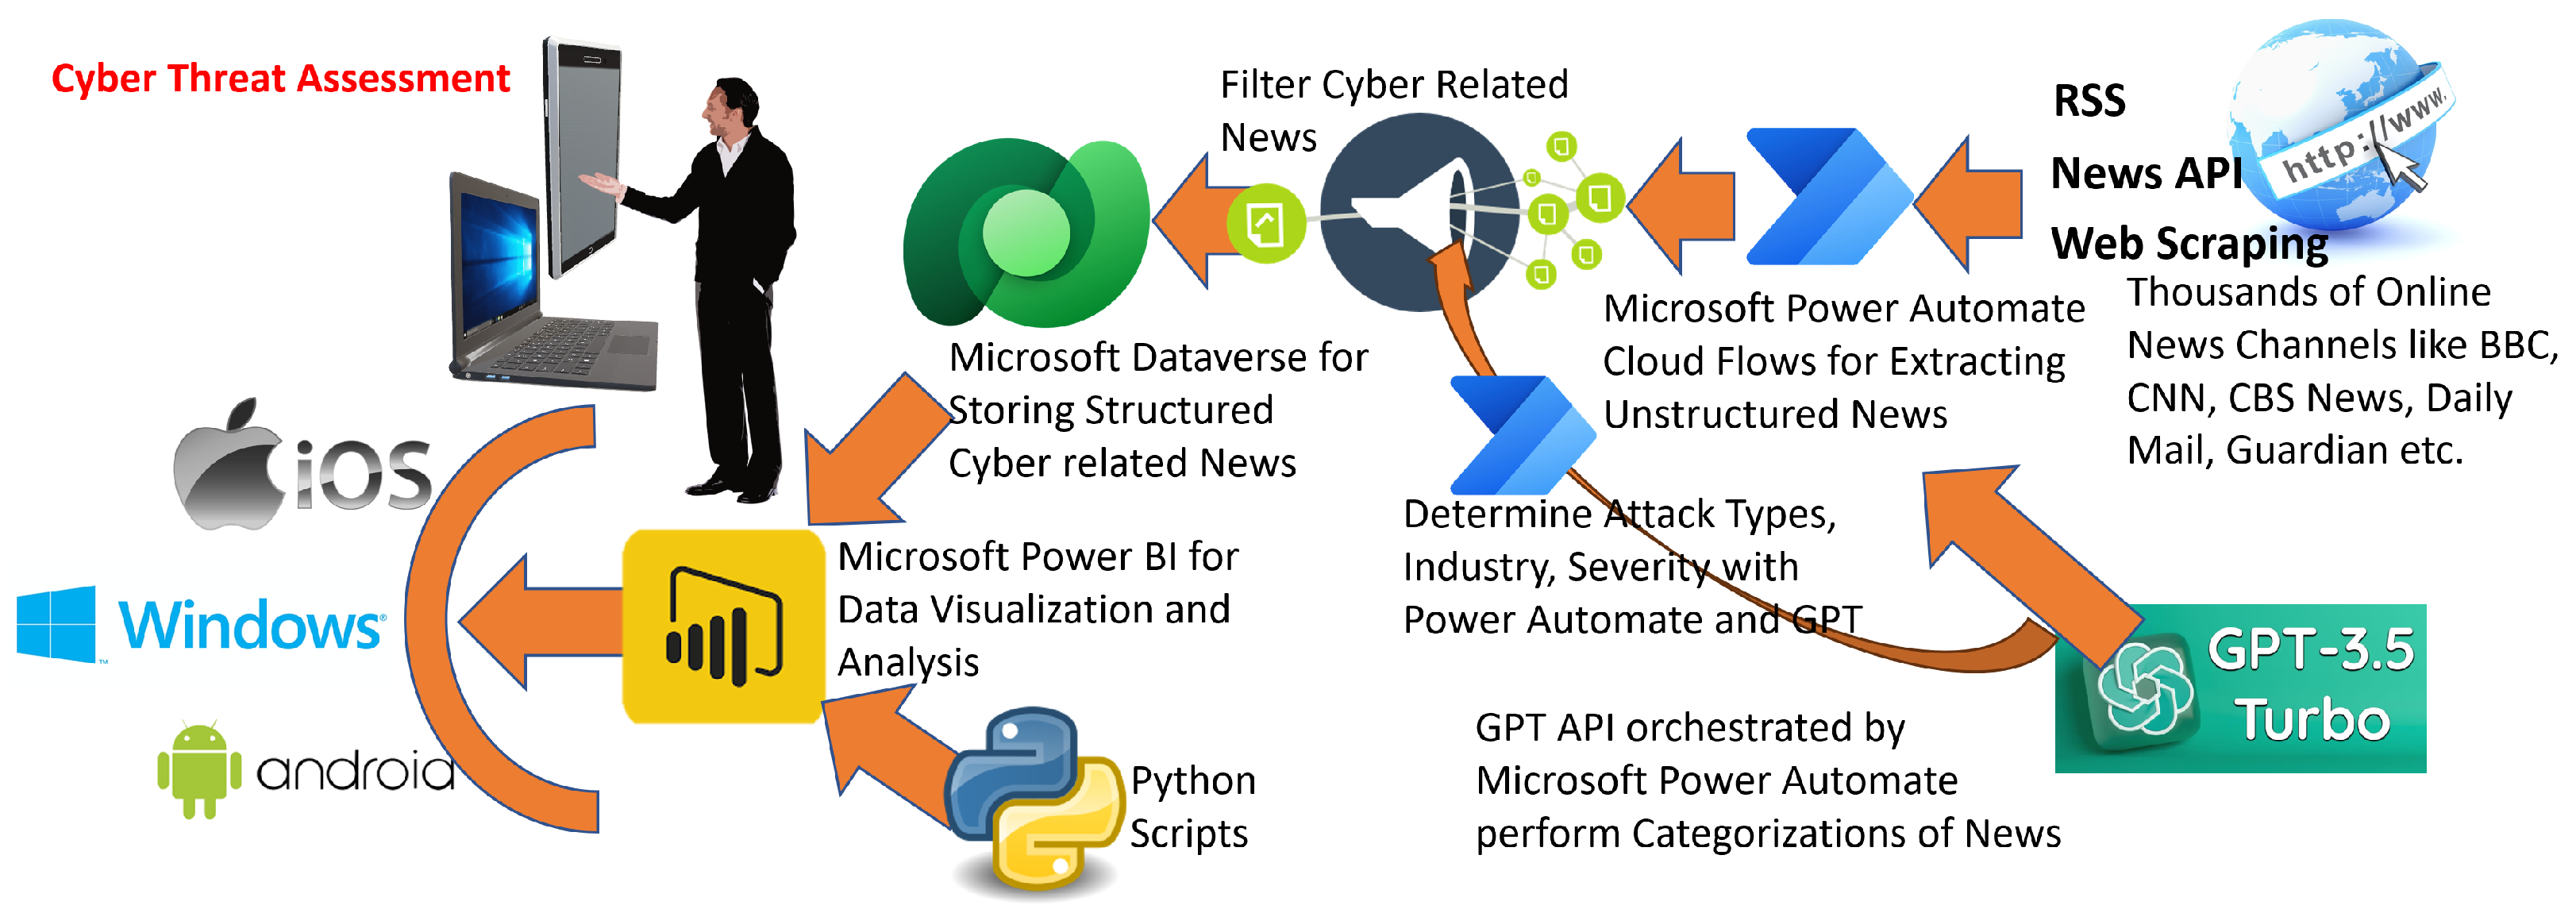
Figure 4.
Unstructured news reports transformed into structured cyber intelligence and presented with geospatial information.
Figure 4.
Unstructured news reports transformed into structured cyber intelligence and presented with geospatial information.
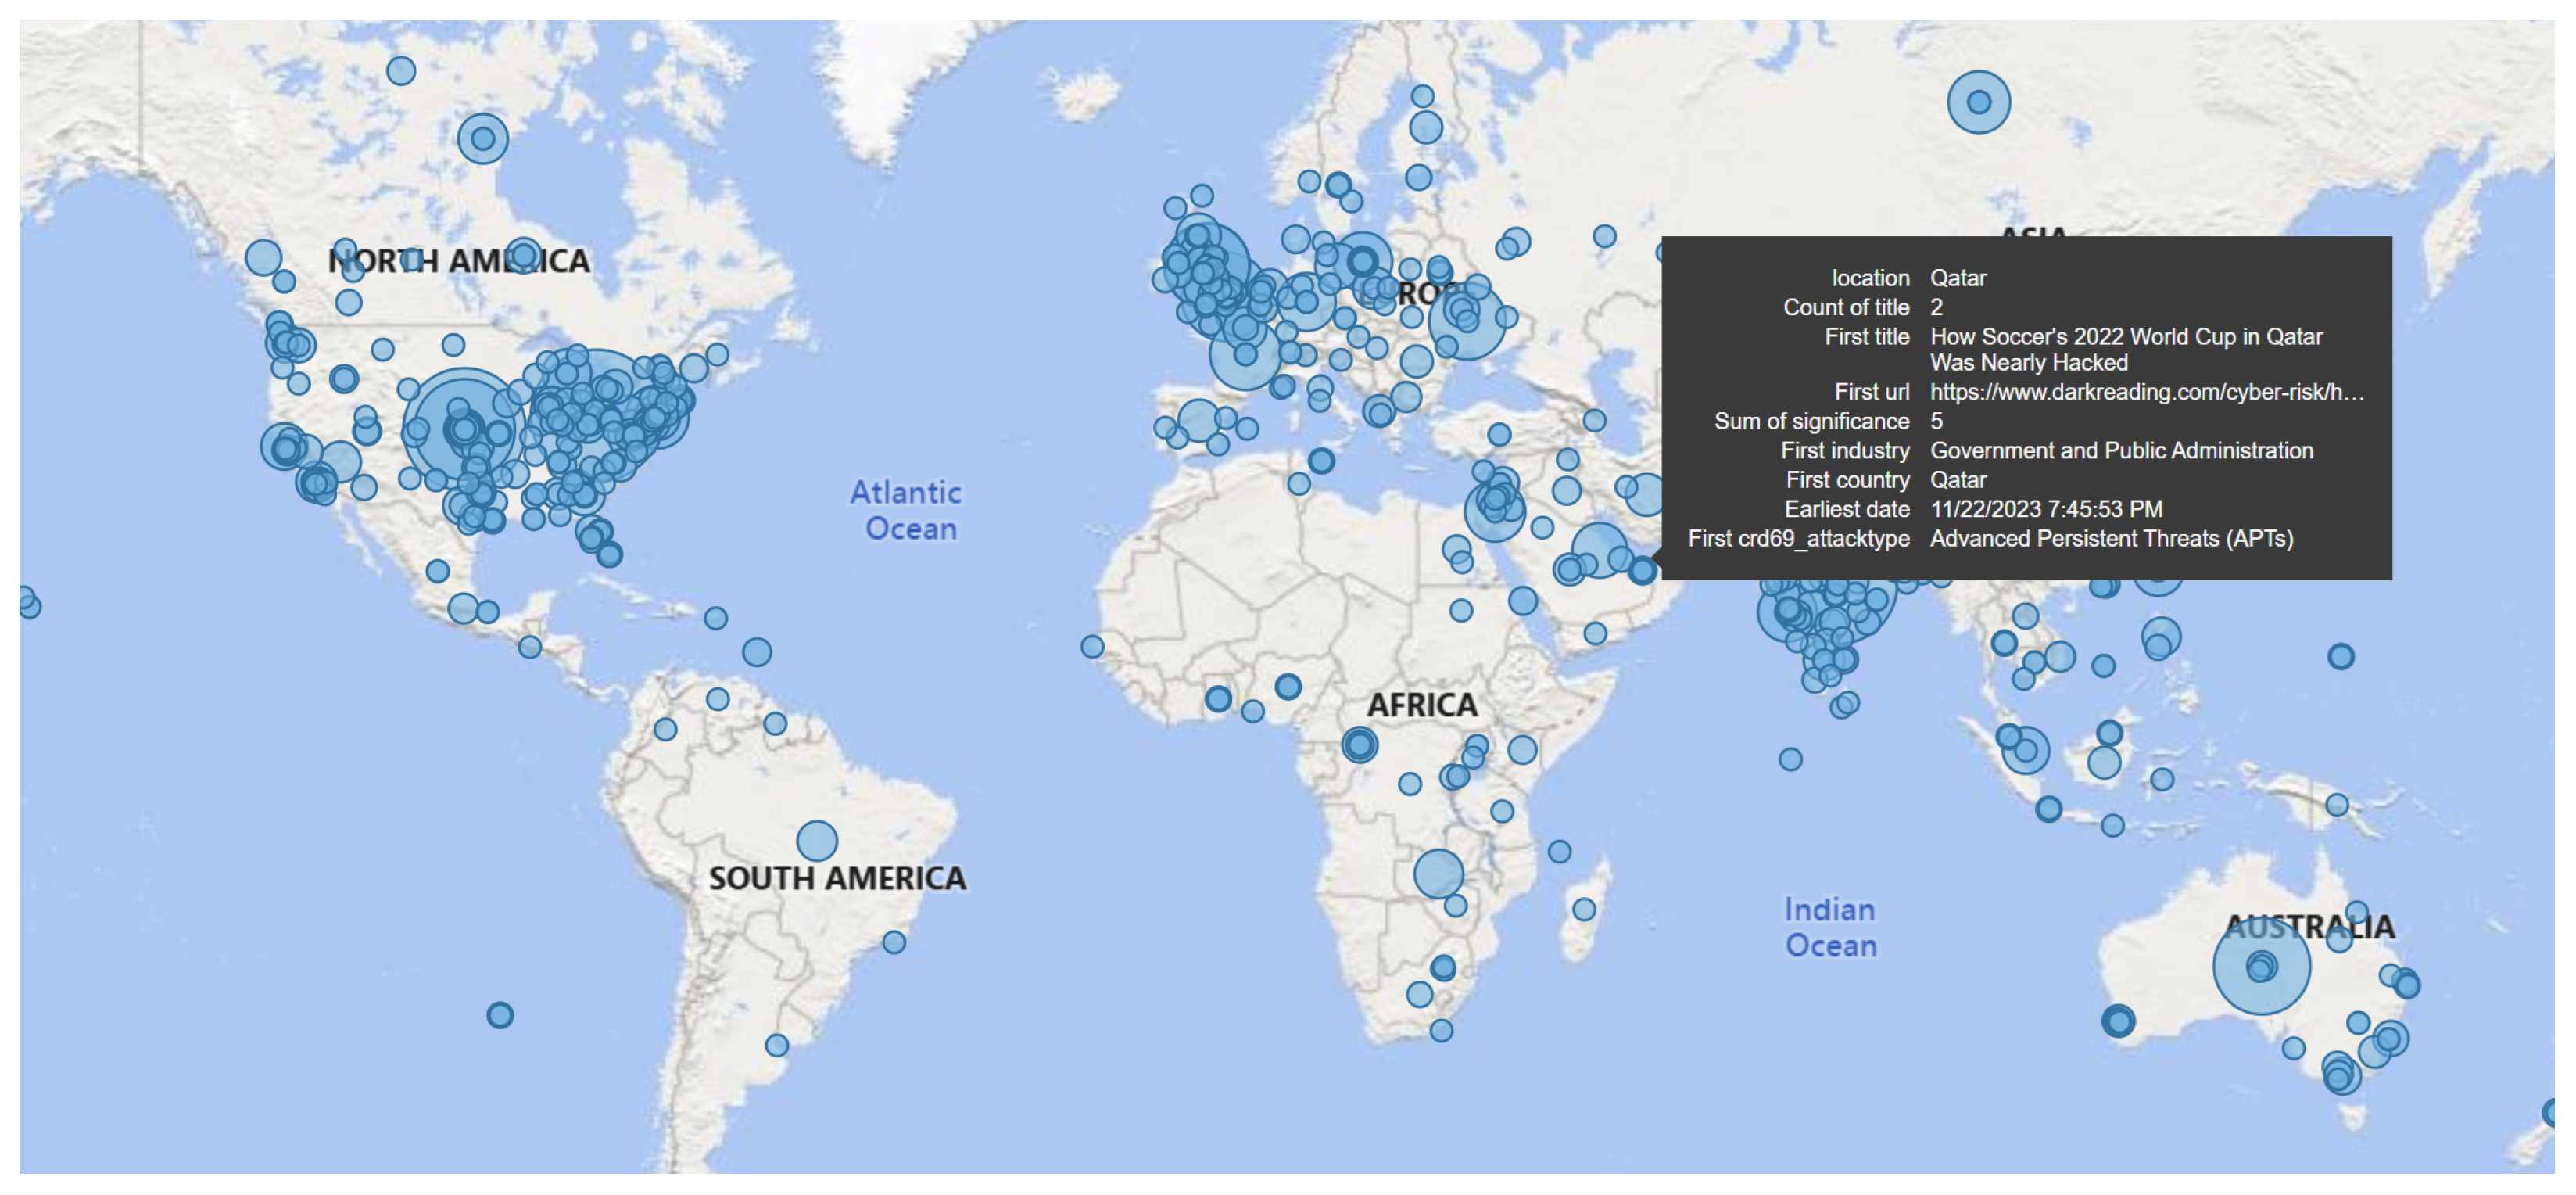
Figure 5.
Knowledge graph showcasing the top 4 most attacked industries (along with the corresponding attack types) from 1 March 2024 to 19 March 2024.
Figure 5.
Knowledge graph showcasing the top 4 most attacked industries (along with the corresponding attack types) from 1 March 2024 to 19 March 2024.

Figure 6.
Knowledge graph showcasing the top 4 most attack types (along with the corresponding attack industries) from 1 March 2024 to 19 March 2024.
Figure 6.
Knowledge graph showcasing the top 4 most attack types (along with the corresponding attack industries) from 1 March 2024 to 19 March 2024.
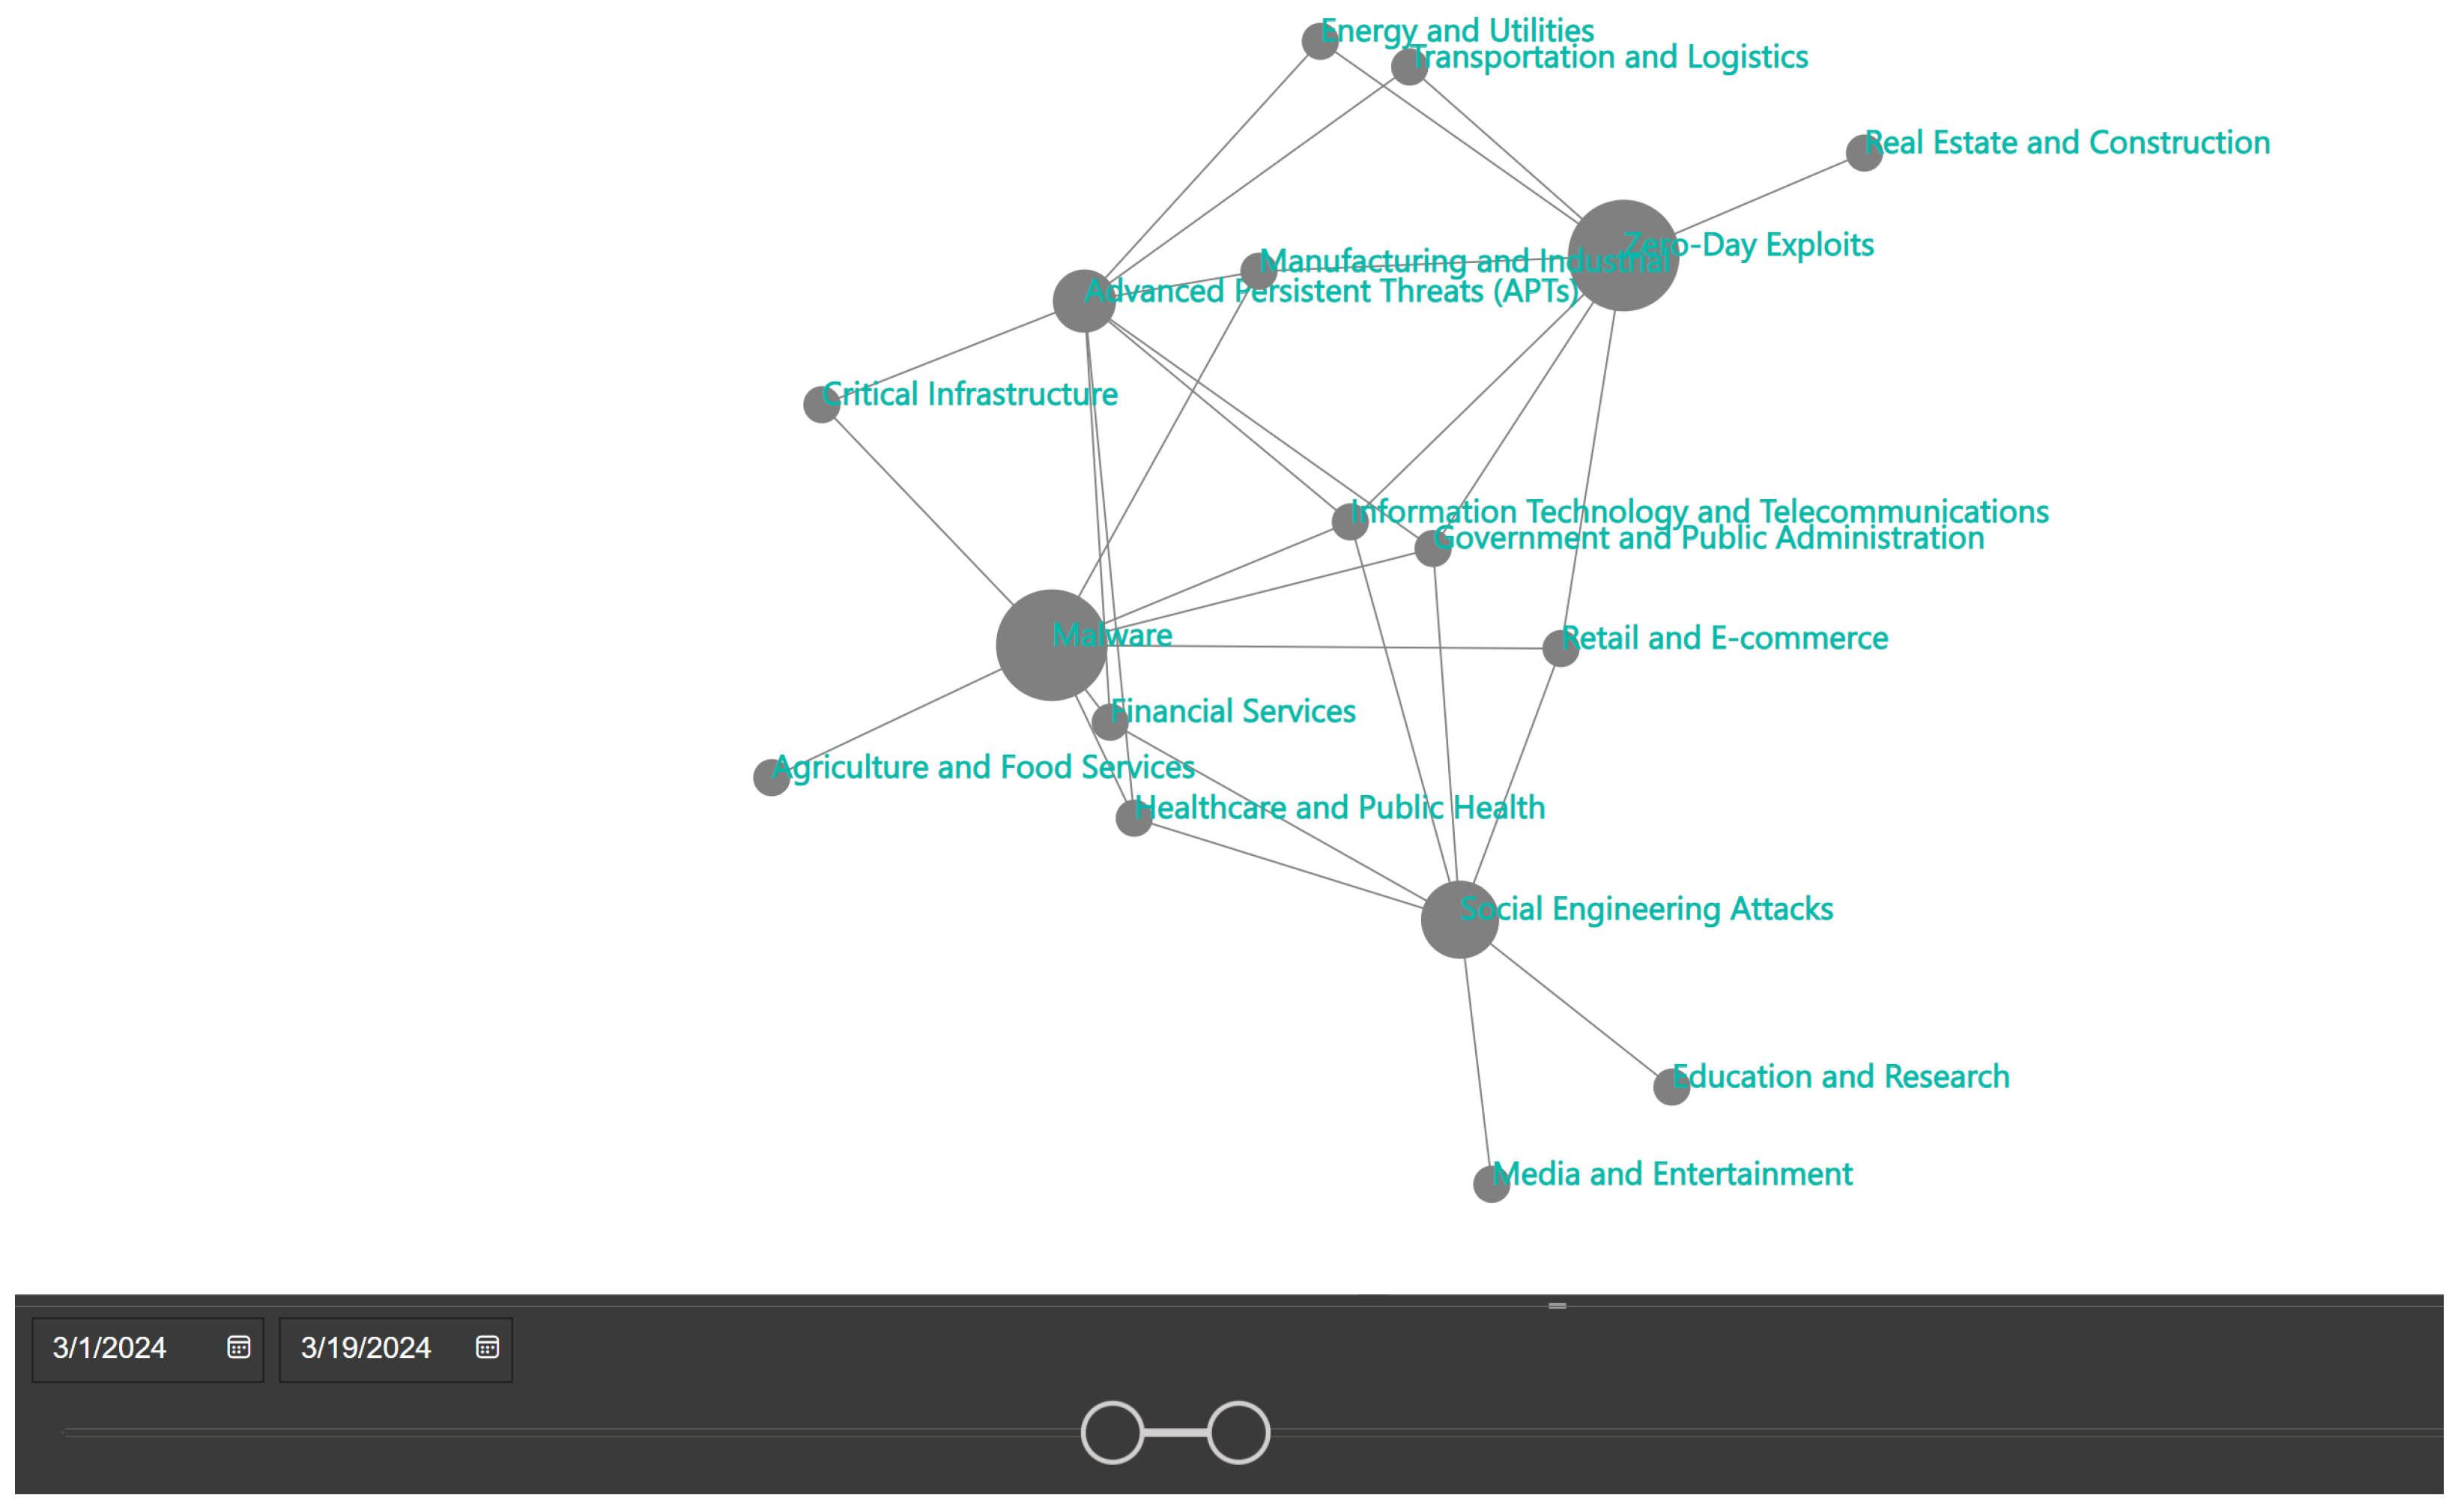
Figure 7.
Most influential industries responsible for more significant cyber attacks identified with regression-based cyber analytics.
Figure 7.
Most influential industries responsible for more significant cyber attacks identified with regression-based cyber analytics.
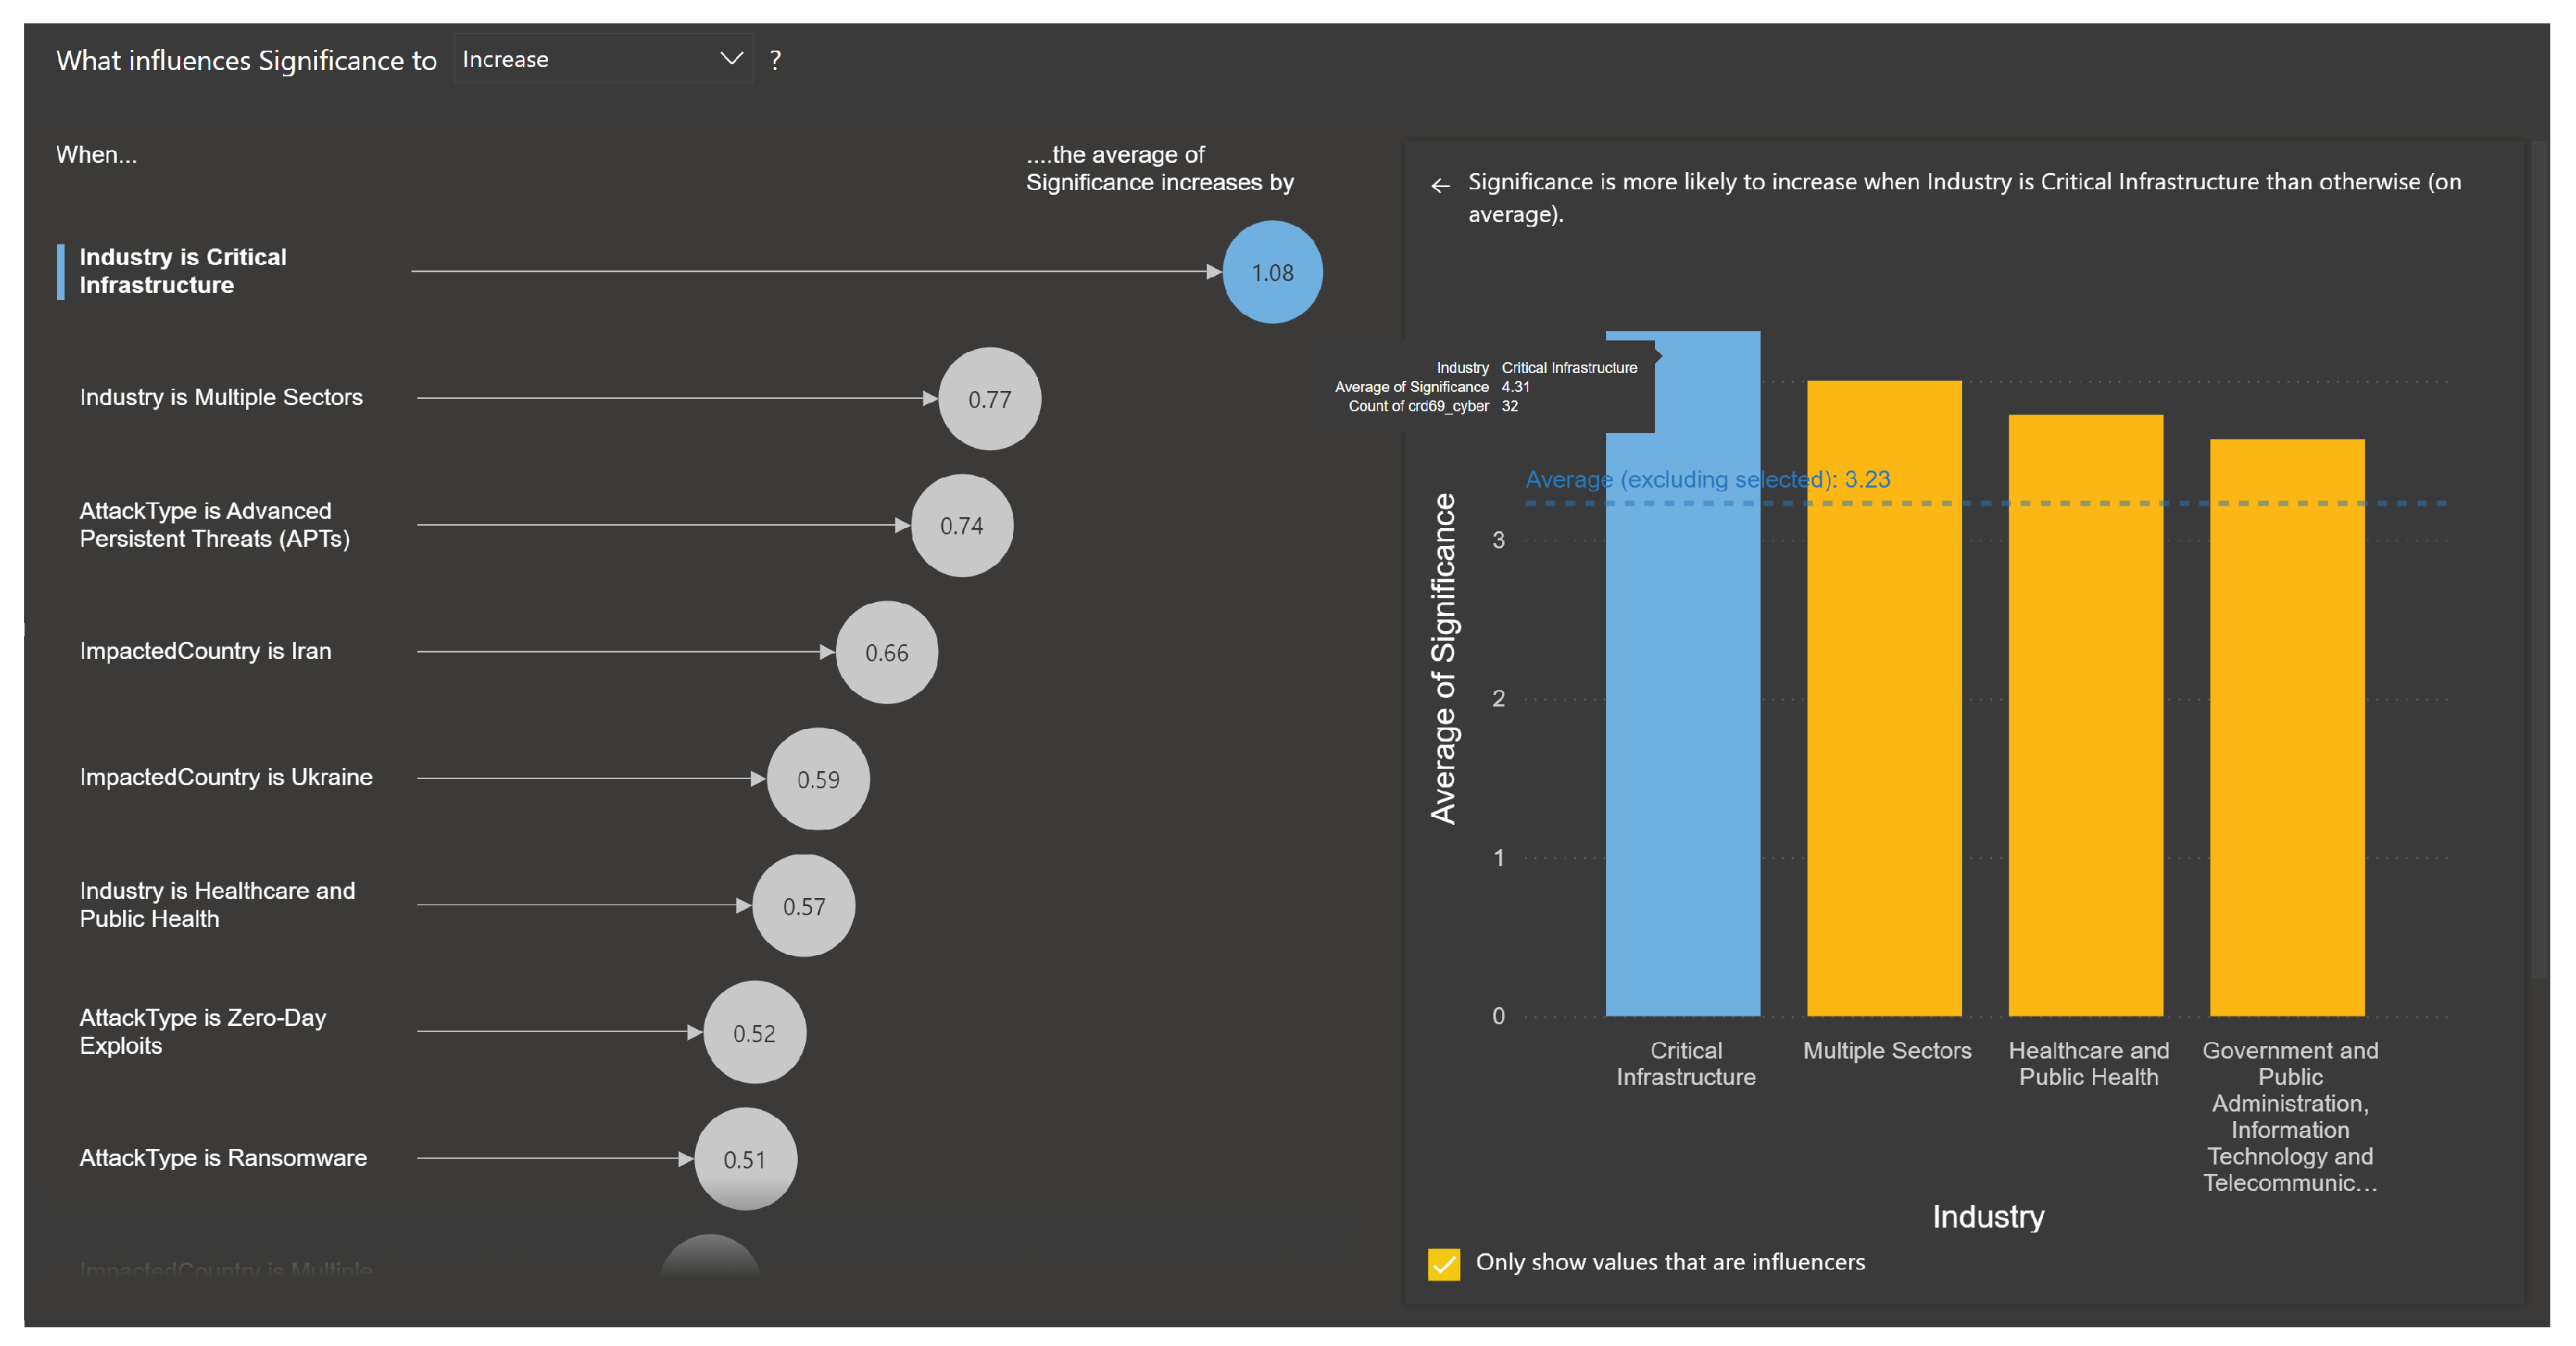
Figure 8.
Most influential attack types responsible for more significant cyber attacks identified with regression-based cyber analytics.
Figure 8.
Most influential attack types responsible for more significant cyber attacks identified with regression-based cyber analytics.
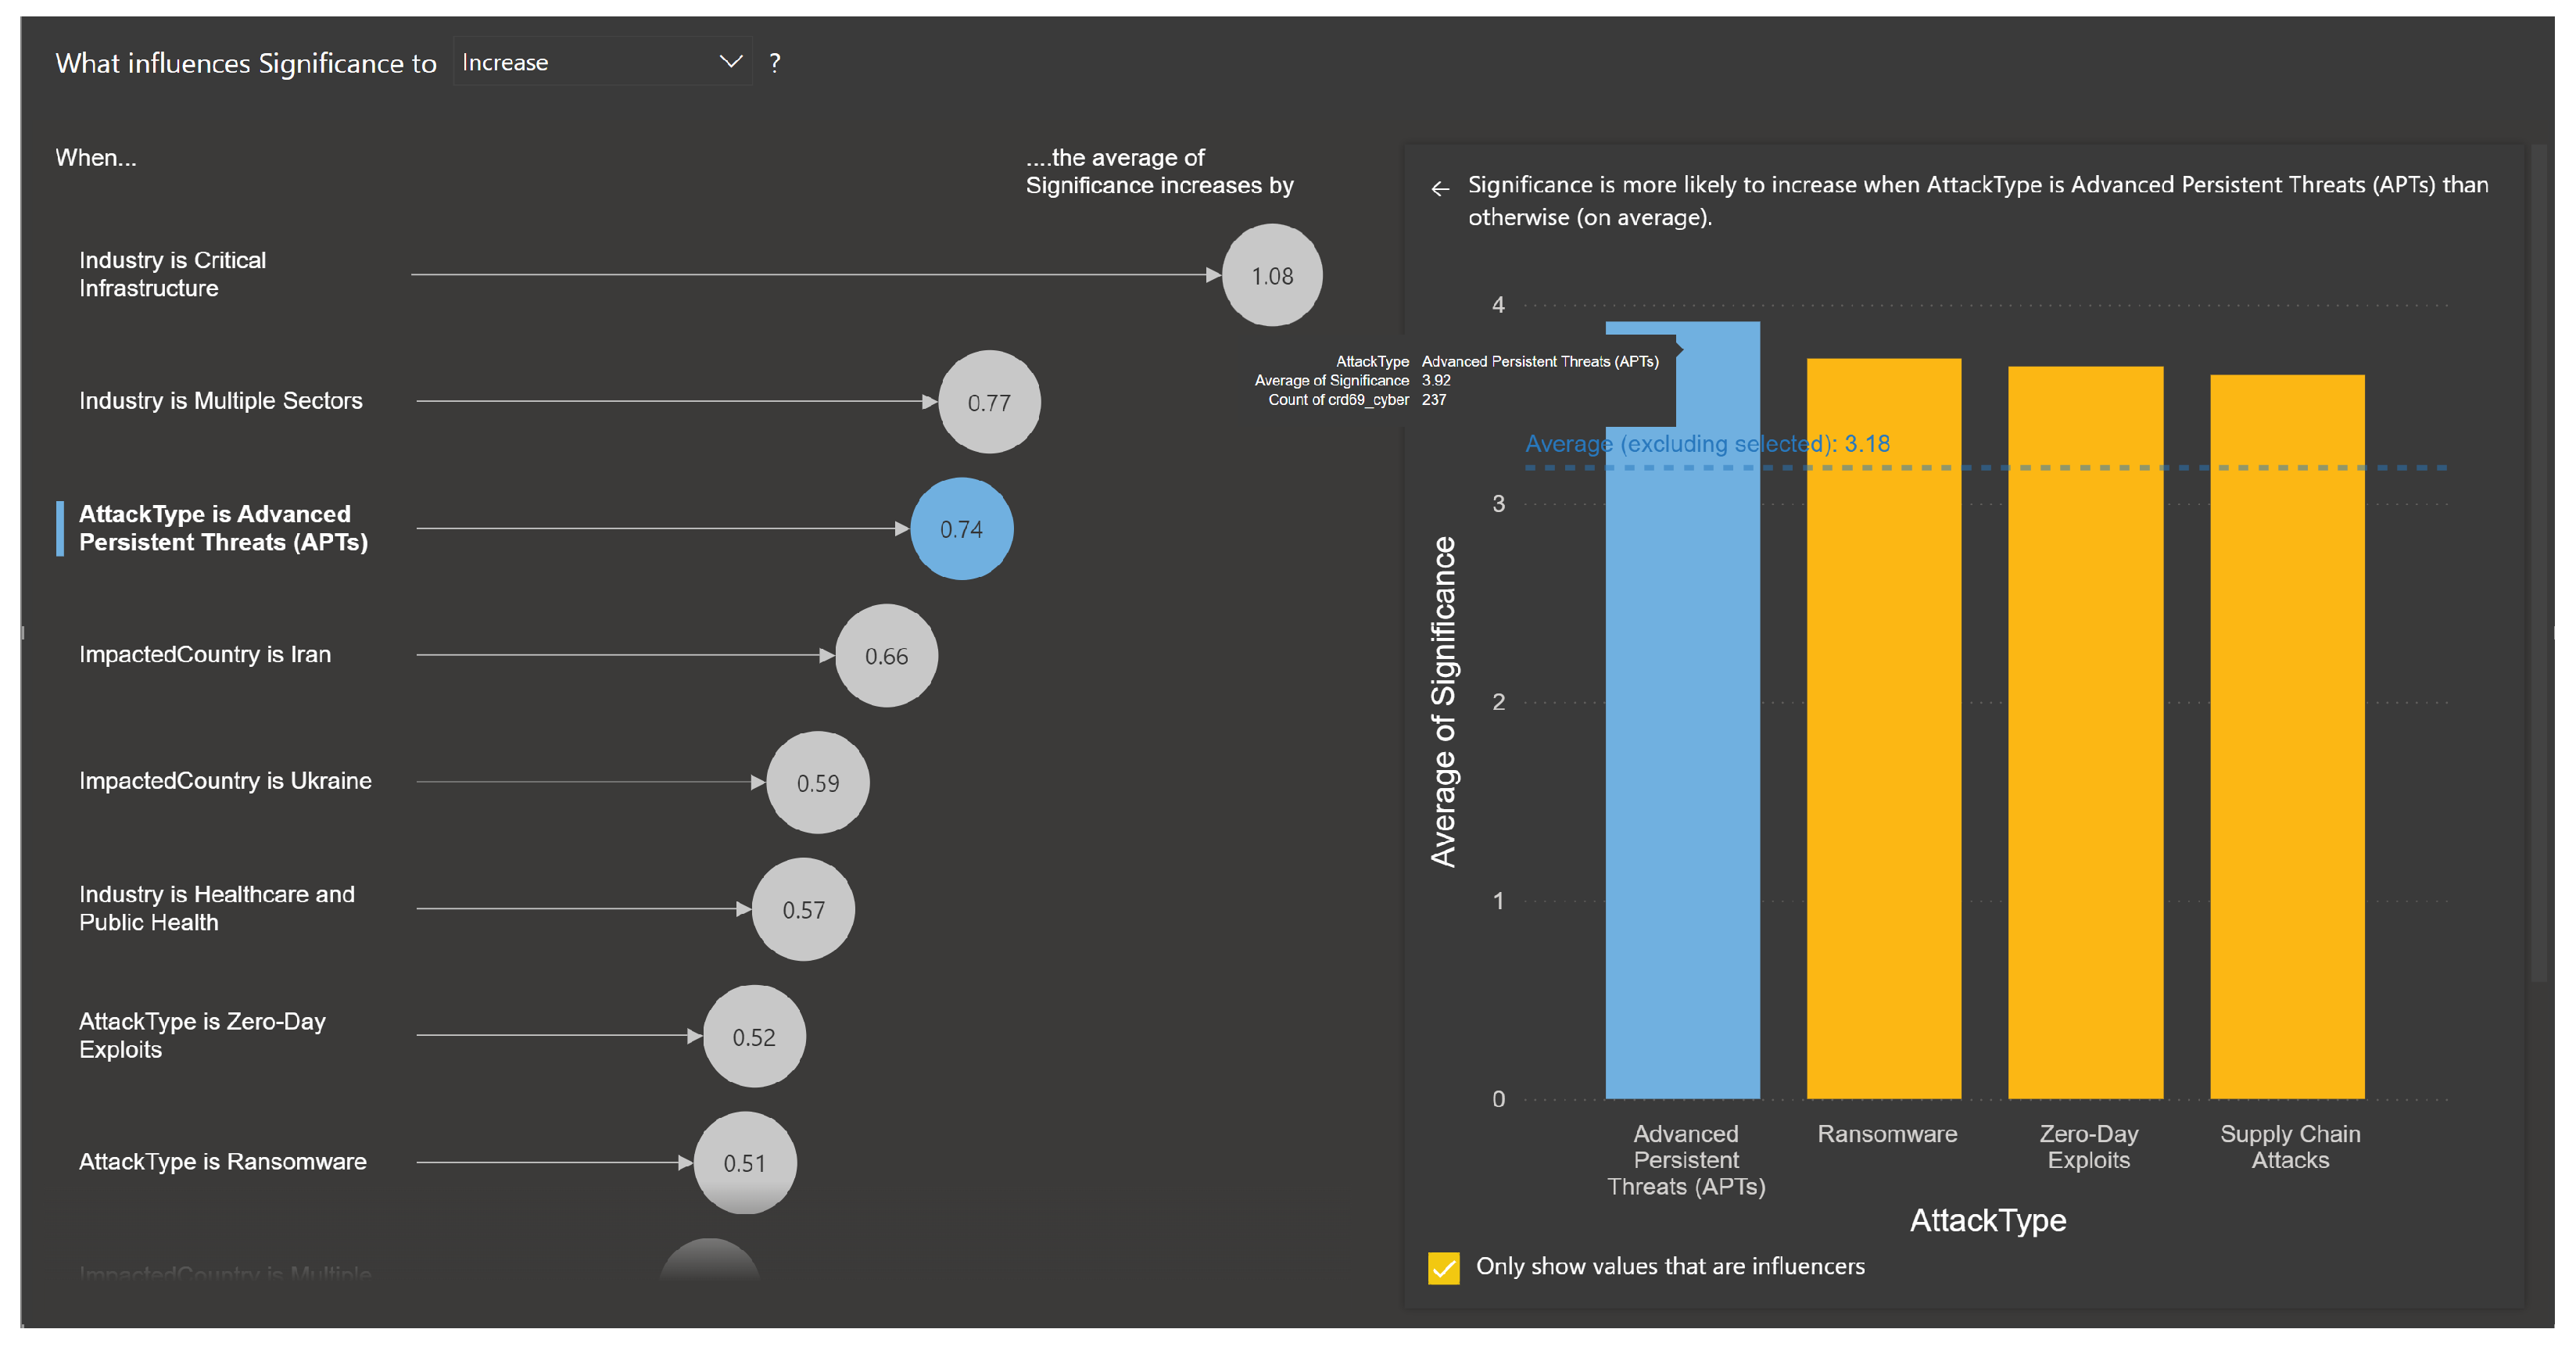
Figure 9.
Most influential countries responsible for more significant cyber attacks identified with regression-based cyber analytics.
Figure 9.
Most influential countries responsible for more significant cyber attacks identified with regression-based cyber analytics.
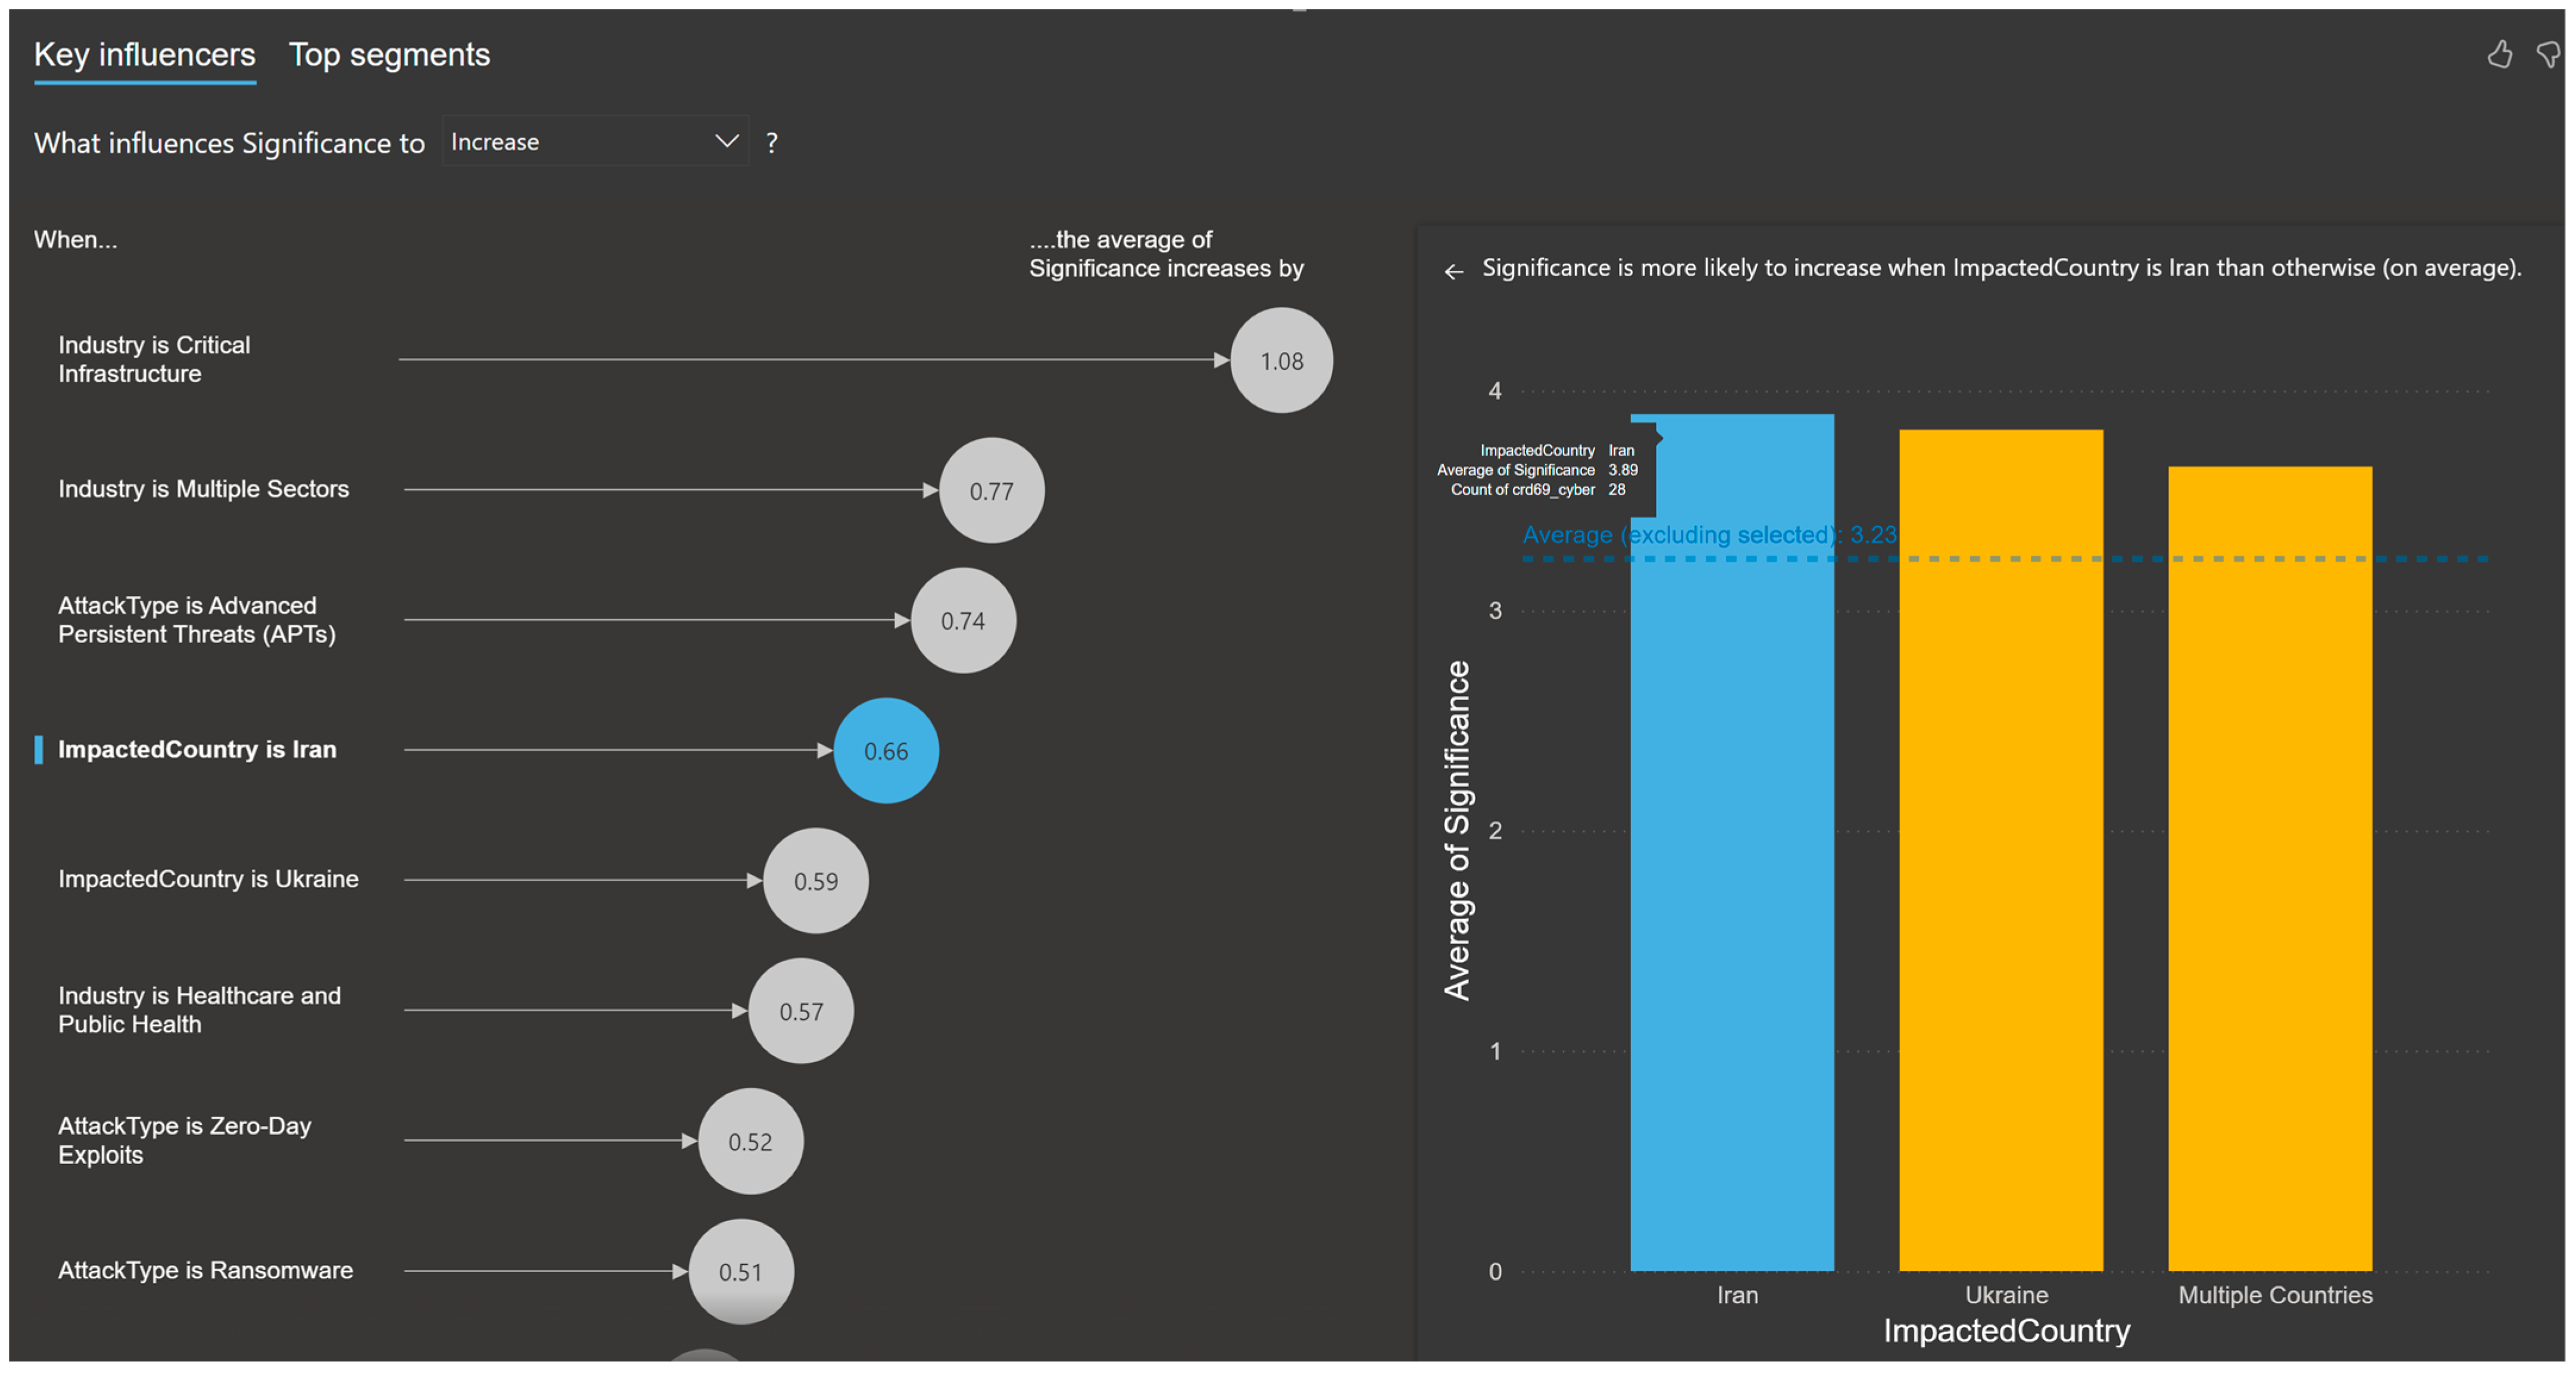
Figure 10.
Five unique segments/clusters identified between February 2024 and March 2024.
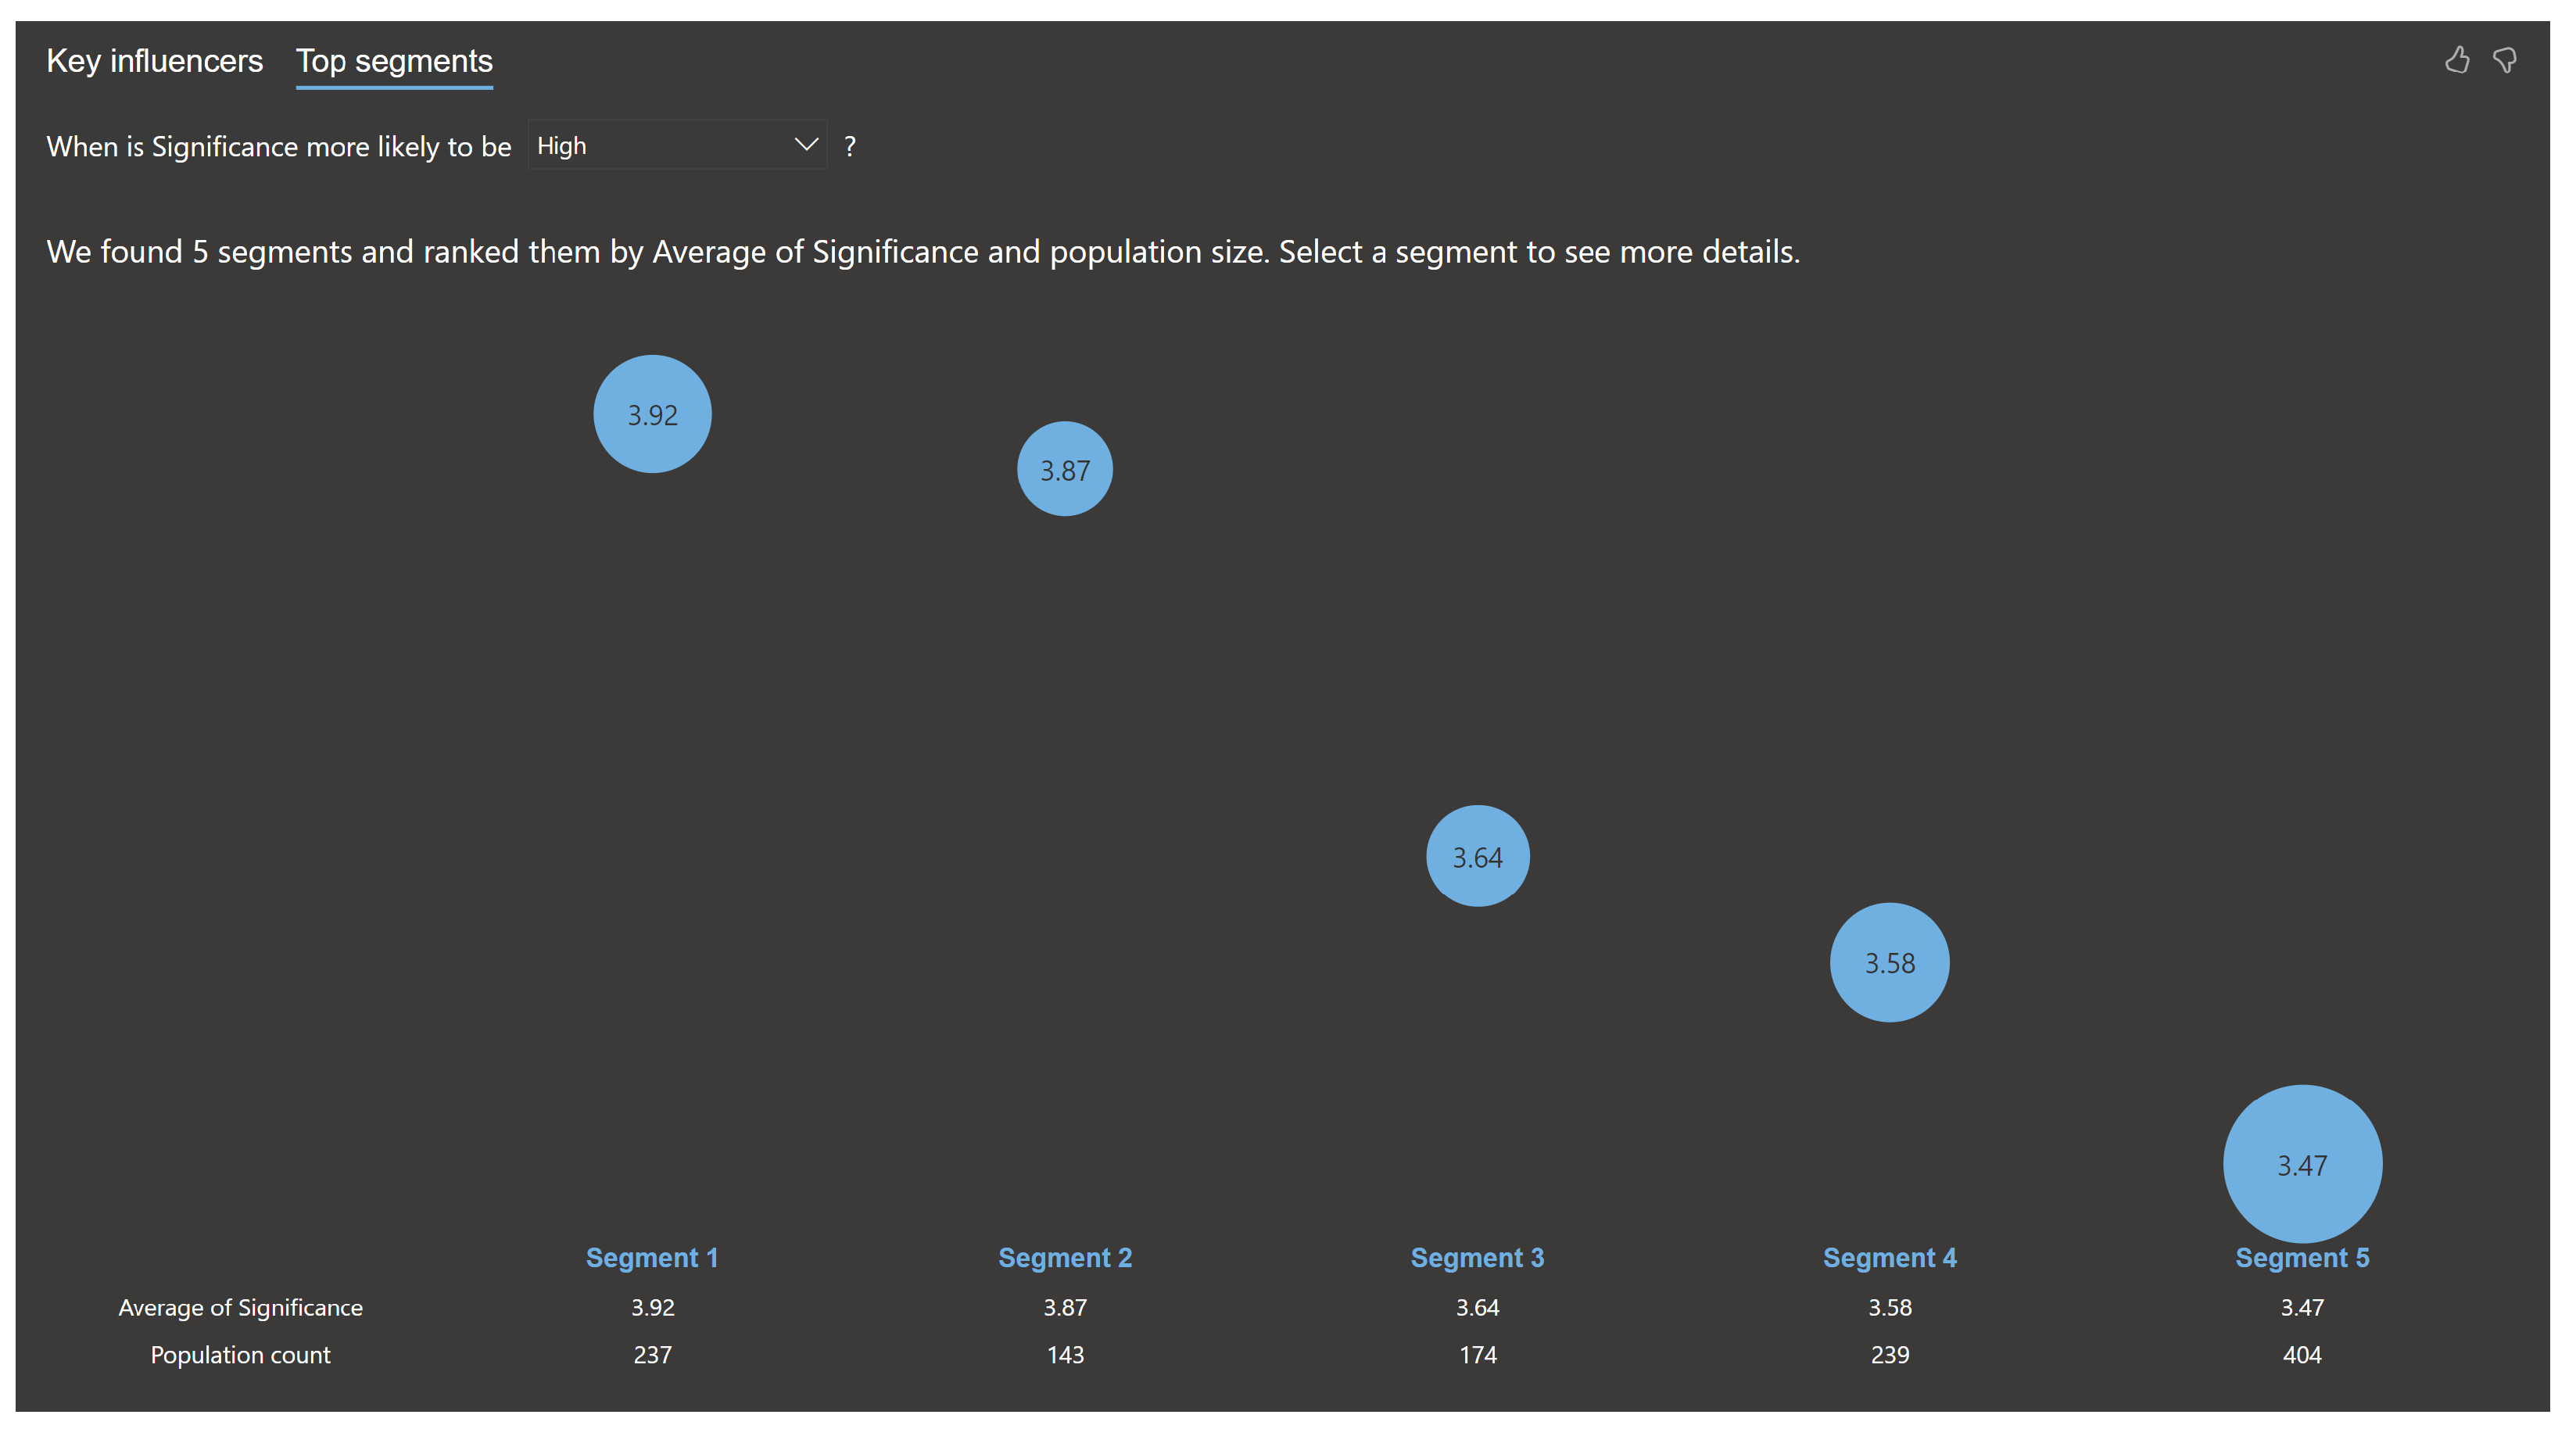
Figure 11.
Anomaly detection applied on time-series cyber-related events from 25 September 2024 to 25 November 2024.
Figure 11.
Anomaly detection applied on time-series cyber-related events from 25 September 2024 to 25 November 2024.
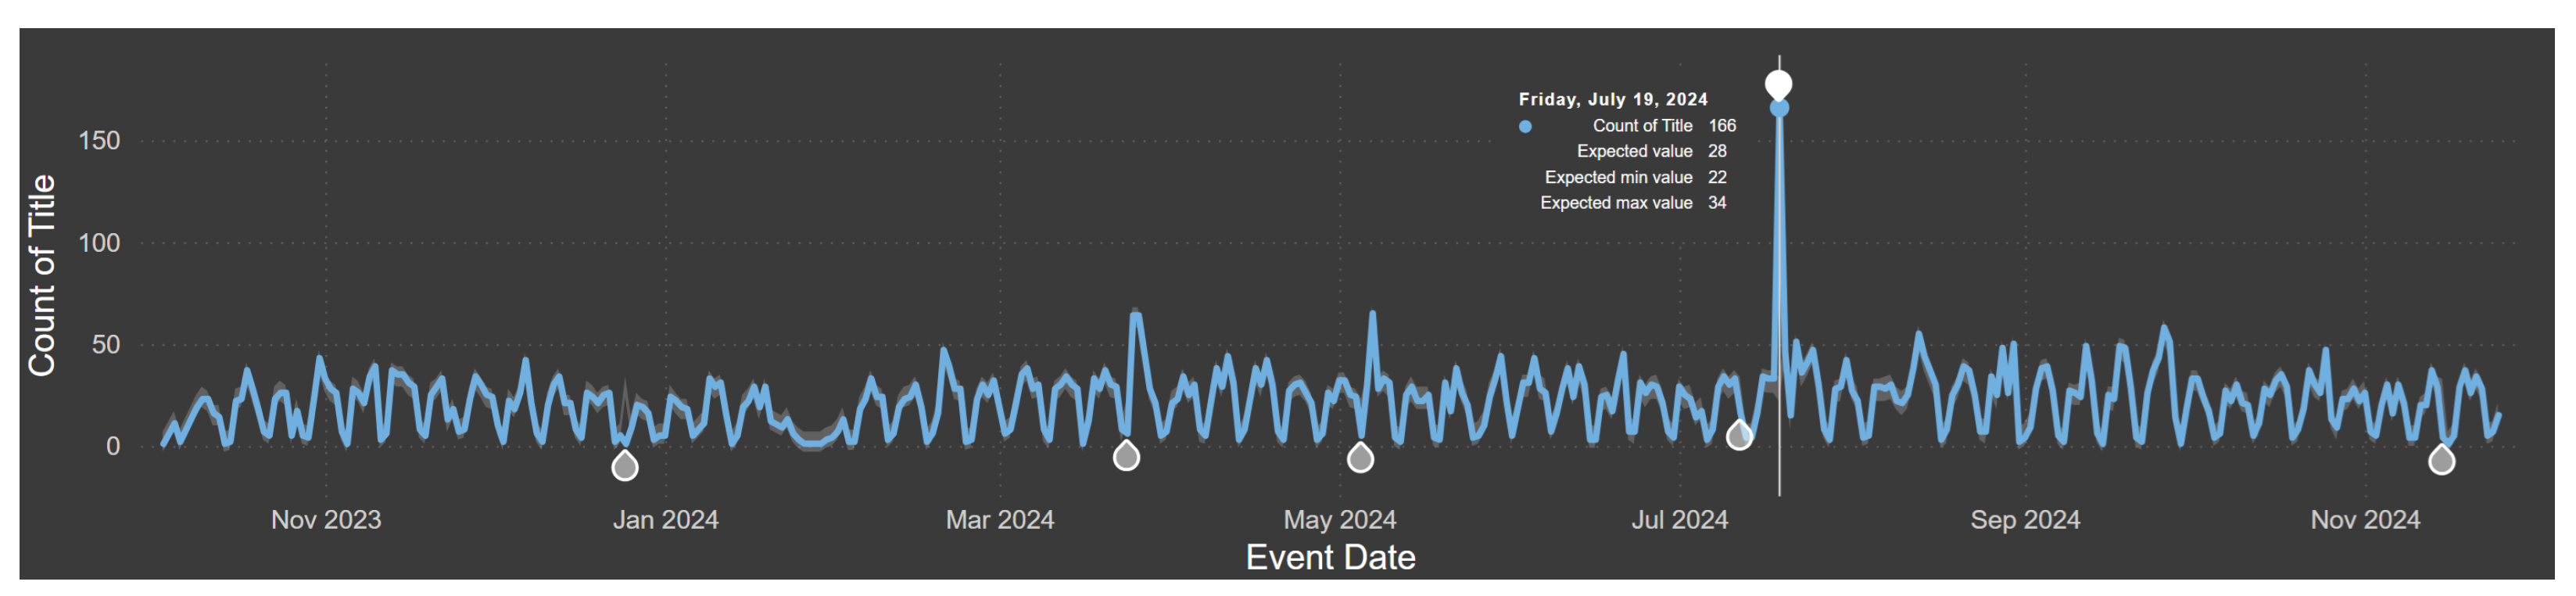
Figure 12.
Three-dimensional surface plot illustrating the evaluation of GPT performance metrics—recall, precision, and F1-score—across four major types of cyber attacks: Zero-Day Exploits, APTs, Malware, and Social Engineering Attacks.
Figure 12.
Three-dimensional surface plot illustrating the evaluation of GPT performance metrics—recall, precision, and F1-score—across four major types of cyber attacks: Zero-Day Exploits, APTs, Malware, and Social Engineering Attacks.
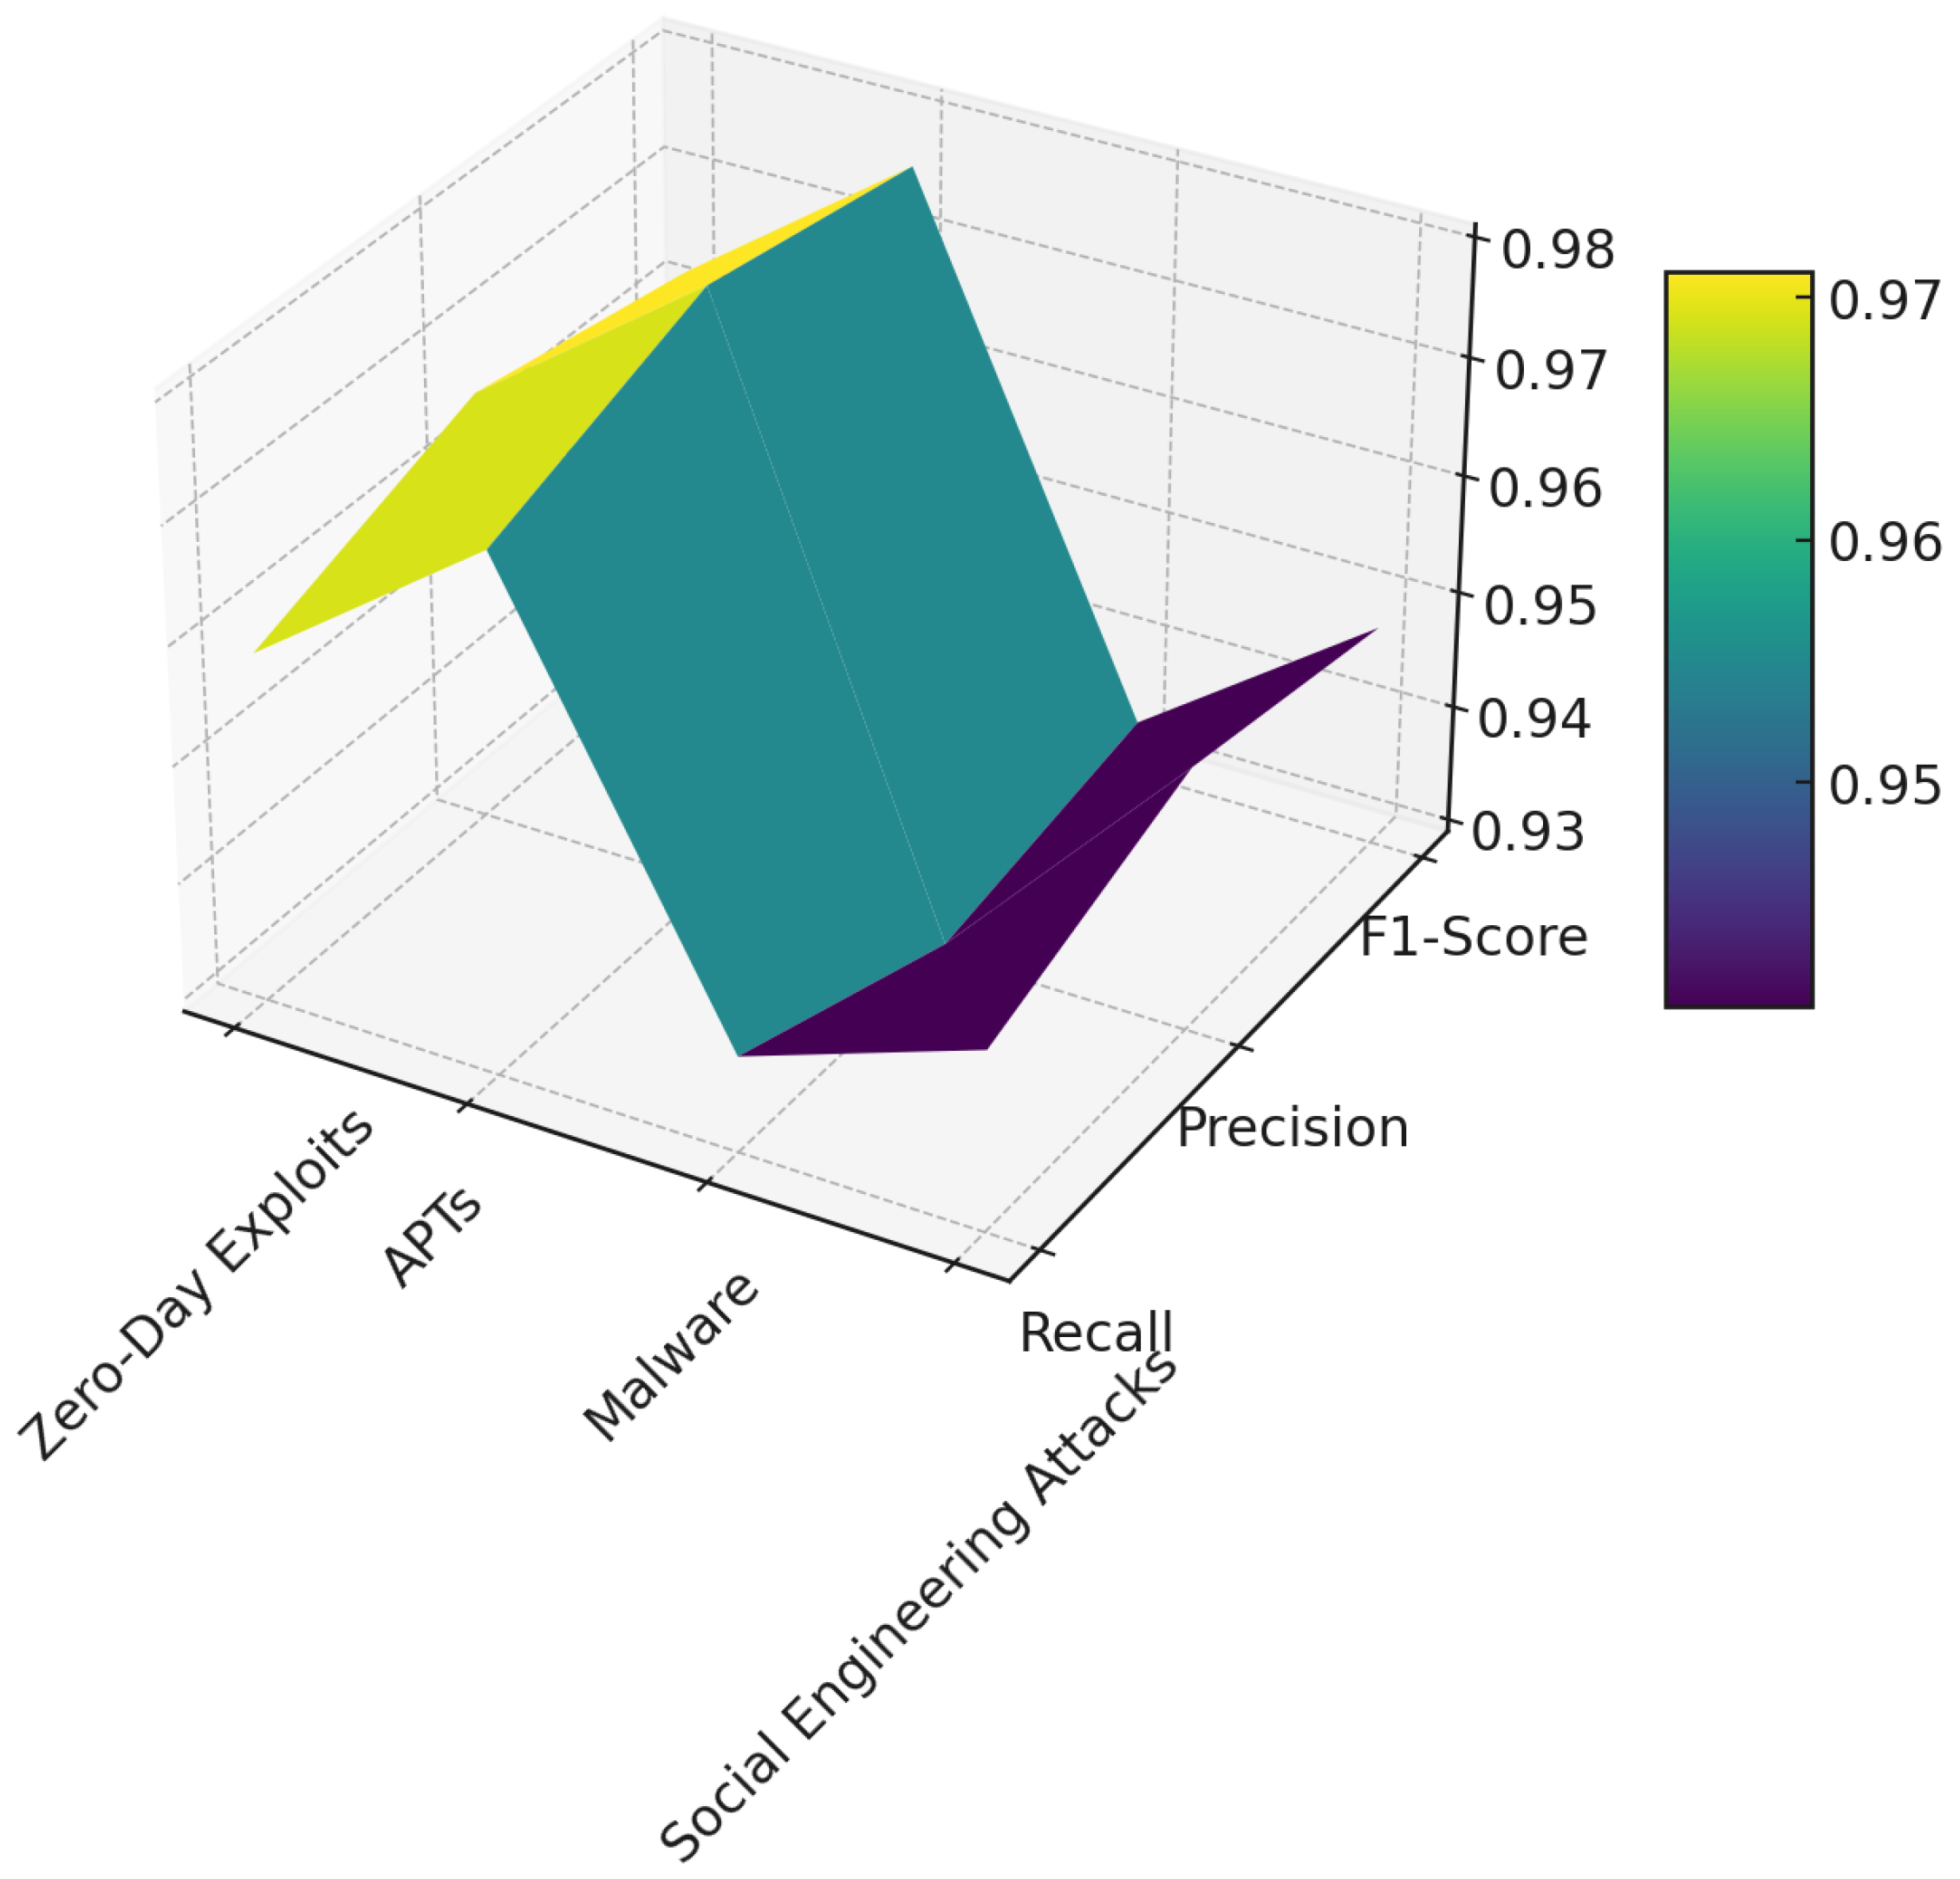
Figure 13.
Three-dimensional surface plot demonstrating the scaled performance metrics of recall, precision, and F1-score for the four most attacked industries in cybersecurity: “Information Technology and Telecom”, “Financial Services”, “Government and Public Administration”, and “Healthcare and Public Health”.


Table 1.
Notation summary.
| Symbol | Description |
|---|---|
| N | Total number of articles collected |
| Content of article i | |
| Set of industry categories | |
| Set of cyber attack types | |
| Significance score of article i | |
| Set of countries affected by event i | |
| Geopolitical strength of country c | |
| Discrete significance level of article i | |
| Weight of edge between attack type and industry in the knowledge graph | |
| Feature vector for article i | |
| Frequency of cyber incidents over time t | |
| Saliency map after SR transformation | |
| Window segment of length w in the saliency map | |
| Anomaly score for segment | |
| Anomaly threshold |
Table 2.
Event type analysis.
| Event Type | Count of Title | Main Country | Secondary Country | Count of Primary Event Location |
|---|---|---|---|---|
| Cybersecurity News | 8126 | 134 | 170 | 2763 |
| Nation State Hacking | 721 | 51 | 65 | 160 |
| Ransomware Attack News | 154 | 17 | 9 | 92 |
| Globally Disruptive Cyber Attack | 17 | 8 | 4 | 11 |
| Total | 9018 | 146 | 199 | 2903 |
Table 3.
Notations used for presenting the results.
| Symbol | Description |
|---|---|
| S | Average significance of the event |
| I | Industry impacted |
| A | Attack type |
| C | Impacted country |
| Change in the average significance |
Table 4.
Key relationships from regression analysis.
| No. | Relationship Description |
|---|---|
| 1 | Critical infrastructure increases significance. |
| 2 | Multiple sectors increase significance. |
| 3 | Advanced Persistent Threats (APTs) increase significance. |
| 4 | Iran as the impacted country increases significance. |
| 5 | Ukraine as the impacted country increases significance. |
| 6 | Healthcare and Public Health industry increases significance. |
| 7 | Zero-Day Exploits attack type increases significance. |
| 8 | Ransomware attack type increases significance. |
| 9 | Multiple countries as the impacted countries increase significance. |
| 10 | Supply Chain Attacks increase significance. |
| 11 | Government, IT, and Telecommunications industries increase significance. |
Table 5.
Equations corresponding to relationships.
| No. | Equation |
|---|---|
| 1 | |
| 2 | |
| 3 | |
| 4 | |
| 5 | |
| 6 | |
| 7 | |
| 8 | |
| 9 | |
| 10 | |
| 11 |
Table 6.
Clustering results—top segments.
| Seg. | Average Significance (S) | Deviation from Overall () | Key Attributes | Data Points (%) |
|---|---|---|---|---|
| Seg. 1 | 3.92 | AttackType: Advanced Persistent Threats (APTs) | 237 (8.5%) | |
| Seg. 2 | 3.87 | AttackType: Zero-Day Exploits, ImpactedCountry: Multiple Countries | 143 (5.1%) | |
| Seg. 3 | 3.64 | AttackType: Not None, ImpactedCountry: United States, Industry: Not IT or Government | 174 (6.3%) | |
| Seg. 4 | 3.58 | AttackType: Zero-Day Exploits, ImpactedCountry: Not Multiple Countries | 239 (8.6%) | |
| Seg. 5 | 3.47 | AttackType: Not Social Engineering or Zero-Day Exploits, ImpactedCountry: Not US, Industry: Not IT or Government | 404 (14.5%) |
Table 7.
Equational representation of clustering results.
| Segment | Equation |
|---|---|
| Seg. 1 | |
| Seg. 2 | |
| Seg. 3 | |
| Seg. 4 | |
| Seg. 5 |
Table 8.
Performance metrics of cyber event categorization.
| Category | TP | TN | FP | FN | Precision | Recall | F1-Score |
|---|---|---|---|---|---|---|---|
| Cybersecurity News | 8075 | 34 | 6 | 11 | 0.999 | 0.999 | 0.999 |
| Nation State Hacking | 698 | 19 | 3 | 1 | 0.996 | 0.999 | 0.997 |
| Ransomware Attack News | 136 | 11 | 3 | 4 | 0.978 | 0.971 | 0.975 |
| Globally Disruptive Cyber Attack | 14 | 2 | 0 | 1 | 1 | 0.933 | 0.966 |
| Total | 8923 | 66 | 12 | 17 | 0.999 | 0.998 | 0.998 |
Disclaimer/Publisher’s Note: The statements, opinions and data contained in all publications are solely those of the individual author(s) and contributor(s) and not of MDPI and/or the editor(s). MDPI and/or the editor(s) disclaim responsibility for any injury to people or property resulting from any ideas, methods, instructions or products referred to in the content. |
© 2025 by the author. Licensee MDPI, Basel, Switzerland. This article is an open access article distributed under the terms and conditions of the Creative Commons Attribution (CC BY) license (https://creativecommons.org/licenses/by/4.0/).
Share and Cite
MDPI and ACS Style
Sufi, F. A GPT-Based Approach for Cyber Threat Assessment. AI 2025, 6, 99. https://doi.org/10.3390/ai6050099
AMA Style
Sufi F. A GPT-Based Approach for Cyber Threat Assessment. AI. 2025; 6(5):99. https://doi.org/10.3390/ai6050099
Chicago/Turabian StyleSufi, Fahim. 2025. "A GPT-Based Approach for Cyber Threat Assessment" AI 6, no. 5: 99. https://doi.org/10.3390/ai6050099
APA StyleSufi, F. (2025). A GPT-Based Approach for Cyber Threat Assessment. AI, 6(5), 99. https://doi.org/10.3390/ai6050099