

Detection of Leaf Diseases in Banana Crops Using Deep Learning Techniques

 , , , and
Abstract
1. Introduction
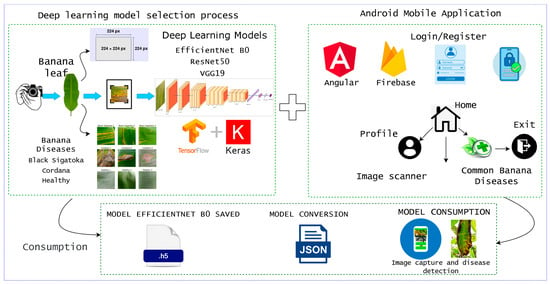
- We propose an approach for early disease detection using pre-trained deep learning models;
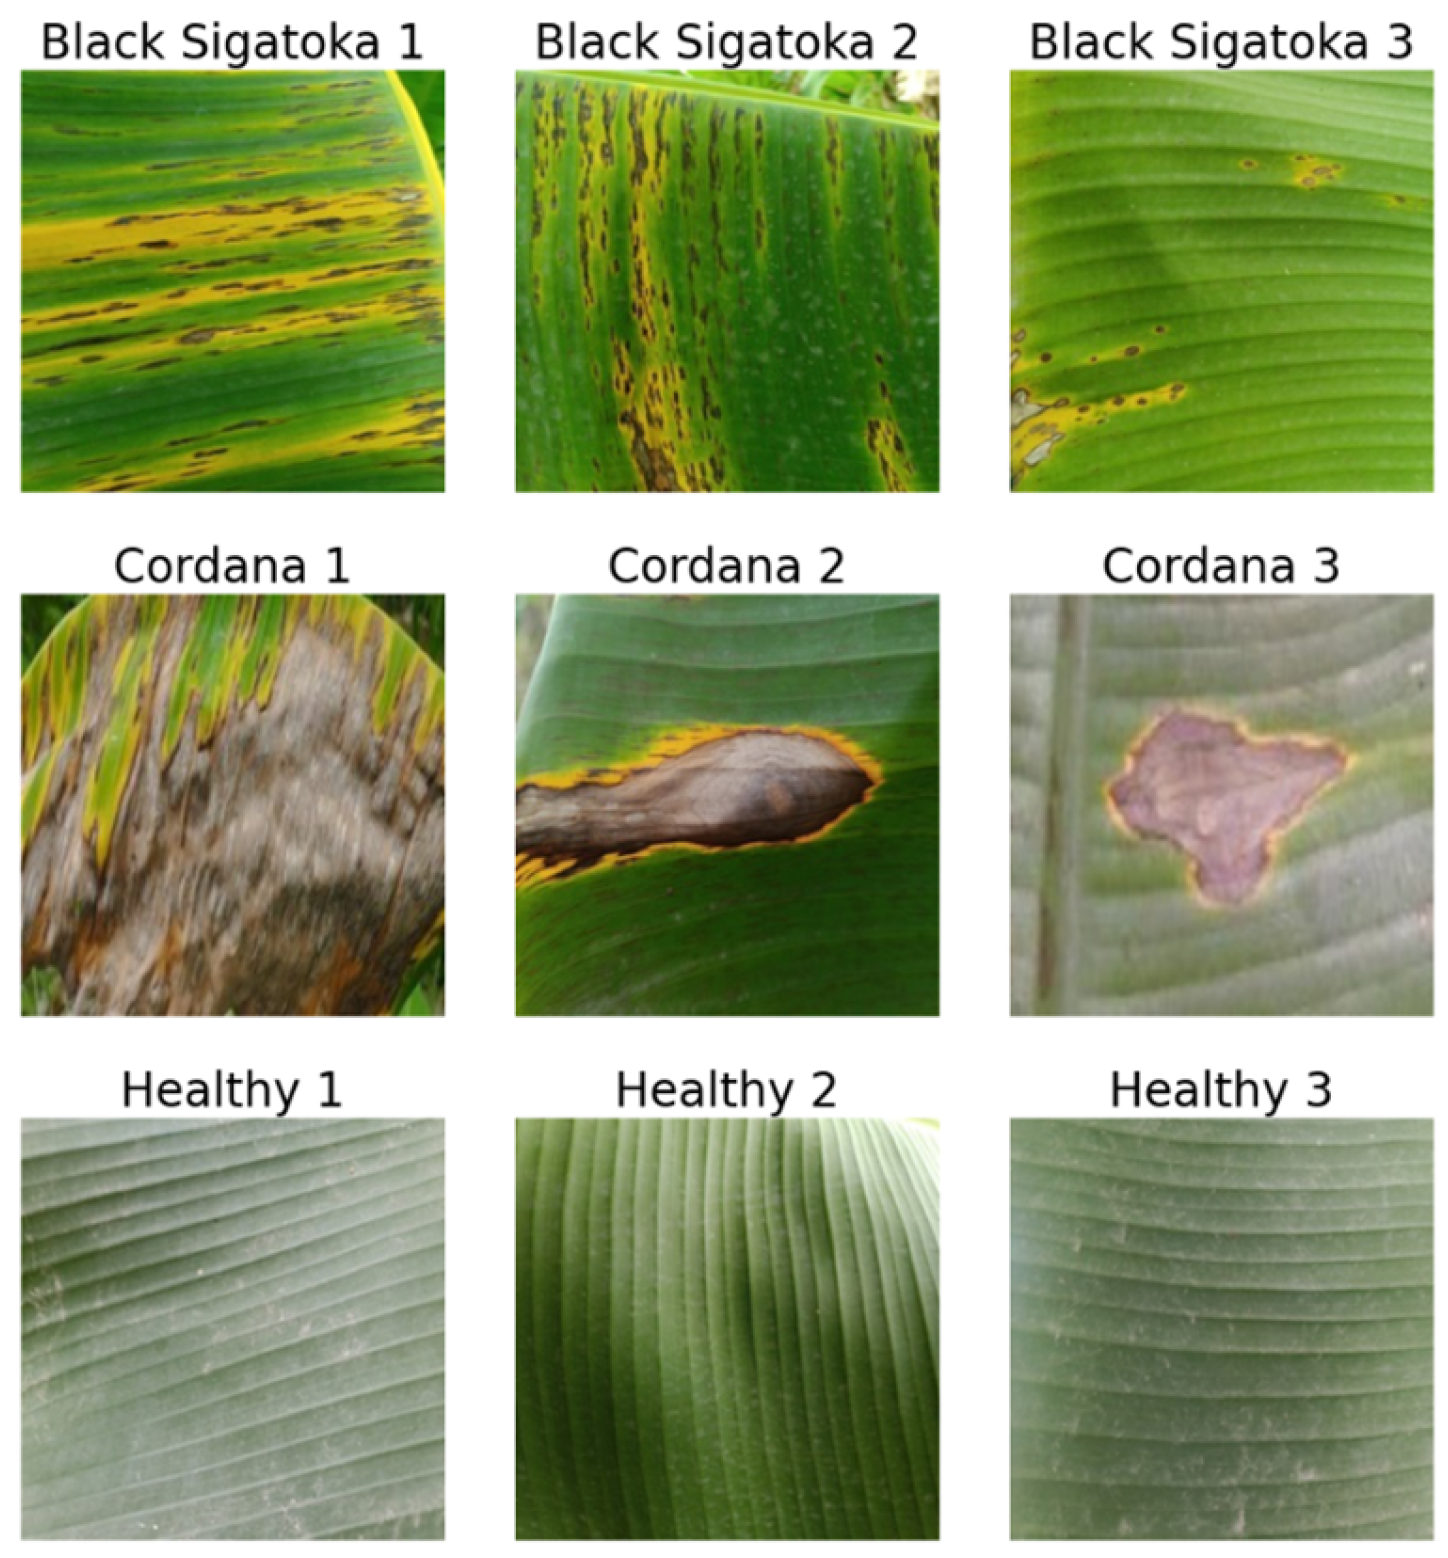
- In response to the lack of banana leaf datasets contextualized to Latin America, a tailored dataset was collected and created specifically for this environment;
- We provide a comparison and evaluation of the performance of the models used (ResNet50, EfficientNetB0, VGG19);
- We describe the implementation of deep learning models in a mobile application to facilitate practical use.
2. State of the Art
3. Literature Review
3.1. Deep Learning
3.2. Convolutional Neural Networks
3.3. EfficientNet B0
3.4. ResNet50
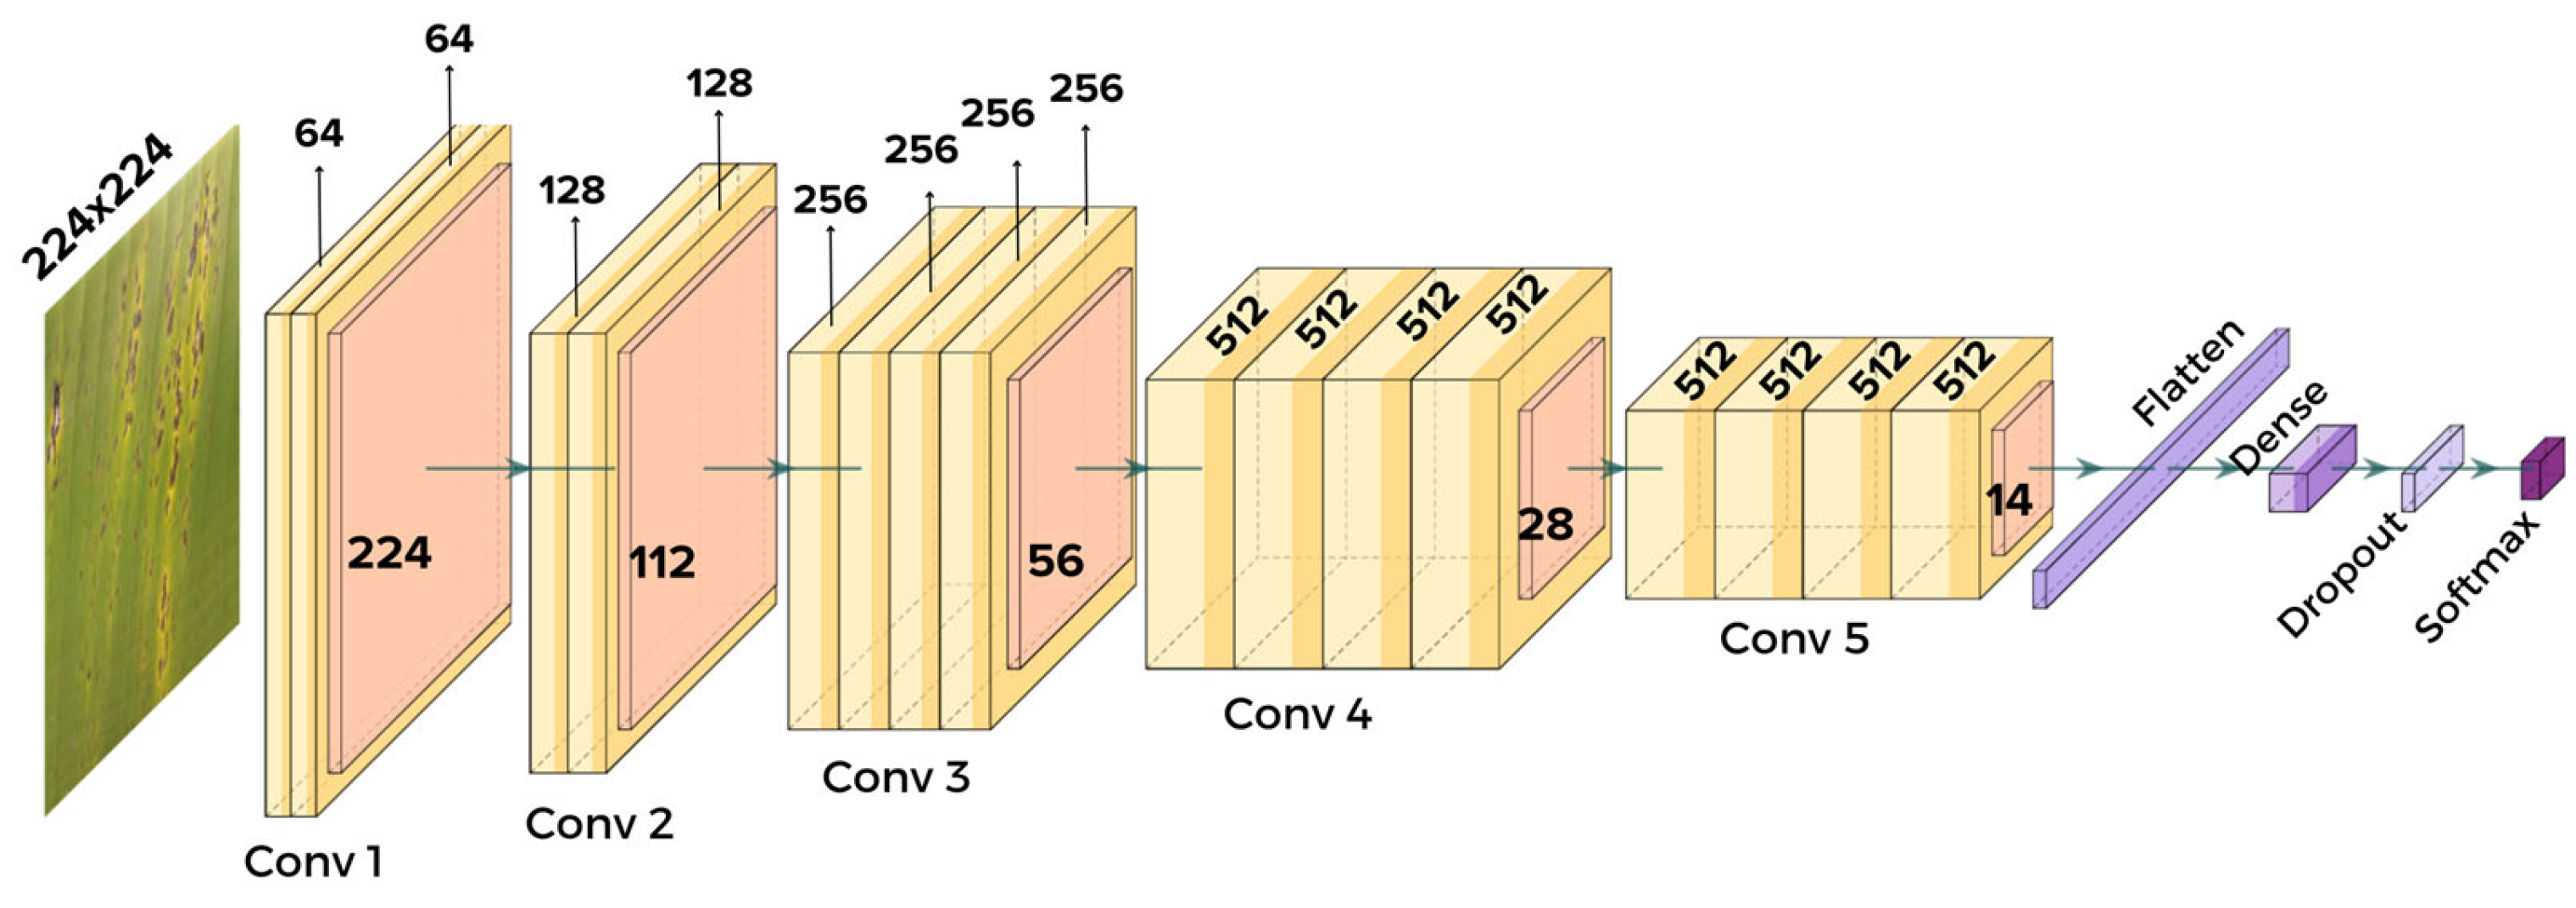
3.5. VGG19
3.6. Transfer Learning
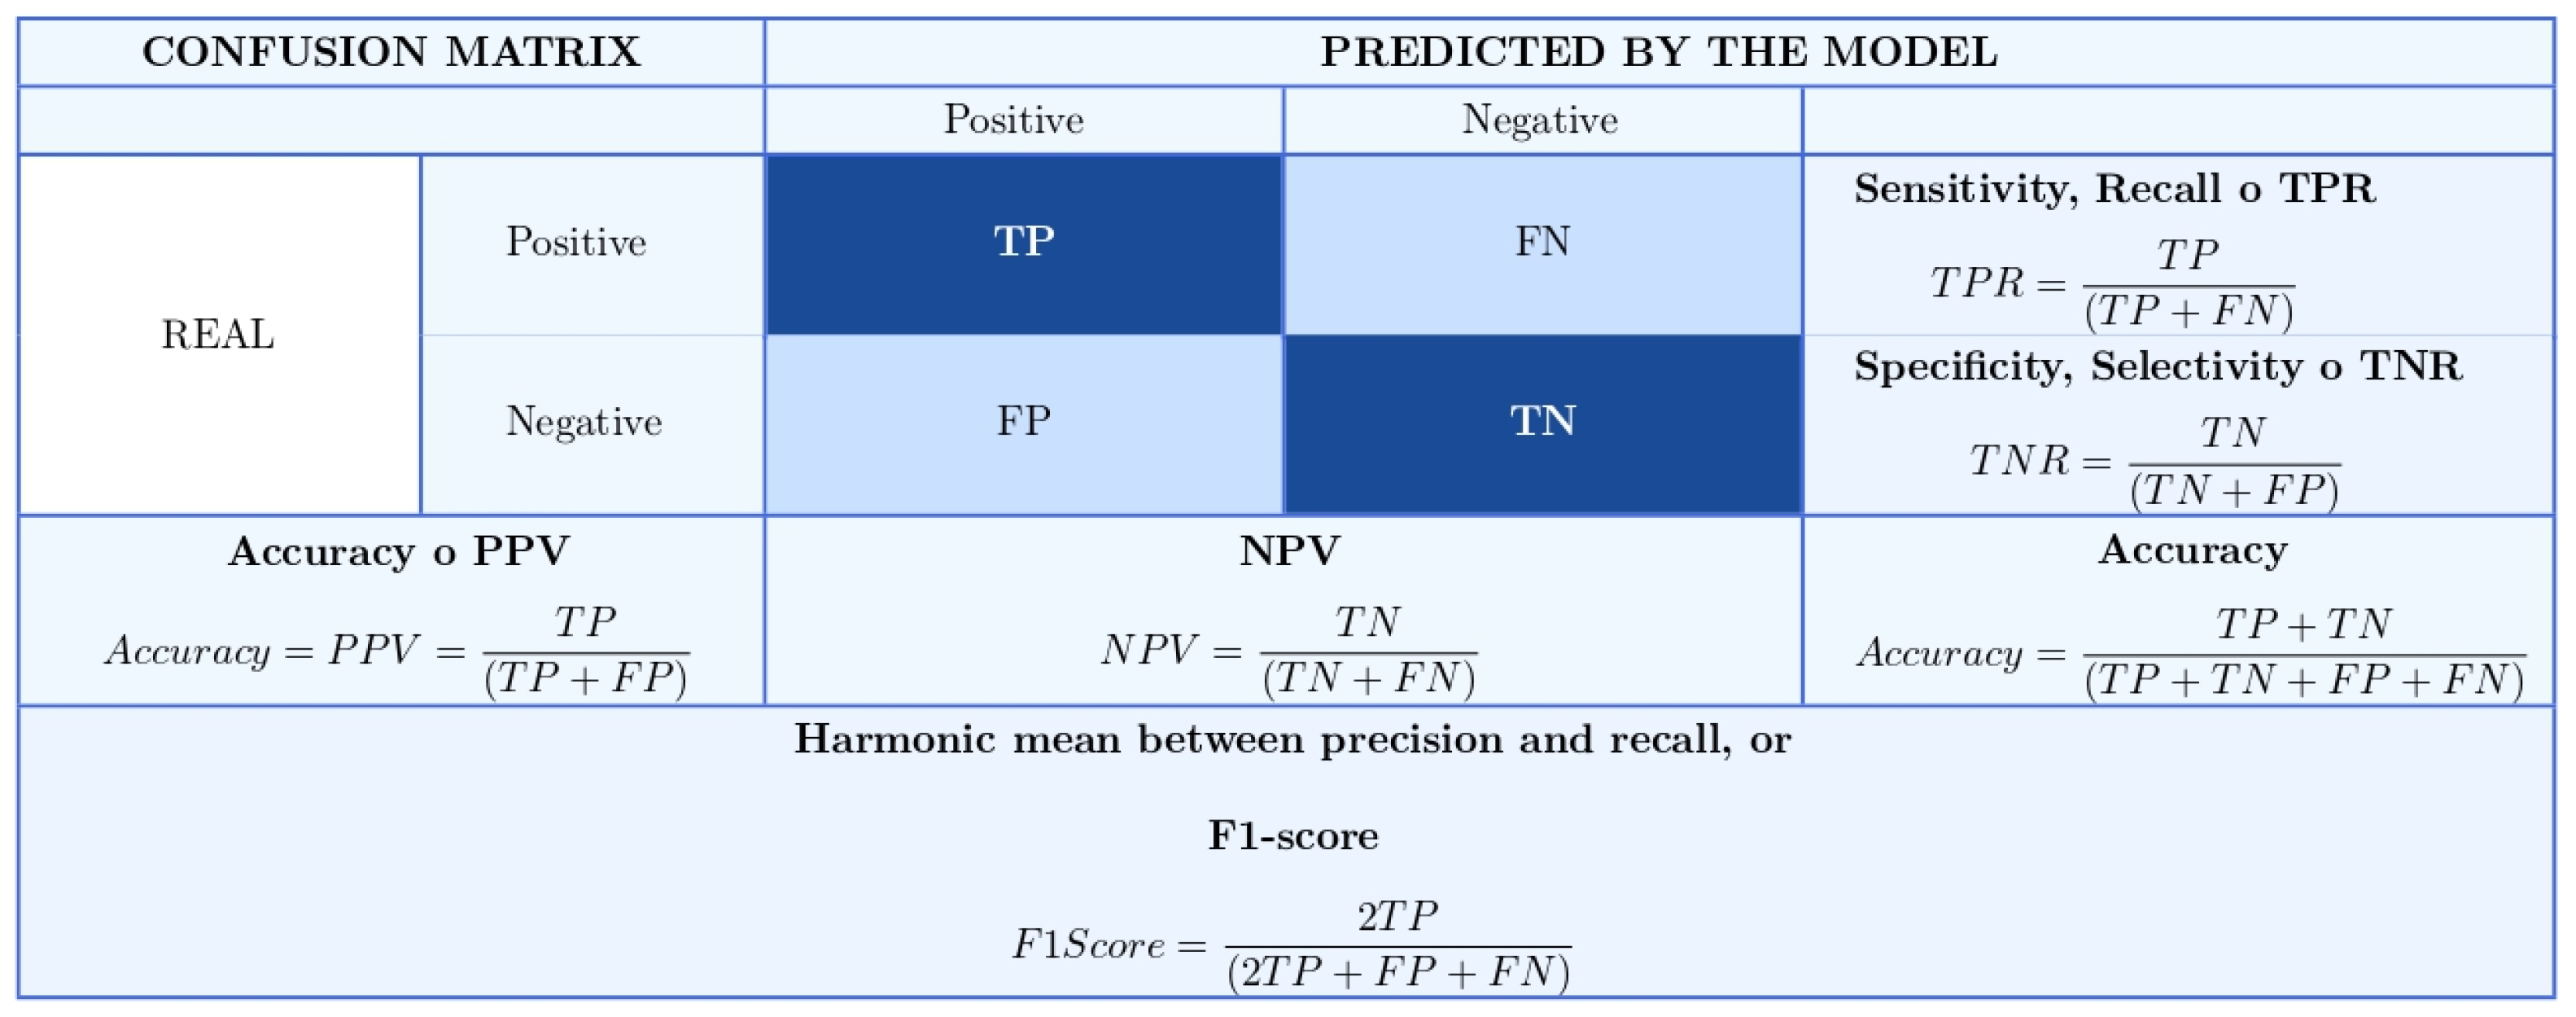
3.7. Confusion Matrix and Associated Metrics for Classification Problems
3.8. Performance Metrics for CNN Models
- TP: True Positives
- TN: True Negatives
- FP: False Positives
- FN: False Negatives
3.9. Loss Function
4. Materials and Methods
4.1. Business Understanding
4.2. Data Understanding
4.3. Data Preparation
4.4. Modeling
5. Results
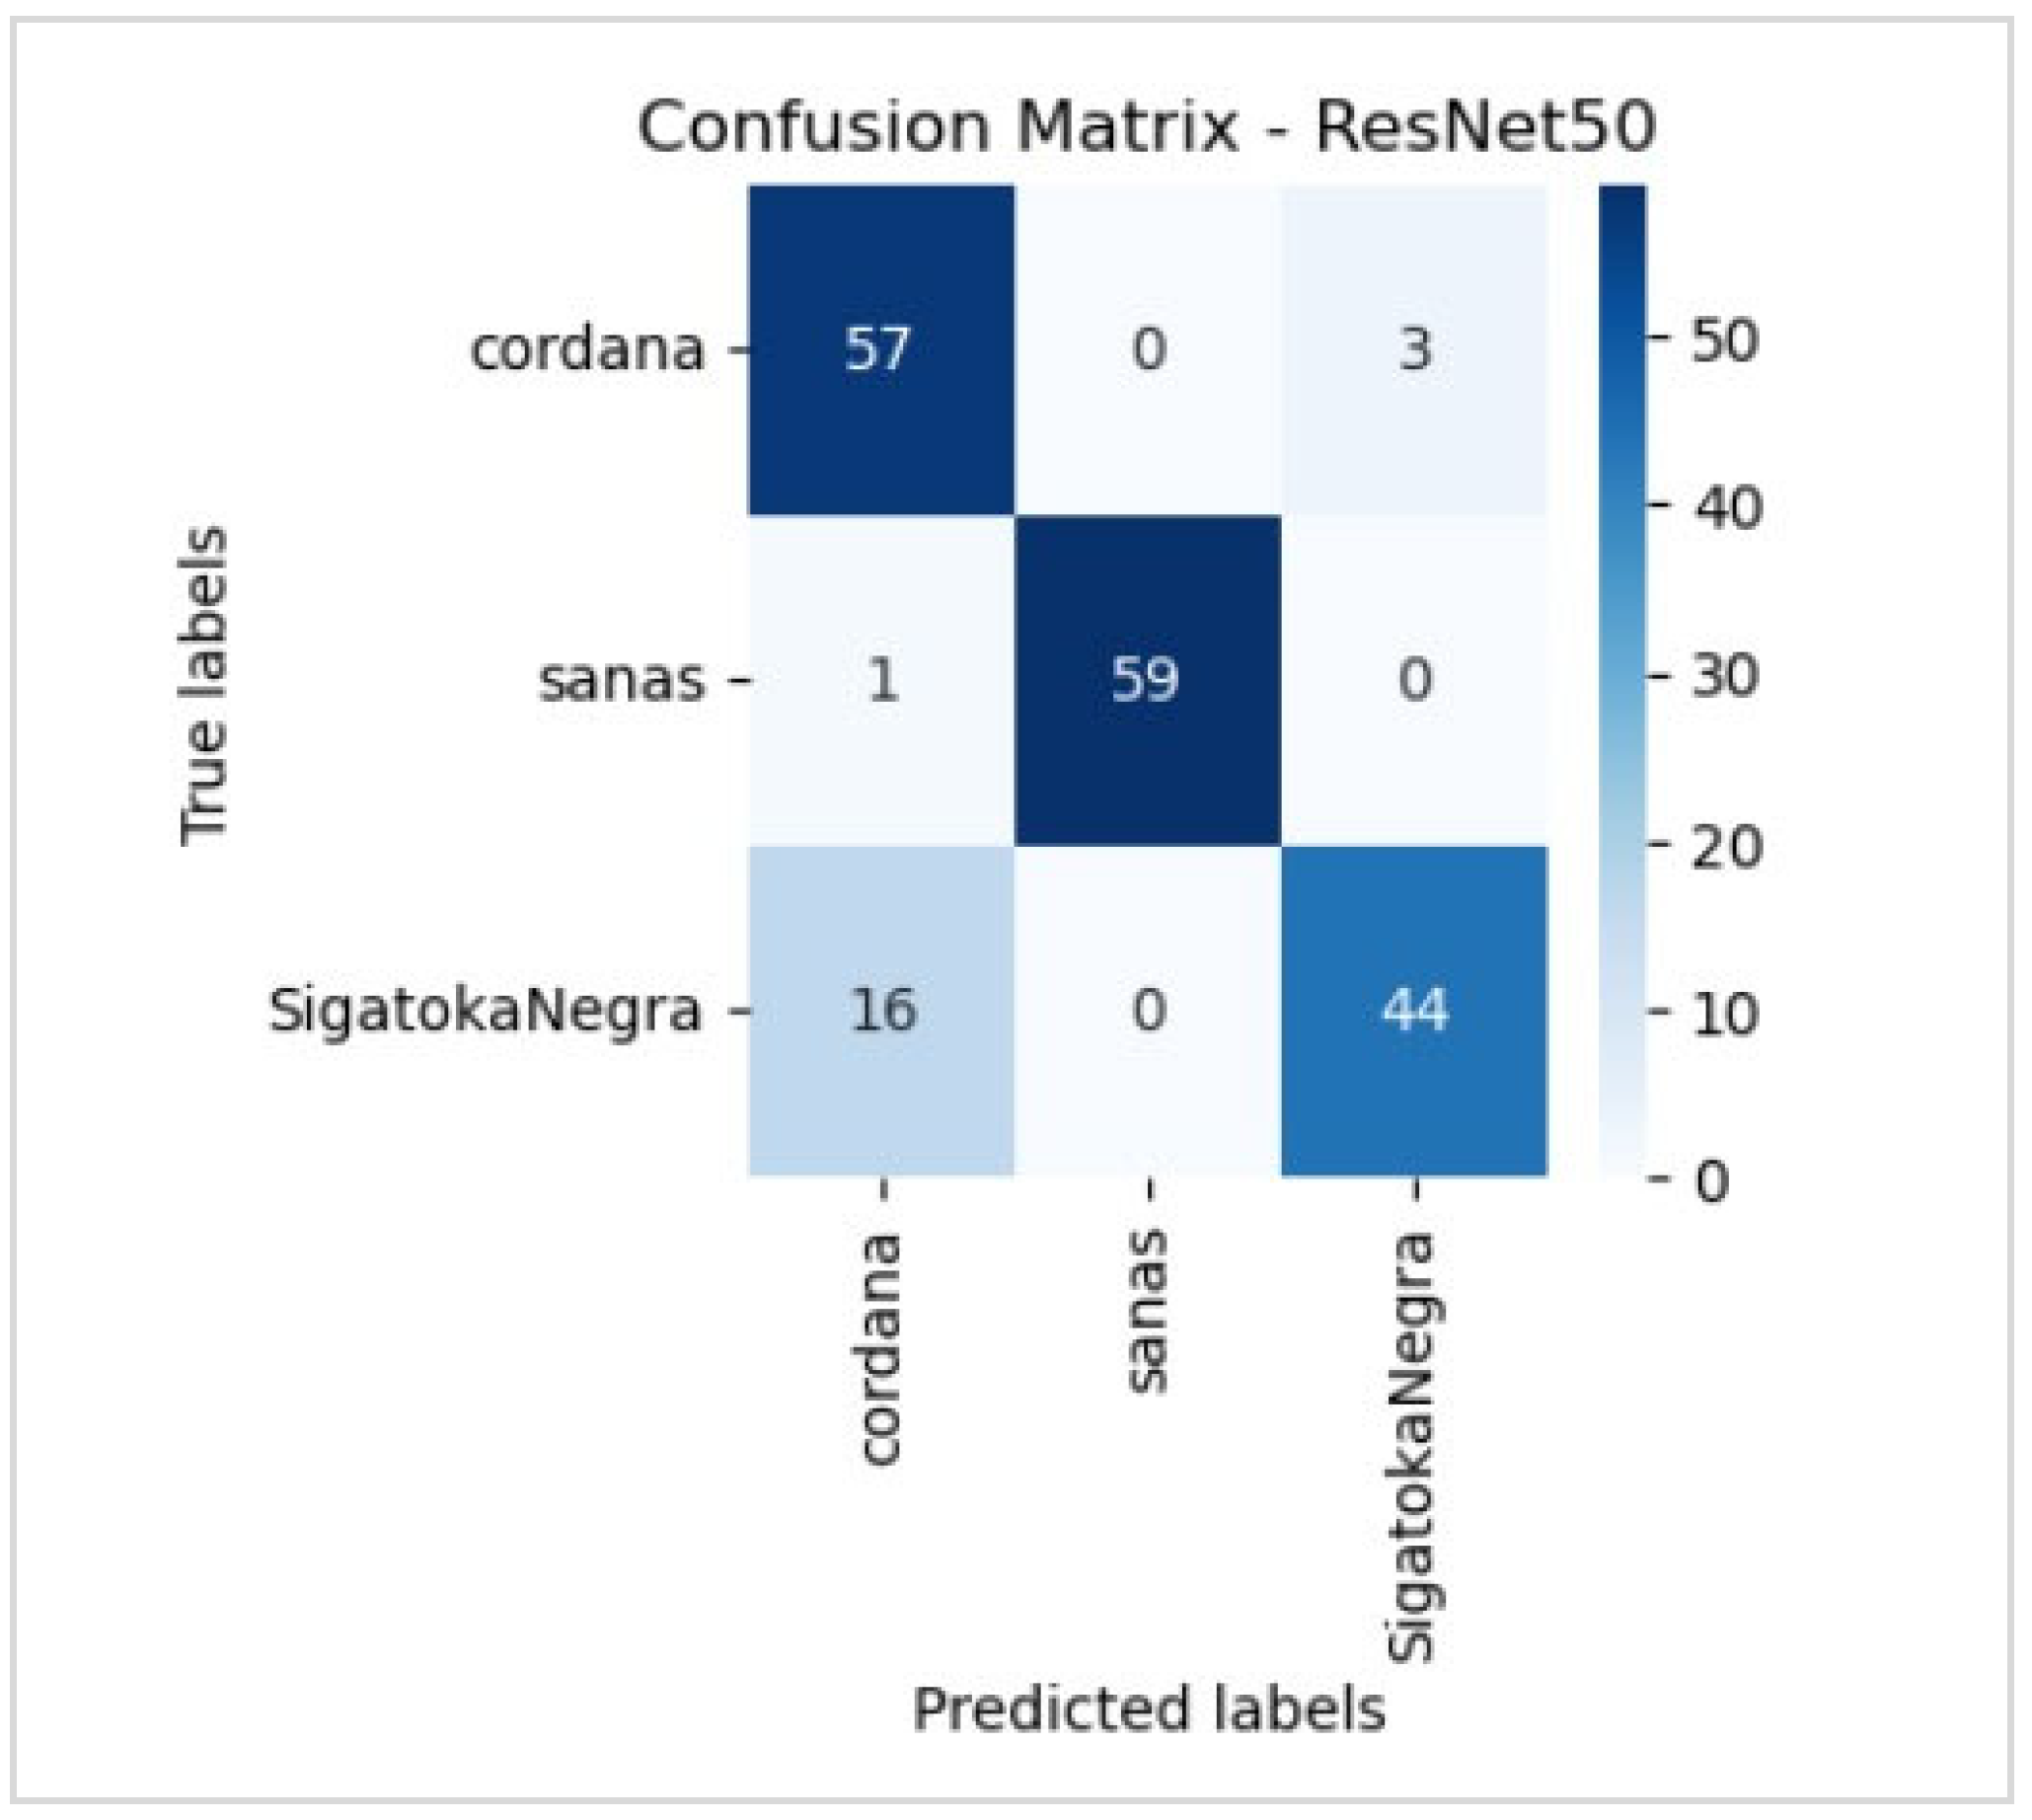
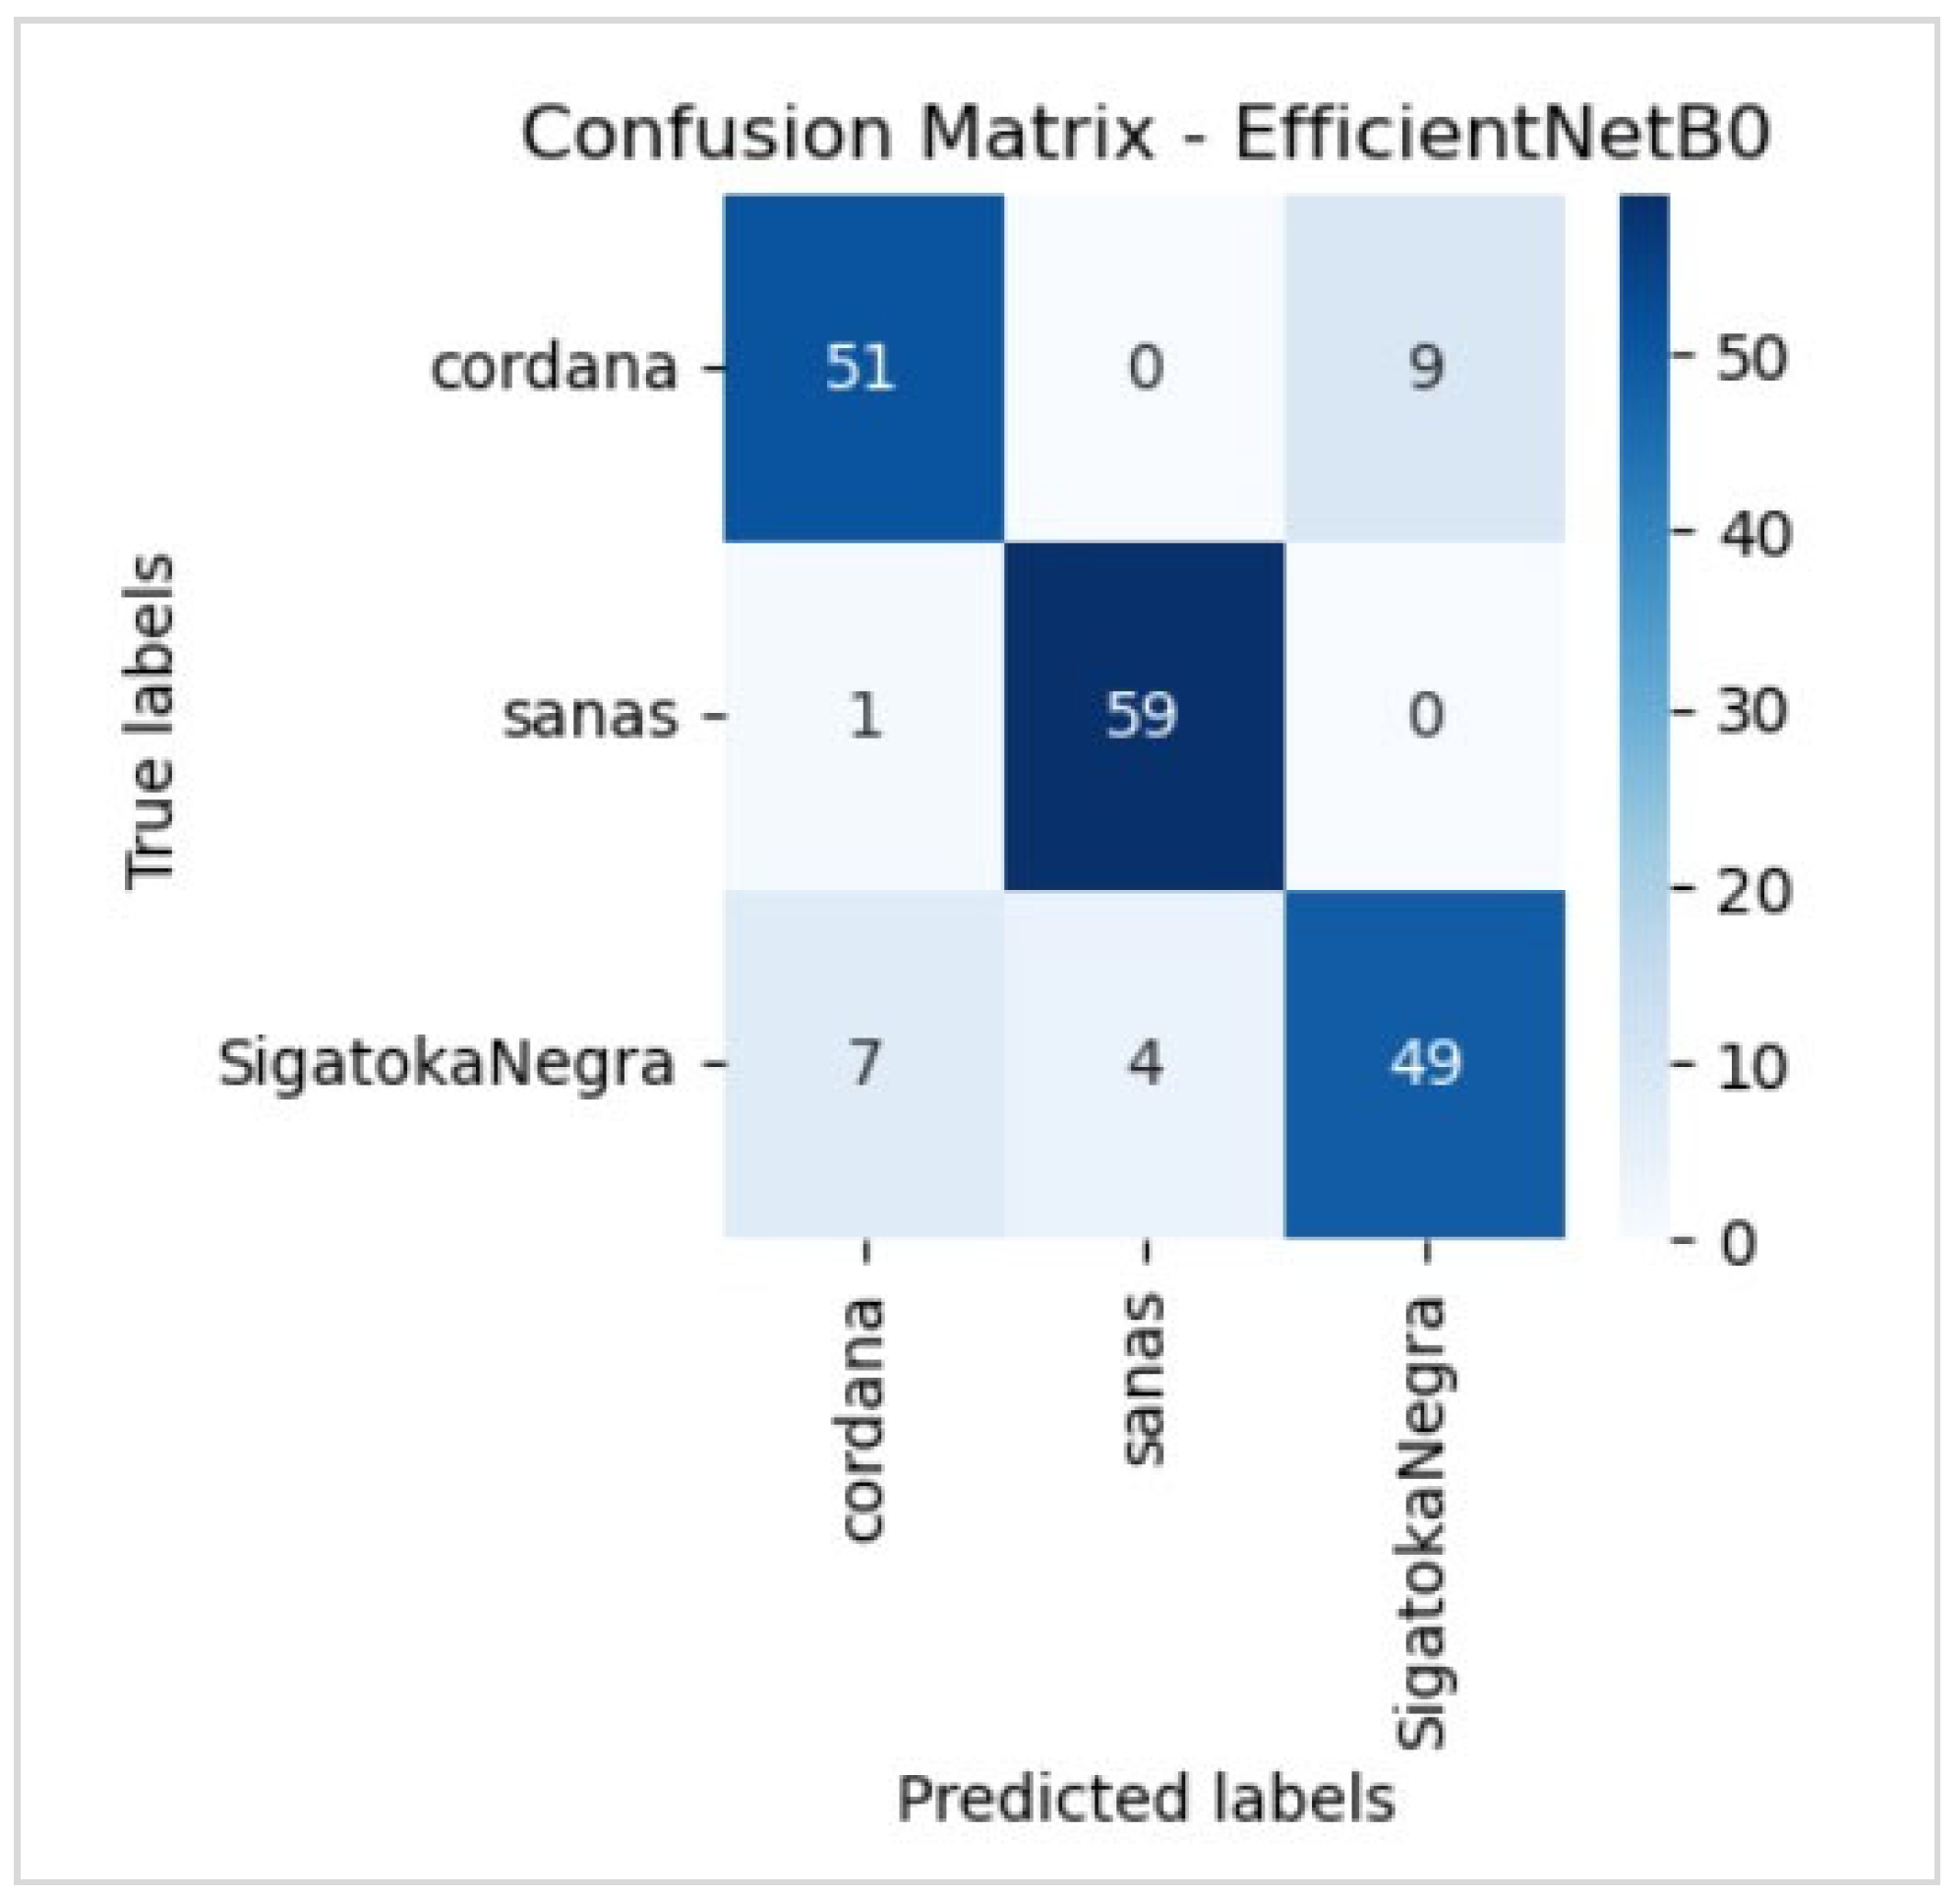
5.1. Evaluation
5.2. Evaluation of the Best Model
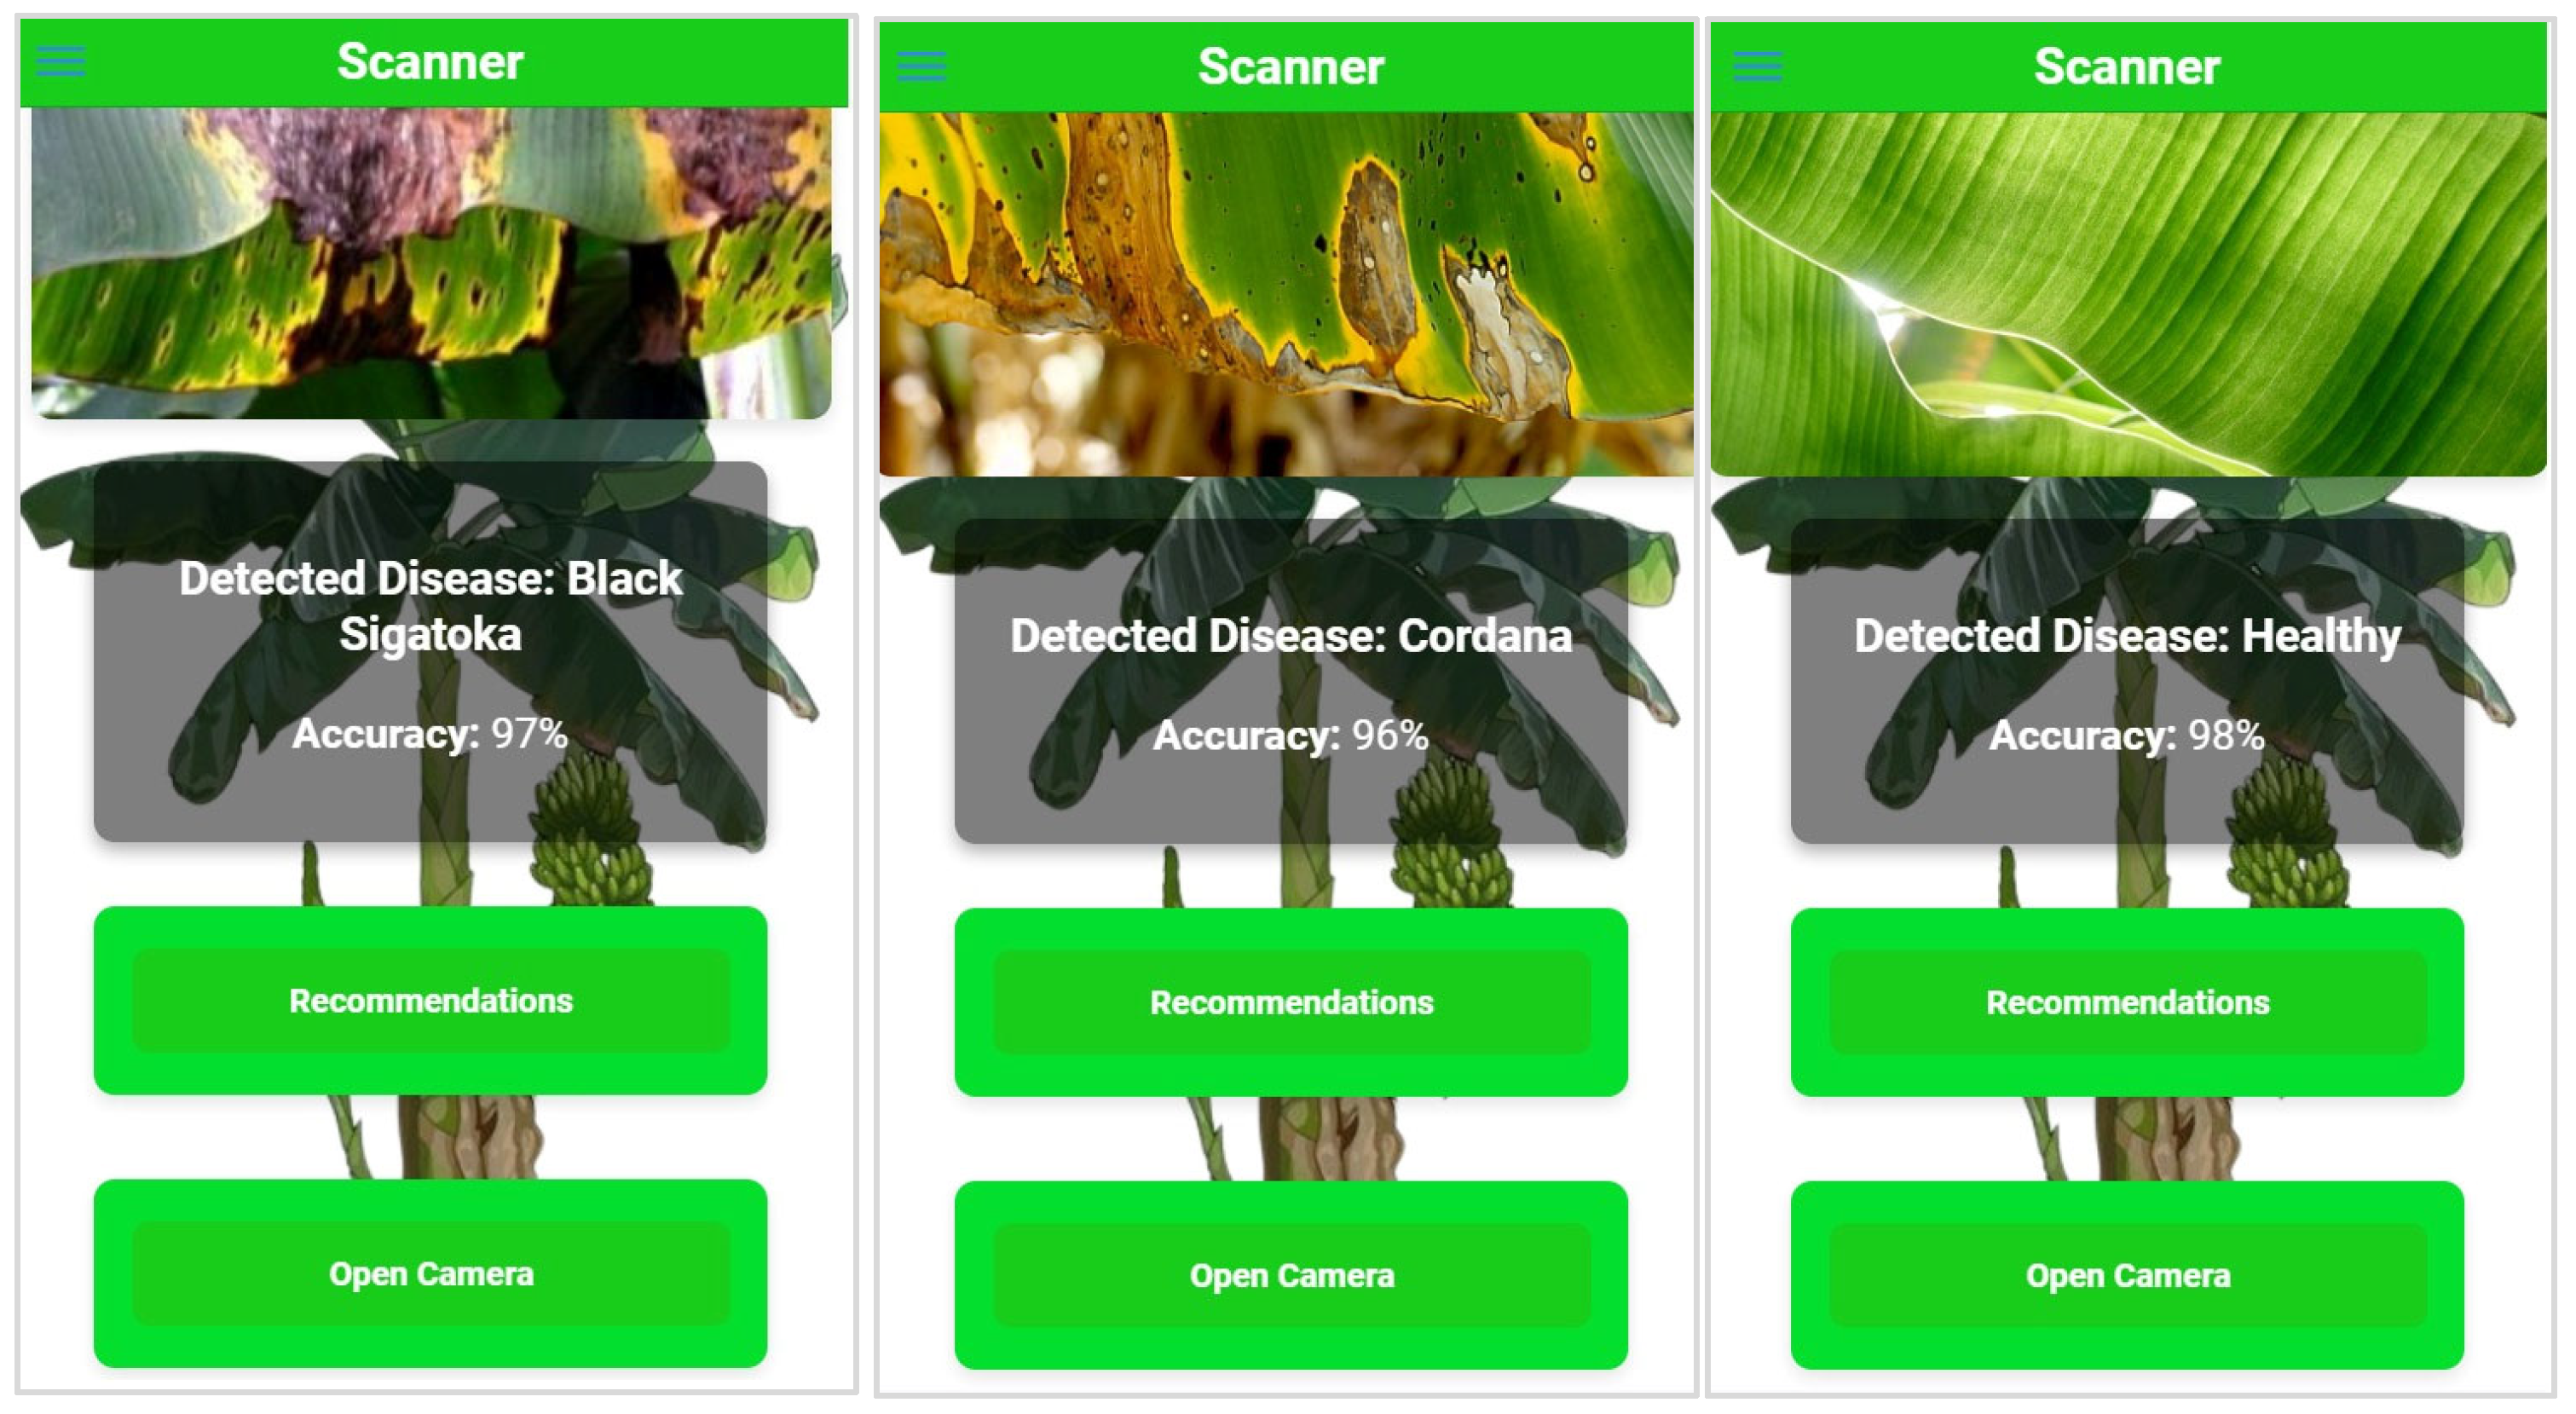
5.3. Deployment
6. Discussion
6.1. Discussion of the Results Obtained
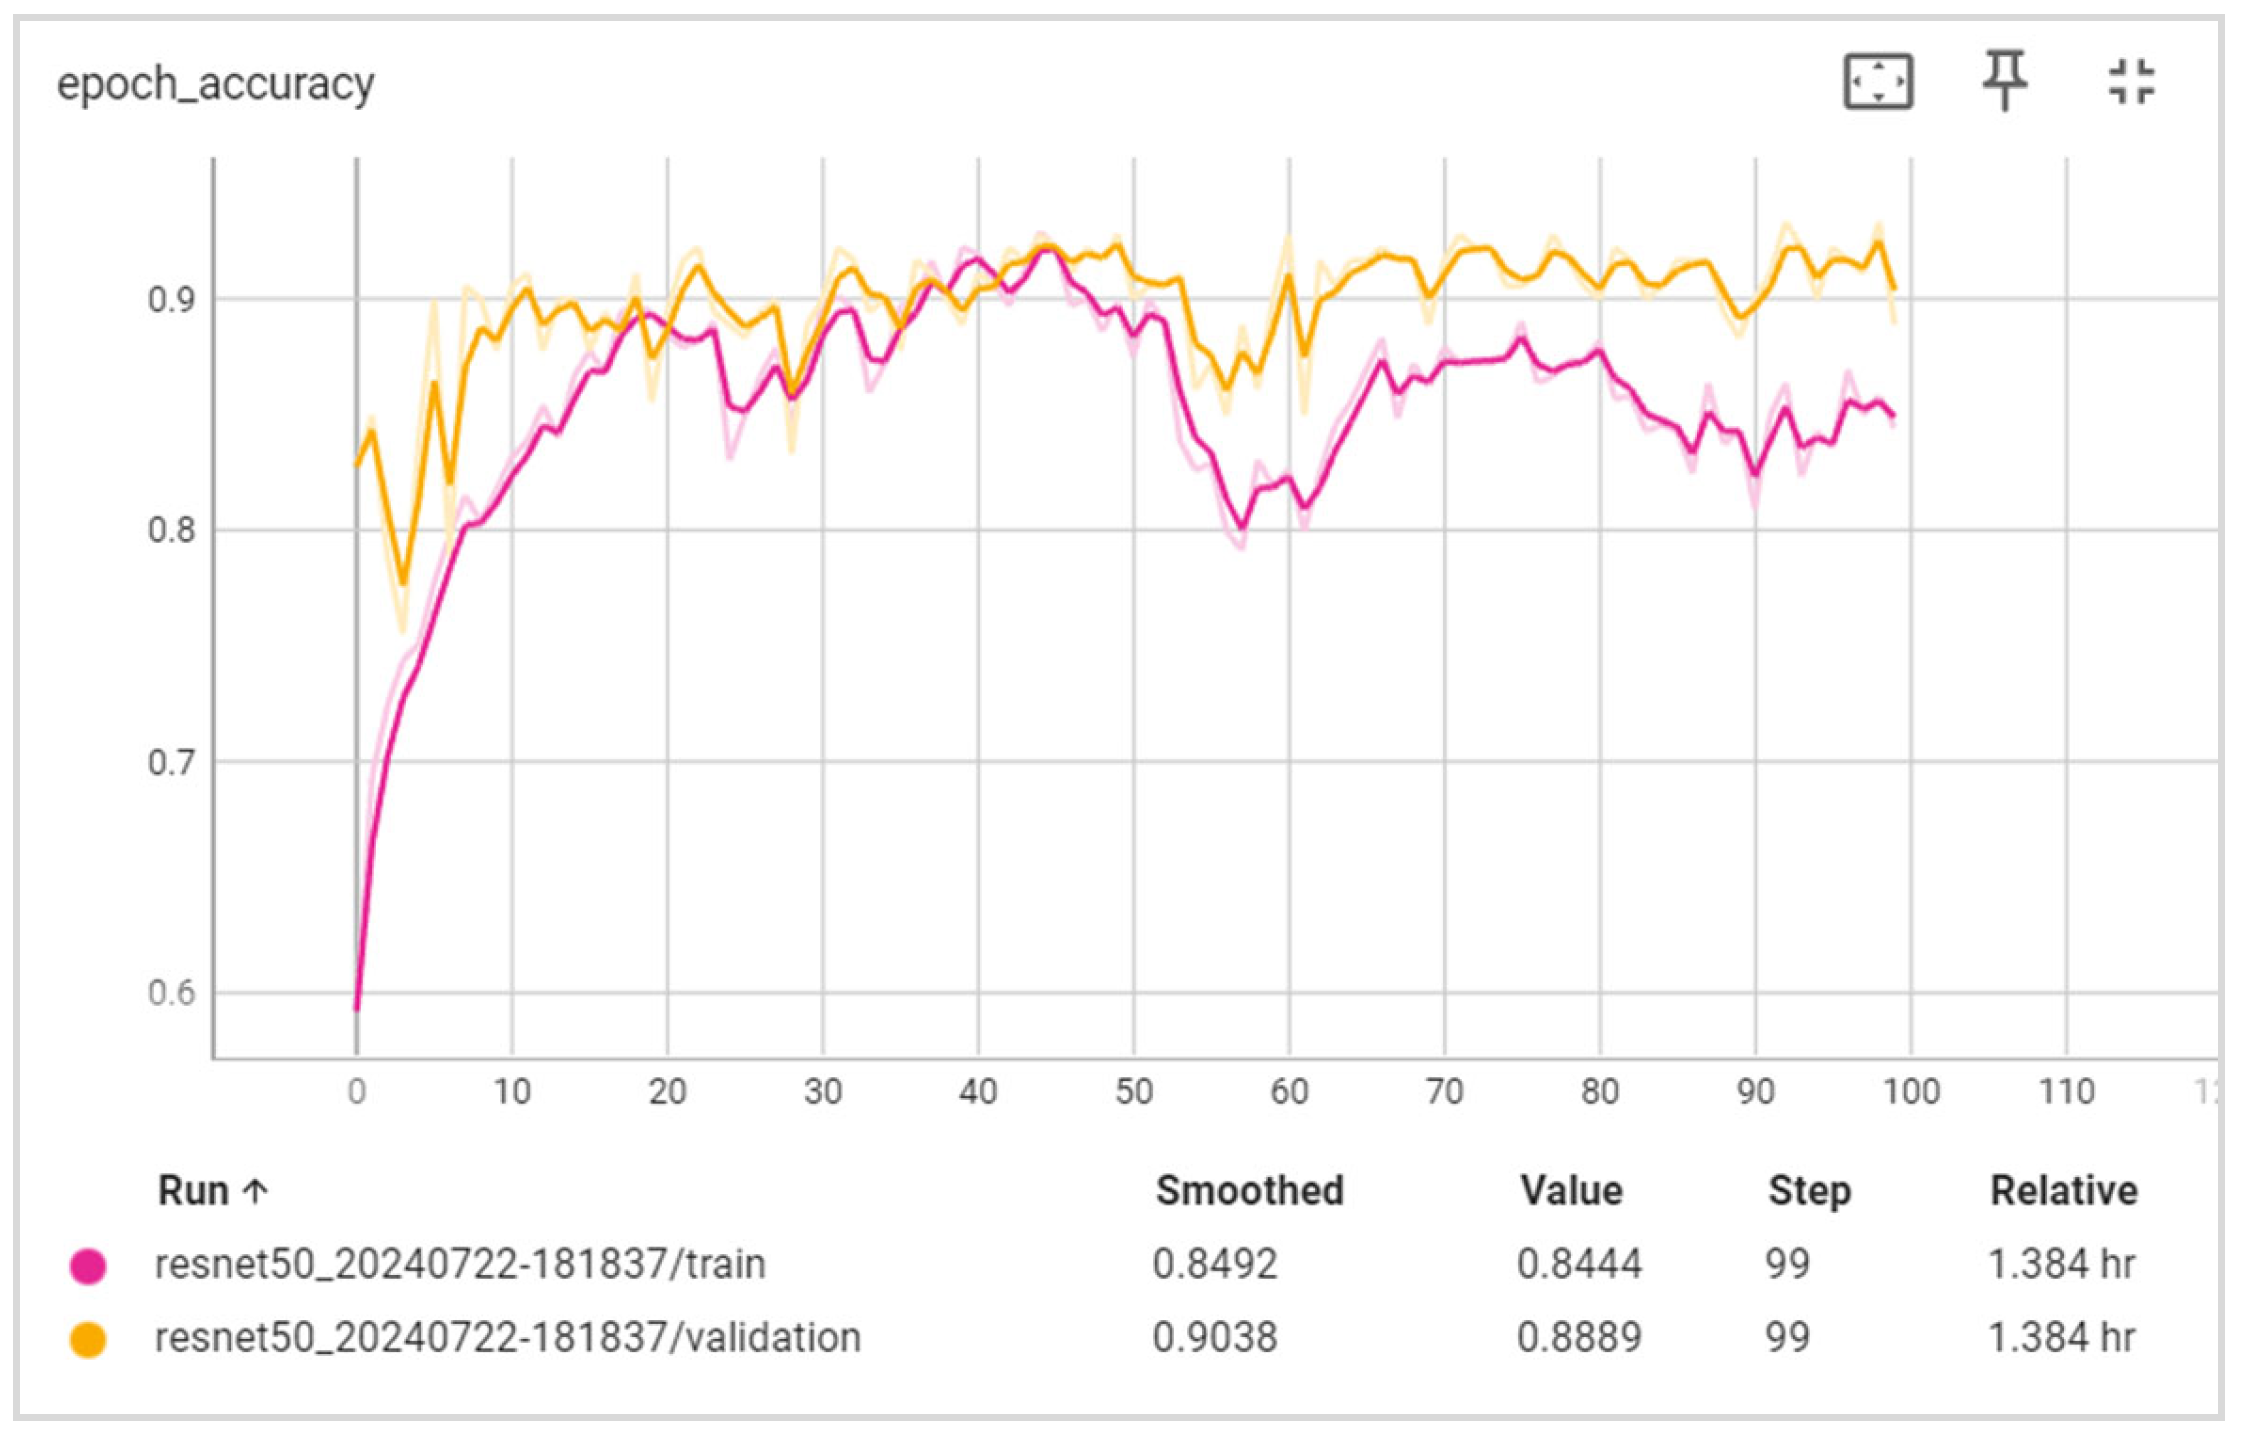
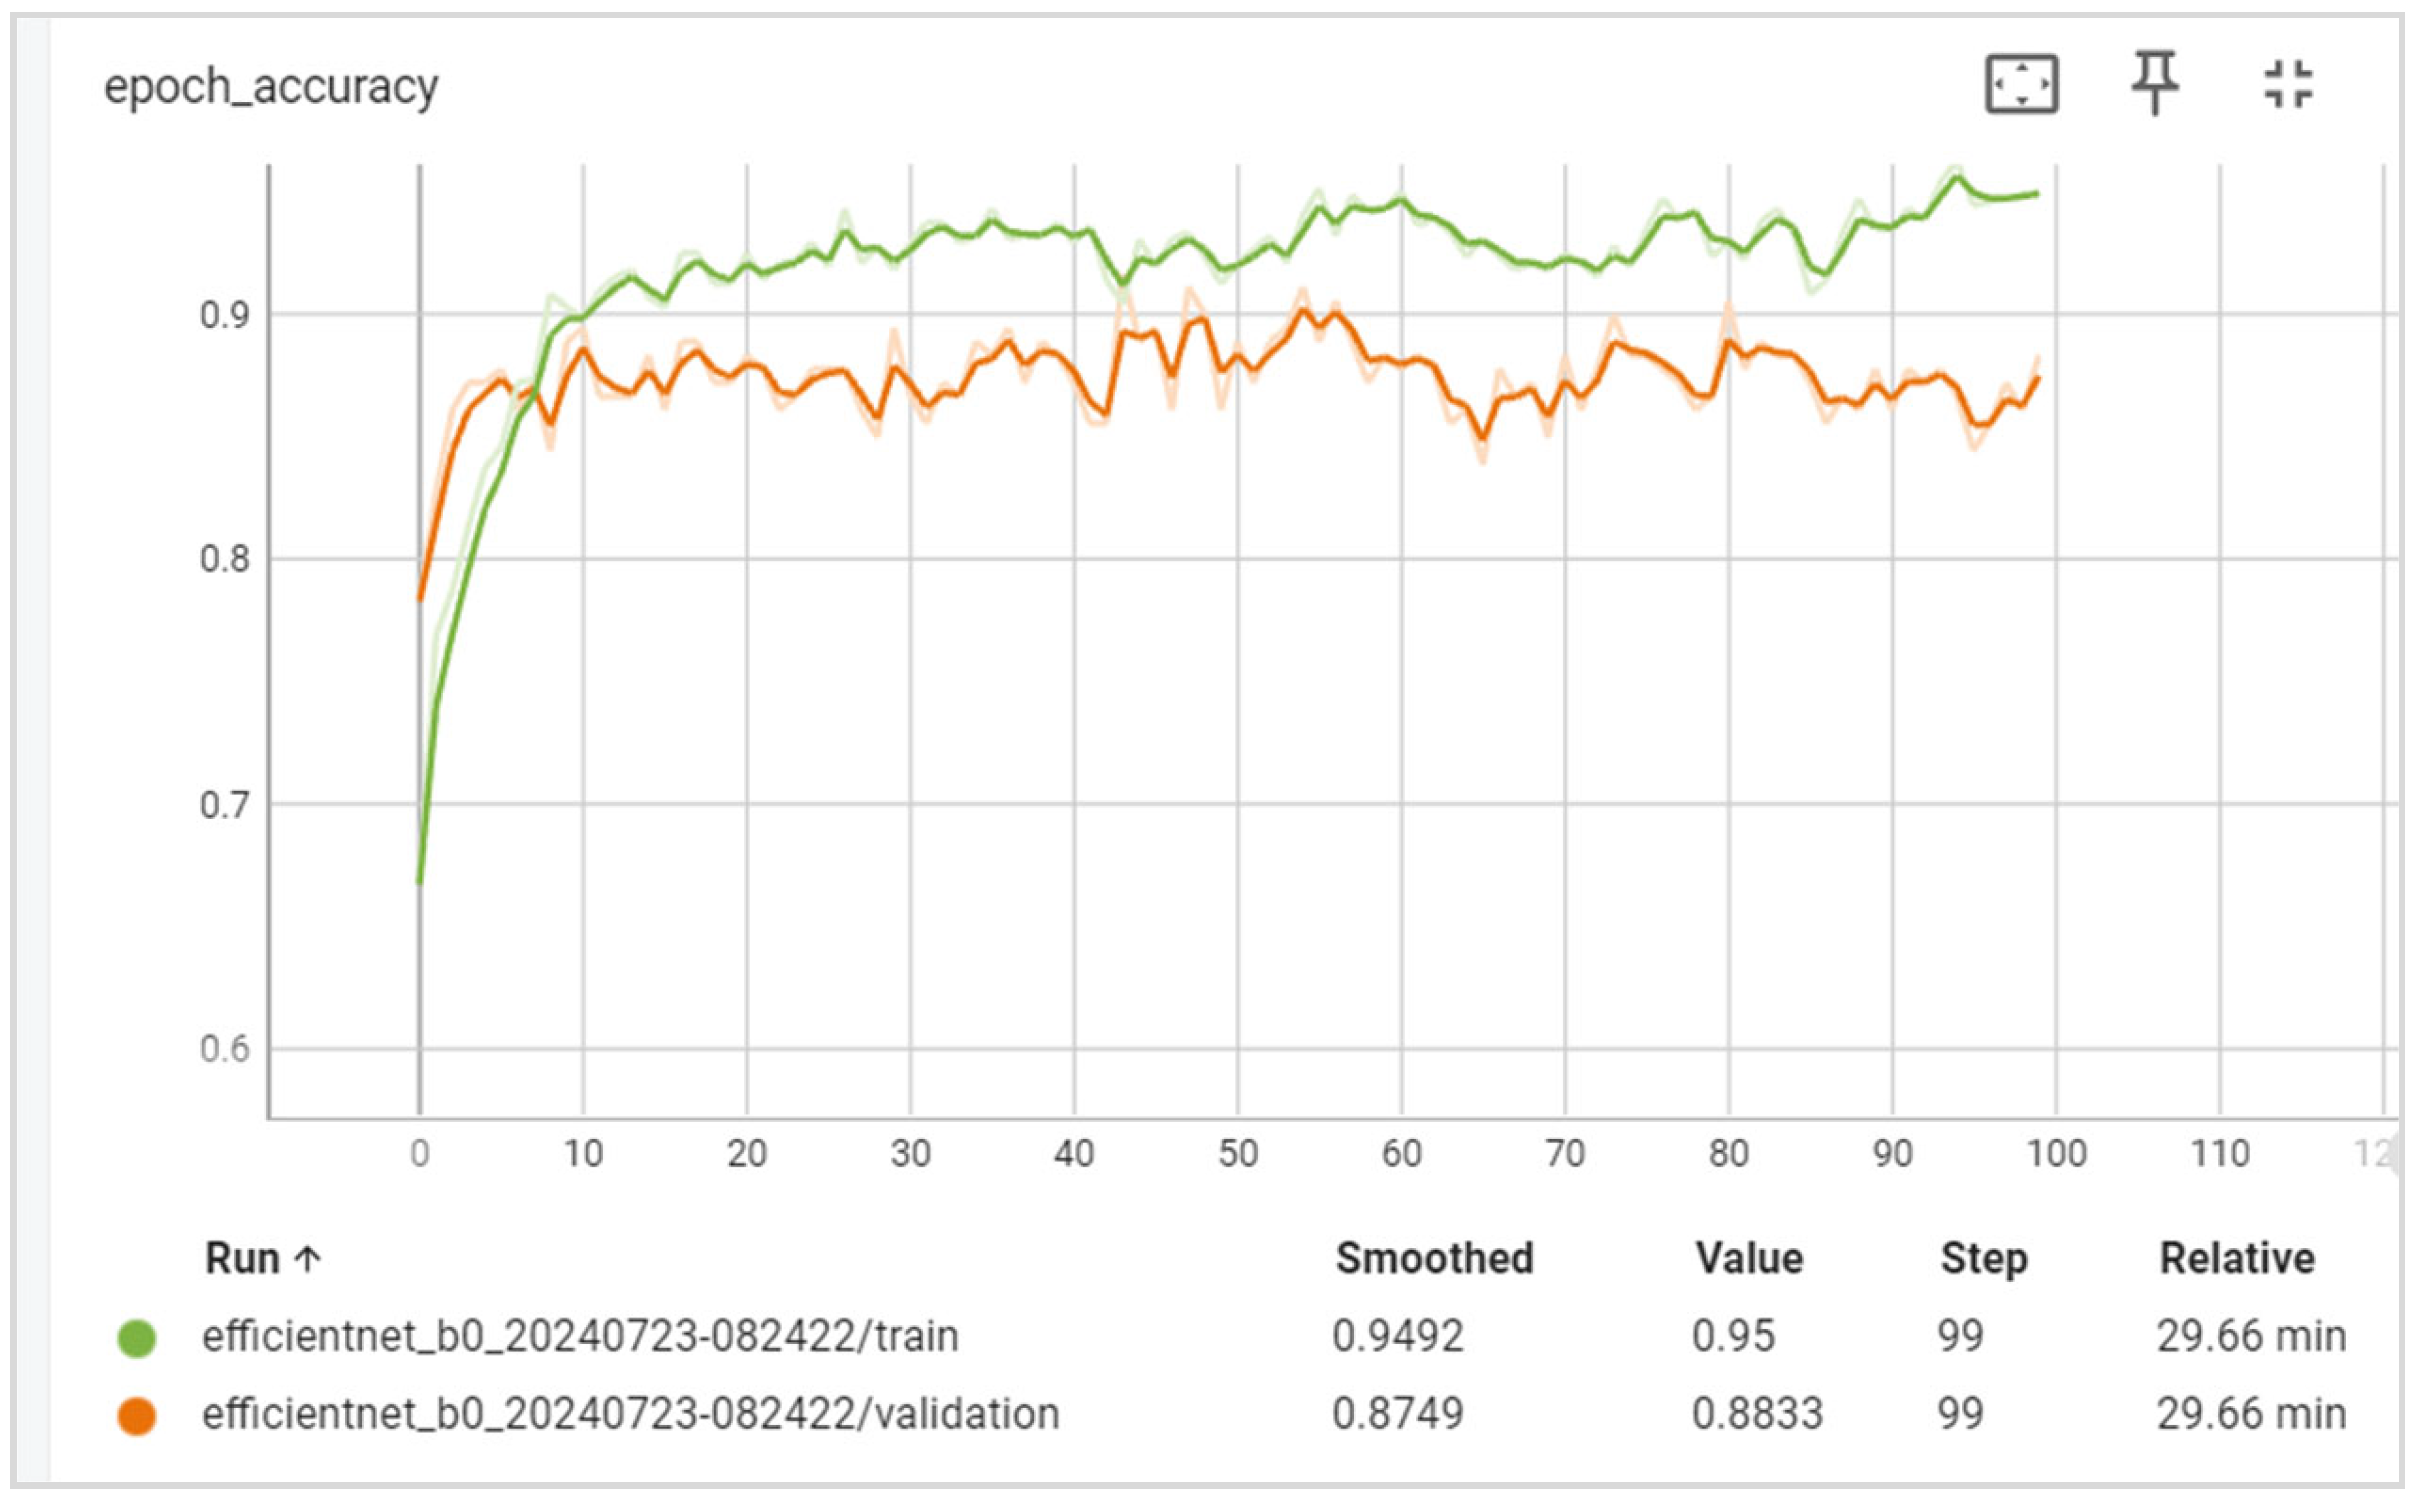
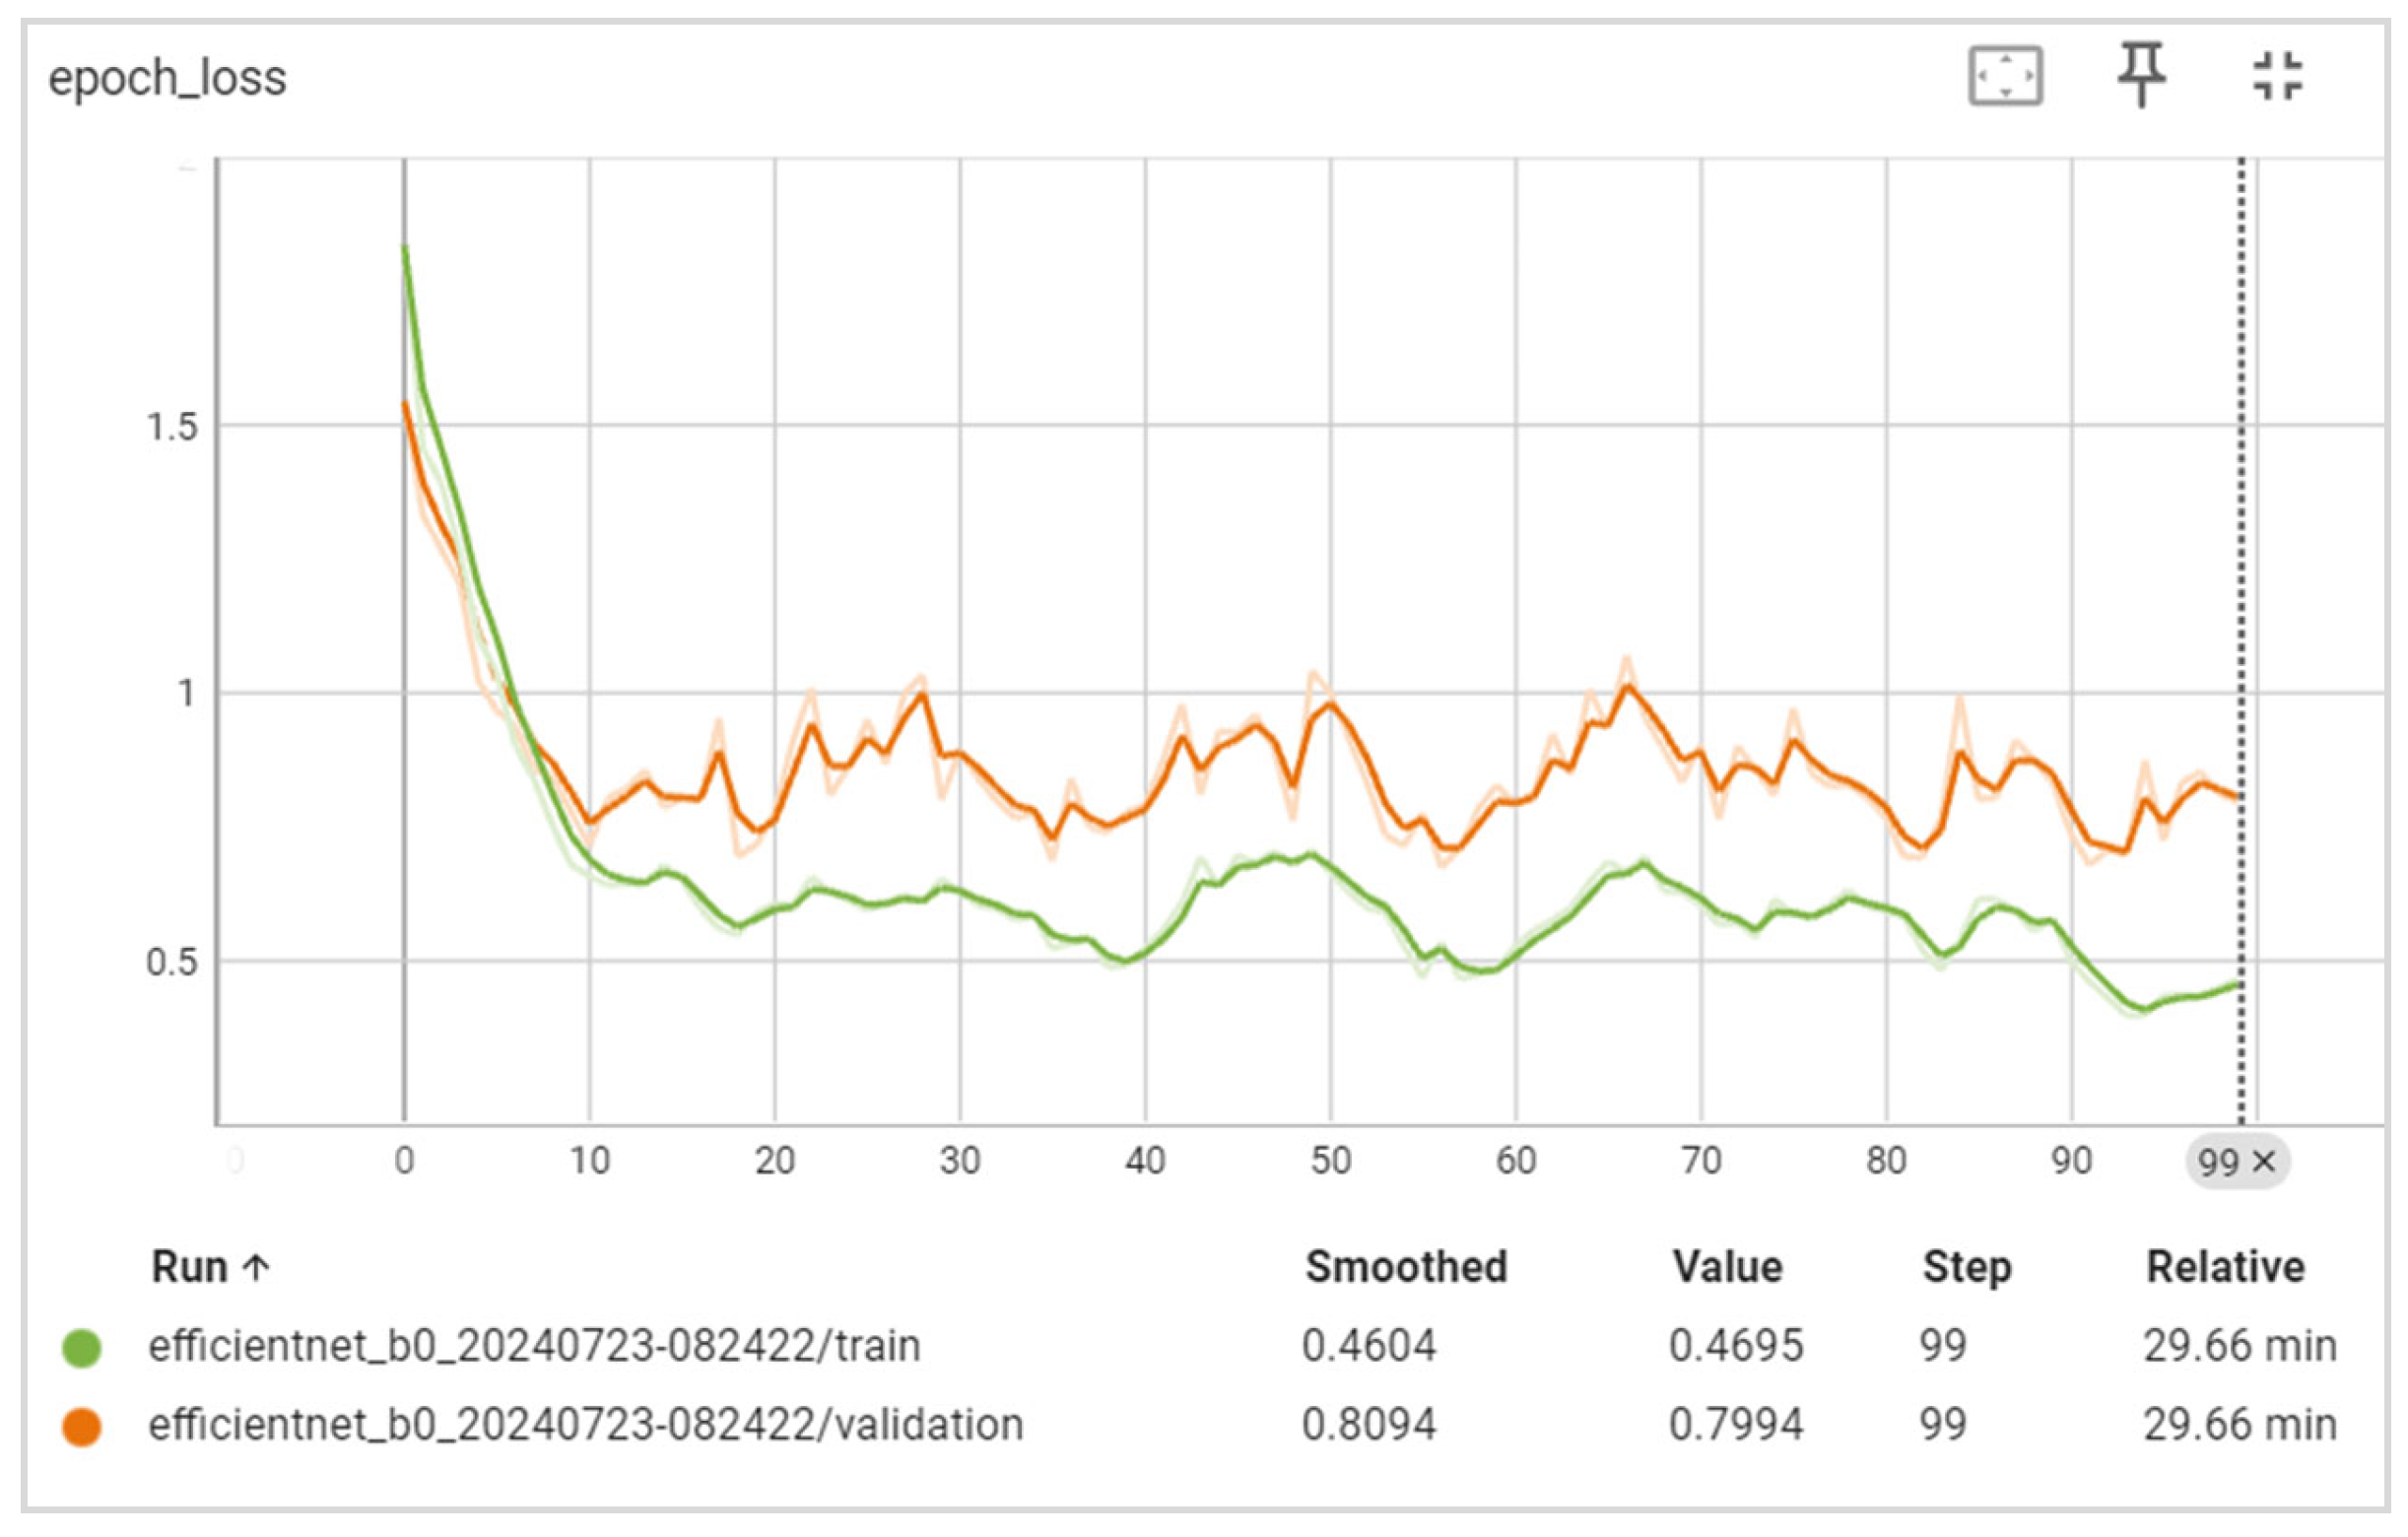
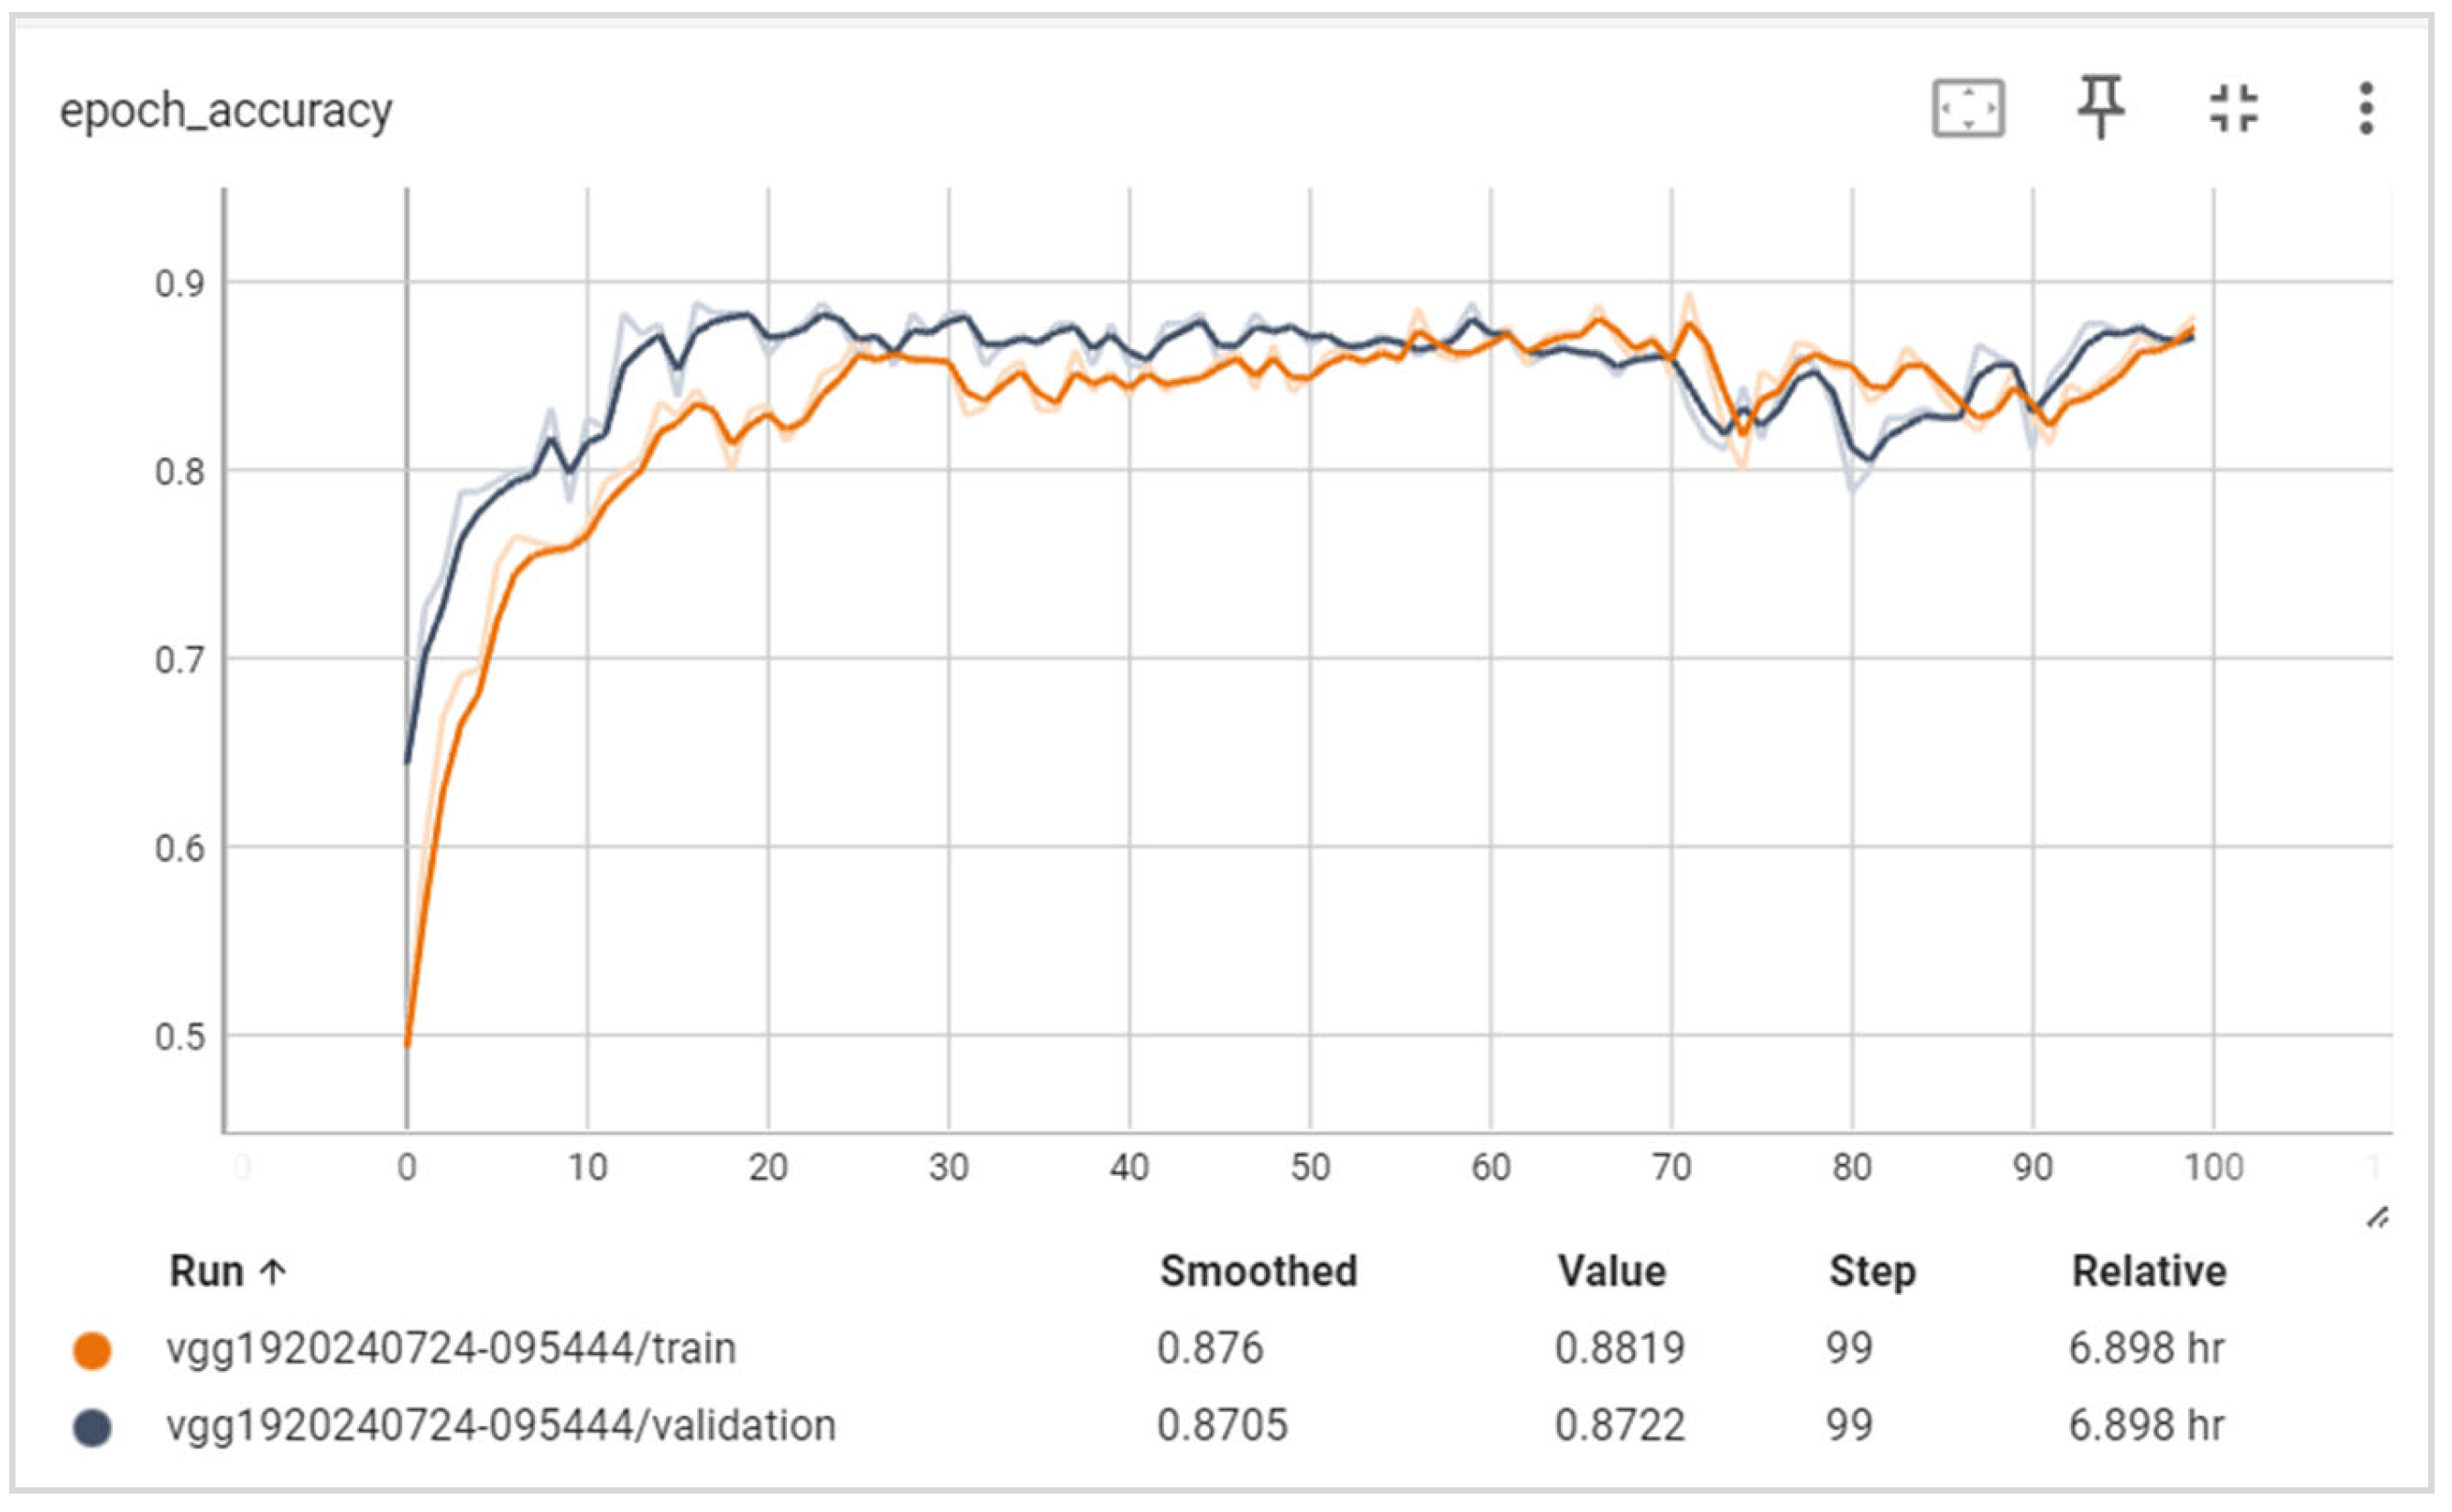
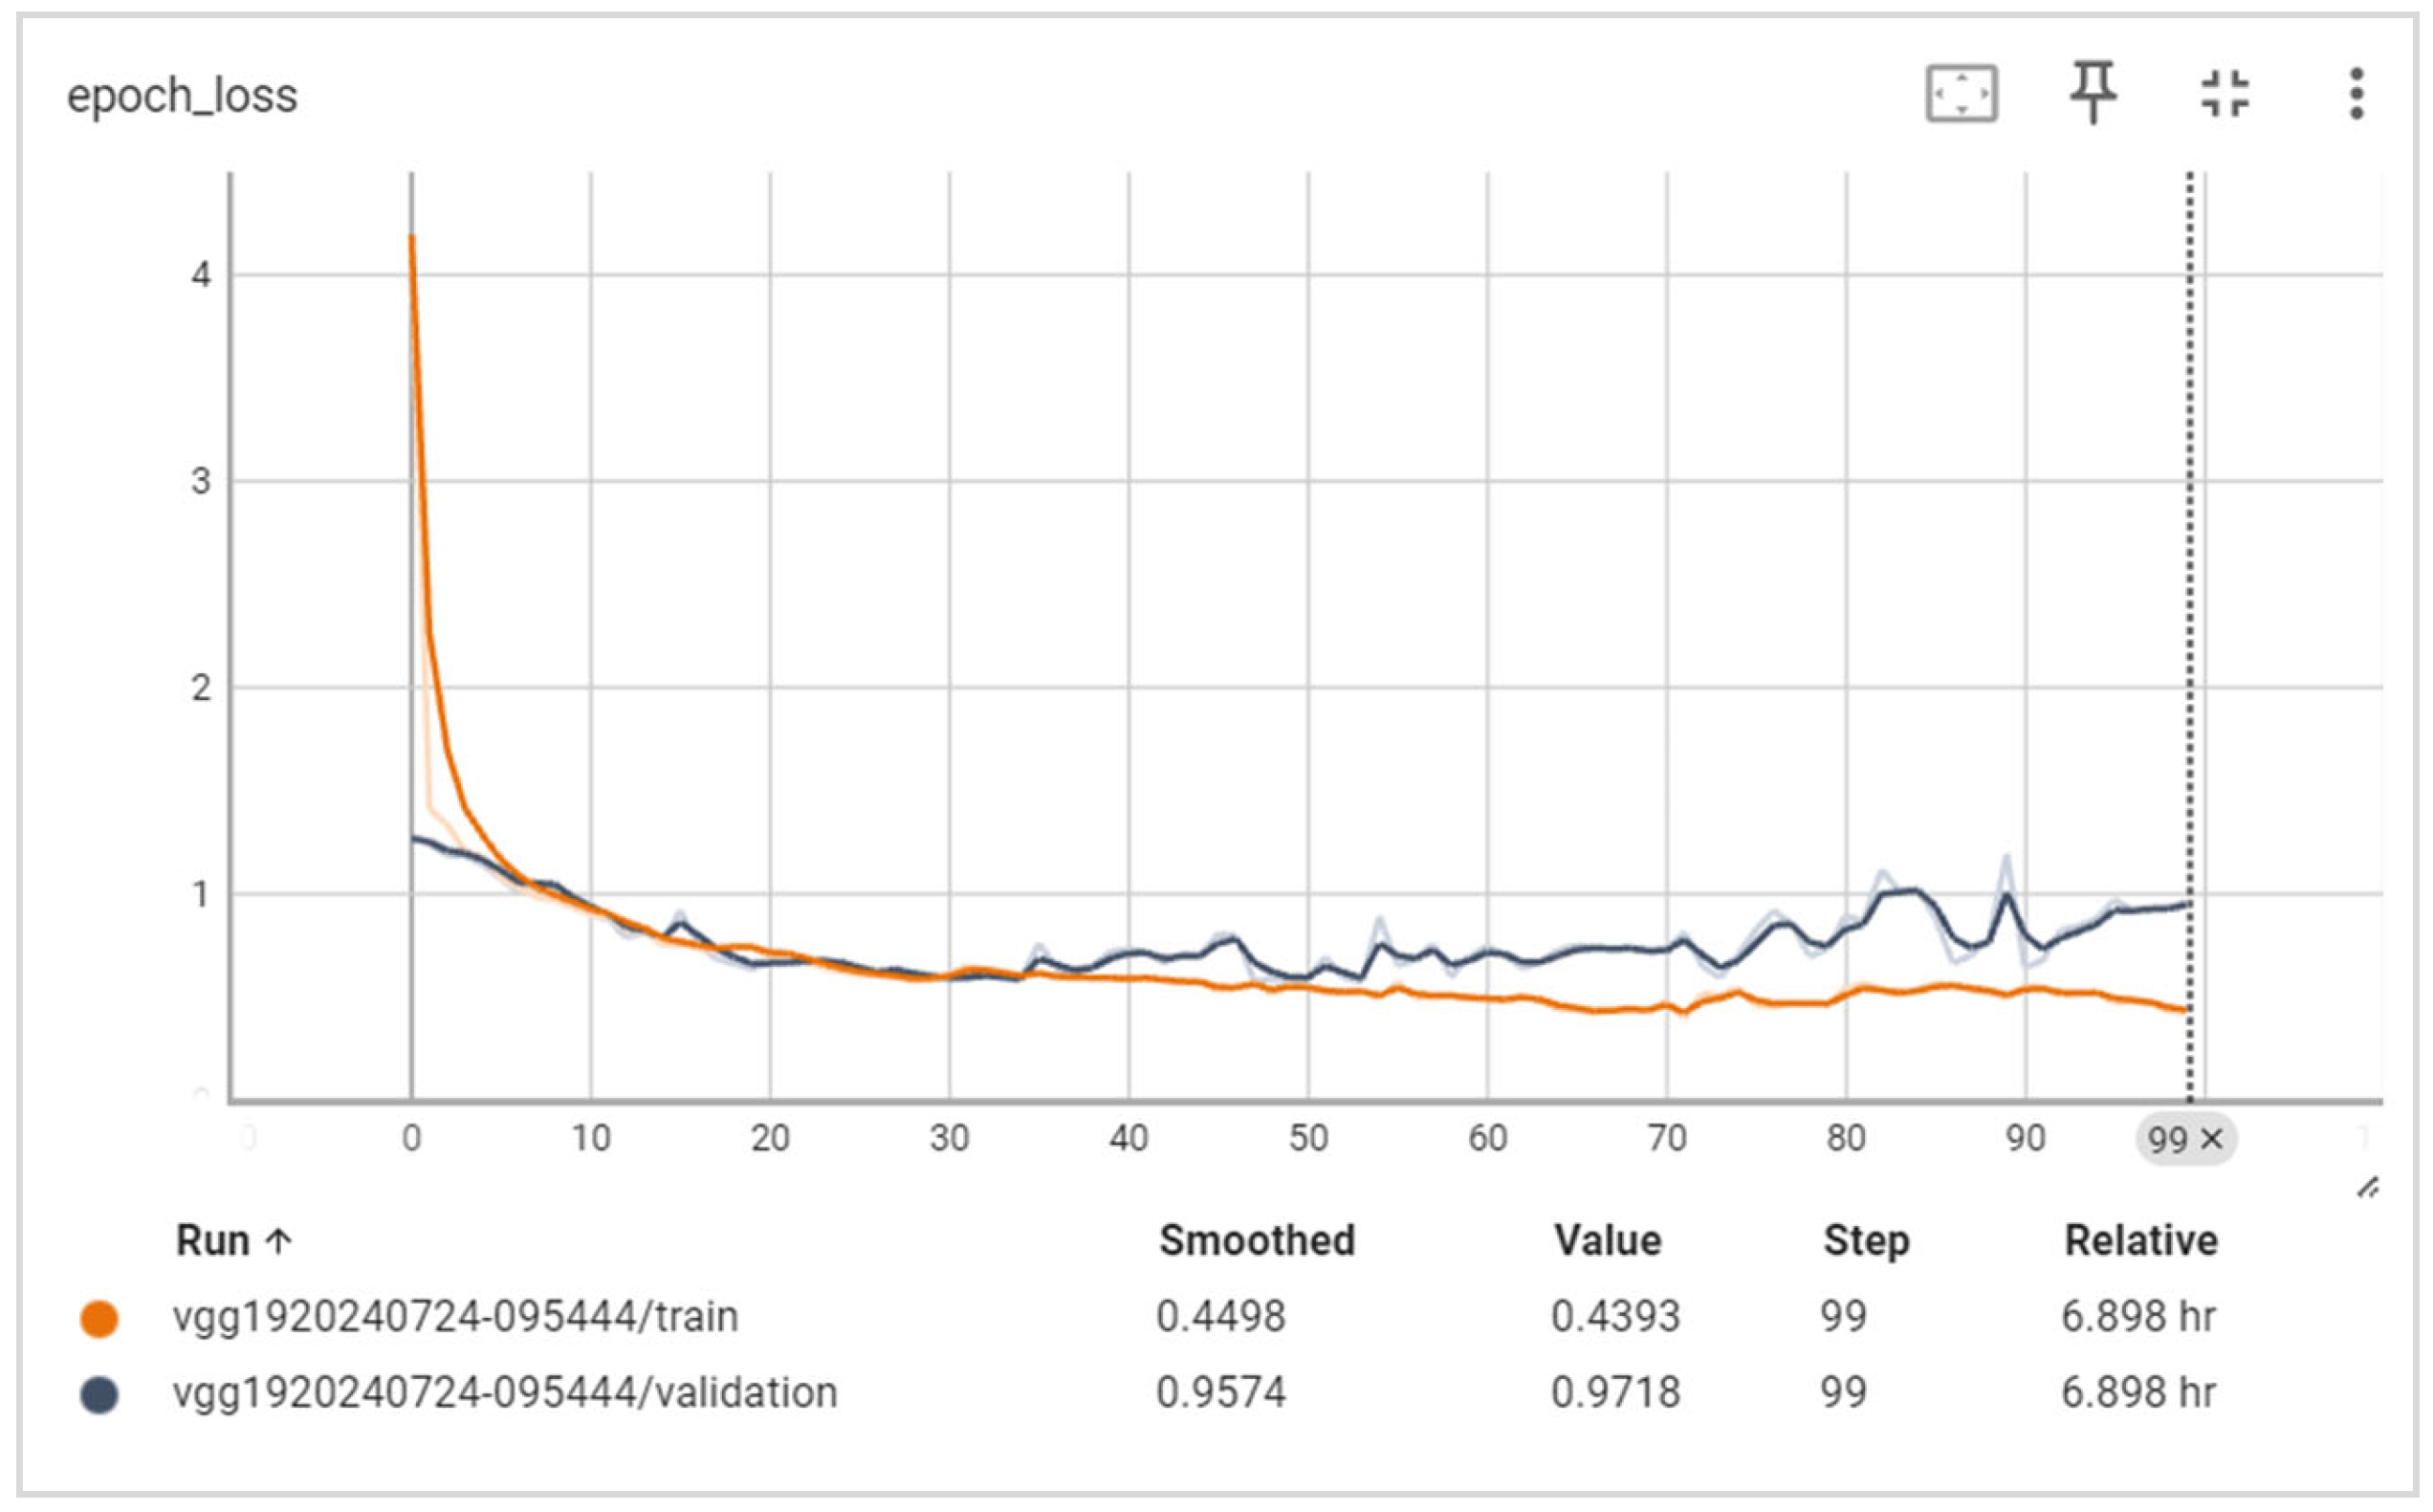
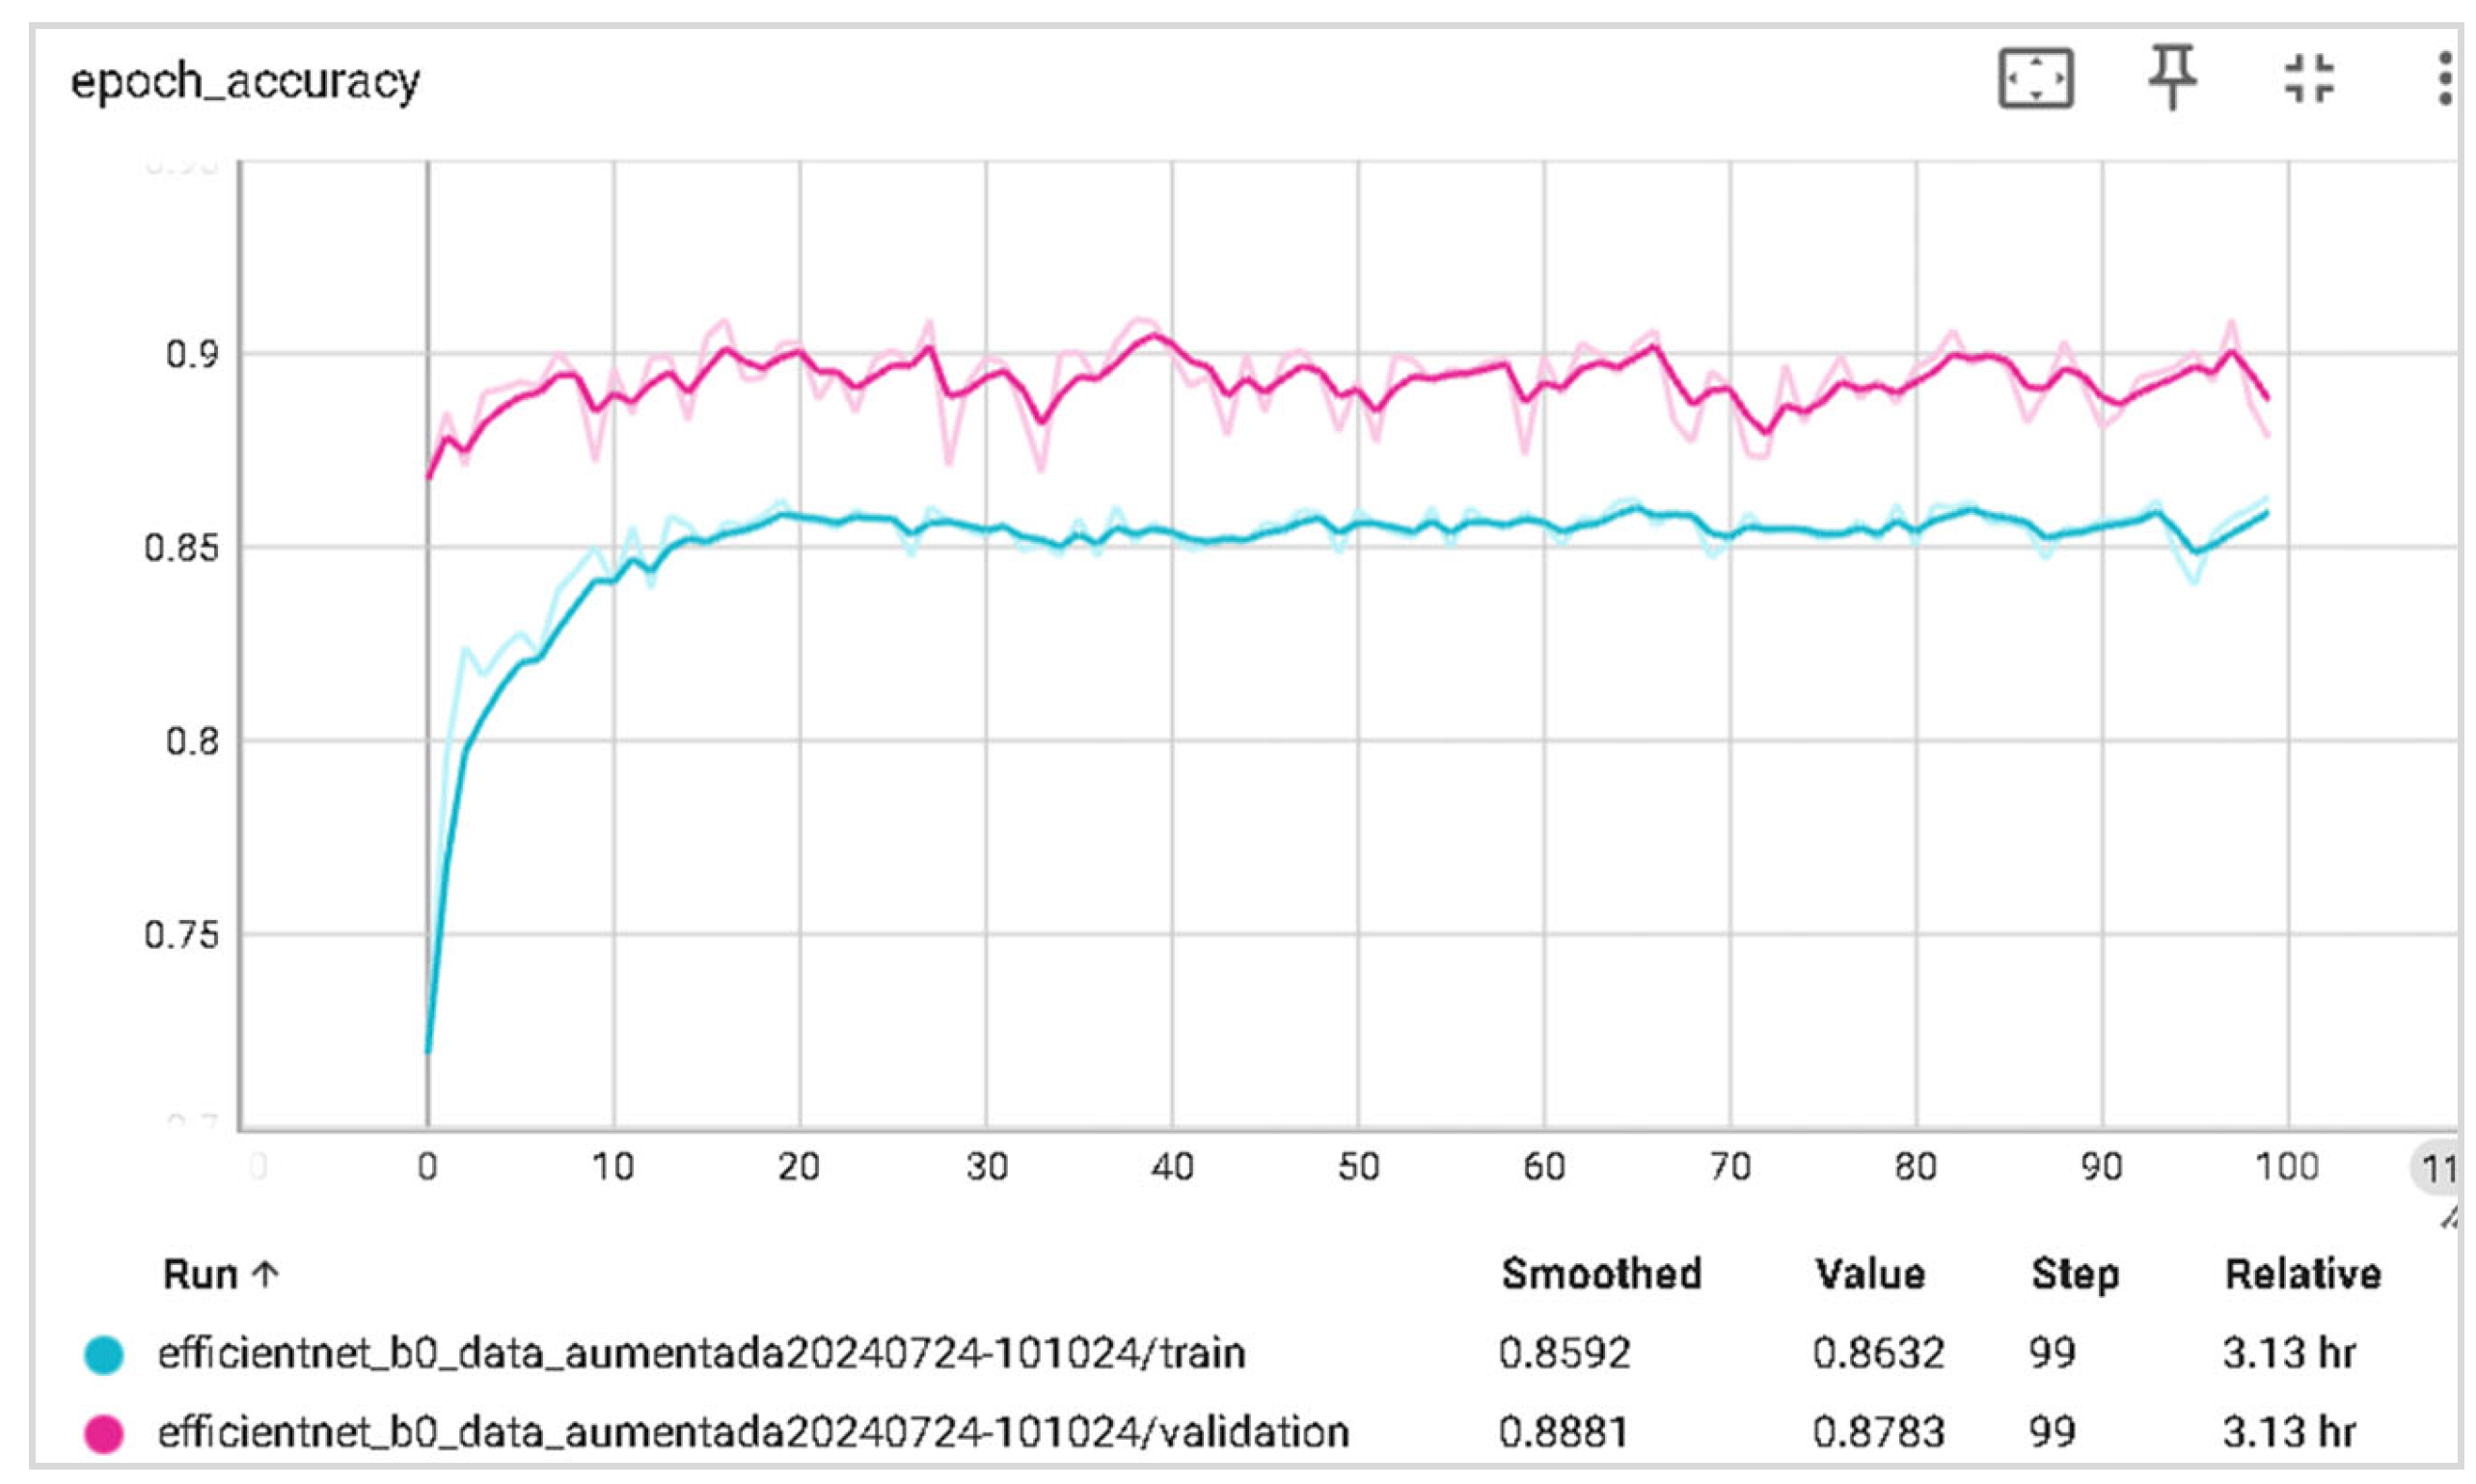
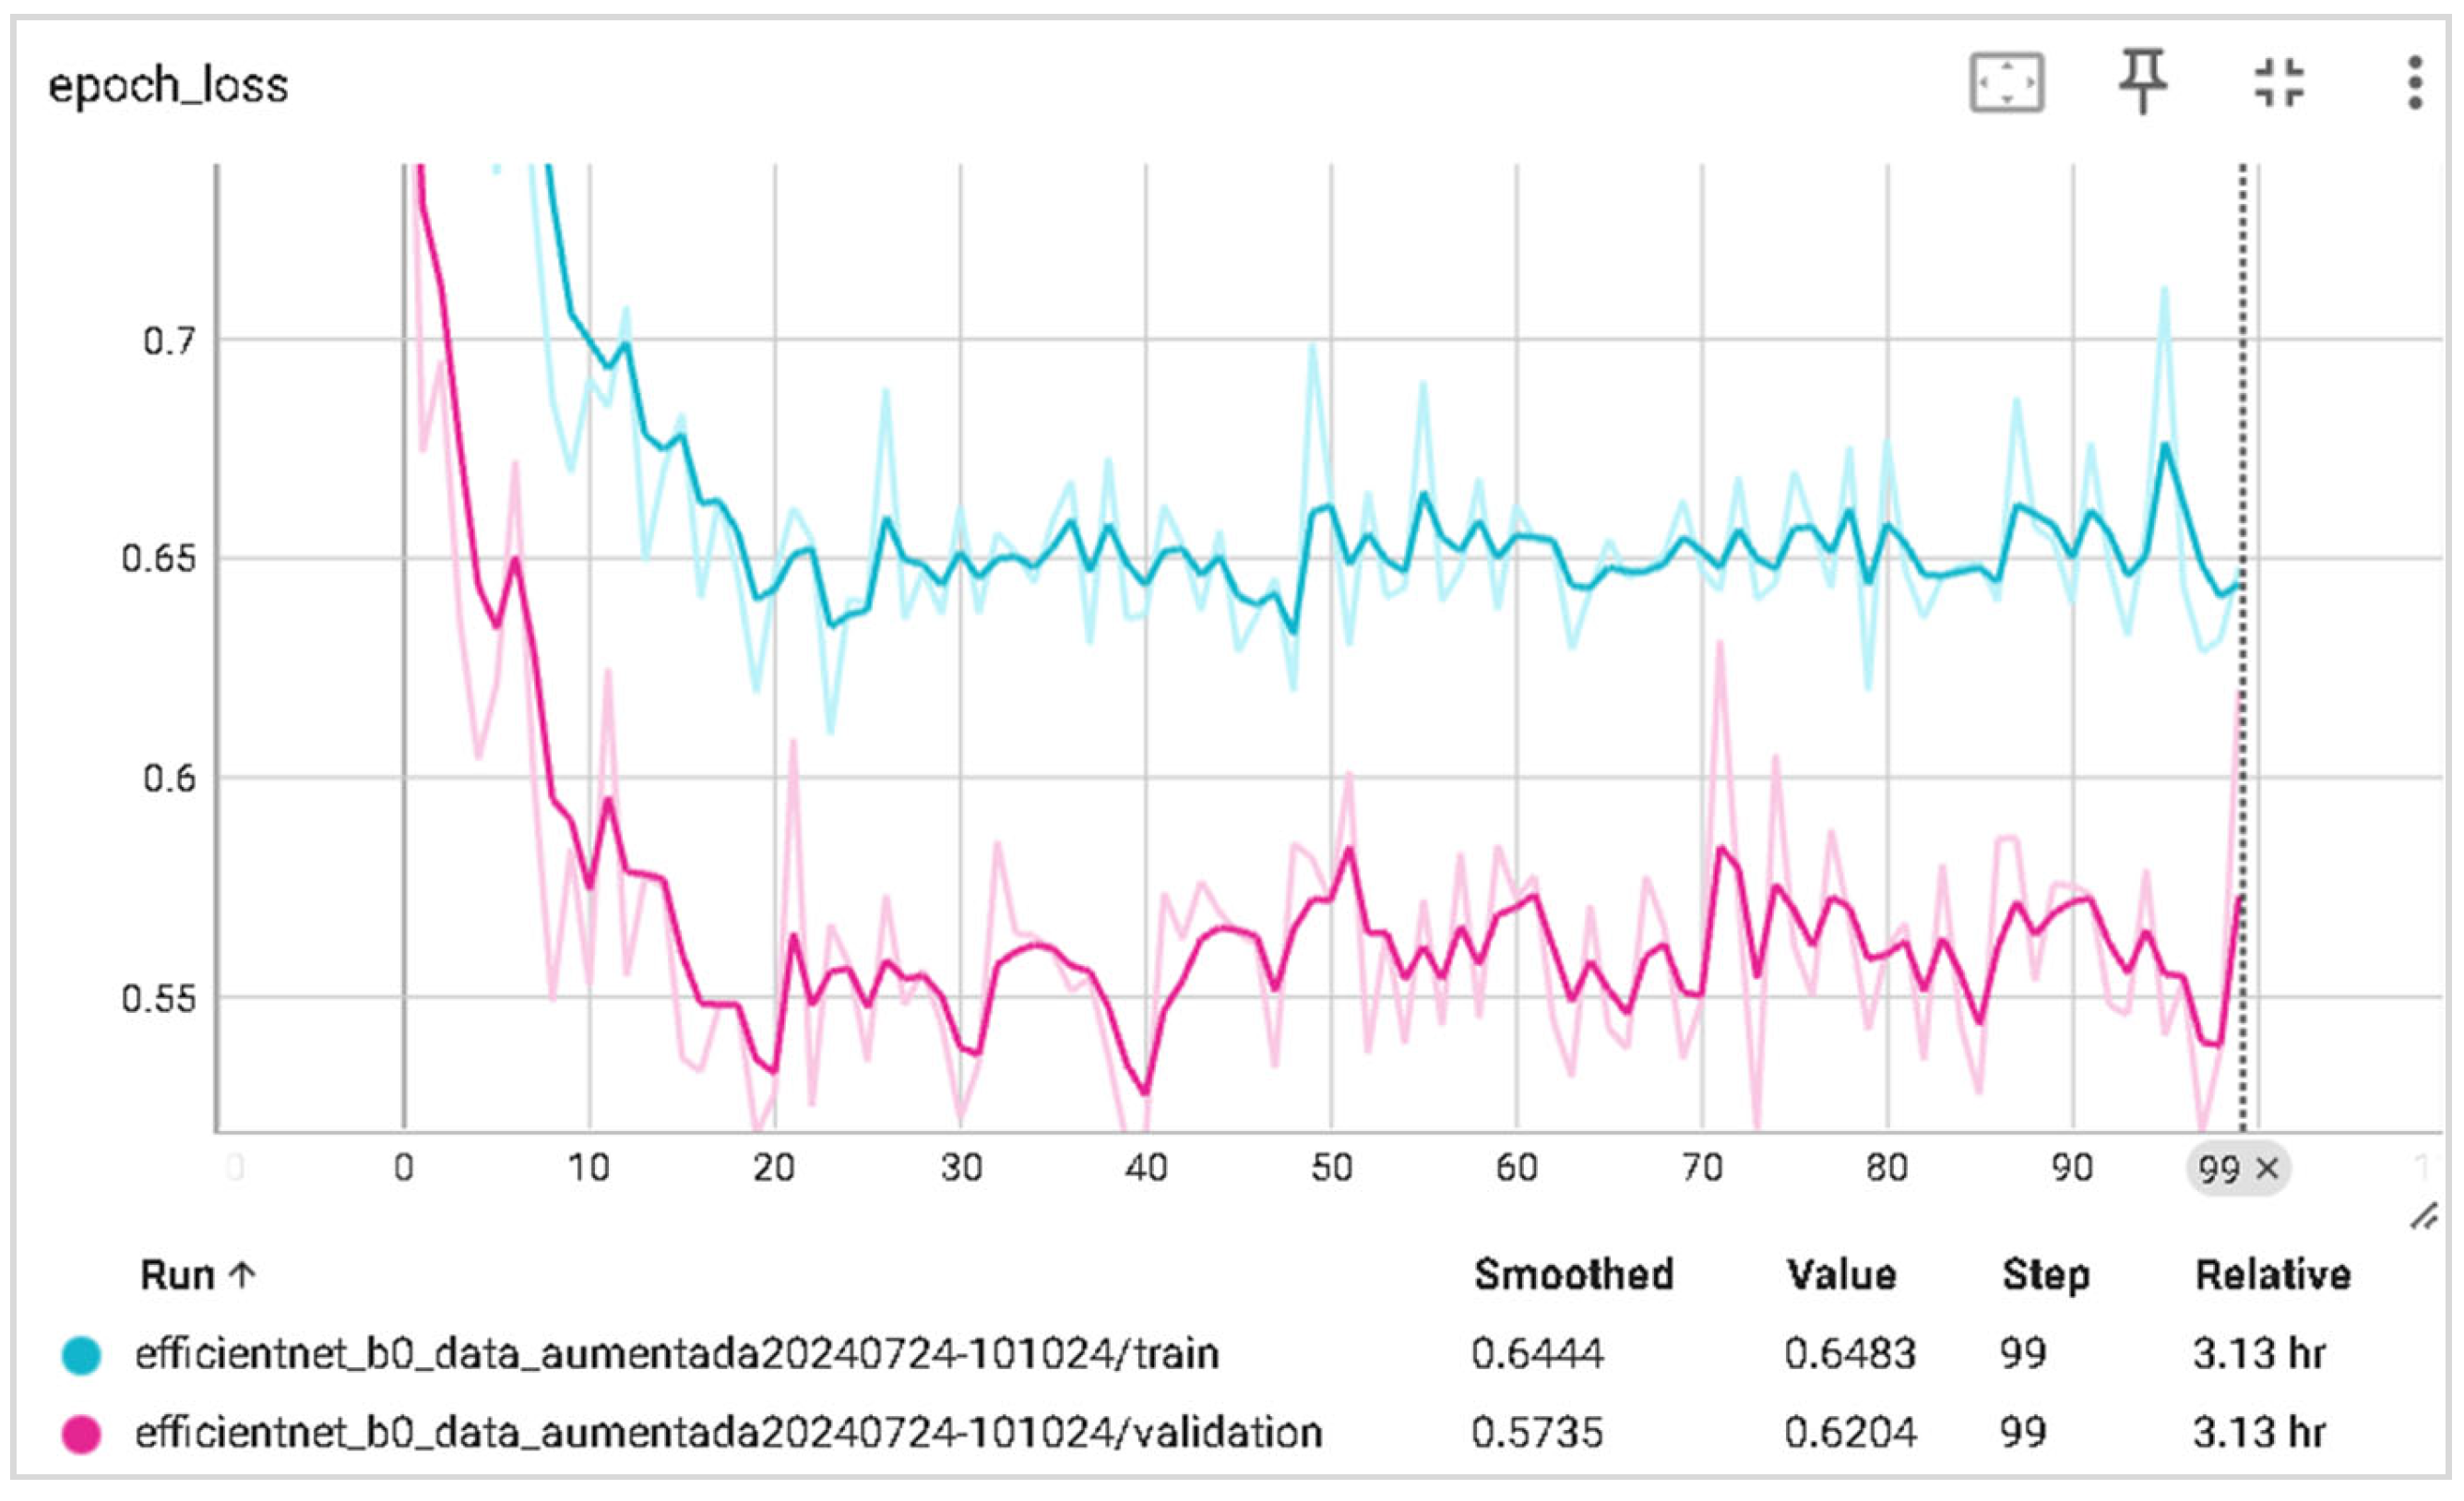
6.2. Training and Validation Precision and Loss
6.3. Generalization Capabilities
6.4. Training Time
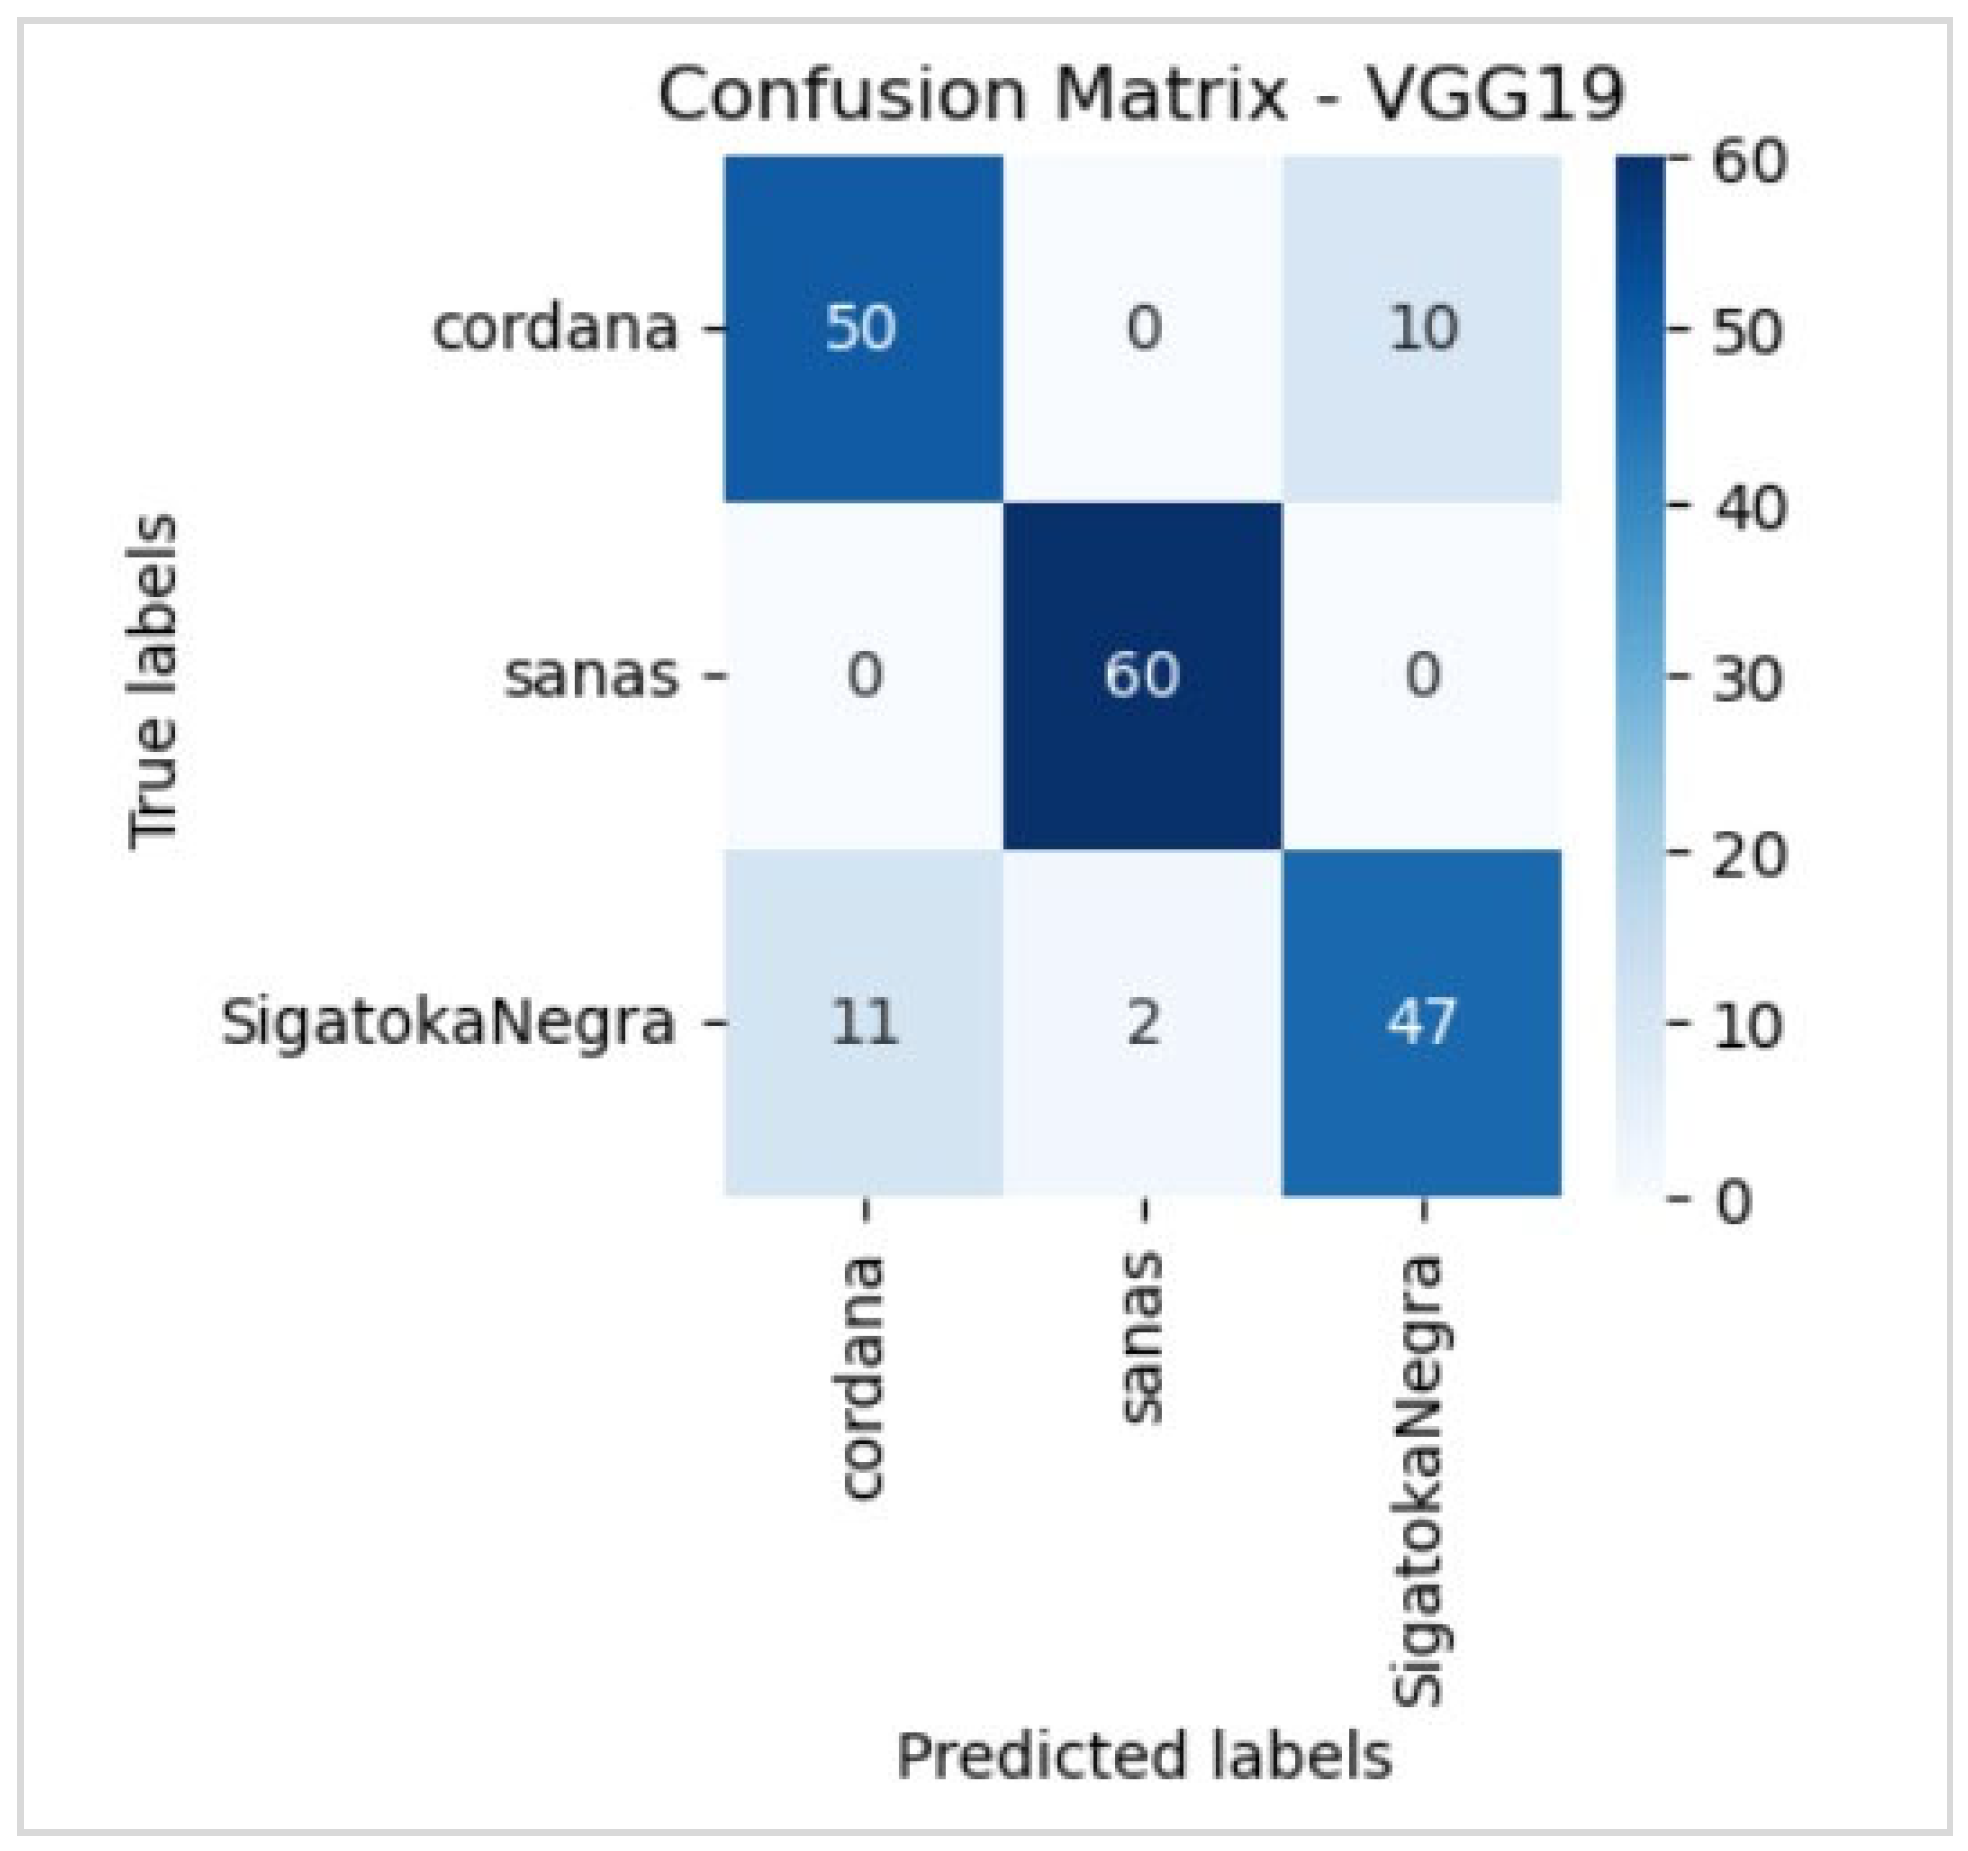
6.5. Disease Classification Performance
6.6. Comparison with the Results of Other Studies
- The scarcity of specific studies on the detection of Cordana and Black Sigatoka using neural networks;
- Few works that compare the performance of different neural network architectures in the detection of these pathologies;
- Complexity in the collection and annotation of high-quality images, considering the similarity in the foliar lesions of these diseases.
7. Conclusions
Author Contributions
Funding
Institutional Review Board Statement
Informed Consent Statement
Data Availability Statement
Acknowledgments
Conflicts of Interest
Abbreviations
| CNN | Convolutional Neural Network |
| ResNet | Residual Network |
| VGG | Visual Geometry Group |
| PPV | Positive Predictive Value |
| NPV | Negative Predictive Value |
| TPR | True Positive Rate |
| TNR | True Negative Rate |
| TP | True Positives |
| TF | True Negatives |
| FP | False Positives |
| FN | False Negatives |
References
- Ciancio, A.; Rosso, L.C.; Lopez-Cepero, J.; Colagiero, M. Rhizosphere 16S-ITS Metabarcoding Profiles in Banana Crops Are Affected by Nematodes, Cultivation, and Local Climatic Variations. Front. Microbiol. 2022, 13, 855110. [Google Scholar] [CrossRef] [PubMed]
- Voora, V.; Larrea, C.; Bermudez, S. Global Market Report: Bananas; International Institute for Sustainable Development: Winnipeg, MB, Canada, 2020. [Google Scholar]
- Esguera, J.G.; Balendres, M.A.; Paguntalan, D.P. Overview of the Sigatoka Leaf Spot Complex in Banana and Its Current Management. Trop. Plants 2024, 3, e002. [Google Scholar] [CrossRef]
- Strobl, E.; Mohan, P. Climate and the Global Spread and Impact of Bananas’ Black Leaf Sigatoka Disease. Atmosphere 2020, 11, 947. [Google Scholar] [CrossRef]
- Yonow, T.; Ramirez-Villegas, J.; Abadie, C.; Darnell, R.E.; Ota, N.; Kriticos, D.J. Black Sigatoka in Bananas: Ecoclimatic Suitability and Disease Pressure Assessments. PLoS ONE 2019, 14, e0220601. [Google Scholar] [CrossRef]
- Mathew, D.; Kumar, C.S.; Anita Cherian, K. Classification of Leaf Spot Diseases in Banana Using Pre-Trained Convolutional Neural Networks. In Proceedings of the 2023 International Conference on Control, Communication and Computing (ICCC), Thiruvananthapuram, India, 19–21 May 2023; pp. 1–5. [Google Scholar]
- Lin, H.; Zhou, G.; Chen, A.; Li, J.; Li, M.; Zhang, W.; Hu, Y.; Yu, W.T. EM-ERNet for Image-Based Banana Disease Recognition. J. Food Meas. Charact. 2021, 15, 4696–4710. [Google Scholar] [CrossRef]
- Salehin, Y.; Siddique, A.; Nafisa, A.T.; Jahan, I.; Priyanka, M.M.; Ul Islam, R.; Hasan, M.; Rahman, A.; Rashid, M.R.A. A Comparative Analysis on Transfer Learning Models to Classify Banana Diseases- Fusarium Wilt and Black Sigatoka. In Proceedings of the 2024 2nd International Conference on Advancement in Computation & Computer Technologies (InCACCT), Gharuan, India, 2–3 May 2024; pp. 208–213. [Google Scholar]
- Elinisa, C.A.; Mduma, N. Mobile-Based Convolutional Neural Network Model for the Early Identification of Banana Diseases. Smart Agric. Technol. 2024, 7, 100423. [Google Scholar] [CrossRef]
- Thiagarajan, J.D.; Kulkarni, S.V.; Jadhav, S.A.; Waghe, A.A.; Raja, S.P.; Rajagopal, S.; Poddar, H.; Subramaniam, S. Analysis of Banana Plant Health Using Machine Learning Techniques. Sci. Rep. 2024, 14, 15041. [Google Scholar] [CrossRef]
- Banana Leaf Spot Diseases (BananaLSD) Dataset. Available online: https://www.kaggle.com/datasets/shifatearman/bananalsd (accessed on 19 December 2024).
- Rajalakshmi, N.R.; Saravanan, S.; Arunpandian, J.; Mathivanan, S.K.; Jayagopal, P.; Mallik, S.; Qin, G. Early Detection of Banana Leaf Disease Using Novel Deep Convolutional Neural Network. J. Data Sci. Intell. Syst. 2024. [Google Scholar] [CrossRef]
- Sanga, S.L.; Machuve, D.; Jomanga, K. Mobile-Based Deep Learning Models for Banana Disease Detection. Eng. Technol. Appl. Sci. Res. 2020, 10, 5674–5677. [Google Scholar] [CrossRef]
- Blanc-Talon, J.; Delmas, P.; Philips, W.; Popescu, D.; Scheunders, P. (Eds.) Advanced Concepts for Intelligent Vision Systems: 20th International Conference, ACIVS 2020, Auckland, New Zealand, 10–14 February 2020, Proceedings; Lecture Notes in Computer Science; Springer International Publishing: Cham, Switzerland, 2020; Volume 12002, ISBN 978-3-030-40604-2. [Google Scholar]
- Abbas, A.; Jain, S.; Gour, M.; Vankudothu, S. Tomato Plant Disease Detection Using Transfer Learning with C-GAN Synthetic Images. Comput. Electron. Agric. 2021, 187, 106279. [Google Scholar] [CrossRef]
- PlantVillage Dataset. Available online: https://www.kaggle.com/datasets/abdallahalidev/plantvillage-dataset (accessed on 20 November 2024).
- Atila, Ü.; Uçar, M.; Akyol, K.; Uçar, E. Plant Leaf Disease Classification Using EfficientNet Deep Learning Model. Ecol. Inform. 2021, 61, 101182. [Google Scholar] [CrossRef]
- Jadhav, S.B.; Udupi, V.R.; Patil, S.B. Identification of Plant Diseases Using Convolutional Neural Networks. Int. J. Inf. Technol. 2021, 13, 2461–2470. [Google Scholar] [CrossRef]
- Anh, P.T.; Duc, H.T.M. A Benchmark of Deep Learning Models for Multi-Leaf Diseases for Edge Devices. In Proceedings of the 2021 International Conference on Advanced Technologies for Communications (ATC), Ho Chi Minh City, Vietnam, 14–16 October 2021; pp. 318–323. [Google Scholar]
- PlantVillage. Available online: https://www.kaggle.com/datasets/mohitsingh1804/plantvillage (accessed on 20 November 2024).
- Liu, J.; Wang, X. Plant Diseases and Pests Detection Based on Deep Learning: A Review. Plant Methods 2021, 17, 22. [Google Scholar] [CrossRef] [PubMed]
- Hamed, B.S.; Hussein, M.M.; Mousa, A.M. Plant Disease Detection Using Deep Learning. Int. J. Intell. Syst. Appl. 2023, 15, 38–50. [Google Scholar] [CrossRef]
- Amjoud, A.B.; Amrouch, M. Object Detection Using Deep Learning, CNNs and Vision Transformers: A Review. IEEE Access 2023, 11, 35479–35516. [Google Scholar] [CrossRef]
- Bangalore Vijayakumar, S.; Chitty-Venkata, K.T.; Arya, K.; Somani, A.K. ConVision Benchmark: A Contemporary Framework to Benchmark CNN and ViT Models. AI 2024, 5, 1132–1171. [Google Scholar] [CrossRef]
- Rivas-Asanza, W.; Mazon-Olivo, B.; Tusa-Jumbo, E. Reconocimiento de Patrones En Imágenes. In Redes Neuronales Artificiales Aplicadas al Reconocimiento de Patrones; Rivas-Asanza, W., Mazon-Olivo, B., Eds.; Universidad Técnica de Machala: Machala, Ecuador, 2018; pp. 61–126. ISBN 978-9942-24-100. [Google Scholar]
- Moya, E.; Campoverde, E.; Tusa, E.; Ramirez-Morales, I.; Rivas, W.; Mazon, B. Multi-Category Classification of Mammograms by Using Convolutional Neural Networks. In Proceedings of the 2017 International Conference on Information Systems and Computer Science (INCISCOS), Quito, Ecuador, 23–25 November 2017; pp. 133–140. [Google Scholar]
- Rivas-Asanza, W.; Mazon-Olivo, B.; Mejía-Peñafiel, E. Generalidades de Las Redes Neuronales Artificiales. In Redes Neuronales Artificiales Aplicadas al Reconocimiento de Patrones; Rivas-Asanza, W., Mazon-Olivo, B., Eds.; Universidad Técnica de Machala: Machala, Ecuador, 2018; pp. 11–35. ISBN 978-9942-24-100. [Google Scholar]
- González, Y.; Rivas-Asanza, W.; Mazon-Olivo, B.; Tusa, E. Revision of Classification Schemes in Tissue Carcinogenic Mammography Images. Alternativas 2018, 19, 72–83. [Google Scholar] [CrossRef]
- Turay, T.; Vladimirova, T. Toward Performing Image Classification and Object Detection with Convolutional Neural Networks in Autonomous Driving Systems: A Survey. IEEE Access 2022, 10, 14076–14119. [Google Scholar] [CrossRef]
- Chen, L.; Li, S.; Bai, Q.; Yang, J.; Jiang, S.; Miao, Y. Review of Image Classification Algorithms Based on Convolutional Neural Networks. Remote Sens. 2021, 13, 4712. [Google Scholar] [CrossRef]
- Diwan, T.; Anirudh, G.; Tembhurne, J.V. Object Detection Using YOLO: Challenges, Architectural Successors, Datasets and Applications. Multimed. Tools Appl. 2023, 82, 9243–9275. [Google Scholar] [CrossRef]
- Elaraby, A.; Hamdy, W.; Alruwaili, M. Optimization of Deep Learning Model for Plant Disease Detection Using Particle Swarm Optimizer. Comput. Mater. Contin. 2022, 71, 4019–4031. [Google Scholar] [CrossRef]
- Ali, A.H.; Yaseen, M.G.; Aljanabi, M.; Abed, S.A.; Gpt, C. Transfer Learning: A New Promising Techniques. Mesopotamian J. Big Data 2023, 2023, 29–30. [Google Scholar] [CrossRef]
- Zhang, X.; Gao, J. Measuring Feature Importance of Convolutional Neural Networks. IEEE Access 2020, 8, 196062–196074. [Google Scholar] [CrossRef]
- Amin, H.; Darwish, A.; Hassanien, A.E.; Soliman, M. End-to-End Deep Learning Model for Corn Leaf Disease Classification. IEEE Access 2022, 10, 31103–31115. [Google Scholar] [CrossRef]
- Khomidov, M.; Lee, J.-H. The Novel EfficientNet Architecture-Based System and Algorithm to Predict Complex Human Emotions. Algorithms 2024, 17, 285. [Google Scholar] [CrossRef]
- Yapici, M.M.; Tekerek, A.; Topaloglu, N. Performance Comparison of Convolutional Neural Network Models on GPU. In Proceedings of the 2019 IEEE 13th International Conference on Application of Information and Communication Technologies (AICT), 23–25 October 2019; IEEE: Baku, Azerbaijan; pp. 1–4. [Google Scholar]
- Singh, V.; Baral, A.; Kumar, R.; Tummala, S.; Noori, M.; Yadav, S.V.; Kang, S.; Zhao, W. A Hybrid Deep Learning Model for Enhanced Structural Damage Detection: Integrating ResNet50, GoogLeNet, and Attention Mechanisms. Sensors 2024, 24, 7249. [Google Scholar] [CrossRef]
- J., A.; Eunice, J.; Popescu, D.E.; Chowdary, M.K.; Hemanth, J. Deep Learning-Based Leaf Disease Detection in Crops Using Images for Agricultural Applications. Agronomy 2022, 12, 2395. [Google Scholar] [CrossRef]
- Nguyen, T.-H.; Nguyen, T.-N.; Ngo, B.-V. A VGG-19 Model with Transfer Learning and Image Segmentation for Classification of Tomato Leaf Disease. AgriEngineering 2022, 4, 871–887. [Google Scholar] [CrossRef]
- Awan, M.J.; Masood, O.A.; Mohammed, M.A.; Yasin, A.; Zain, A.M.; Damaševičius, R.; Abdulkareem, K.H. Image-Based Malware Classification Using VGG19 Network and Spatial Convolutional Attention. Electronics 2021, 10, 2444. [Google Scholar] [CrossRef]
- Rodrigues, I.; Santos, G.L.; Sadok, D.F.H.; Endo, P.T. Classifying COVID-19 positive X-ray using deep learning models. IEEE Lat. Am. Trans. 2021, 19, 884–892. [Google Scholar] [CrossRef]
- Iman, M.; Arabnia, H.R.; Rasheed, K. A Review of Deep Transfer Learning and Recent Advancements. Technologies 2023, 11, 40. [Google Scholar] [CrossRef]
- Yosinski, J.; Clune, J.; Bengio, Y.; Lipson, H. How Transferable Are Features in Deep Neural Networks? In Proceedings of the Advances in Neural Information Processing Systems 27 (NIPS’14), Montreal, QC, Canada, 8–13 December 2014. [Google Scholar]
- Ardalan, Z.; Subbian, V. Transfer Learning Approaches for Neuroimaging Analysis: A Scoping Review. Front. Artif. Intell. 2022, 5, 780405. [Google Scholar] [CrossRef] [PubMed]
- Ahmad, S.; Ansari, S.U.; Haider, U.; Javed, K.; Rahman, J.U.; Anwar, S. Confusion Matrix-Based Modularity Induction into Pretrained CNN. Multimed. Tools Appl. 2022, 81, 23311–23337. [Google Scholar] [CrossRef]
- Chipindu, L.; Mupangwa, W.; Mtsilizah, J.; Nyagumbo, I.; Zaman-Allah, M. Maize Kernel Abortion Recognition and Classification Using Binary Classification Machine Learning Algorithms and Deep Convolutional Neural Networks. AI 2020, 1, 361–375. [Google Scholar] [CrossRef]
- Arias-Duart, A.; Mariotti, E.; Garcia-Gasulla, D.; Alonso-Moral, J.M. A Confusion Matrix for Evaluating Feature Attribution Methods. In Proceedings of the 2023 IEEE/CVF Conference on Computer Vision and Pattern Recognition Workshops (CVPR), Vancouver, BC, Canada, 17–24 June 2023; pp. 3709–3714. [Google Scholar]
- Zapeta Hernández, A.; Galindo Rosales, G.A.; Juan Santiago, H.J.; Martínez Lee, M. Métricas de rendimiento para evaluar el aprendizaje automático en la clasificación de imágenes petroleras utilizando redes neuronales convolucionales. Cienc. Lat. Rev. Cient. Multidiscip. 2022, 6, 4624–4637. [Google Scholar] [CrossRef]
- Machine Learning for Brain Disorders; Colliot, O., Ed.; Neuromethods; Springer: New York, NY, USA, 2023; Volume 197, ISBN 978-1-07-163194-2. [Google Scholar]
- Strelcenia, E.; Prakoonwit, S. Improving Classification Performance in Credit Card Fraud Detection by Using New Data Augmentation. AI 2023, 4, 172–198. [Google Scholar] [CrossRef]
- George, C.A.; Barrera, E.A.; Nelson, K.P. Applying the Decisiveness and Robustness Metrics to Convolutional Neural Networks. arXiv 2020, arXiv:2006.00058. [Google Scholar]
- Wong, A. NetScore: Towards Universal Metrics for Large-Scale Performance Analysis of Deep Neural Networks for Practical On-Device Edge Usage. In Proceedings of the Image Analysis and Recognition: 16th International Conference, ICIAR 2019, Waterloo, ON, Canada, 27–29 August 2019. [Google Scholar]
- Hui, L.; Belkin, M. Evaluation of Neural Architectures Trained with Square Loss vs Cross-Entropy in Classification Tasks. arXiv 2020, arXiv:2006.07322. [Google Scholar]
- Zhao, H.; Gallo, O.; Frosio, I.; Kautz, J. Loss Functions for Neural Networks for Image Processing. arXiv 2018, arXiv:1511.08861v3. [Google Scholar]
- Lopez-Betancur, D.; Bosco Duran, R.; Guerrero-Mendez, C.; Zambrano Rodríguez, R.; Saucedo Anaya, T. Comparación de arquitecturas de redes neuronales convolucionales para el diagnóstico de COVID-19. Comput. Sist. 2021, 25, 601–615. [Google Scholar] [CrossRef]
- Schröer, C.; Kruse, F.; Gómez, J.M. A Systematic Literature Review on Applying CRISP-DM Process Model. Procedia Comput. Sci. 2021, 181, 526–534. [Google Scholar] [CrossRef]
- Zhang, Y.; Wa, S.; Liu, Y.; Zhou, X.; Sun, P.; Ma, Q. High-Accuracy Detection of Maize Leaf Diseases CNN Based on Multi-Pathway Activation Function Module. Remote Sens. 2021, 13, 4218. [Google Scholar] [CrossRef]
- Balafas, V.; Karantoumanis, E.; Louta, M.; Ploskas, N. Machine Learning and Deep Learning for Plant Disease Classification and Detection. IEEE Access 2023, 11, 114352–114377. [Google Scholar] [CrossRef]
- Mahouachi, D.; Akhloufi, M.A. Recent Advances in Infrared Face Analysis and Recognition with Deep Learning. AI 2023, 4, 199–233. [Google Scholar] [CrossRef]
- Linero-Ramos, R.; Parra-Rodríguez, C.; Espinosa-Valdez, A.; Gómez-Rojas, J.; Gongora, M. Assessment of Dataset Scalability for Classification of Black Sigatoka in Banana Crops Using UAV-Based Multispectral Images and Deep Learning Techniques. Drones 2024, 8, 503. [Google Scholar] [CrossRef]
- Yan, K.; Shisher, M.K.C.; Sun, Y. A Transfer Learning-Based Deep Convolutional Neural Network for Detection of Fusarium Wilt in Banana Crops. AgriEngineering 2003, 5, 2381–2394. [Google Scholar] [CrossRef]


| Parameter | Value |
|---|---|
| Input size | 224 × 224 |
| Batch size | 64 |
| Number of epochs | 100 |
| Optimizer | Adam |
| Learning rate | 1 × 10⁻³ |
| Include_top | False |
| Weights | ImageNet |
| Pooling | Flatten |
| Classes | 3 |
| Classifier activation | Softmax |
| Class | Metric | ResNet50 | EfficientNetB0 | VGG19 |
|---|---|---|---|---|
| Black Sigatoka | Accuracy Recall F1 score | 94% 73% 82% | 84% 82% 83% | 82% 78% 80% |
| Cordana | Accuracy Recall F1 score | 73% 82% 77% | 82% 83% 86% | 78% 80% 82% |
| Healthy | Accuracy Recall F1 score | 100% 98% 99% | 94% 98% 96% | 97% 100% 98% |
| Global | Accuracy | 88.90% | 88.33% | 87.22% |
| Authors | Classes Considered | # Images | Model Used | Accuracy |
|---|---|---|---|---|
| Linero-Ramos et al. [61] | Total images | 3180 | EfficientNetV2B3 | 87.33% |
| Black Sigatoka | 1890 | VGG19 | 83.94% | |
| Healthy | 1290 | MobileNetV2 | 77.20% | |
| Sanga et al. [13] | Fusarium wilt race 1 | 3000 * | ResNet152 | 99.20% |
| Black Sigatoka | Inceptionv3 | 95.41% | ||
| Yan K., Chowdhury K., and Jin S. [62] | Total images | 156 | ||
| Fusarium wilt race | 72 | ResNet50 | 98.00% | |
| Healthy | 84 | |||
| Elinisa, Mduma [9] | Fusarium wilt race | 27.360 * | CNN model | 91.17% |
| Black Sigatok | ||||
| Healthy | ||||
| Rajalakshmi N. et al. [12] | Total images | 803 | DCNN | 98.92% |
| Cordana | 86 | |||
| Healthy | 164 | |||
| Pestalotiopsis | 131 | |||
| Sigatoka | 422 | |||
| Models applied in our proposed work | Total images | 900 | EfficientNetB0 | 88.33% |
| Black Sigatoka | 300 | ResNet50 | 88.90% | |
| Cordana | 300 | VGG19 | 87.22% | |
| Healthy | 300 |
Disclaimer/Publisher’s Note: The statements, opinions and data contained in all publications are solely those of the individual author(s) and contributor(s) and not of MDPI and/or the editor(s). MDPI and/or the editor(s) disclaim responsibility for any injury to people or property resulting from any ideas, methods, instructions or products referred to in the content. |
© 2025 by the authors. Licensee MDPI, Basel, Switzerland. This article is an open access article distributed under the terms and conditions of the Creative Commons Attribution (CC BY) license (https://creativecommons.org/licenses/by/4.0/).
Share and Cite
Jiménez, N.; Orellana, S.; Mazon-Olivo, B.; Rivas-Asanza, W.; Ramírez-Morales, I. Detection of Leaf Diseases in Banana Crops Using Deep Learning Techniques. AI 2025, 6, 61. https://doi.org/10.3390/ai6030061
Jiménez N, Orellana S, Mazon-Olivo B, Rivas-Asanza W, Ramírez-Morales I. Detection of Leaf Diseases in Banana Crops Using Deep Learning Techniques. AI. 2025; 6(3):61. https://doi.org/10.3390/ai6030061
Chicago/Turabian StyleJiménez, Nixon, Stefany Orellana, Bertha Mazon-Olivo, Wilmer Rivas-Asanza, and Iván Ramírez-Morales. 2025. "Detection of Leaf Diseases in Banana Crops Using Deep Learning Techniques" AI 6, no. 3: 61. https://doi.org/10.3390/ai6030061
APA StyleJiménez, N., Orellana, S., Mazon-Olivo, B., Rivas-Asanza, W., & Ramírez-Morales, I. (2025). Detection of Leaf Diseases in Banana Crops Using Deep Learning Techniques. AI, 6(3), 61. https://doi.org/10.3390/ai6030061