1. Introduction
The use of stable isotopes, in particular carbon-13 (
13C), has grown significantly over the past few years due to its critical role across various segments such as medical imaging, pharmaceuticals and research purposes. At the core of realizing this demand lies isotopic separation: a competing process for isolating particular isotopes from a mixture. Among various isotopes,
13C [
1] plays a special role due to its distinctive nuclear properties and vast applications.
Primarily, an isotope is a form of the same element which has another (non-quantum) quantity of neutrons. This variation in neutron count results in isotopes having different atomic masses while displaying largely similar chemical behaviors. For example, carbon, the quintessential element, has three isotopes: naturally occurring (in biological processes) carbon-12 and carbon-13, which are stable with respect to radioactive decay, and the isotope referred to as radiogenic carbon-14, which is not generally found in nature but is a product of nuclear synthesis and has an unstable nucleus containing eight neutrons for every six protons.
Additionally, although carbon does occur in many isotopic forms,
12C and
13C are the most abundant stable ones [
2,
3]. In reality, only a small fraction of all carbon is in the less commonly found form of carbon-13 (~1.1%), while 98% or so of total carbon comes from easily detectable and stable forms such as carbon-12 [
4]. Its natural abundance can vary somewhat depending on its source and environmental conditions, so it is useful for understanding geological processes, biological activities or carbon cycling between different ecosystems [
4].
In terrestrial ecosystems, the isotopic fractionation of carbon is described with multiple factors: photosynthetic pathway and biological discrimination processes are reflected in natural abundance levels while
13C abundance and distribution also serve as key indicators to understand/quantify inflows within Earth’s different compartments. Stable carbon isotopes in the composition of soils, sediments and organic matter are useful proxies for determining source–sink relationships and processes involved in conversions of carbon forms on different scales from local to global [
5].
13C is a stable isotope that is particularly useful in tracking the fate of carbon within biogeochemical cycles and understanding which processes are responsible for various reservoirs, including photosynthesis, respiration, decomposition and sequestration. Geological archives record isotopic signatures preserved in materials such as tree rings, ice cores and sediment layers which represent open windows to past but very detailed environmental information like climate variation or ecosystem differences due to natural forces (volcanic activity) and human impacts.
In addition, they can be applied in many other areas ranging from Earth sciences to archeology and others (forensics and paleontology). The study focused on the isotopic analysis of carbonaceous materials such as bone collagen, tooth enamel and organic residues to track dietary behaviors, migration patterns, and food webs in ancient ecosystems. Describing isotopic ratios on varying temporal and spatial scales helps scientists make sense of ancient human histories, ecological relationships and evolutionary change.
Mass spectrometry [
3] and spectroscopic methods have been refined over the past few decades with great strides in precision, sensitivity, and throughput of isotopic measurements compared to previously. Researchers can use high-resolution isotopic profiling to investigate the minutia of isotope fractionation reactions and thus track complex biogeochemical cycling at hitherto unparalleled resolutions. Isotopic data, in combination with numerical models and assimilation techniques for such data, allow us to develop predictive models of natural systems and to perform scenario simulations that are key elements of policy-making as societies struggle with global warming (climate change), managing diminishing high-quality resources, protecting the rainforests, etc.
In brief, the natural abundance and distribution of
13C [
5,
6,
7,
8] are invaluable tracers in carbon dynamics across Earth’s splintered biosphere–geosphere–hydrosphere–atmosphere environment. The isotopic analysis helps researchers’ piece together the complex relationship between natural processes and human-influenced activities, allowing us to make better decisions about how planet Earth is managed. While we try to tackle critical environmental issues and reach sustainable development goals, isotopic tools will remain an essential factor in solving the mysteries of carbon cycle complexities and shedding more light on Earth’s interrelated properties.
Carbon and
13C (a heavier carbon version) are nearly identical in their chemical properties, which makes isolating the rare form a daunting challenge. Fractional distillation and gas diffusion are two traditional separation techniques that do not have the required efficiency, cost-effectiveness or scalability. Therefore, new strategies are urgently required to solve those problems and increase the production yields of
13C isotopes [
9,
10,
11,
12,
13].
Over time, developments in mathematical modeling along with simulation techniques and control strategies have provided new opportunities to optimize isotope separation processes. Such strategies represent the implementation of a formal methodology to unravel intricate isotope ensemble dynamics and engineer separation processes with agility. It provides a way to combine theoretical insight with engineering experience such that control algorithms can be designed for specific setups of the separation process [
14,
15,
16,
17,
18,
19,
20,
21,
22].
In this paper, we develop a complete framework for the modeling, control and simulation of 13C isotopic separation process. We use mathematical models built on first principles of physics and chemistry to describe the dynamics of chemical reactions for isotope exchange as well as mass transport in our data. Here, we conduct extensive simulation studies to benchmark the performance of different separation configurations and provide insight into important parameters affecting overall process efficacy.
Furthermore, we present controlling paradigms to improve the dynamical response and stability of isotope separation systems. We show that significant improvements in product purity, yield, and energy consumption can be made by the use of advanced control algorithms, for example adaptive control techniques. Our application not only increases the operational efficiency of current separation processes but also provides opportunities for new generations of separation technologies based on isotopic targeting.
In order to provide a connection between theory and strategies for isotope separation, this paper will add an important contribution to the technical literature on the growing field of isotopic separations. Using mathematical modeling, simulation, and control studies, our intention is to expedite the development of 13C isotope production so that this highly valued radioisotope can become a modern commodity for scientific as well as industrial usage.
Ref. [
23] explores the optimization of PID controller parameters for integrating processes by minimizing the Integral of Squared Error (ISE) criterion. As traditional ISE minimization often leads to a PD controller that offers good servo response but poor disturbance effect rejection, this study proposes an enhancement by constraining the slope of the Nyquist curve at the gain crossover frequency. This approach improves closed-loop performance, particularly in rejecting load disturbances. The paper reviews existing PID tuning methods, highlighting that many focus on stable overdamped processes rather than integrating processes. It references various methods, such as the Internal Model Control (IMC) and Gain-Phase Margin (KPGM) methods, and discusses their limitations, particularly in handling integrating plus time delay (IPTD) and similar models. The proposed method addresses these limitations by offering analytical expressions to relate PID parameters to plant models, providing better load disturbance effect rejection compared to traditional methods. The simulation results demonstrate the effectiveness of the proposed method across different integrating process models, showing superior performance in terms of ISE values, settling time, and peak output values. The paper concludes that this approach offers a robust solution for tuning PID controllers in integrating processes, making it a valuable contribution to process control strategies.
Contemporary research efforts in fractional-order control are heavily focused on enhancing disturbance effect rejection, a critical performance metric for industrial systems. Advanced optimization techniques, such as Genetic Algorithms, have been successfully employed to design robust fractional-order PID (FOPID) controllers that achieve improved performance by satisfying specific robustness criteria [
24]. Furthermore, theoretical frameworks like the Reference-to-Disturbance Ratio (RDR) have been developed to provide a quantitative foundation for analyzing and optimizing a controller’s inherent ability to suppress disturbances [
25]. While these methods yield high-performing controllers, they often result in a fixed-parameter design that is optimized for a specific set of operational conditions. This presents a significant limitation, as many real-world processes, such as isotopic separation, are characterized by dynamic environments and shifting system dynamics where a fixed optimal controller may become sub-optimal. Consequently, a clear need exists for control strategies that retain the performance benefits of fractional-order design while incorporating the adaptability to maintain robustness in the face of real-time operational variations and disturbances.
Ref. [
26] investigates the cost implications of adopting computer vision techniques for real-time defect detection in ceramics manufacturing, focusing on small and medium-sized enterprises. It evaluates various costs including computational needs, time investments, and data procurement, using quantitative analysis and predictive modeling. The study compares the financial and operational benefits of this advanced system with traditional quality assurance methods. It emphasizes the benefits of on-premises GPUs over cloud-based solutions, especially for companies facing legal or financial constraints. Despite the high initial costs, the research suggests that the long-term benefits, such as enhanced detection accuracy and reduced reliance on manual inspection, may justify the investment. The findings aim to guide resource allocation and offer insights into the feasibility of AI-based quality control in the ceramics industry.
Ref. [
27] addresses the challenge of insufficient training data for applying machine learning in the plastics processing industry, particularly for optimizing injection molding processes. By using network-based transfer learning, the research reduces the amount of data required to train an artificial neural network (ANN) for optimizing machine parameters. Source models from 59 different parts were used to transfer learning to a target process, which significantly reduces the need for extensive new data. The results show that with just four samples from the new process, models can achieve a high degree of determination (R
2 ≥ 0.9). Transfer learning proves most effective when the source models are similar to the target process, achieving notable reductions in required training data—up to 88% compared to conventional methods. The study also highlights the need for further exploration into the influence of part geometry and other factors on transfer learning success, and plans to validate these findings with real experimental data.
Paper [
28] investigates two FPGA-based methods for implementing fractional-order integrators and differentiators using the Grünwald–Letnikov (GL) definition, focusing on fixed window and linear approximation techniques. The linear approximation method significantly reduces the memory requirements associated with fractional-order systems. Fractional-order calculus, which extends traditional calculus to non-integer orders, offers enhanced flexibility and performance in describing complex dynamic systems with memory effects. The fractional-order PID (FOPID) controller, which builds on this calculus, has gained prominence due to its ability to handle more complex system behaviors compared to traditional integer-order PID controllers. This paper details the FPGA implementation of both fractional-order operators and the FOPID controller, using Verilog HDL on a Nexys 4 Artix-7 FPGA XC7A100T. The study provides experimental results and comparisons with previous implementations, demonstrating that the proposed GL methods and the FOPID controller improve hardware resource efficiency and performance, addressing memory dependency issues and achieving better control responses. The findings underscore the practical advantages of using fractional-order calculus in modern control systems and the potential for FPGA-based implementations to enhance industrial and academic applications.
4. The Proposed Solution for the Online Approximation and Adaptation of the Fractional-Order Models
This paper introduces a novel approach by approximating
to the fractional-order integrator function [
29,
30,
31,
32,
33,
34,
35,
36,
37,
38], with the highest accuracy possible. This method aims to enhance the performance of the process and accelerate its overall efficiency. By leveraging this approximation, the paper seeks to optimize process dynamics, resulting in improved operational speed and effectiveness.
The fractional-order integration function to be approximated by
has the following form:
where
represents the differential fractional order.
In this paper, the differential fractional order is considered to be leading to .
In order to compute the fractional-order transfer function of
, it is necessary to apply the Laplace transformation [
39] to (3):
Assuming that the initial conditions are zero,
, (7) can be rewritten as
By applying the Laplace transformation to both sides of the previously presented differential equation,
After replacing (8) in (9), it yields
where
is the Laplace transformation of
.
By rearranging the terms in (10) to solve the equation for
, it leads to
To simulate the equation given in (6) for the transfer function
, a fifth-order Oustaloup approximation [
40,
41] is used. This approximation method is used to model fractional-order systems more accurately. By applying the Oustaloup approximation of fifth order, the fractional-order behavior of the transfer function
is approximated using a rational function with polynomial coefficients. This allows for practical simulation and analysis within standard numerical tools, such as MATLAB version 2021a [
42]. The MATLAB toolbox that allows the implementation of the Oustaloup approximation is the CRONE toolbox [
43]. In order to define a fractional-order transfer function using this toolbox, the “
” function [
43] is used. The parameters of this Oustaloup approximation fractional-order transfer function are presented in (12):
where
is the transfer function’s numerator, which can be defined as a scalar, a cell array, or an exponential function (using ).
is the transfer function’s denominator, which can be defined as a scalar, a cell array, or an exponential function (using ), too.
specifies the Oustaloup approximation order and is defined as a scalar.
defines the lower and upper frequency bounds for the Oustaloup approximation, being a 1 × 2 matrix.
is the character representing the Laplace variable.
is the considered sampling time, defined as a scalar.
specifies the fractional system simulation method, being defined as a string—for example, in this paper, .
This function facilitates the implementation of the Oustaloup approximation by allowing customization of its parameters and order, enabling accurate simulation and analysis of fractional-order systems.
The Oustaloup approximation can be expressed as a ratio of two polynomials in the complex variable
. Specifically, the approximation is formulated as
In this representation,
The numerator polynomial is given by , where are the coefficients of the polynomial in the numerator.
The denominator polynomial is given by , where are the coefficients of the polynomial in the denominator.
This ratio of polynomials provides a rational approximation of the fractional-order transfer function, facilitating practical implementation and analysis in systems requiring fractional calculus.
The neural network model for approximating the variable-order fractional integrator was trained offline on a pre-generated dataset. The subsequent online adaptation refers solely to the real-time tuning of controller parameters based on the output of this fixed, pre-trained model.
To study the time evolution of the fractional-order integrator, the variation of from 0 to 100 is considered. This approach allows for the exploration of how changes in impact the system’s behavior over time. By varying across this range, the simulation can reveal how different values affect the fractional-order integrator, providing insights into the dynamic response of the system under different conditions.
Given the strong nonlinearity of the isotopic separation process, largely due to the significant variation in the fractional-order coefficient , the use of neural networks becomes necessary. This nonlinearity arises from the high likelihood of variation in the fractional differentiation order. To address this, input–output datasets are generated by sampling signals, which are then used to train four distinct neural networks. The input signals for these networks are the fractional-order coefficient (with a step size ), while the output signals are the coefficients of the integer-order transfer function obtained after applying the Oustaloup filter. These neural networks are designed to learn the Oustaloup approximation coefficients effectively.
The process involves two distinct intervals for the fractional-order transfer function, and there is a notable disparity between the coefficients of the denominator and numerator polynomials. To achieve optimal performance in learning the Oustaloup approximation coefficients, two separate neural networks are employed. Each network is tasked with accurately learning and predicting the coefficients to handle the variations and differences in the data.
The neural network architecture utilized in this paper is a feedforward structure [
44], which is trained using the Bayesian regularization learning algorithm. This approach helps in optimizing the network by balancing the fit of the model to the training data with the complexity of the model, thus improving generalization and preventing overfitting. The Bayesian regularization technique adjusts the weights and biases of the network based on a probabilistic framework, leading to more robust and accurate predictions for the Oustaloup approximation coefficients.
A feedforward neural network is a type of artificial neural network where data flows in a single direction from the input layer to the output layer, passing through one or more hidden layers [
45,
46]. This architecture is defined by its straightforward structure: input nodes receive the raw data, which is then processed through hidden layers where computations occur, and finally, the output layer produces the network’s predictions or classifications. Each neuron in a layer is connected to every neuron in the subsequent layer, creating a dense network of connections.
The network’s performance hinges on several key parameters, including the number of layers and the number of neurons in each layer [
46]. The choice of activation functions, such as the sigmoid, hyperbolic tangent (tanh), or Rectified Linear Unit (ReLU), influences how the network learns complex patterns and nonlinear relationships in the data. These functions introduce nonlinearity into the network, enabling it to model more intricate functions.
The neurons in the input layer are responsible for receiving the raw data and passing it to the subsequent layers. Each neuron in this layer represents a feature or attribute of the data. The input layer does not perform any computation beyond forwarding the data to the hidden layers. It essentially acts as the entry point for the data into the network.
The neurons in hidden layers are where most of the computational work occurs. These neurons take the weighted sum of inputs from the previous layer, apply an activation function to introduce nonlinearity, and then pass the result to the next layer. Each neuron in a hidden layer is connected to every neuron in the previous layer via weights, which are parameters learned during training. The weights determine the strength and direction of the influence one neuron has on another. By adjusting these weights, the network learns to recognize patterns and relationships within the data. Hidden layers can be numerous and are where the network captures complex features and representations.
The neurons in the output layer produce the final results of the network’s computations. This layer transforms the weighted sum of inputs from the last hidden layer into the network’s predictions or classifications. The choice of activation function in the output layer depends on the type of problem being solved—e.g., SoftMax for classification tasks or linear activation for regression. The output neurons are connected to the final set of weights, which combine the contributions from the hidden layer to generate the network’s output.
In summary, weights are crucial parameters in a feedforward neural network. They are adjusted through training to minimize the difference between the network’s predictions and the actual outcomes. The network learns by iteratively modifying these weights based on the errors computed during training, thereby improving its performance in making accurate predictions or classifications.
Training a feedforward network involves adjusting the weights and biases of the connections between neurons to minimize a loss function, typically using algorithms like gradient descent and backpropagation. The backpropagation algorithm computes gradients of the loss function with respect to each weight by propagating errors backward through the network, allowing for iterative updates to improve accuracy.
Feedforward networks are versatile and widely used in various domains, including image recognition, natural language processing, and time-series prediction. Their simple and effective architecture makes them suitable for a range of tasks, though they are limited by their inability to handle sequential data or temporal dependencies without modifications, such as incorporating recurrent structures or attention mechanisms.
The feedforward neural network structure which is used in this paper is designed as a universal approximator, meaning it has the capacity to model and learn any continuous function given sufficient network complexity and training data. This property is particularly valuable in capturing complex mathematical dependencies between input signals and output signals. The network’s training algorithm is sophisticated enough to discern and learn these intricate relationships effectively.
It is important to note that the coefficients of the transfer functions resulting from the Oustaloup approximation are non-recursive. Specifically, the coefficients for a given fractional order do not depend on the values of coefficients for other values, and their instantaneous values are independent of previous samples. This non-recursive nature implies that each coefficient is computed in isolation without historical dependencies. Consequently, there is no need for recurrent neural networks, which are designed to handle time-dependent data and temporal dependencies. Instead, the feedforward architecture suffices for this application, as it effectively captures the static relationships between input and output without the need for recursive connections.
Each neural network structure was designed with a single hidden layer to manage the computational complexity during the training process. Adding more hidden layers would significantly increase the computational demands, and this increase does not always translate to improved performance. Therefore, to balance complexity and effectiveness, the network was kept simple with one hidden layer.
The number of neurons in the hidden layer was optimized through an iterative process. The procedure began with four neurons and increased by one neuron with each iteration. The training was repeated until an increase in the number of neurons no longer led to improved performance, indicating that additional neurons were not beneficial and might even degrade the model’s accuracy. This iterative approach ensured that the network was neither underfitted nor excessively complex.
The training was stopped when the Mean Squared Error (MSE) values between the approximated coefficients and their analytical counterparts began to rise, signaling that further training would not be advantageous. Given the nonlinear nature of the parameters being learned, hyperbolic tangent functions (bipolar sigmoid functions) were chosen as the activation functions for the neurons in the hidden layer. These functions help capture the nonlinear relationships effectively.
For each of the two neural networks, the output layer consists of five neurons. Each neuron in the output layer corresponds to a specific coefficient, either for the denominator or numerator of the transfer function. These output neurons use linear activation functions, producing values that represent the coefficients (noted as for i ). This configuration ensures that the network can accurately predict and approximate both sets of coefficients required for the Oustaloup approximation.
The coefficient dynamics in the case of the Oustaloup approximation could theoretically be modeled using a single, more complex neural network. However, this approach would significantly increase the complexity of the neural network and the computational resources required for training and evaluation. Given that the Oustaloup approximation coefficients exhibit high variability and possess many decimal places for both numerator and denominator coefficients, it is preferable to use four separate neural networks.
This choice of using two distinct neural networks allows for a more manageable and efficient solution. Each network can focus on approximating either the numerator or denominator coefficients, minimizing the computational burden and improving accuracy. By distributing the task across multiple networks, the overall mathematical model remains both efficient and precise. This approach ensures that each neural network is optimized for specific coefficient sets, leading to better performance and more reliable results in approximating the complex dynamics of the Oustaloup coefficients.
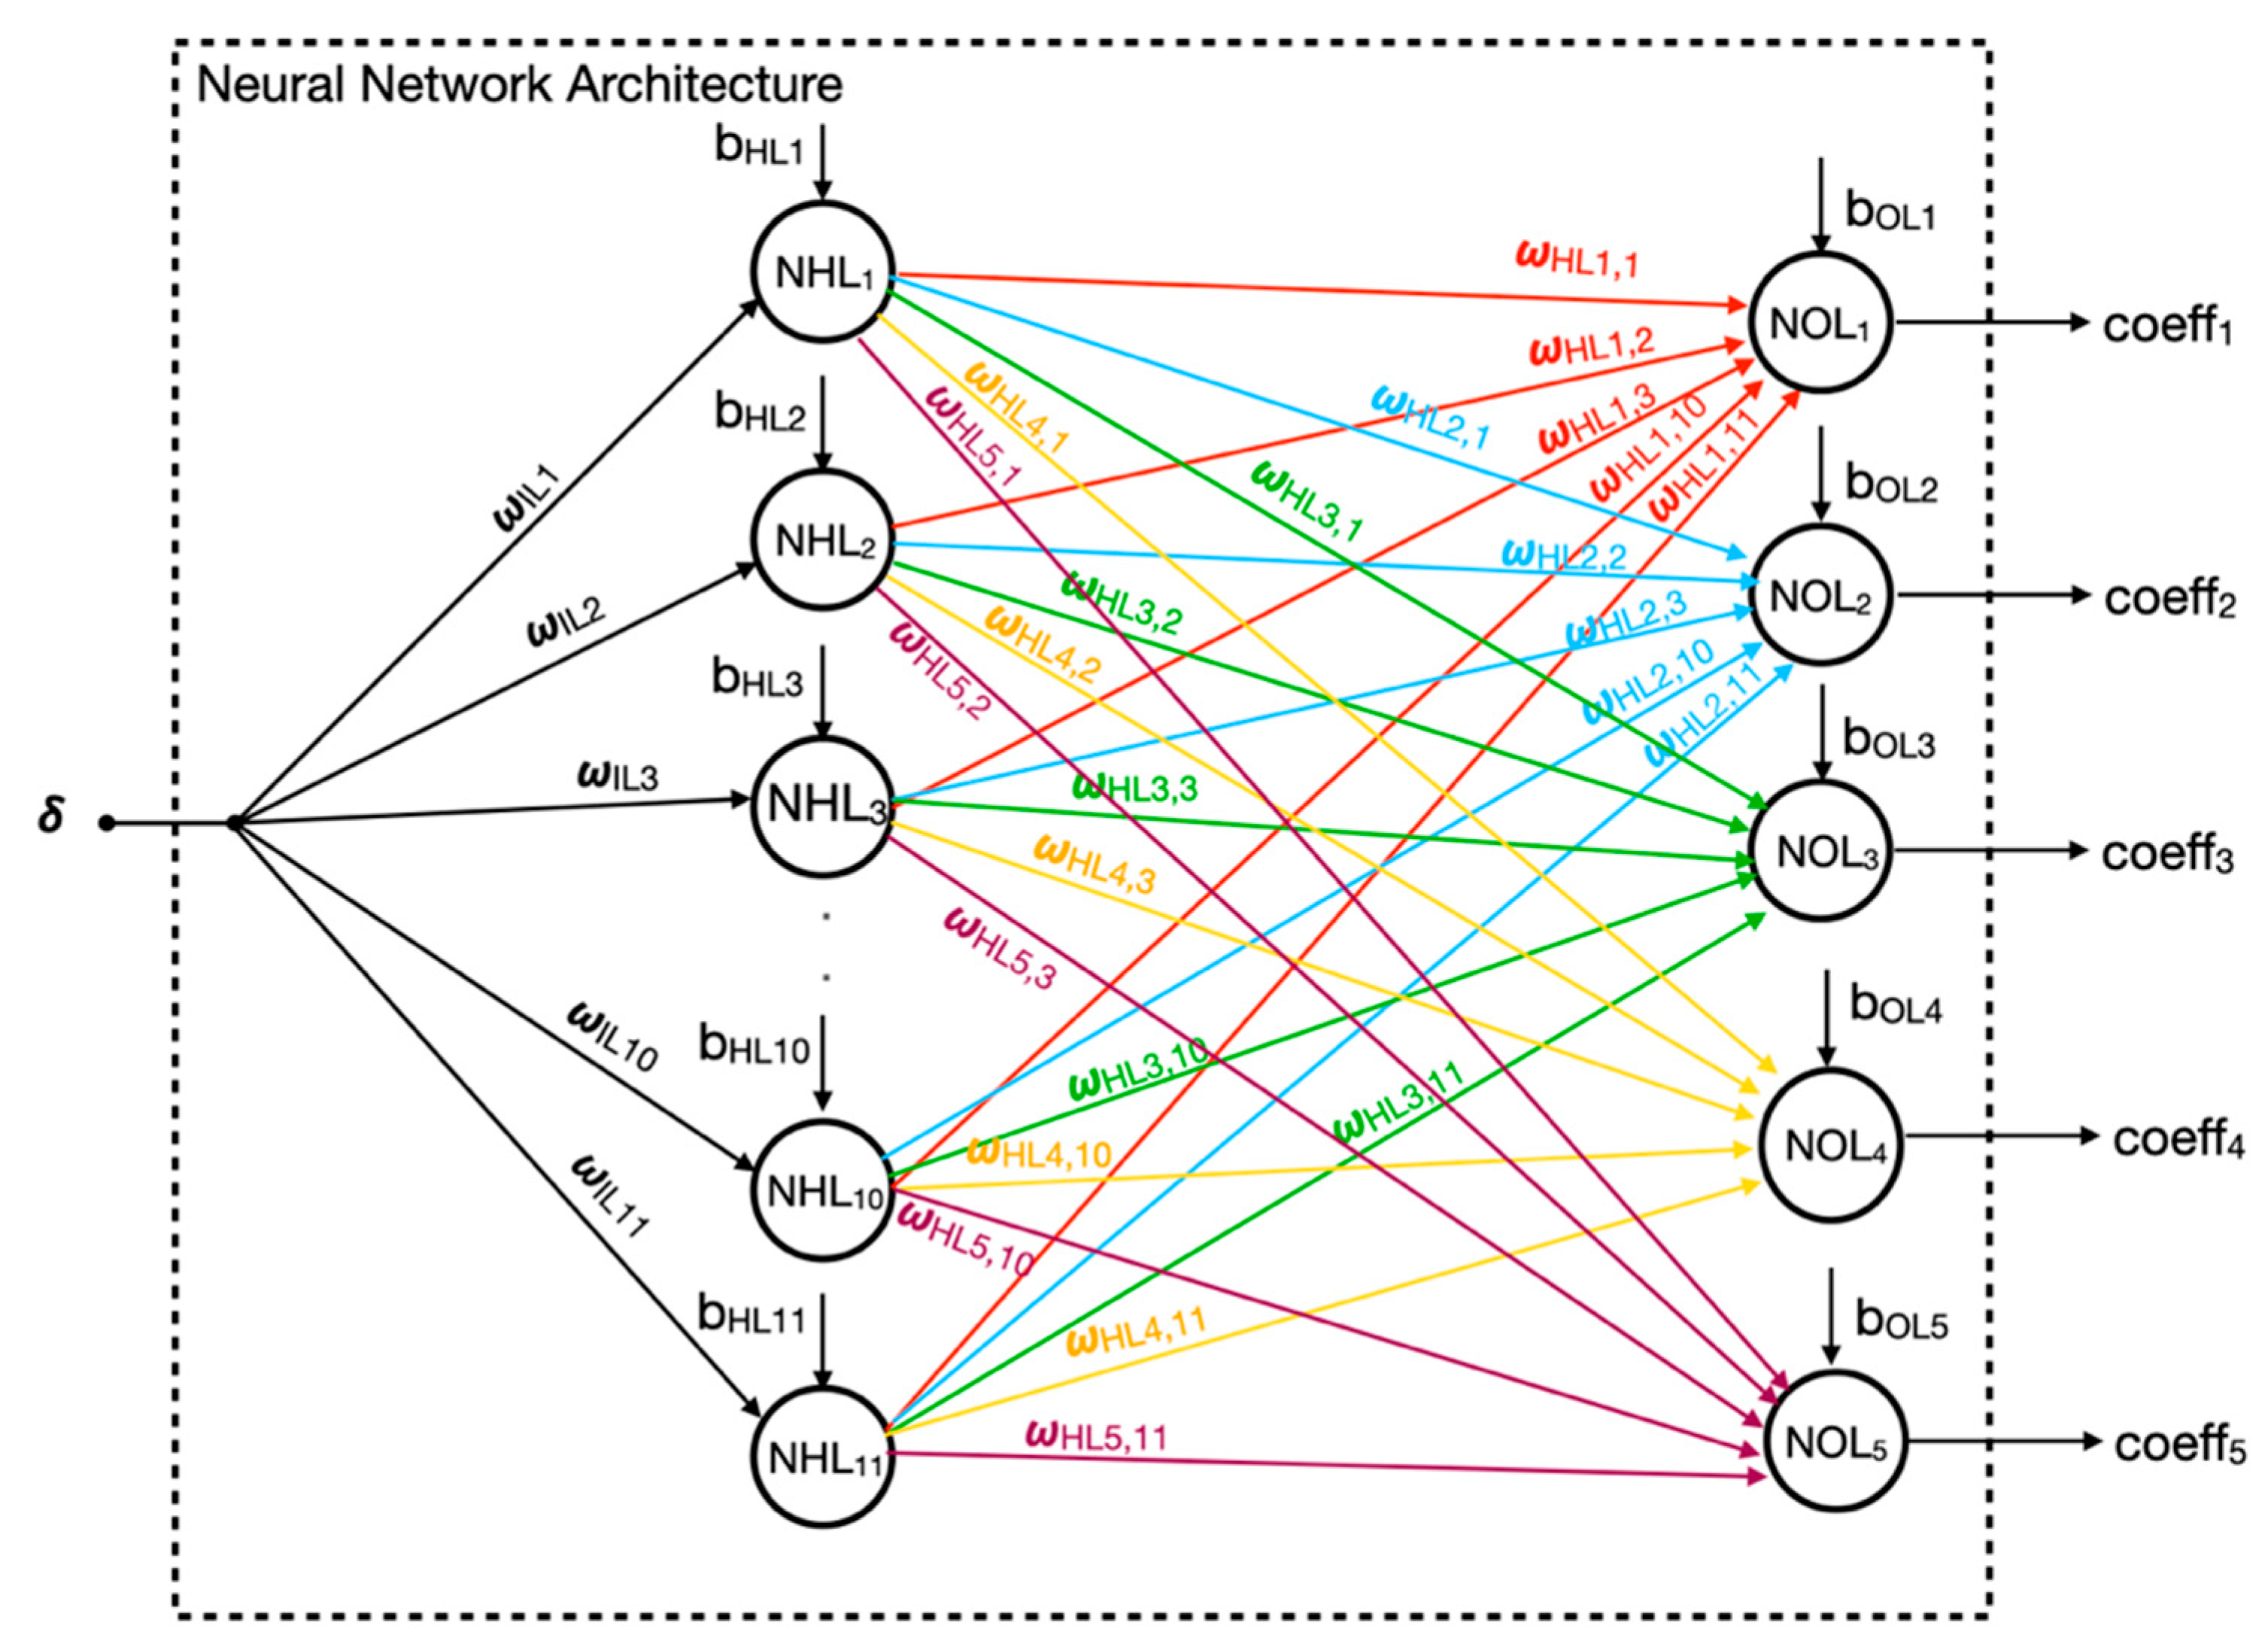
The generic structure of the feedforward network implementing the two neural networks required for the nominator and denominator coefficients is illustrated in
Figure 2.
In
Figure 2, the neural network structure is detailed with specific notation for the synaptic weights and activation functions. The weight
denotes the synaptic weight connecting the input signals to the ith neuron in the hidden layer, where
ranges from 1 to 11. Similarly,
represents the synaptic weight linking the
th neuron of the hidden layer to the
th neuron in the output layer, where ii ranges from 1 to 11 and
ranges from 1 to 5.
The activation function used for the neurons in the hidden layer, denoted as
, is the hyperbolic sigmoid bipolar function. This function is defined as
where
is a constant parameter that controls the steepness of the sigmoid curve. This activation function introduces nonlinearity into the network, enabling it to model complex relationships between the input and output signals effectively. The choice of this function enhances the network’s ability to learn and approximate the Oustaloup approximation coefficients by mapping the weighted sum of inputs to a bounded output in the range
.
For the neurons in the output layer, denoted as
, the activation function used is a linear function defined by
This linear activation function simply returns the input value without any transformation. This choice is appropriate for the output layer when the goal is to produce continuous, unbounded output values. In this context, the linear function allows the network to output the precise values of the coefficients, either for the numerator or denominator, as required by the Oustaloup approximation. The simplicity of the linear function ensures that the output values directly reflect the learned coefficients without additional nonlinear processing.
The Bayesian regularization algorithm was employed to train the two neural networks, with the training process configured to a maximum of 300,000 epochs. The training parameters were set with a minimum error gradient of and an initial learning rate of . For each coefficient to be learned, the target Mean Squared Error (MSE) was established at . The training was successfully completed after 72,223 epochs, at which point the error target was achieved.
Although the Levenberg–Marquardt algorithm was also tested, it yielded significantly lower performance compared to the Bayesian regularization approach. Other learning algorithms explored did not meet the accuracy requirements for effectively approximating the Oustaloup filter coefficient variations. Through the iterative optimization process, it was determined that the optimal number of neurons in the hidden layer for all two neural networks is eleven.
The architecture and the properties of the two neural networks are illustrated in
Table 1.
The parameters of the two neural networks are illustrated in
Table 2.
These tables provide a comprehensive overview of the network configurations and training parameters, showcasing the setup that led to the most effective approximation of the Oustaloup filter coefficients.
The architecture of the neural network, particularly the number of nodes in the hidden layer, was optimized to ensure accurate approximation without overfitting. Several configurations were empirically evaluated. An overly complex network (e.g., having more than 13 nodes) risked overfitting the training data and increased computational overhead, while a too-simple network (e.g., having less than 7 nodes) lacked the expressive power to capture the nonlinearities of the system, resulting in high approximation error. A hidden layer with 11 nodes was found to be optimal, providing the best generalization performance on a validation set and leading to the precise control results demonstrated in
Section 6. Furthermore, the instability of the coefficients (their high variance across different training steps) led us to adopt a neural network with higher complexity (hence the 11 neurons in the hidden layer).
The neural network functions as a complex nonlinear approximator, designed to map the fractional-order input δ to the parameters defining the fractional-order transfer function. Its architecture, as detailed in
Table 1, is a fully connected feedforward network with a single input, one hidden layer containing eleven neurons, and an output layer yielding five distinct numerical values. The mathematical transformation performed by this network is a sequential process of weighted summation and nonlinear activation.
The initial phase of computation occurs between the input and hidden layers. The input signal is first processed by each neuron in the hidden layer. The network input (internal potential) to the kth hidden neuron is computed as a linear combination of the input signal, scaled by its respective weight from the vector , and added to its bias term from the vector . This weighted sum is subsequently passed through the hyperbolic tangent activation function (tansig) to introduce nonlinearity, producing the final output of the kth hidden neuron. The collective output of the entire hidden layer can therefore be expressed as .
The final phase of computation transforms the hidden layer’s outputs into the network’s solution. The values from all eleven hidden neurons are propagated to the output layer, where each of the five output neurons calculates its activation. The jth output neuron computes a linear weighted sum of all hidden layer outputs, using weights from the matrix
, and adds its own bias term from the vector
. Since a linear activation function is employed in the output layer, this summed value constitutes the final output directly. The complete output vector
, which contains the five approximated parameters for the transfer function, is given by the compact vector–matrix formulation presented in
This equation provides a complete mathematical description of the network’s forward propagation process, essential for understanding and replicating the proposed approximation method.
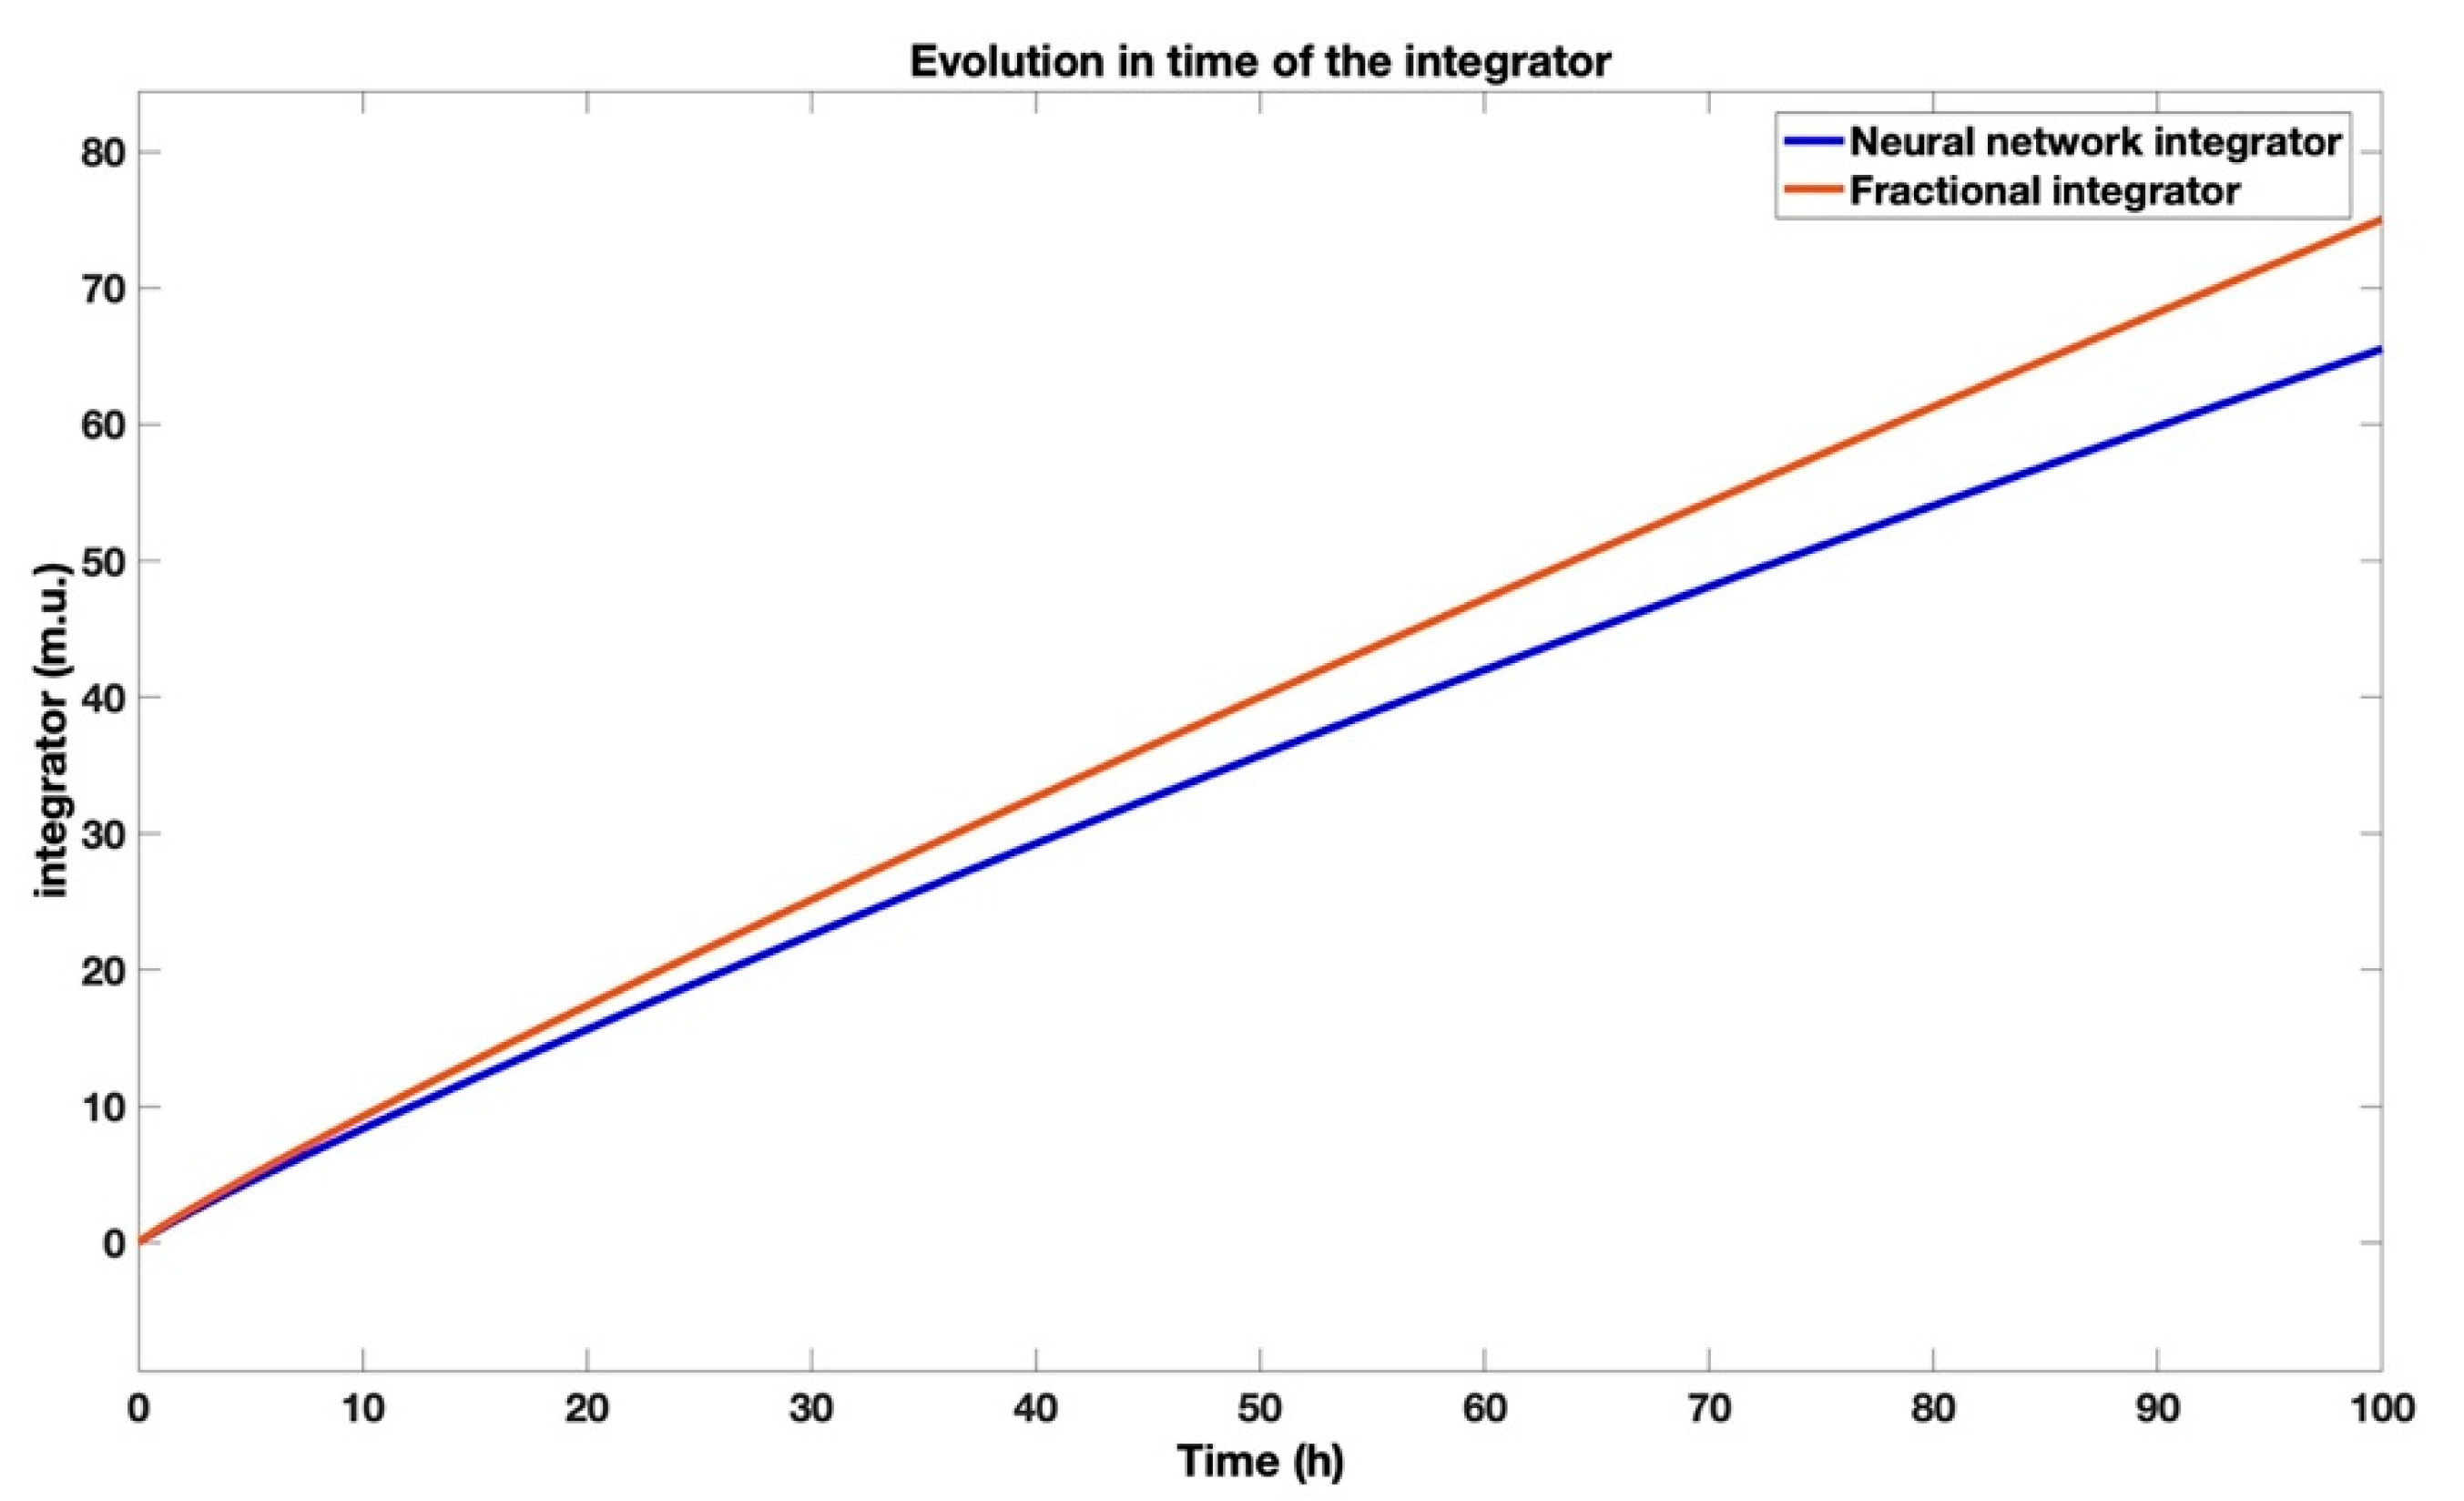
In
Figure 3, the comparison between the response of the fractional-order integrator function from (6) and the response of the Oustaloup approximation of the integrator implemented using artificial intelligence (AI) techniques is illustrated. For this purpose, the considered differential fractional order
is
.
Despite the observable deviation between the ideal fractional-order integrator and its neural network approximation in
Figure 3, the significance of this error is mitigated by the context of its application. Integrators, by nature, accumulate error over time, leading to the divergent behavior visible in the plot. However, within a closed-loop control system, the proportional and derivative actions typically compensate for such steady-state errors in the integrating term. Consequently, the absolute error, while appearing large in an open-loop test, is less critical for the overall system performance where the approximator will be implemented.
Based on the response illustrated in
Figure 3, which demonstrates the behavior of the differential fractional order of the integrator function, it can be concluded that the neural networks are effectively capable of learning the coefficients of the Oustaloup approximation. The figure highlights how well the networks approximate the fractional-order dynamics, confirming their proficiency in capturing the nuances of the Oustaloup coefficients. This performance indicates that the neural networks are successfully modeling the complex relationships between the fractional-order parameter and the approximation coefficients, validating their utility in this context.
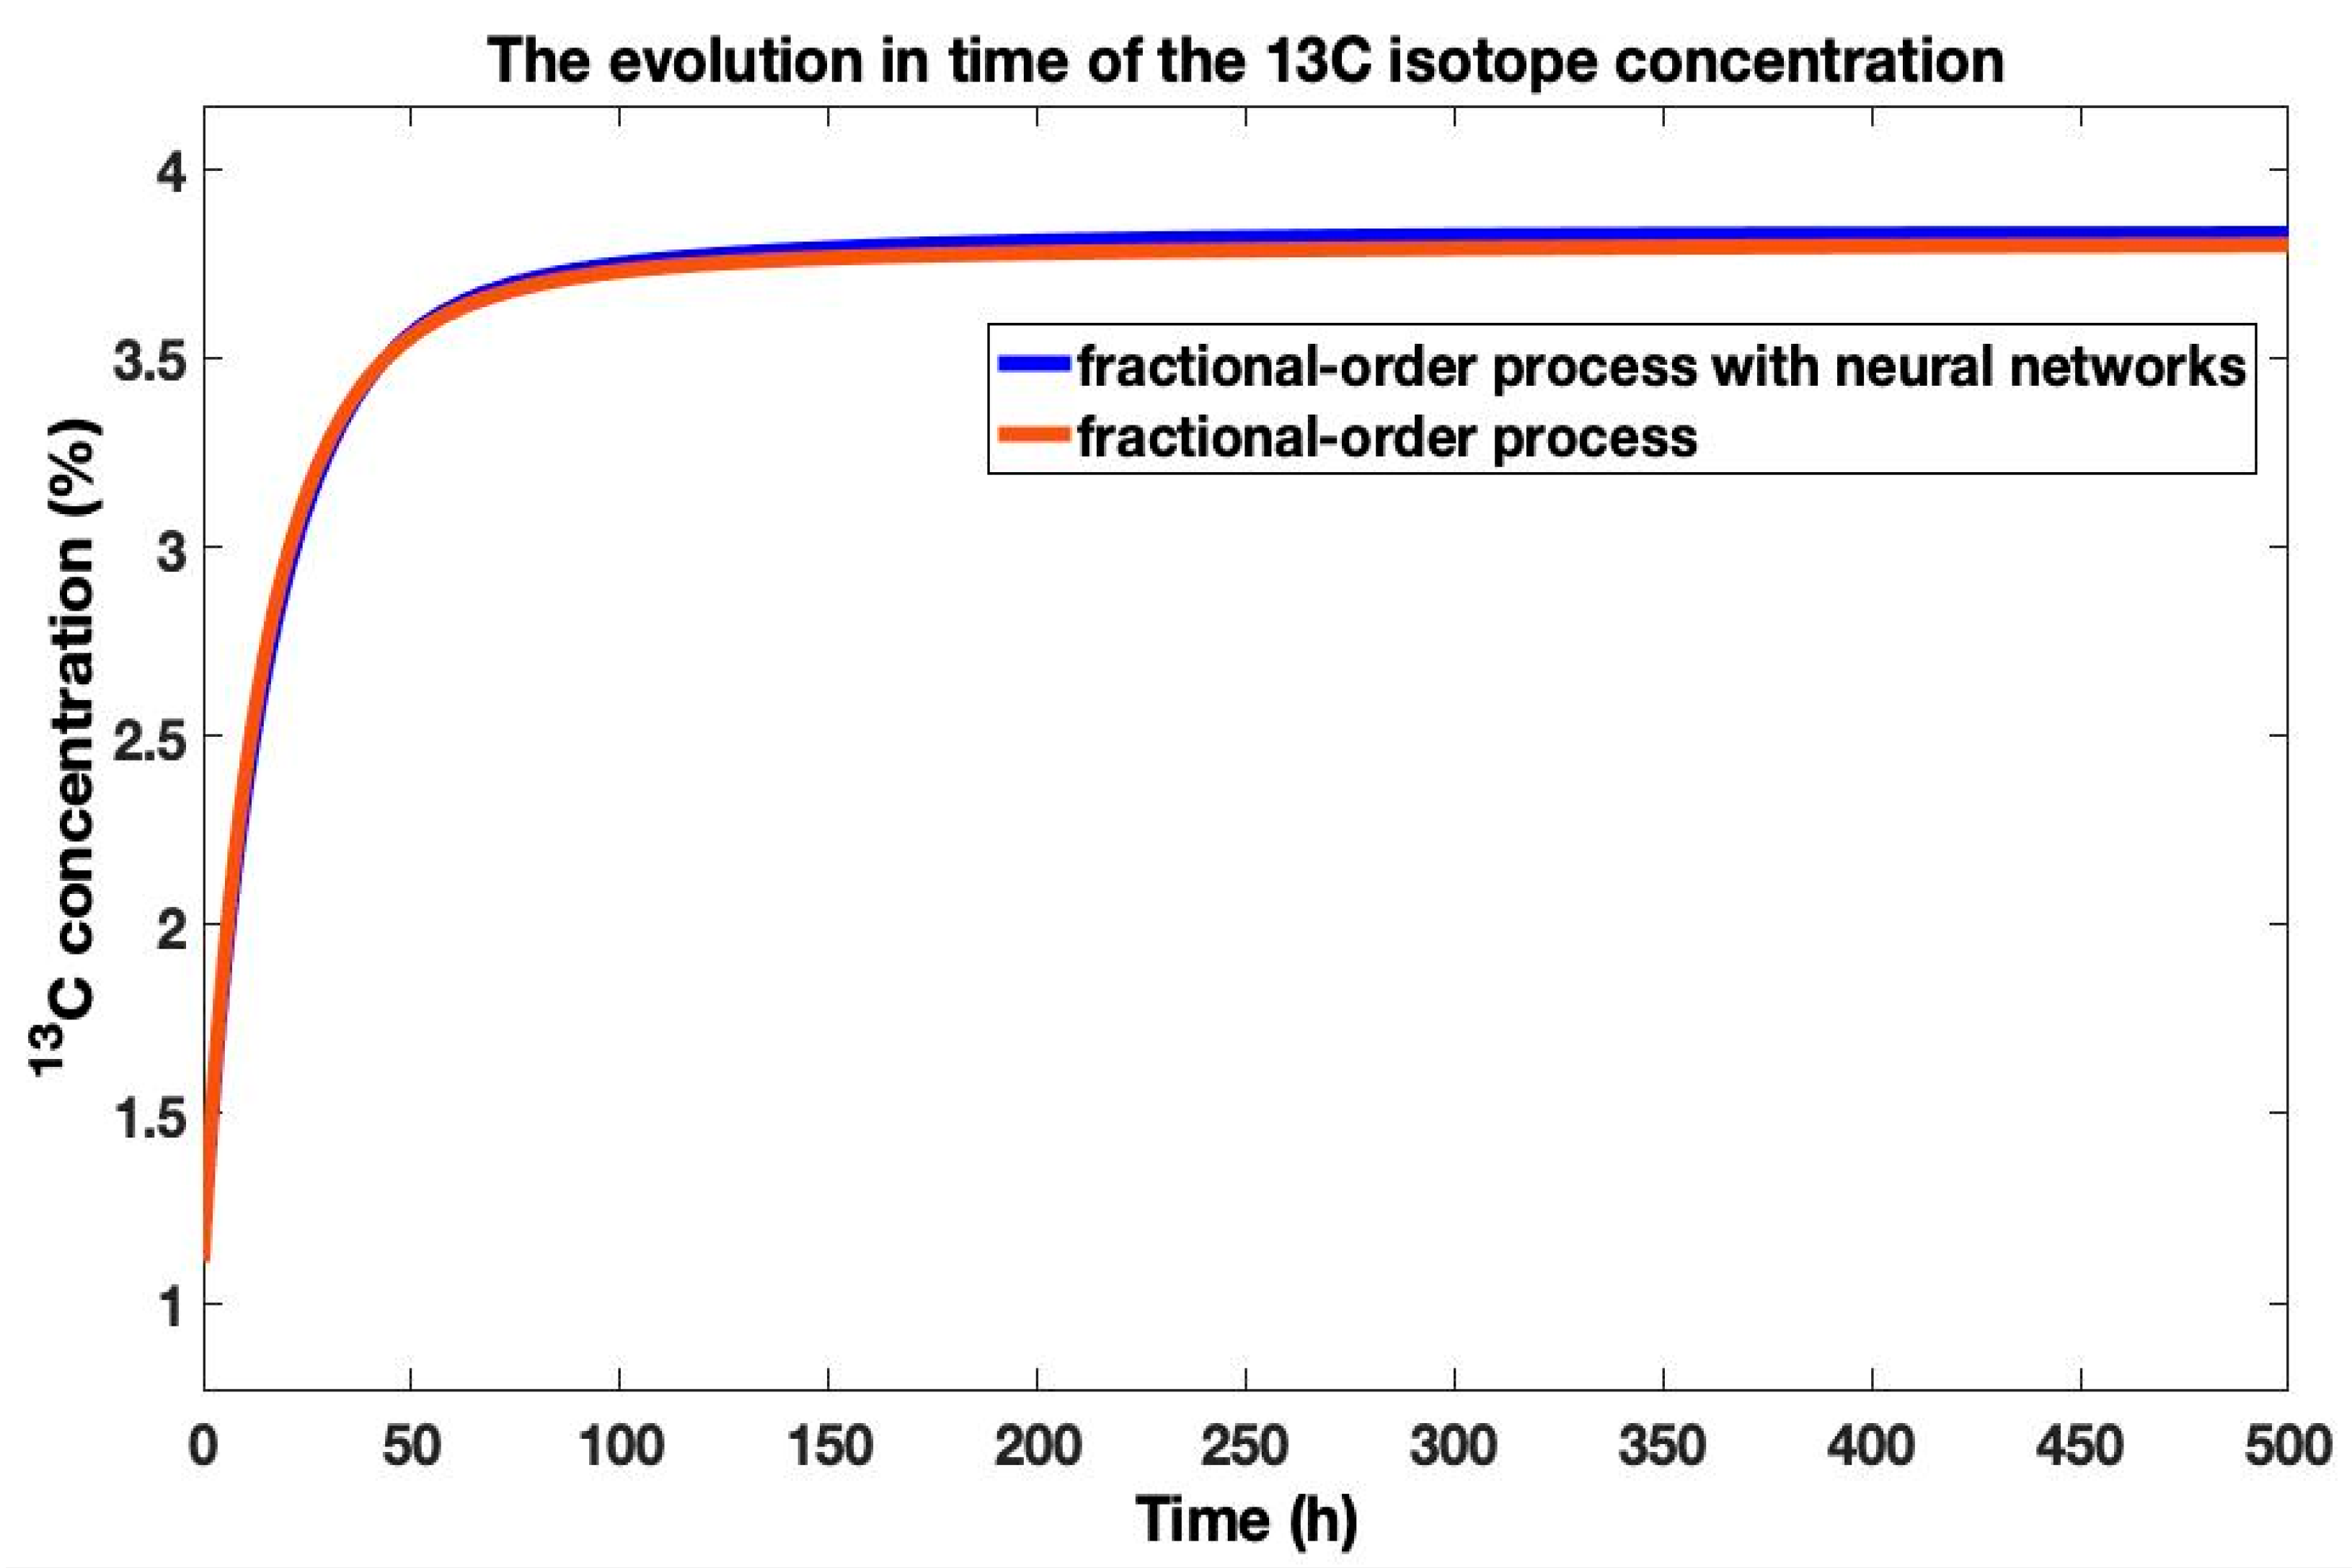
The comparison between the step responses over time of the mathematical model with fractional order (
) and the mathematical model with differential fractional order, with the transfer function integrator implemented using neural networks from (5), is presented in
Figure 4.
The comparison in
Figure 4 demonstrates that the process model defined using the neural network-implemented fractional-order integrator provides a highly accurate representation of the fractional-order process model with
. While a small initial error is present—a known consequence of approximating the fractional-order integrator component, as previously examined—its impact is transient. The system exhibits effective error compensation, with the responses converging and maintaining close alignment throughout the operational timeframe. This indicates that the approximation is robust and captures the essential long-term dynamics of the system.
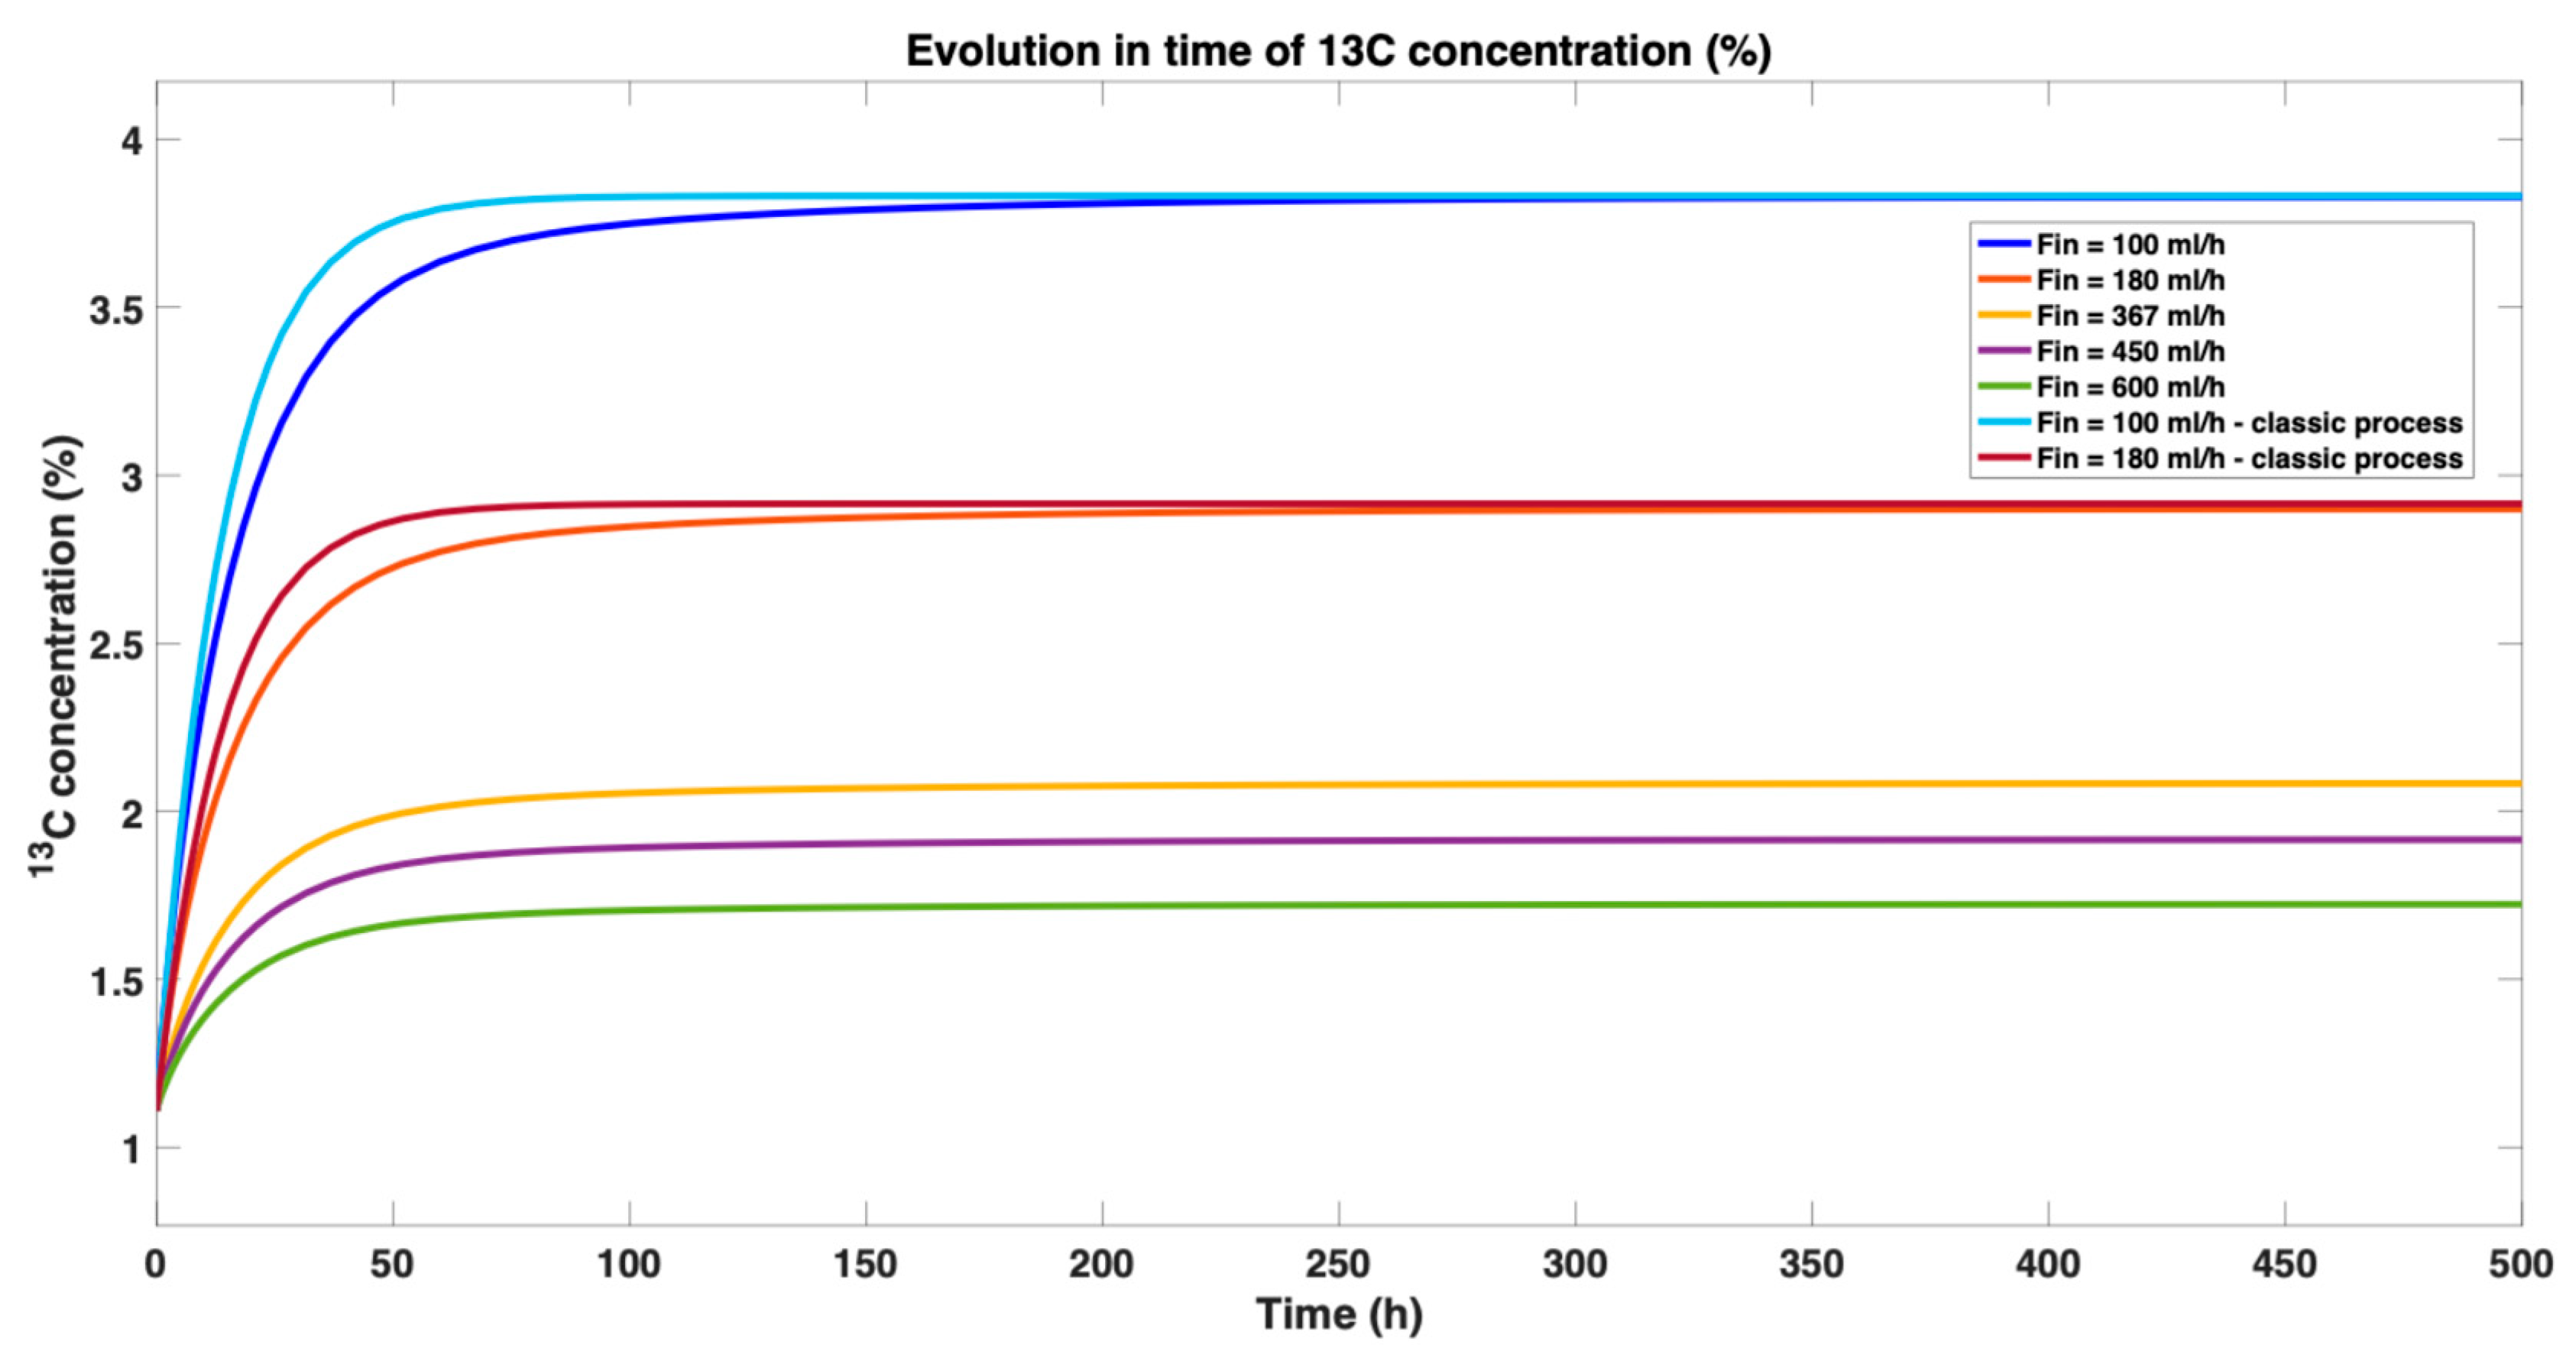
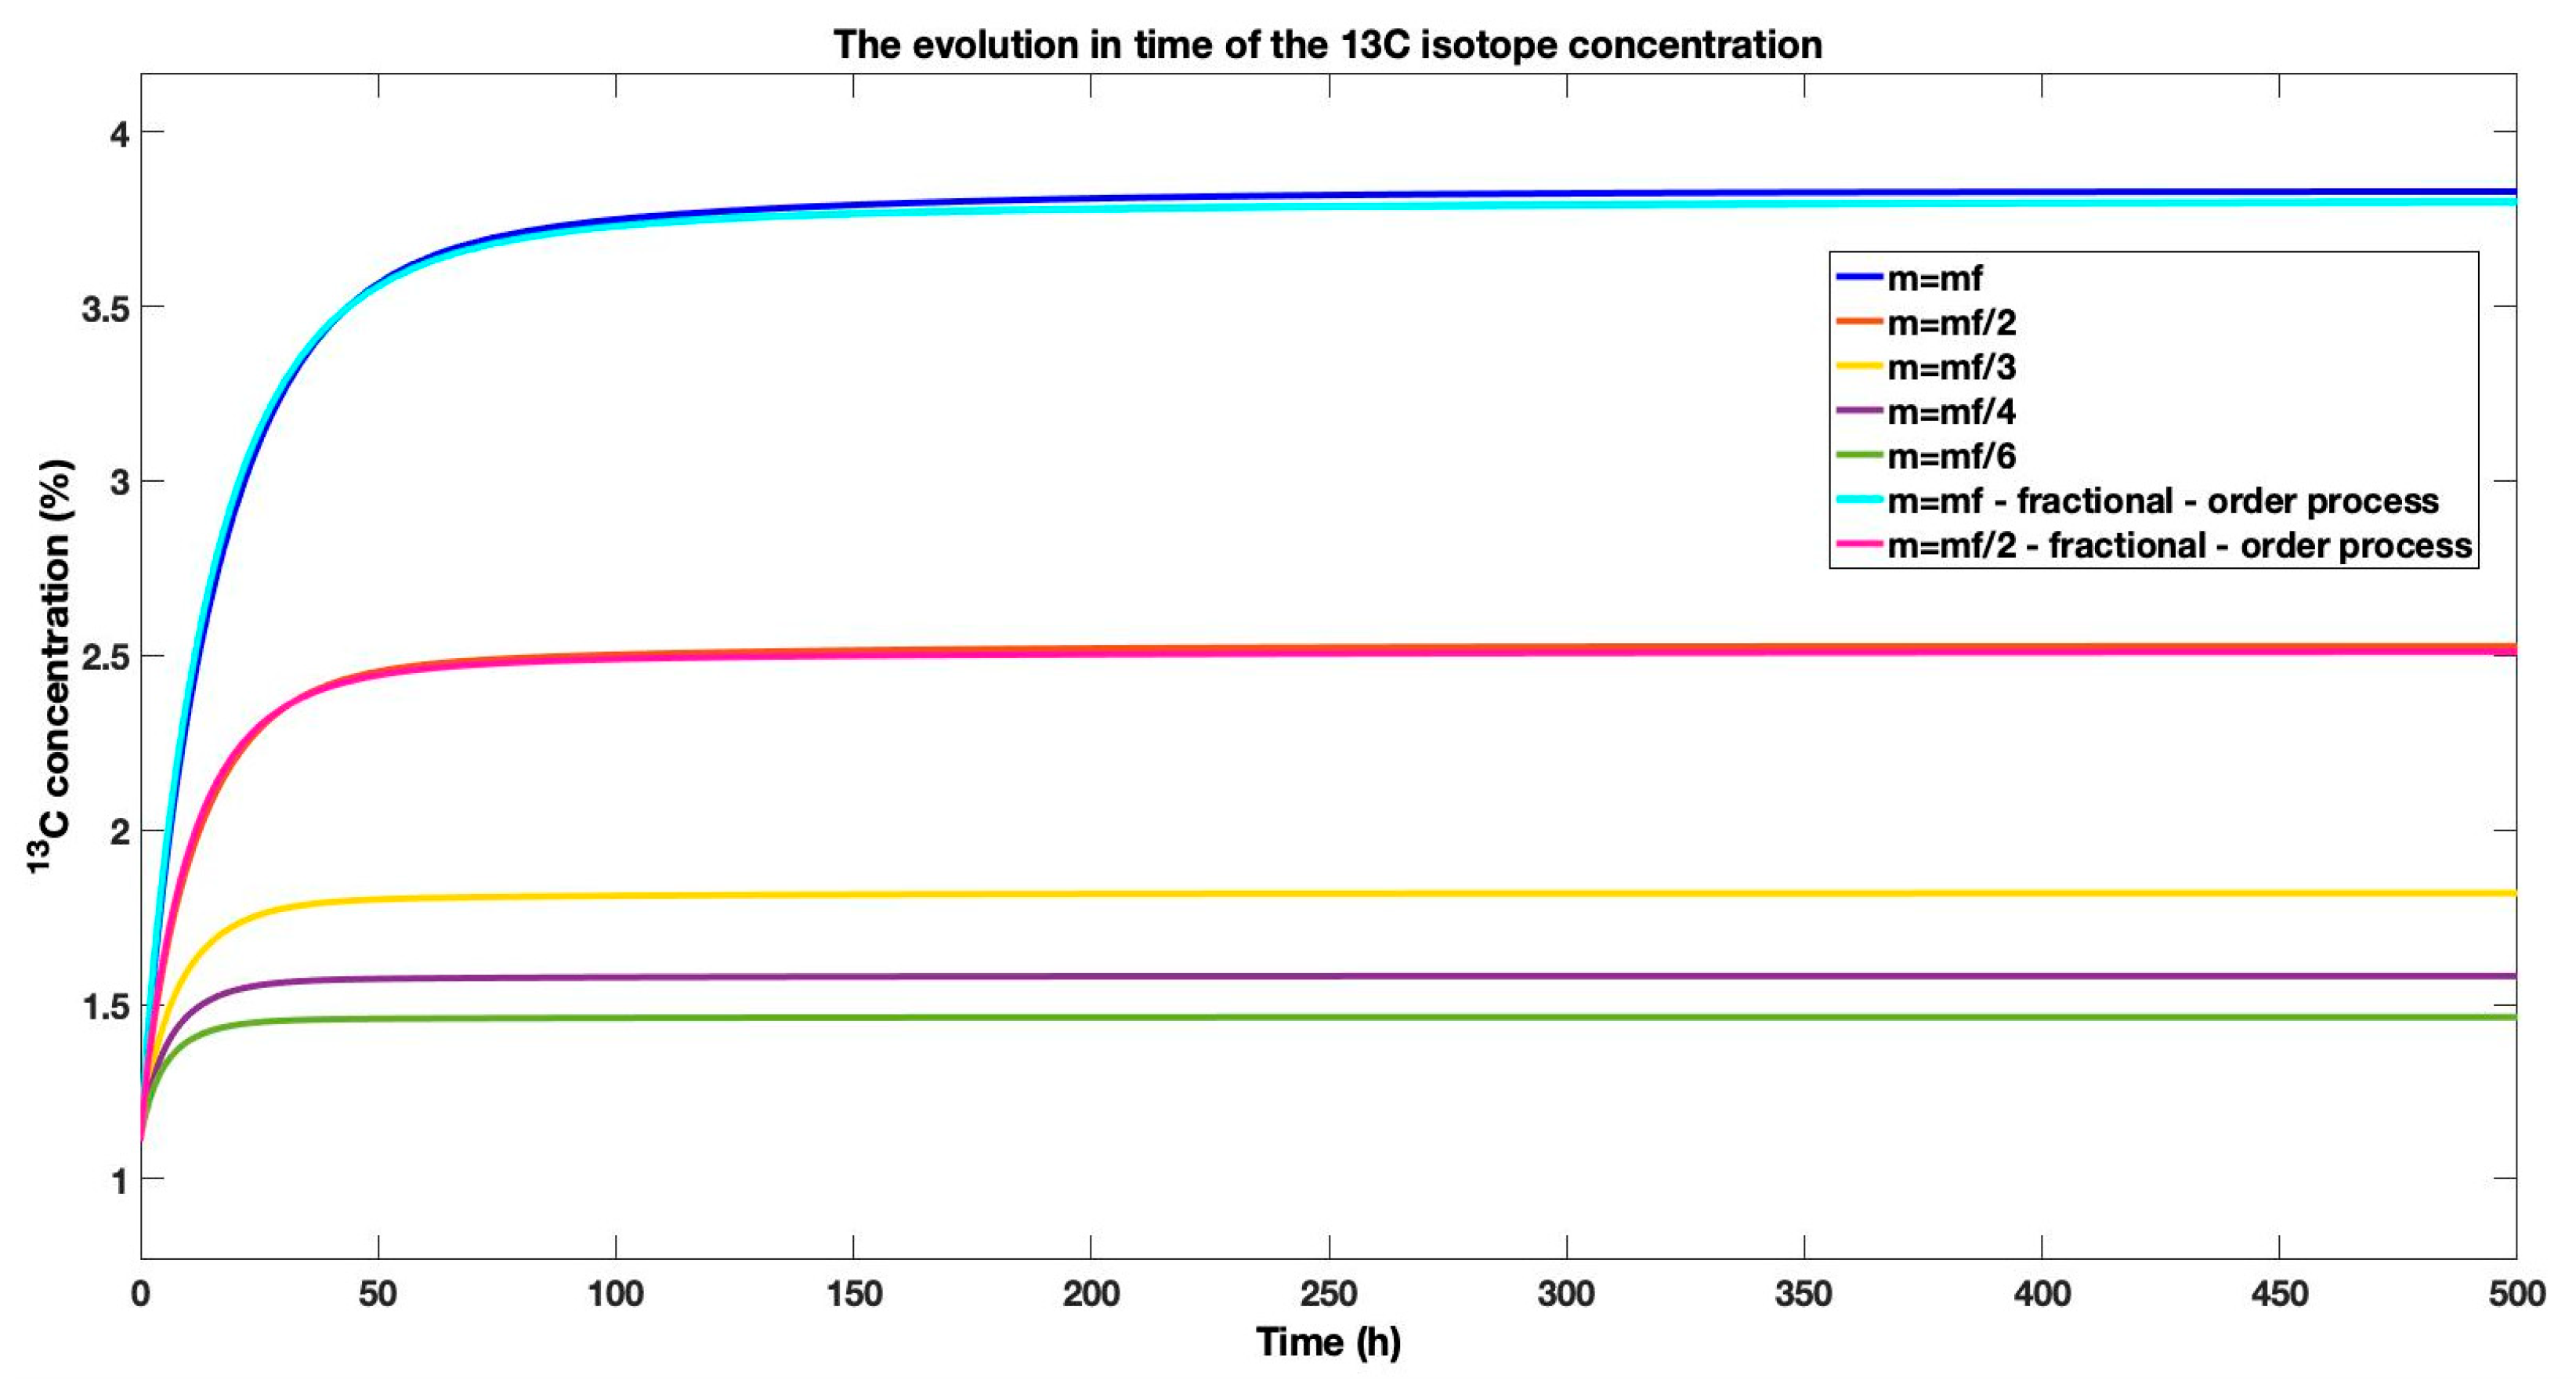
By implementing the mathematical model from (6) and the previously presented integrator learned using AI, we conducted simulations of the process for a range of input flow rates
from
to
, as
. These varying flow rates were chosen to evaluate how changes in the input affect the behavior of the separation process. The outcomes of these simulations are illustrated in
Figure 4, which provides a comparative graph showing the responses of the process to each of the different input flow rates. Moreover, the comparison of the step-type responses of the classical process model for the input flow rates
is also included in
Figure 4, in order to highlight the accuracy of the fractional-order neural model in relation to the classic (with integer order) process model. This graphical representation allows for an in-depth analysis of how the process dynamics and performance are influenced by each specific flow rate, highlighting the model’s effectiveness in capturing the impact of varying input conditions on the separation process.
A key observation from
Figure 5 is the consistent ability of the fractional-order neural model to accurately replicate the behavior of the classic process model for both step inputs (
). This validates the approximation’s robustness across different operational conditions. The initial transient error, attributable to the integrator dynamics as analyzed in
Figure 3, is visibly compensated for as the response evolves. The subsequent convergence and minimal steady-state error underscore the model’s precision and its suitability for representing the system’s dynamics.
In order to emphasize the results of the simulations of the isotopic separation process,
Table 3 presents the steady-state concentration values obtained for different variations in the input flow rate of the gas. This table provides a detailed comparison, highlighting how changes in the gas flow rate impact the steady-state concentration, thereby offering valuable insights into the process’s performance under varying conditions.
Additionally, some simulations were performed to examine the impact of varying column’s height on the separation process. The column’s height was varied across the following range:
. These different heights were selected to assess how changes in column height affect the dynamics of the separation process. The results of these simulations are presented in
Figure 6, which features a comparative graph illustrating the responses of the process at each specified column height. Moreover, the comparison of the step-type responses of the classical process model for variation in the column’s height,
, is also included in
Figure 6, in order to highlight the accuracy of the fractional-order neural model in relation to the classic (with integer order) process model. This visual representation facilitates a detailed analysis of how variations in column height influence the process performance and dynamics, demonstrating the model’s capability to accurately capture the effects of column height on the separation process.
Figure 6 demonstrates that the efficacy of the fractional-order neural model is not limited to variations in flow rate but extends to physical changes in the system, specifically the column’s height. For all configurations, the model’s response converges with that of the classic integer-order model. The initial discrepancy, consistent with our analysis of the integrator’s behavior, is transient and is effectively compensated for as the system evolves. This consistent performance underscores the model’s robustness and its accuracy in capturing the core dynamics of the separation process, independent of this key parameter.
Table 4 presents the steady-state concentration values obtained for different variations in separation column height. This table offers valuable insights into the process’s performance under varying conditions with respect to the height of the column.
From
Table 3 and
Figure 5, it can be observed that a decrease in the input flow rate
leads to an increase in the concentration of the
13C isotope. This relationship can be mathematically linked to the negative value of the proportionality constant
from (1). Physically, this phenomenon occurs because higher input flow rates of monoethanolamine result in a shorter contact time between the reactants, reducing the intensity of the chemical exchange between carbon dioxide and carbamate. Conversely, lower input flow rates increase the time available for the reactants to interact, thereby enhancing the
13C isotope concentration.
However, it is crucial to avoid operating at extreme values of the input flow rate. High input flows can lead to flooding in the separation plant, while very low input flows can cause the dry-column phenomenon. Both of these extreme operating conditions can adversely affect the performance and efficiency of the separation process. Thus, optimal input flow rates must be maintained to ensure effective and stable operation of the separation plant.
From
Table 4 and
Figure 6, it can be concluded that variations in column height significantly impact the concentration of the
13C isotope, too. Specifically, increasing the column height to its maximum value mm results in the highest
13C isotope concentration, whereas reducing the column height from
to
yields the lowest concentration. This correlation can be understood through the dynamics of the separation process: a taller column provides a longer residence time for the reactants, allowing for more effective separation and higher concentration of the isotope. Conversely, a shorter column limits the contact time between the reactants, resulting in lower
13C isotope concentration.
However, it is important to note that extreme values of column height should be avoided. Excessively high columns can lead to increased operational costs and potential mechanical issues, while very short columns may result in insufficient separation efficiency. Thus, maintaining an optimal column height is essential for achieving the best balance between effective isotope separation and operational feasibility.
Isotopic separation processes are known for their slow dynamics and are highly sensitive to various parametric perturbations. These perturbations can include technological factors such as temperature fluctuations, insulation efficiency variations, and other disruptive elements arising from the equipment used in the separation installation. As a result, the structural parameters of the separation columns exhibit temporal variations, impacting the overall performance of the process.
Based on experimental results and the preceding explanations, it is evident that the fractional-order differentiation () of the separation process is significantly influenced by these perturbations. The presence of such disturbances alters the process dynamics, affecting the precision and effectiveness of isotopic separation. This variability underscores the need for robust process monitoring and adaptive control strategies to maintain optimal performance despite the inevitable fluctuations in operational conditions.
The proposed model offers several notable advantages:
Versatile Simulations: The model enables employees to perform simulations that reveal the behavior of the isotopic separation installation under various operational scenarios. This capability is crucial for understanding how different conditions affect the process and for optimizing performance across a range of situations.
Enhanced Efficiency: To achieve the maximum efficiency of the proposed model—both technologically and economically—it is essential to attain the highest possible precision. This includes the ability to adapt the model online in response to variations in the fractional-order differentiation () caused by parametric perturbations. By incorporating real-time adjustments, the model can maintain accuracy and effectiveness, ensuring that the separation process operates at its optimal level despite fluctuations in operational parameters.
These advantages highlight the model’s potential to improve process understanding and efficiency while addressing the challenges posed by dynamic and variable conditions in isotopic separation.
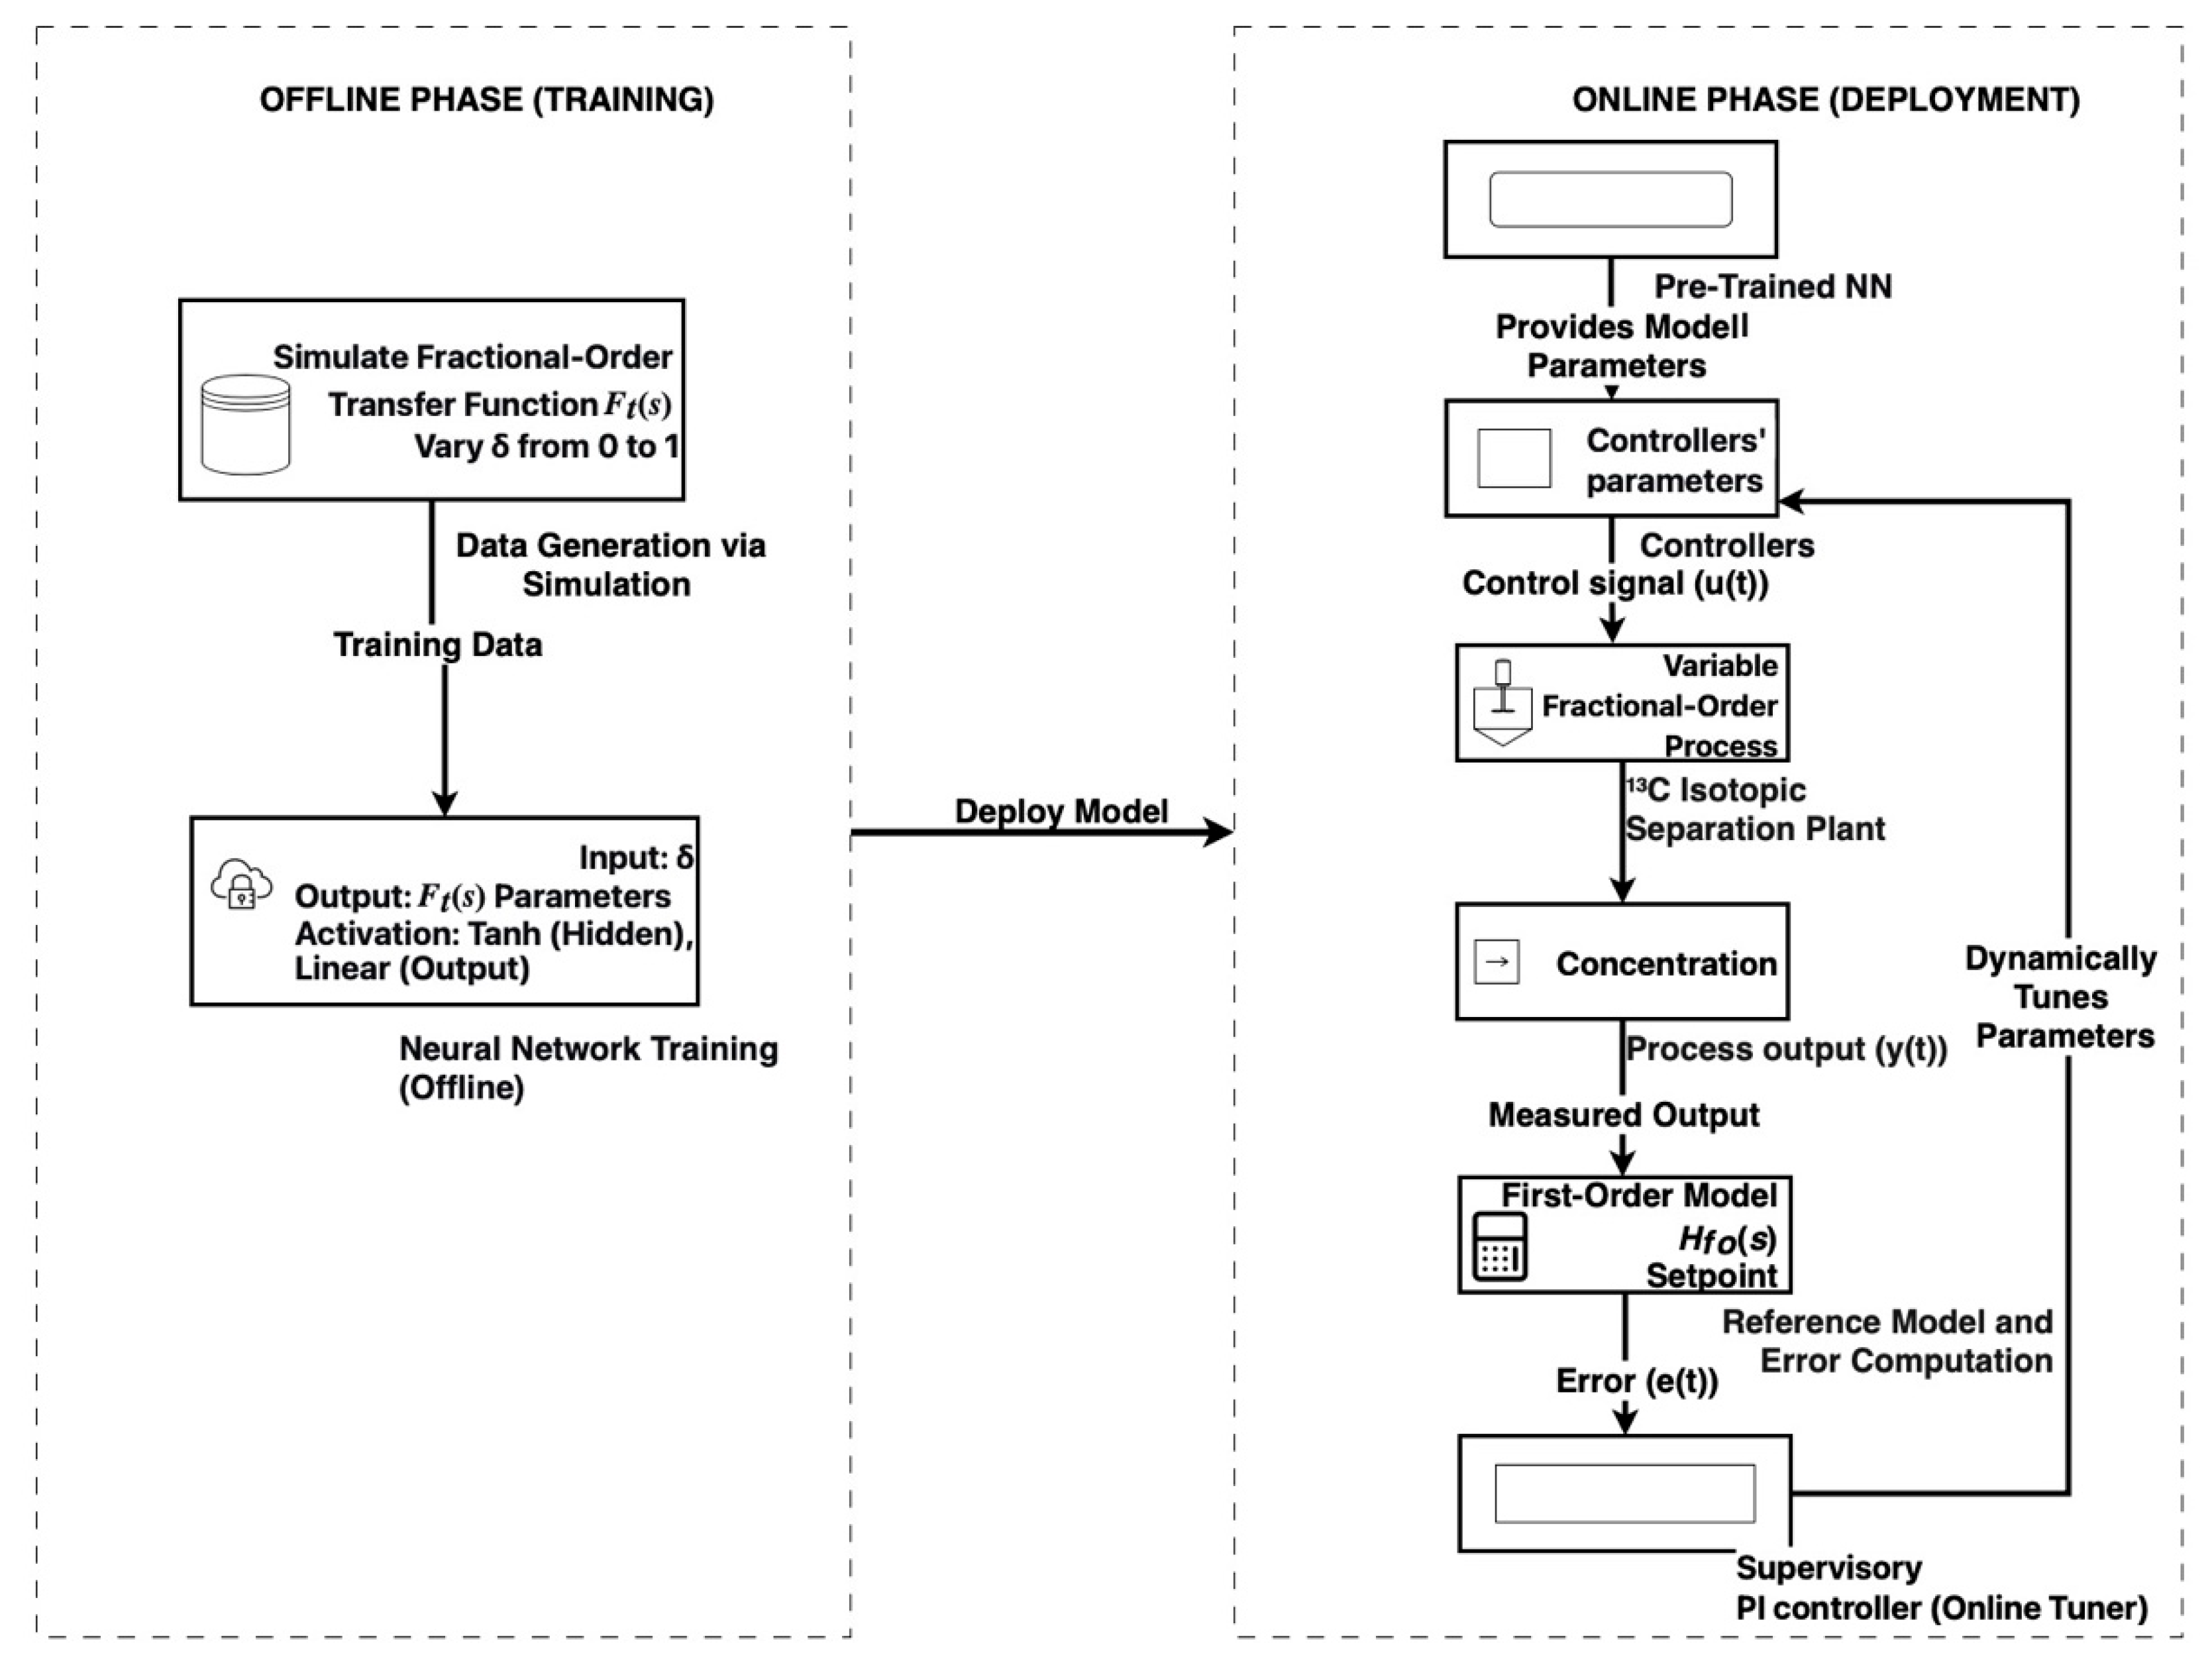
To visually synthesize the core methodology of this work,
Figure 7 presents a comprehensive schematic diagram of the proposed adaptive control framework. This illustration delineates the two fundamental phases of the approach: the offline training of the neural network to approximate the variable fractional-order dynamics, and the online implementation of the adaptive control strategy. The diagram elucidates the flow of information, from the pre-trained neural network providing model parameters to the main controller, which is dynamically tuned by a supervisory PI algorithm based on real-time performance feedback. This visual representation aims to clarify the interactions between all key components—the reference model, the adaptive controllers, the plant, and the performance evaluation metrics—providing a clear overview of the entire system’s operation and the novel contribution of this research.
5. The Design and Implementation of the Proposed Control Strategies
The aim of this section is to discuss the development of the proposed control structures aimed at reducing the settling time of the isotopic separation process to obtain the desired 13C concentration. A crucial factor in tuning these controllers is the management of the monoethanolamine input flow. If the flow is too high, it can flood the separation column, resulting in product loss. Conversely, a flow that is too low can dry the SC, also leading to product loss. Therefore, it is essential to carefully balance the monoethanolamine flow. One important consideration in this balance is the height of the SC; a taller column can accommodate higher flows of monoethanolamine without the risk of flooding, thereby optimizing the process and preventing product loss.
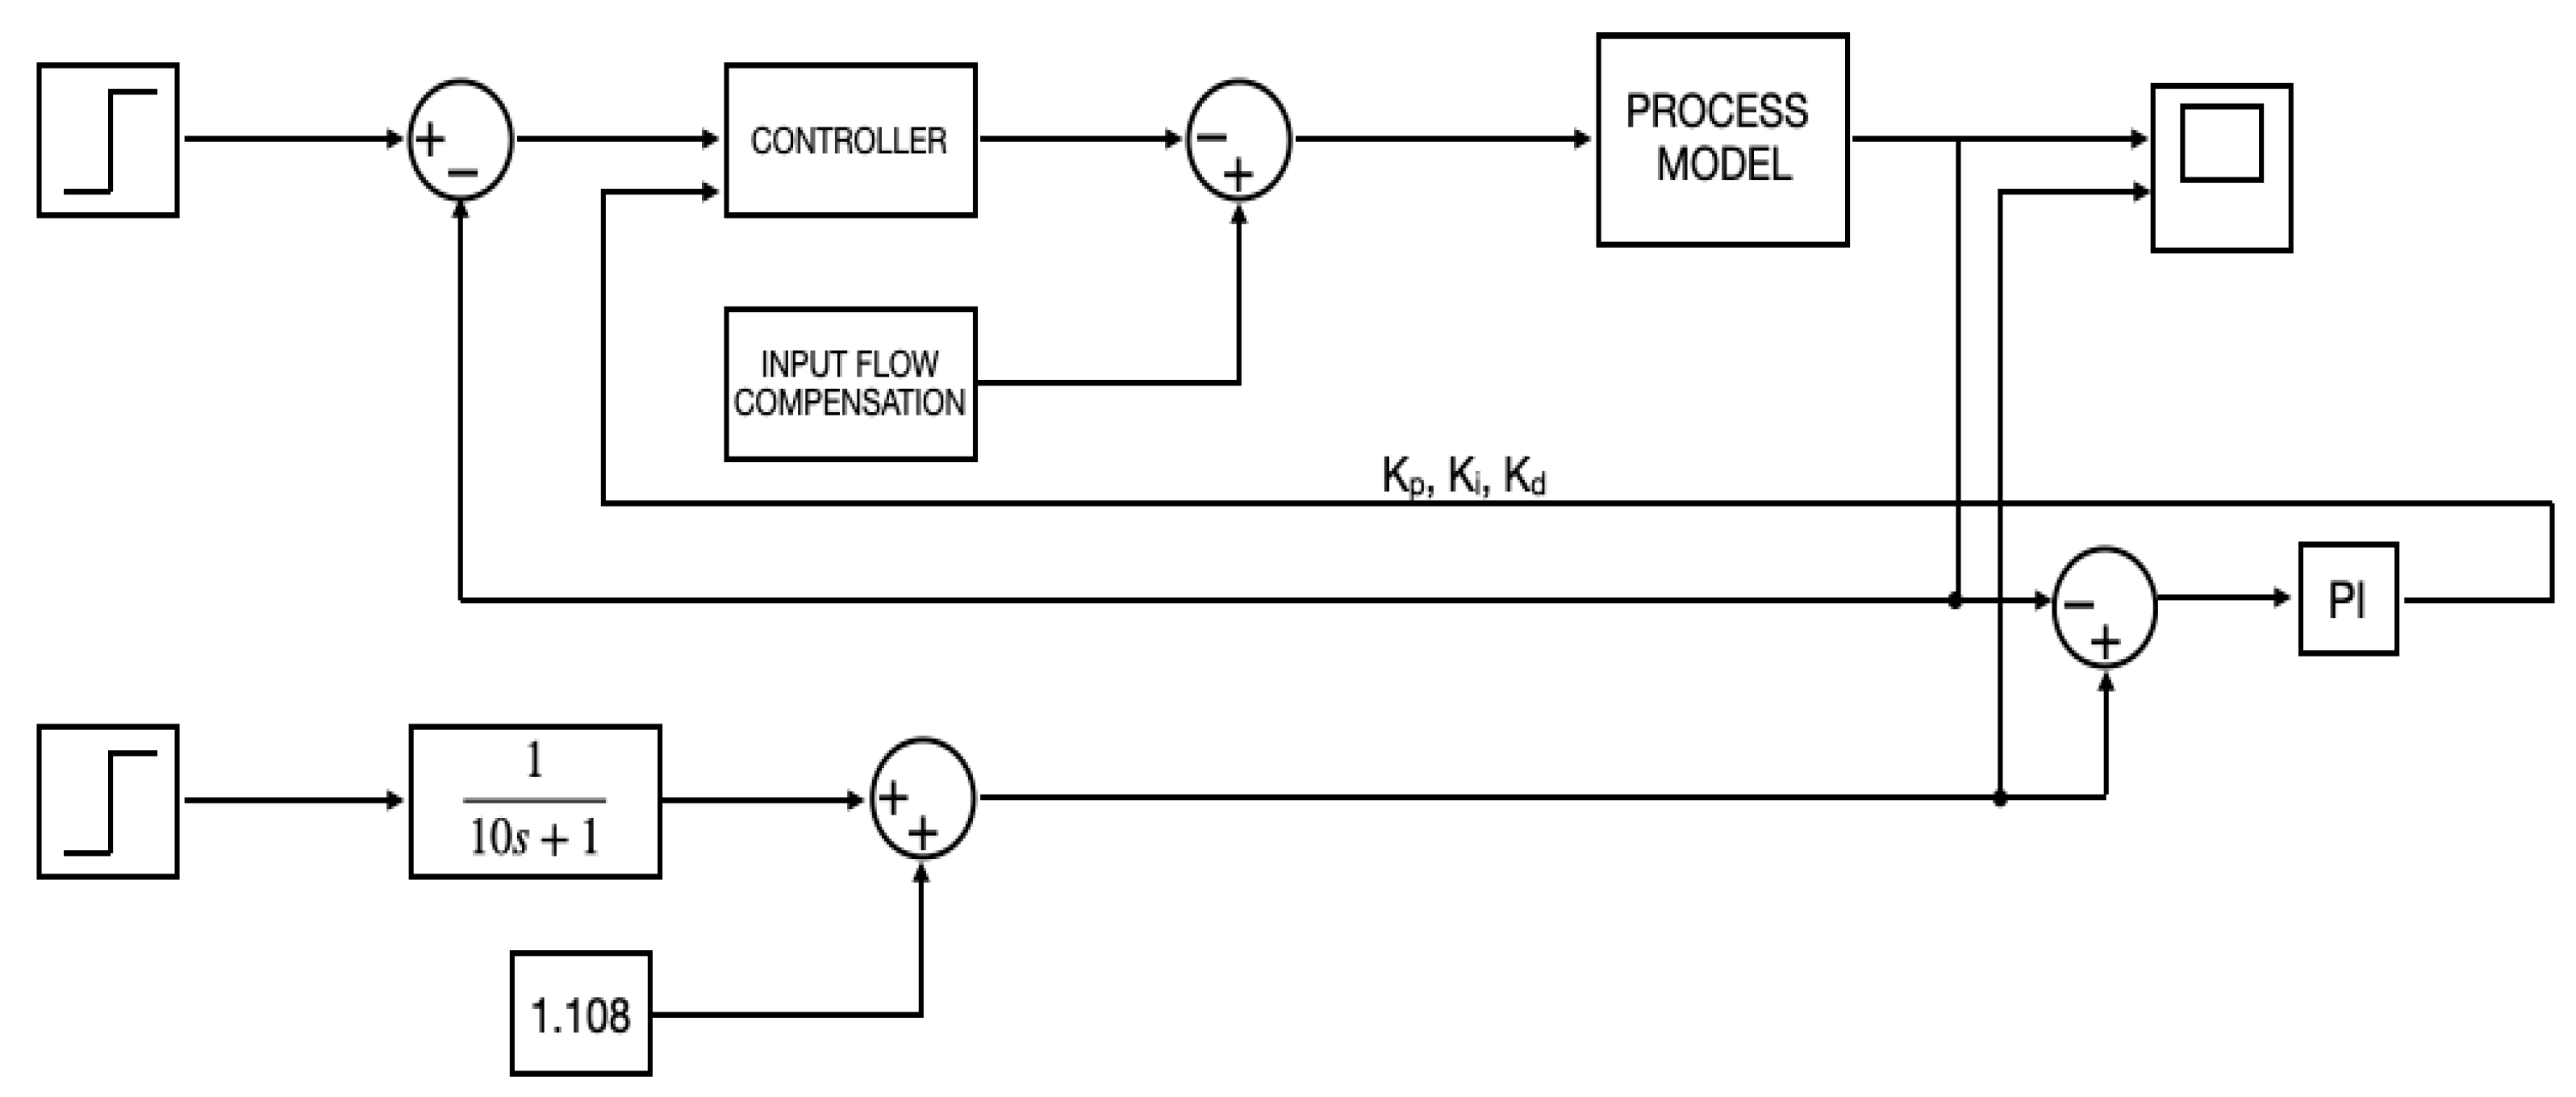
In
Figure 8, the control strategy is represented within a Simulink block scheme, where the relay, PID, FOPI and FOPID controllers can be implemented by substituting the CONTROLLER block with the respective control strategy. The block scheme on the direct channel comprises the input reference, which represents the desired concentration of the
13C isotope at the output of the process, the controller, and the process model that embodies the equations governing the
13C isotope separation.
The control system operates by calculating the error signal, defined as the difference between the actual output signal from the process and the setpoint reference. This error is then processed by the controller, which computes the command signal needed to reach the desired concentration in the separation plant. The isotopic separation process block is a subsystem that implements the equations from (1) to (5), while the delta block represents the differentiation fractional order, which in this case is . For the simulations, the target concentration (setpoint reference) for all control strategies was set at 3%.
One crucial aspect of simulating the isotopic separation process of
13C is that the zero initial conditions cannot be considered inside the separation plant. To address this issue, the input flow compensation block was introduced in the Simulink schematic that is presented in
Figure 8. This block ensures that the system has no zero initial conditions, by adding a compensatory input flow of monoethanolamine, set at
, to mimic some more realistic operating conditions and prevent inaccuracies in the simulation.
5.1. Relay Controller
A relay controller [
47] is a type of discrete control system widely used in various industrial applications for its simplicity, robustness, and cost-effectiveness. Unlike continuous controllers that rely on analog signals, a relay controller operates by switching between discrete states—typically “on” and “off”—in response to the input signals or deviations from a setpoint. This binary nature allows the relay controller to control processes with minimal computational requirements, making it particularly suitable for systems where precise analog control is not necessary or where the control signal needs to be robust against noise and other perturbations.
In the context of process control, the relay controller is often employed for systems requiring on/off regulation, such as temperature control, motor control, and other applications where maintaining a variable within specific bounds is critical. The controller’s action is typically based on a hysteresis function, which introduces a dead zone to prevent excessive switching, thereby enhancing the system’s stability and prolonging the lifespan of the actuators.
The effectiveness of a relay controller in achieving desired performance metrics depends on its proper tuning, particularly the selection of appropriate hysteresis bounds and switching thresholds. These parameters must be carefully designed to balance the trade-off between control precision and the frequency of relay activation. Moreover, while relay controllers are inherently nonlinear, they can be used in combination with other control strategies, such as proportional–integral–derivative (PID) controllers or model predictive controllers, to improve overall system performance in more complex or dynamically varying environments.
Given its characteristics, the relay controller remains a vital component in many control systems, particularly where simplicity, reliability, and robustness are prioritized over the fine-tuned precision offered by more complex control methodologies.
To accurately model the behavior of the relay controller within the control system, specific parameters must be defined. These include the relay’s amplitude, which determines the maximum output levels, and the hysteresis width, which controls the threshold values for switching between on and off states. For the simulations, the output was chosen as , ensuring that the output signal can effectively drive the process toward the desired operating point. The hysteresis width was chosen to be , providing a balanced sensitivity that avoids excessive switching while maintaining responsiveness to changes in the system’s error signal. These parameters were carefully tuned to optimize the relay controller’s performance within the overall control strategy, ensuring stability and precision in maintaining the target 13C isotope concentration.
5.2. PID Controller
A proportional–integral–derivative (PID) controller [
48] is a fundamental control strategy widely used in industrial automation for its simplicity and effectiveness. It adjusts the control input based on three components:
Proportional (P): Responds to the current error (difference between setpoint and process variable), providing immediate corrective action.
Integral (I): Addresses accumulated past errors, helping to eliminate steady-state error and ensure long-term accuracy.
Derivative (D): Predicts future error based on its rate of change, offering a damping effect to reduce overshoot and improve stability.
The PID controller’s parameters—proportional gain, integral time, and derivative time—must be tuned carefully to achieve optimal performance. While versatile and easy to implement, PID controllers can struggle with nonlinear systems or significant time delays, where more advanced strategies might be required. Despite this, PID remains a cornerstone of process control for its reliable and balanced response in a wide range of applications.
The PID controller was tuned through an online optimization process, where the system was configured in closed-loop form to follow the response of a first-order transfer function , chosen for its simplicity and well-defined dynamics. This tuning methodology used a cascaded control structure: a PI controller was used to dynamically adjust the PID parameters in real time to minimize the error between the actual system response and the reference model output.
The transfer function of
is given by
The process was performed sequentially to ensure stable convergence. The output of the PI controller was first connected to tune the proportional gain (
), while the integral (
) and derivative (
) times were kept constant. Once an optimal
value was established, the PI controller’s output was then switched to optimize the integral time (
), and finally, the derivative time (
). This sequential approach allowed for the methodical and independent refinement of each parameter, ensuring the system’s response closely followed the desired first-order dynamics, as illustrated in
Figure 9.
The PI controller is responsible for managing the error between the system response and the reference model, allowing precise adjustments to the proportional, integral and derivative constants of the PID controller. This combination of PID and PI control ensures that both immediate and accumulated errors are being addressed, enabling the system to closely follow the setpoint signal.
The general formula to define a PI controller is given by
The gains for the supervisory PI controller ( and ) were tuned manually through an iterative process. The objective was to achieve a fast yet stable and smooth adaptation of the main controller’s parameters, ensuring robust performance across all tested scenarios.
This online tuning approach facilitated the real-time adjustment of the PID parameters based on observed performance. By continuously adjusting the settings to minimize error, the strategy effectively optimized both the transient and steady-state performance, enhancing the system’s ability to meet its control objectives and maintain desired operating conditions.
The parameters of the PID controller used to control the separation process obtained through online adaptation are detailed in
Table 5.
The ideal PID controller has the following form:
The combination of these three components allows the PID controller to provide a balanced control action by reacting to the present error, correcting past errors, and anticipating future errors, thereby achieving stable and accurate control of the system.
5.3. FOPI Controller
A fractional-order proportional–integral (FOPI) controller [
49,
50] is an advanced control strategy that extends the traditional proportional–integral (PI) controller by incorporating fractional calculus, allowing for non-integer-order differentiation and integration. This provides greater flexibility and precision in tuning the controller, enabling it to better handle complex and dynamic systems.
Fractional Proportional (P) Control: Similar to the standard PI controller, the proportional term adjusts the control signal based on the current error. However, in FOPI, the proportional gain can be tuned with fractional exponents, offering finer control over the system’s response.
Fractional Integral (I) Control: The integral term in an FOPI controller is defined by a fractional order, allowing it to accumulate past errors with a degree of memory that can be adjusted more precisely than in integer-order systems. This helps in reducing steady-state error while providing smoother and more robust performance, particularly in systems with complex dynamics or disturbances.
The key advantage of an FOPI controller lies in its ability to more accurately model and control systems with nonlinear behavior, long memory, or dynamics that are not well-represented by traditional integer-order controllers. By adjusting the fractional orders of the proportional and integral terms, the FOPI controller can achieve better stability, reduced overshoot, and improved overall performance in a wide range of applications, particularly in processes with fractional dynamics.
Despite its complexity, the FOPI controller is increasingly used in fields like robotics, electrical systems, and process control where enhanced precision and adaptability are required.
Similar to the PID controller, the FOPI controller was tuned using the same online optimization approach. In this method, the system was configured in a closed-loop setup to emulate the response of a first-order transfer function, denoted as . This approach involved dynamically adjusting the control input based on real-time feedback to match the desired system behavior. The parameters of the PI controller used to refine the tuning of the FOPI controller are and .
The tuning process for the FOPI controller commenced by configuring the system to track the response of the first-order transfer function presented in (17), selected for its simplicity and effectiveness in demonstrating the desired control dynamics. The proportional gain () and integral time () were tuned using the same online adaptation methodology with a supervisory PI controller as described for the standard PID controller. This involved sequentially connecting the PI controller’s output to optimize first and then to ensure the system’s response closely followed the reference model. Subsequently, the fractional order was manually adjusted to further refine the control action, enhancing both the transient and steady-state performance.
The final tuned parameters for the FOPI controller are detailed in
Table 6. The integral gain
, which is related to
by the expression
, is also included for clarity.
The ideal FOPI controller has the following form:
This structure (20) combines a proportional term with a fractional-order integral term. The inclusion of the non-integer order provides an additional degree of freedom for tuning, enabling enhanced control performance and greater flexibility compared to traditional integer-order PID controllers. This makes it particularly well-suited for managing the complex dynamics of the separation process.
5.4. FOPID Controller
A fractional-order proportional–integral–derivative (FOPID) controller [
51] is an advanced form of the traditional PID controller that incorporates fractional calculus, allowing the proportional, integral, and derivative components to operate at non-integer orders. This added flexibility provides a more nuanced control, enabling better handling of complex, nonlinear, or dynamic systems.
Fractional Proportional (P) Control: Similar to the traditional PID, this term adjusts the control signal based on the current error, but with a fractional exponent that can be finely tuned for more precise control.
Fractional Integral (I) Control: The fractional integral term allows for a more flexible accumulation of past errors, improving the controller’s ability to eliminate steady-state error and adapt to system dynamics.
Fractional Derivative (D) Control: The fractional derivative component predicts future errors by considering the rate of change with a fractional order, enhancing the system’s stability and reducing overshoot more effectively than integer-order derivatives.
The key advantage of the FOPID controller is its ability to provide better control performance in systems where the dynamics are complex or not well-suited to traditional integer-order controllers. By allowing the orders of the proportional, integral, and derivative terms to be fractional, the FOPID controller can be more finely tuned, offering improved robustness, stability, and accuracy.
This makes FOPID controllers particularly useful in advanced applications such as robotics, aerospace, and industrial processes where precise control over a wide range of operating conditions is essential. Despite its greater complexity, the FOPID controller is becoming increasingly popular due to its superior performance in managing challenging control tasks.
Similarly to the PID and FOPI controllers, the FOPID controller was tuned using an online optimization approach based on a reference model. The established sequential tuning procedure was followed, whereby a supervisory PI controller (with parameters and ) was used to dynamically adjust the FOPID parameters one at a time. The system was configured in a closed-loop setup to replicate the response of a first-order transfer function, , selected for its simplicity and effectiveness in demonstrating the desired control dynamics.
The output of the PI controller was first connected to tune the proportional gain (
) of the FOPID controller. Once an optimal value was found, the connection was switched sequentially to optimize the integral time (
) and then the derivative time (
). Finally, the fractional orders
and
were manually adjusted to refine the control action. This iterative process, illustrated in
Figure 9, ensured the system’s response was precisely aligned with the reference model.
The parameters of the FOPID controller used to control the separation process are detailed in
Table 7.
The ideal FOPID controller has the following form:
By leveraging fractional-order elements in both the integral and derivative terms, the finely tuned FOPID controller achieved an optimal balance of control actions, enhancing system stability, transient response, and steady-state performance.
5.5. Online Adaptation Mechanism for Controller Parameters
The core novelty of the proposed control strategies lies in their online adaptation capability. This is achieved through a supervisory PI controller that dynamically adjusts the parameters of the main controllers (PID, FOPI, FOPID) in real time. The neural network, whose weights are fixed after offline training, provides a model of the process dynamics. The adaptation mechanism itself operates on the following principle:
The update of the main controller’s parameters (denoted generically as , which can represent , , , , or ) is performed by a dedicated supervisory PI controller. The adaptation process for each parameter is executed sequentially to ensure stability and convergence.
At each time step of the simulation, the following calculations are performed:
- 1.
Error Calculation: The adaptation error is computed as the difference between the output of the reference first-order model and the output of the actual process :
- 2.
Supervisory PI Output: The output of the supervisory PI controller
is calculated based on this error:
where
and
are the fixed gains of the supervisory controller.
- 3.
Parameter Update: The output of the supervisory controller is then directly assigned as the new value for the specific main controller parameter being tuned at that stage:
This update rule applies whether is a gain or a time constant. The tuning procedure is sequential: the supervisory controller’s output is first connected to optimize , then to , and subsequently to other parameters (e.g., , ), once the previous parameter has converged to a stable value.
This method ensures that the main controller’s parameters are continuously optimized to minimize the error between the process and the desired reference model, providing robust performance across varying operational conditions.
6. Simulation Results
The benefits of incorporating artificial intelligence into the process modeling for the dynamics of the 13C isotopic separation process include the enhanced accuracy achieved through the implementation of neural models and the capability to design an online adaptation algorithm that responds to variations in the structural parameters of the separation process.
In the simulation of the 13C isotopic separation process, the function was implemented using artificial intelligence (AI) techniques to align with the differential fractional-order integrator for the mathematical model. This approach involved leveraging AI to dynamically adjust the function , ensuring that it effectively mimicked the behavior of the fractional-order integrator.
The use of AI in this context provided a powerful method for modeling and optimizing the separation process. By training AI models, such as neural networks, on the behavior of the fractional-order integrator, the simulation could accurately reflect the complex dynamics of the process. The AI-driven implementation of the fractional-order integrator facilitated real-time adjustments and refinements based on feedback, enabling the simulation to closely follow the differential fractional-order integrator’s response.
This method ensured that the simulation not only captured the intricate details of the process dynamics but also adapted to variations and perturbations in real time. The AI-based implementation of allowed for a more precise representation of the fractional-order behavior, enhancing the accuracy and reliability of the mathematical model. Consequently, the simulation provided valuable insights into the process, supporting the development of more effective control strategies and optimization techniques for the isotopic separation process.
Additionally, this paper integrates several intelligent control techniques to further optimize the process. The relay controller utilizes a simple on–off control strategy to manage the system’s response based on preset thresholds. The PID controller employs proportional, integral, and derivative control actions to provide precise and stable control by addressing current, past, and future errors. The FOPI controller incorporates fractional-order integration to enhance control flexibility and accuracy, adapting to complex system dynamics. Lastly, the FOPID controller extends the PID approach with fractional-order elements in both the integral and derivative terms, offering advanced control capabilities and improved system performance.
These techniques collectively contribute to a more robust and adaptable control strategy for the isotopic separation process, ensuring optimal performance under varying conditions.
6.1. Comparison Between the Simulation Results of the Four Proposed Control Strategies
To evaluate the effectiveness of various control strategies in optimizing the 13C isotopic separation process, a comparative analysis of four distinct controllers was conducted. The study assessed their performance in managing process dynamics and responding to varying operational conditions. The controllers examined include a conventional PID controller; a fractional-order proportional–integral (FOPI) controller, incorporating fractional-order integration for enhanced flexibility; a fractional-order proportional–integral–derivative (FOPID) controller, which extends the PID framework with fractional-order elements in both integral and derivative terms; and a relay-based on–off controller, representing a straightforward binary control mechanism.
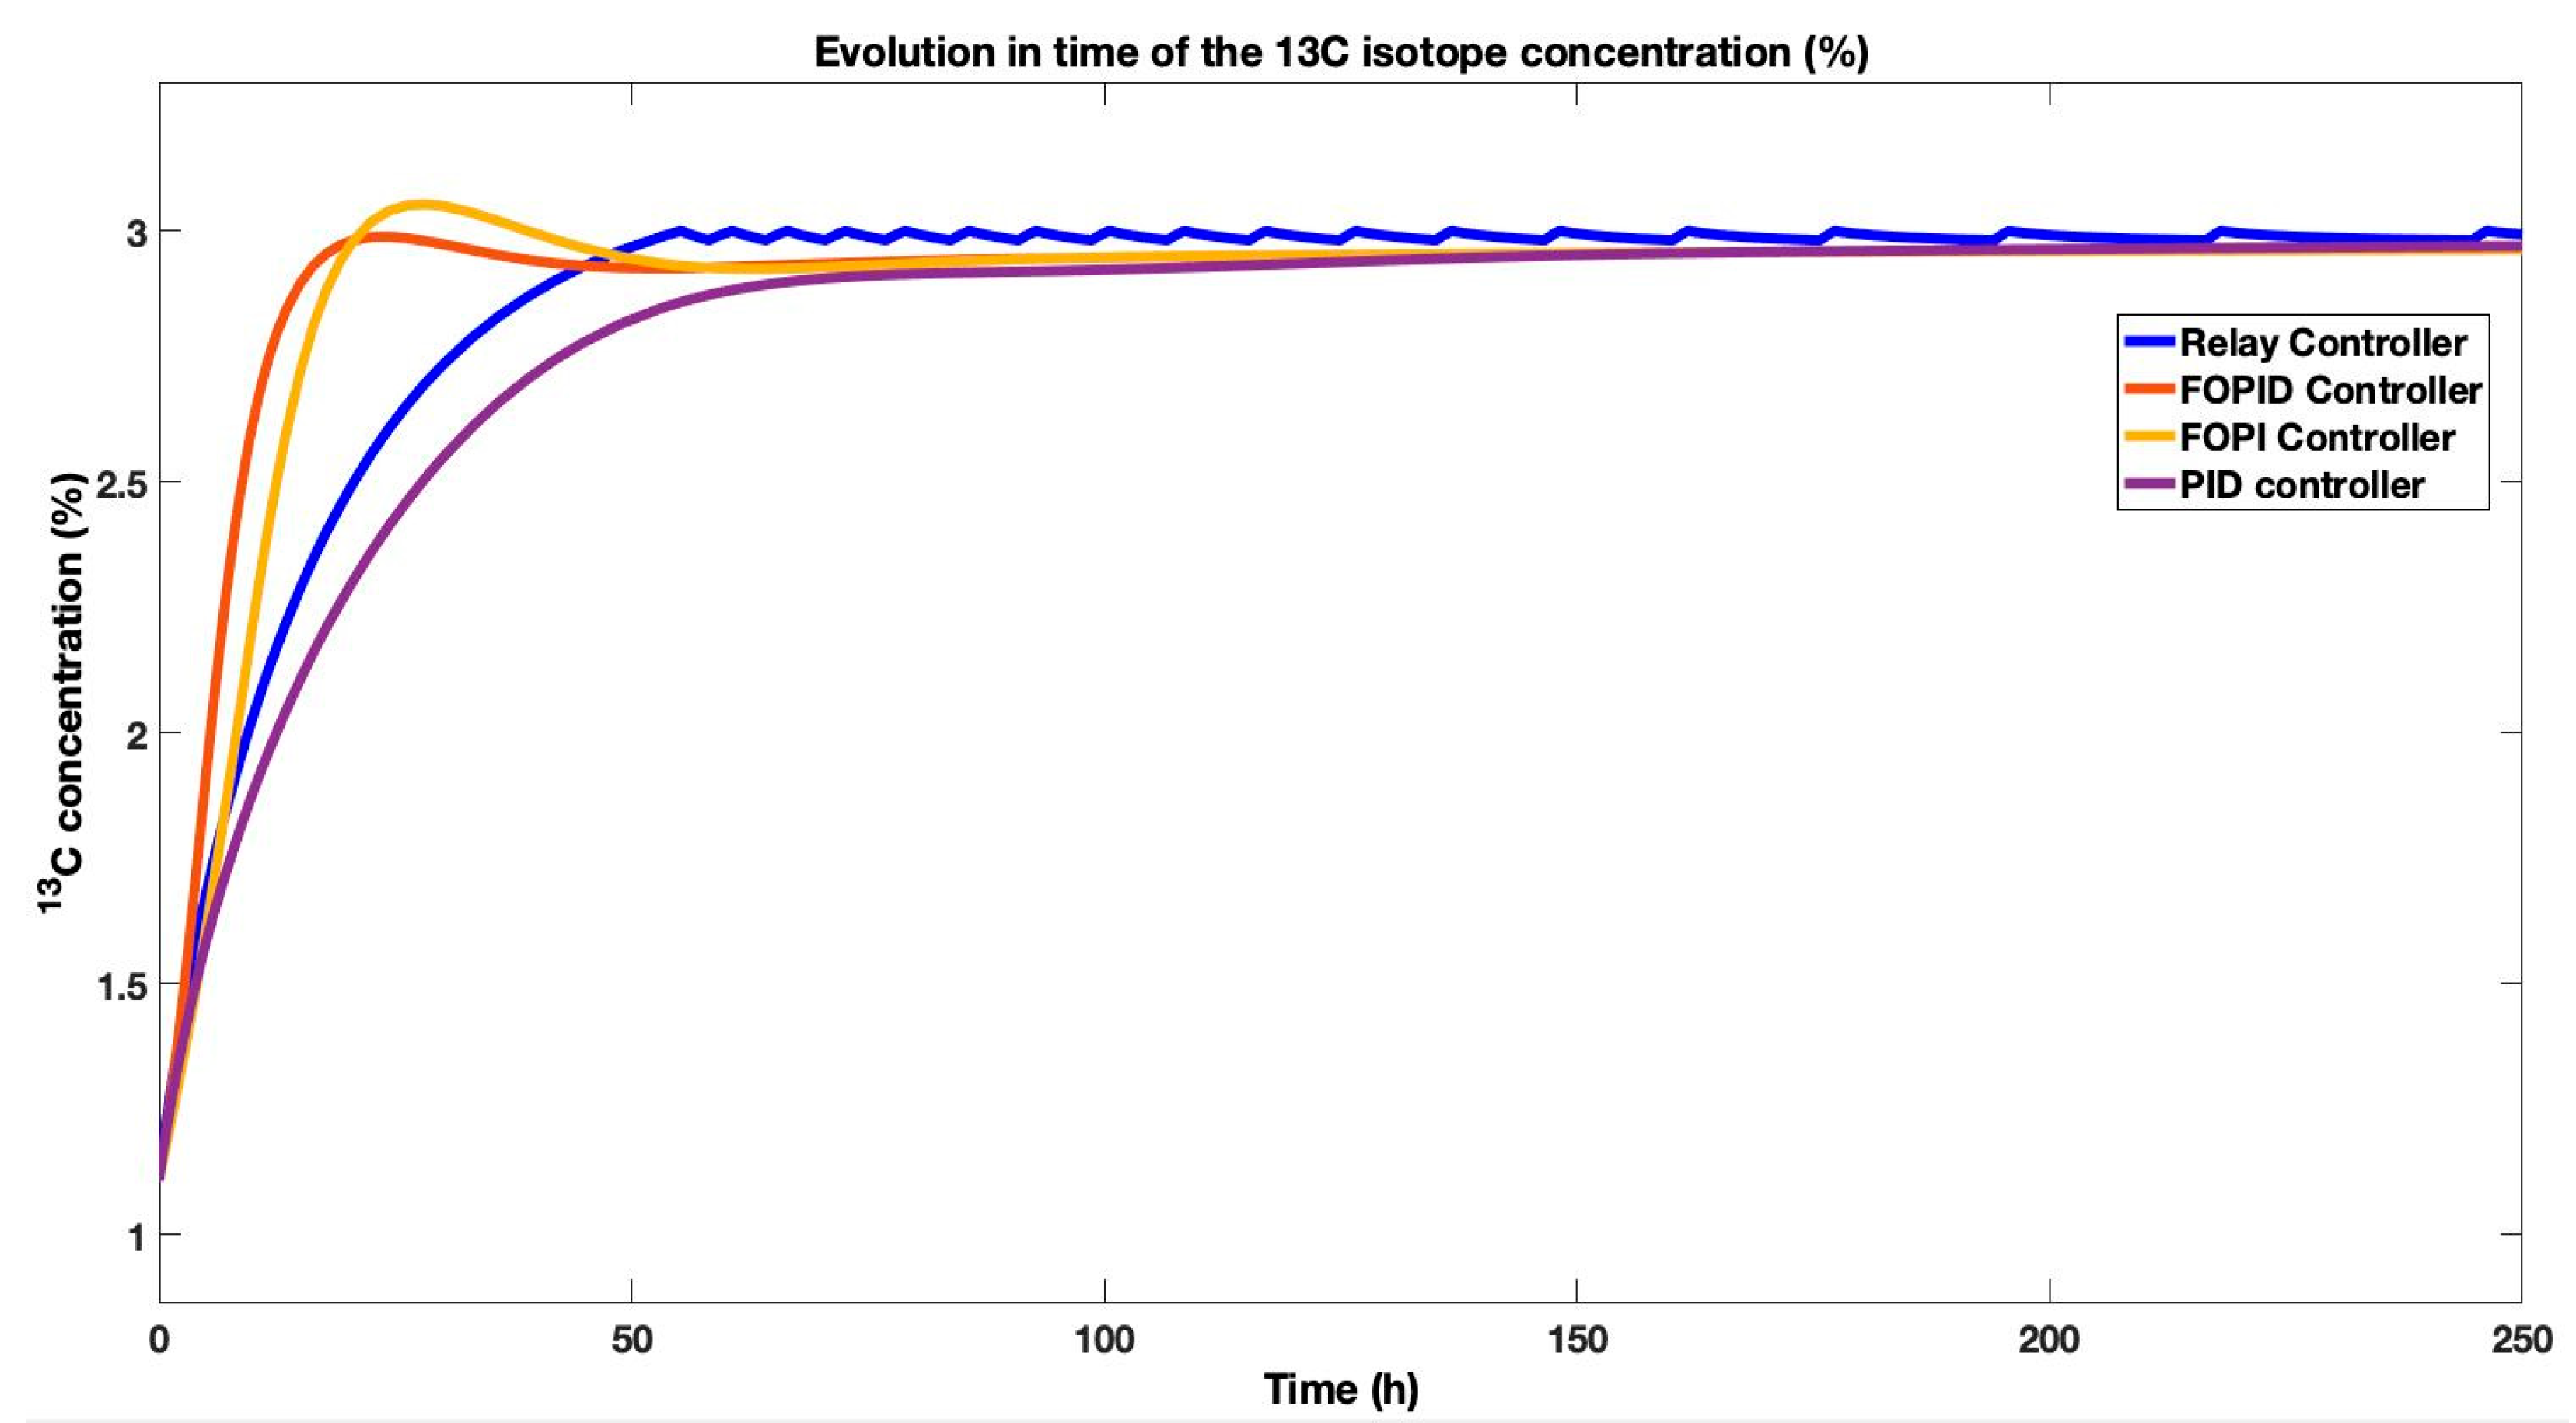
This systematic comparison aimed to identify the relative strengths and limitations of each approach in terms of stability, tracking accuracy, and adaptability to disturbances. The temporal responses of the separation process under each control strategy are compared in
Figure 10, providing critical insight into their effectiveness in handling the complex dynamics of isotopic separation.
A comparative analysis of the four control strategies applied to the
13C isotopic separation process reveals distinct performance characteristics, as illustrated in
Figure 10.
The relay controller, while achieving the shortest theoretical settling time of 62 h without any overshoot, exhibits persistent oscillations. This behavior indicates inherent instability, rendering it unsuitable for practical implementation. In a real-world plant, such oscillations would risk damaging critical equipment, such as the pump, or causing flooding or drying within the separation column, ultimately compromising the entire isotopic separation process. Consequently, this strategy is presented here solely as a theoretical benchmark.
The integer-order PID controller demonstrated robust performance with a settling time of 67 h, zero overshoot, and zero steady-state error. In contrast, the FOPI controller, leveraging fractional-order integration, achieved a significantly faster settling time of 50 h. This improvement came at the cost of a minor overshoot, which was effectively rejected within 24 h, after which the steady-state error was eliminated.
The FOPID controller, incorporating fractional-order elements in both its integral and derivative terms, delivered a settling time of 64 h. It exhibited an overshoot smaller than that of the FOPI controller, which was corrected within 18 h, followed by zero steady-state error.
The system performances (settling time, overshoot, steady-state error) obtained by the isotopic separation process in closed loop, implementing the proposed control strategies, are presented in
Table 8.
This analysis underscores the critical trade-off between response speed and stability. While the fractional-order controllers (FOPI and FOPID) offer superior settling times, the classic PID provides the most stable and oscillation-free response, proving to be a robust and practical choice for this application.
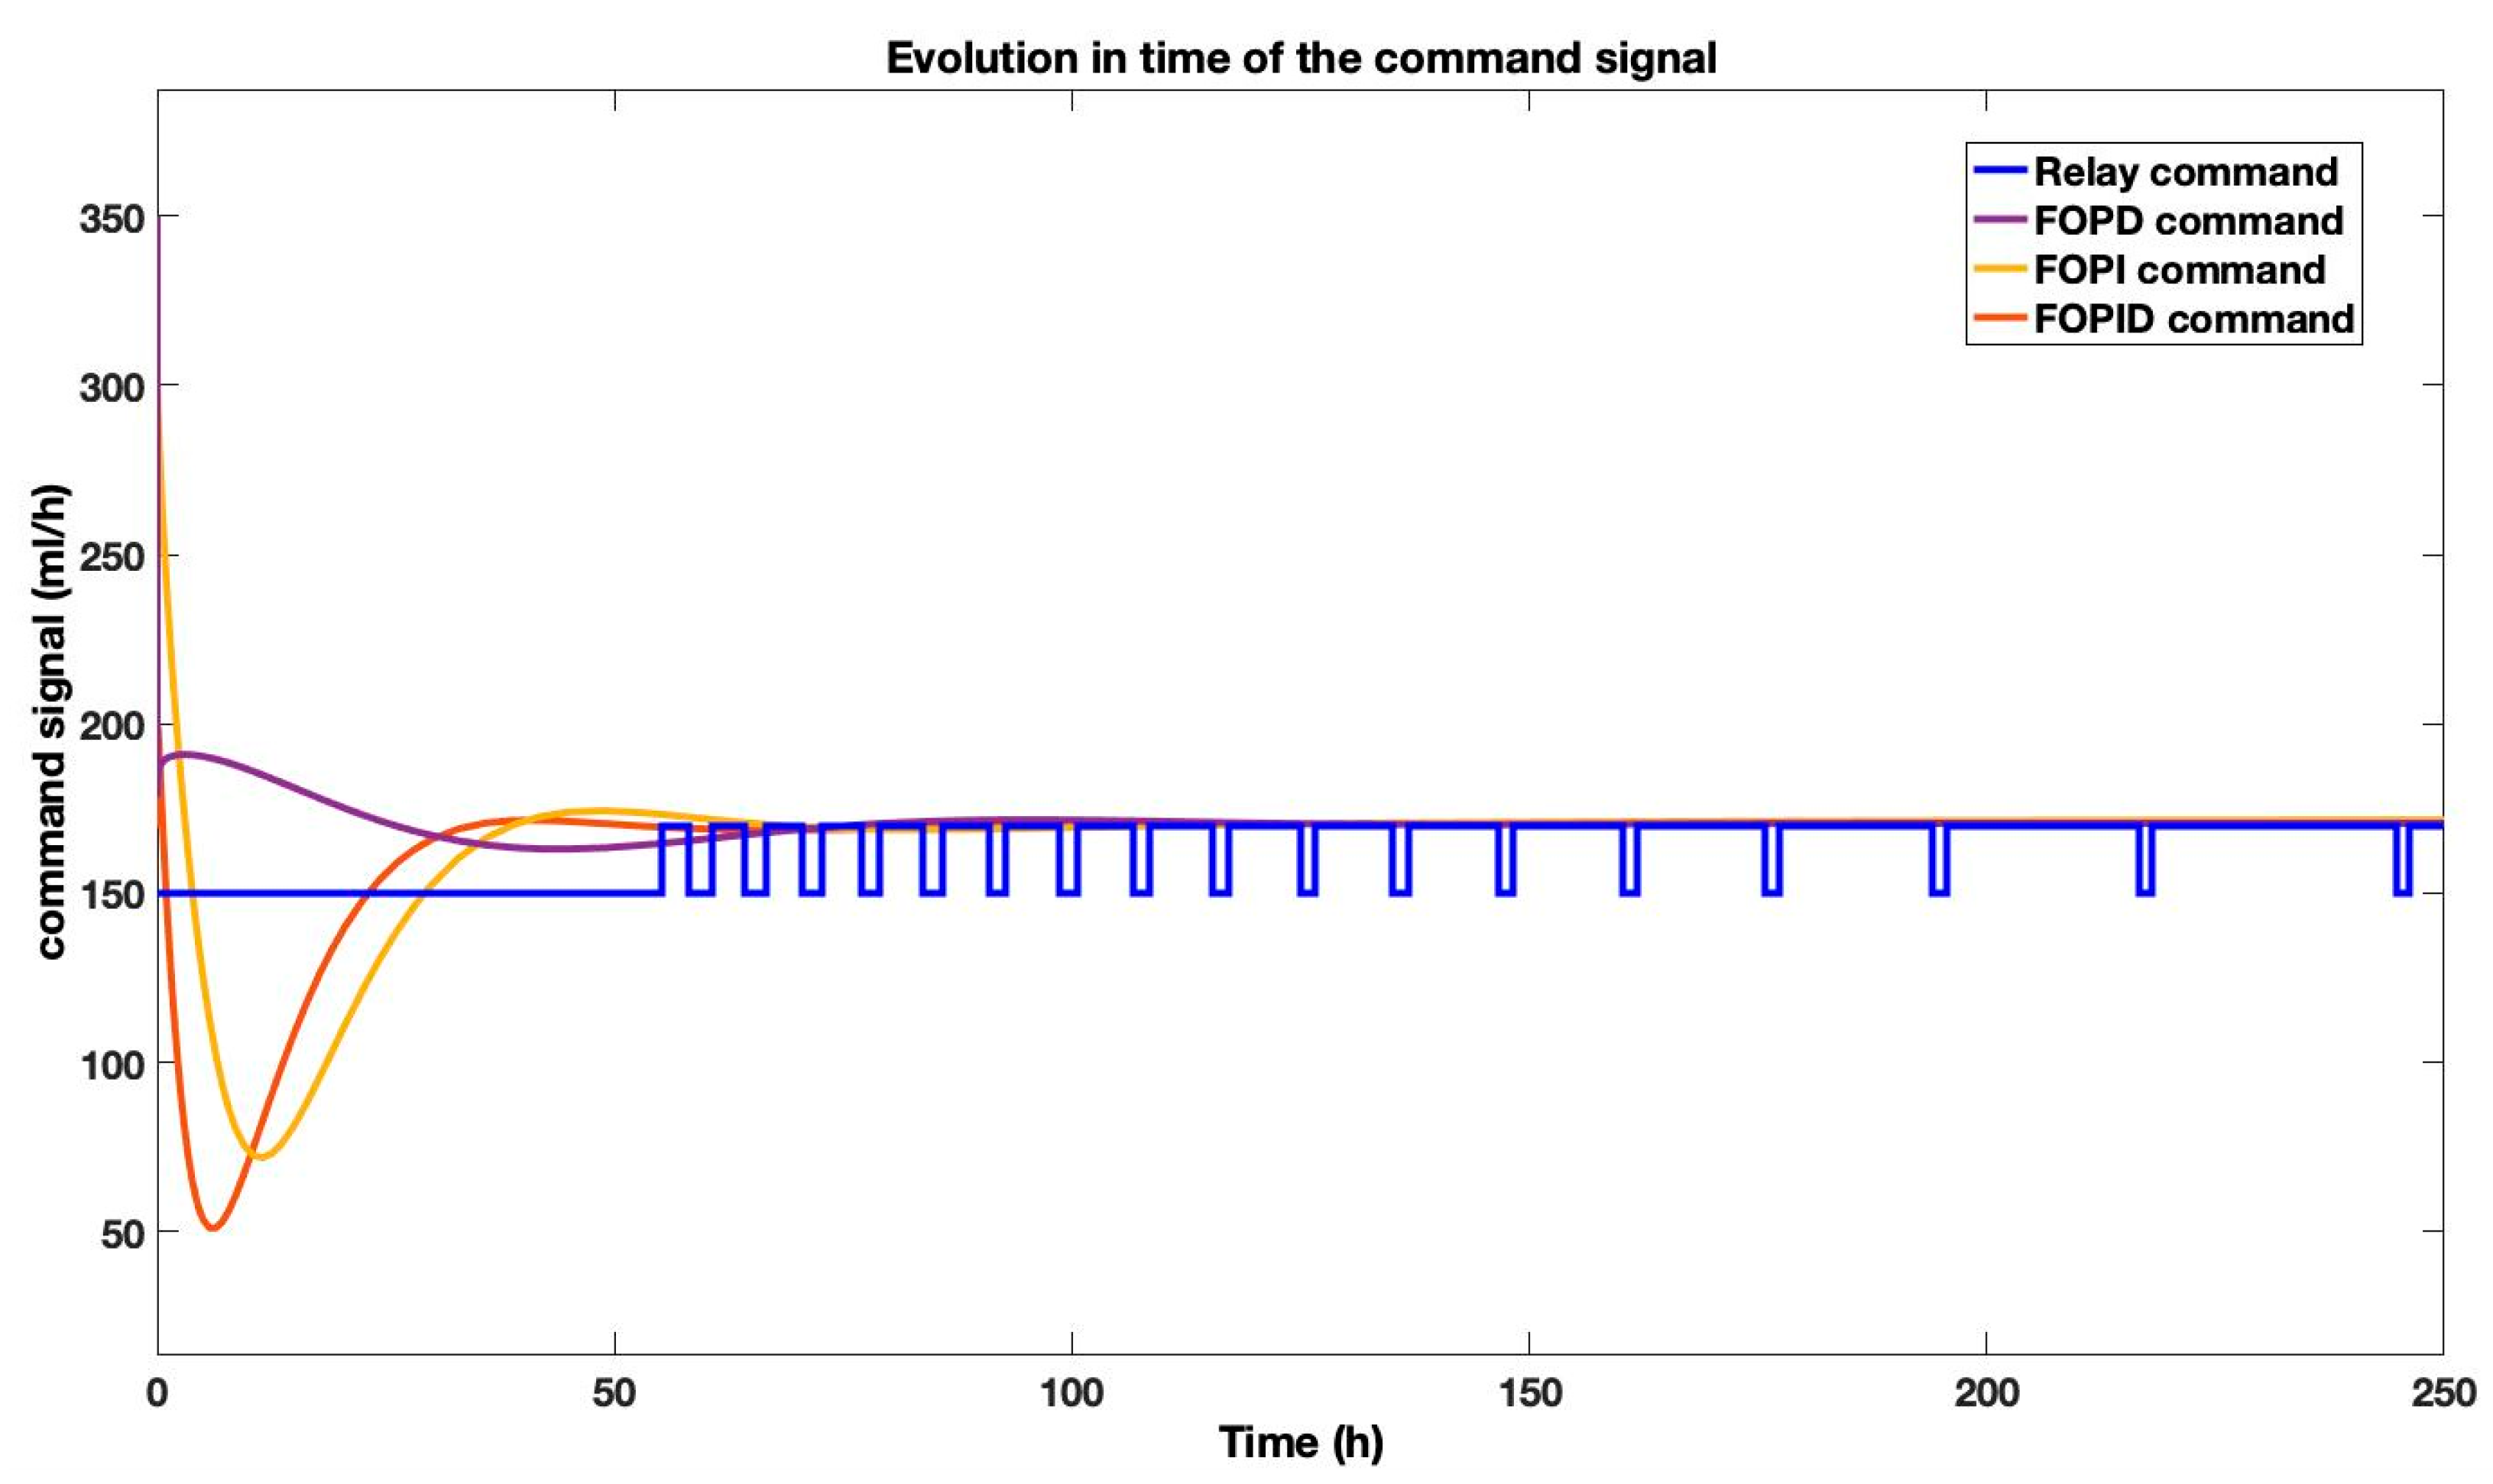
The comparison between the command signals required by each of the control strategies is presented in
Figure 11.
Figure 11 illustrates the specific control inputs (gas flow rates) generated by the relay, PID, FOPI, and FOPID controllers throughout the simulation. The analysis of these command signals reveals the distinct operational characteristics and control philosophies of each strategy.
The relay controller, employing a straightforward on–off mechanism, maintains a constant input of for the first 64 h. Upon nearing the setpoint, it begins oscillating aggressively between and . This oscillatory behavior—which would induce damaging hydraulic shocks to the pump and risk flooding or drying in the separation column in a real-world setting—highlights its fundamental instability and practical infeasibility.
In contrast, the PID controller demonstrates a more measured response. It initially demands a higher gas flow rate () to drive the process toward the setpoint and then smoothly adjusts to a stable, lower value as the process stabilizes, reflecting its balanced and robust nature.
The FOPI controller operates within a wider range of to , leveraging its fractional-order integration for a more aggressive initial response that leads to a faster settling time, as noted previously.
The most efficient performance is observed with the FOPID controller. It requires the smallest overall amount of gas, operating within a range of to . This indicates its superior efficiency in managing process dynamics effectively while optimizing gas usage, a critical factor for operational cost and sustainability.
This comparative analysis of command signals underscores the practical trade-offs between control aggression, stability, and operational efficiency, providing crucial insights for selecting a suitable controller for this application.
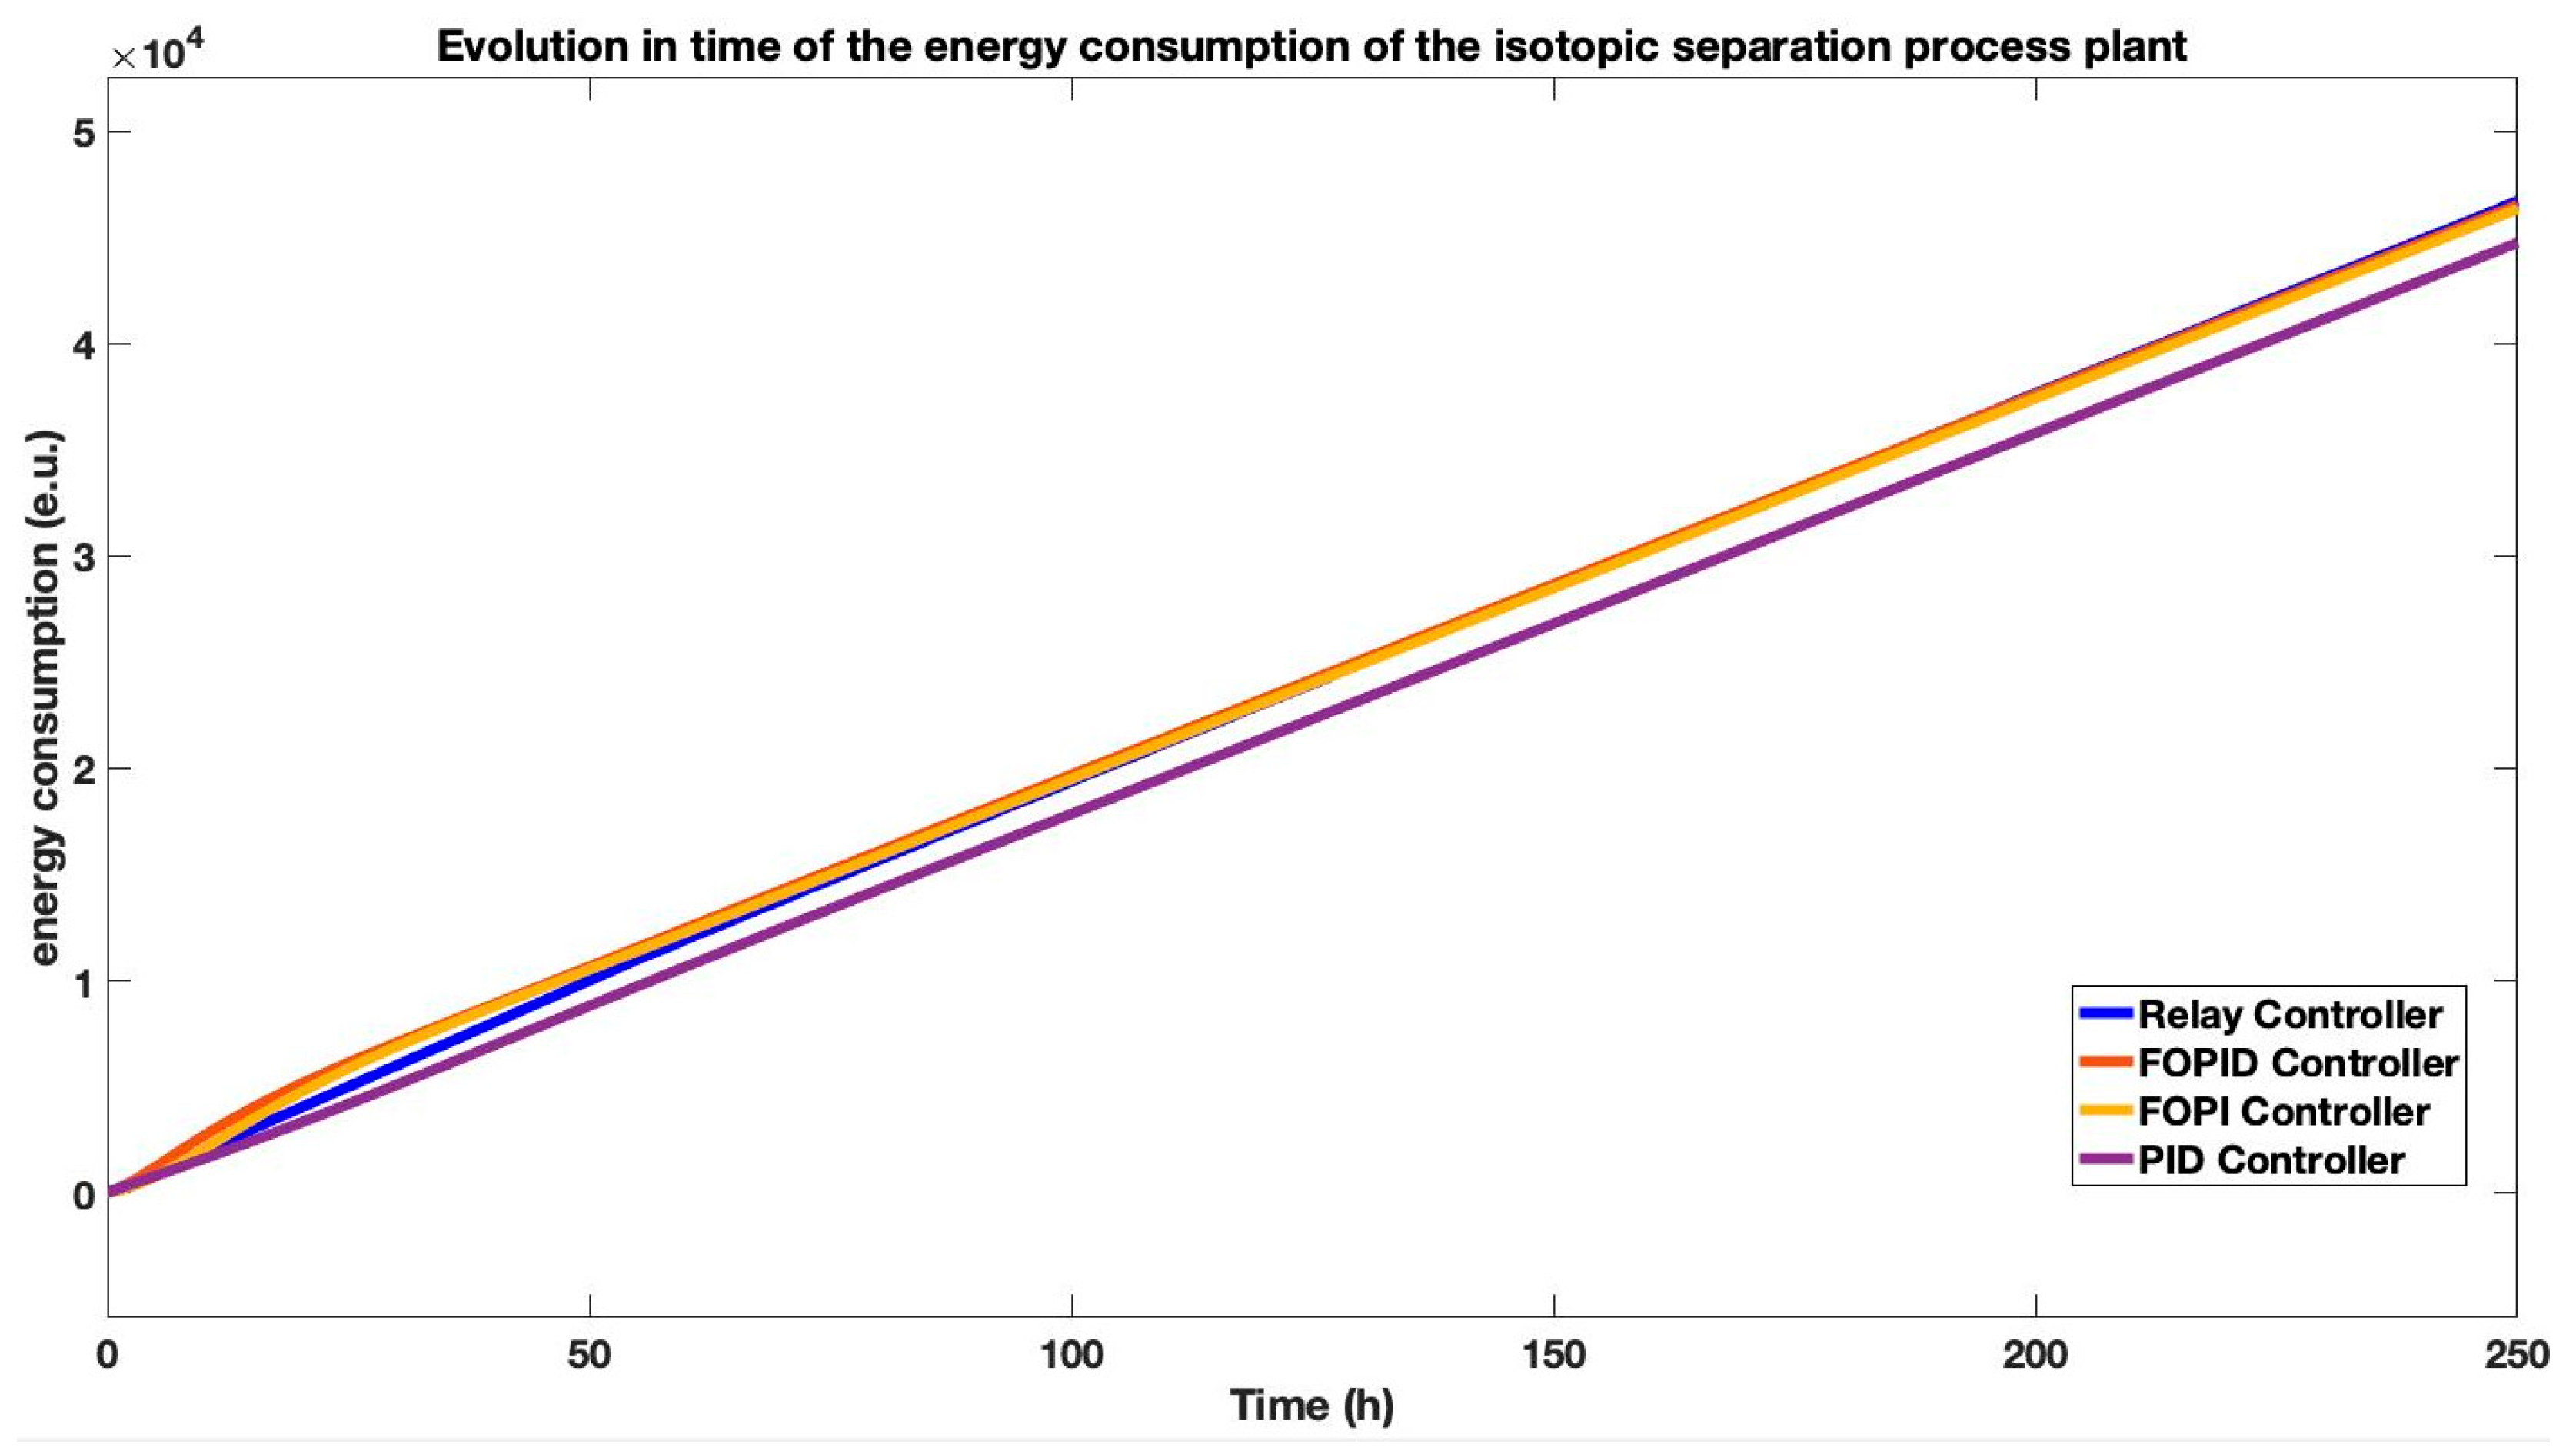
The energy consumption of the isotopic separation process plant under each control strategy is quantified in
Figure 12. The analysis reveals a significant trade-off between dynamic performance and energy efficiency. While the FOPI and FOPID controllers, tuned via online adaptation, achieved faster settling times as noted previously, this came at the cost of higher initial energy consumption. After approximately 60 h of operation, the theoretical relay controller—despite its instability—would consume an equivalent amount of cumulative energy to the fractional-order controllers, with all three strategies exceeding
(energy units) after
h. In contrast, the PID controller demonstrated superior energy efficiency, requiring the smallest cumulative total of approximately
over the same period. This highlights a key practical advantage of the PID controller, as its stable and less aggressive command signals translate directly into lower operational costs for the separation plant.
6.2. Online Adaptation of the PID Controller Structure
To validate the efficiency of the online adaptation strategy for PID control, its performance was benchmarked against a reference first-order transfer function (17).
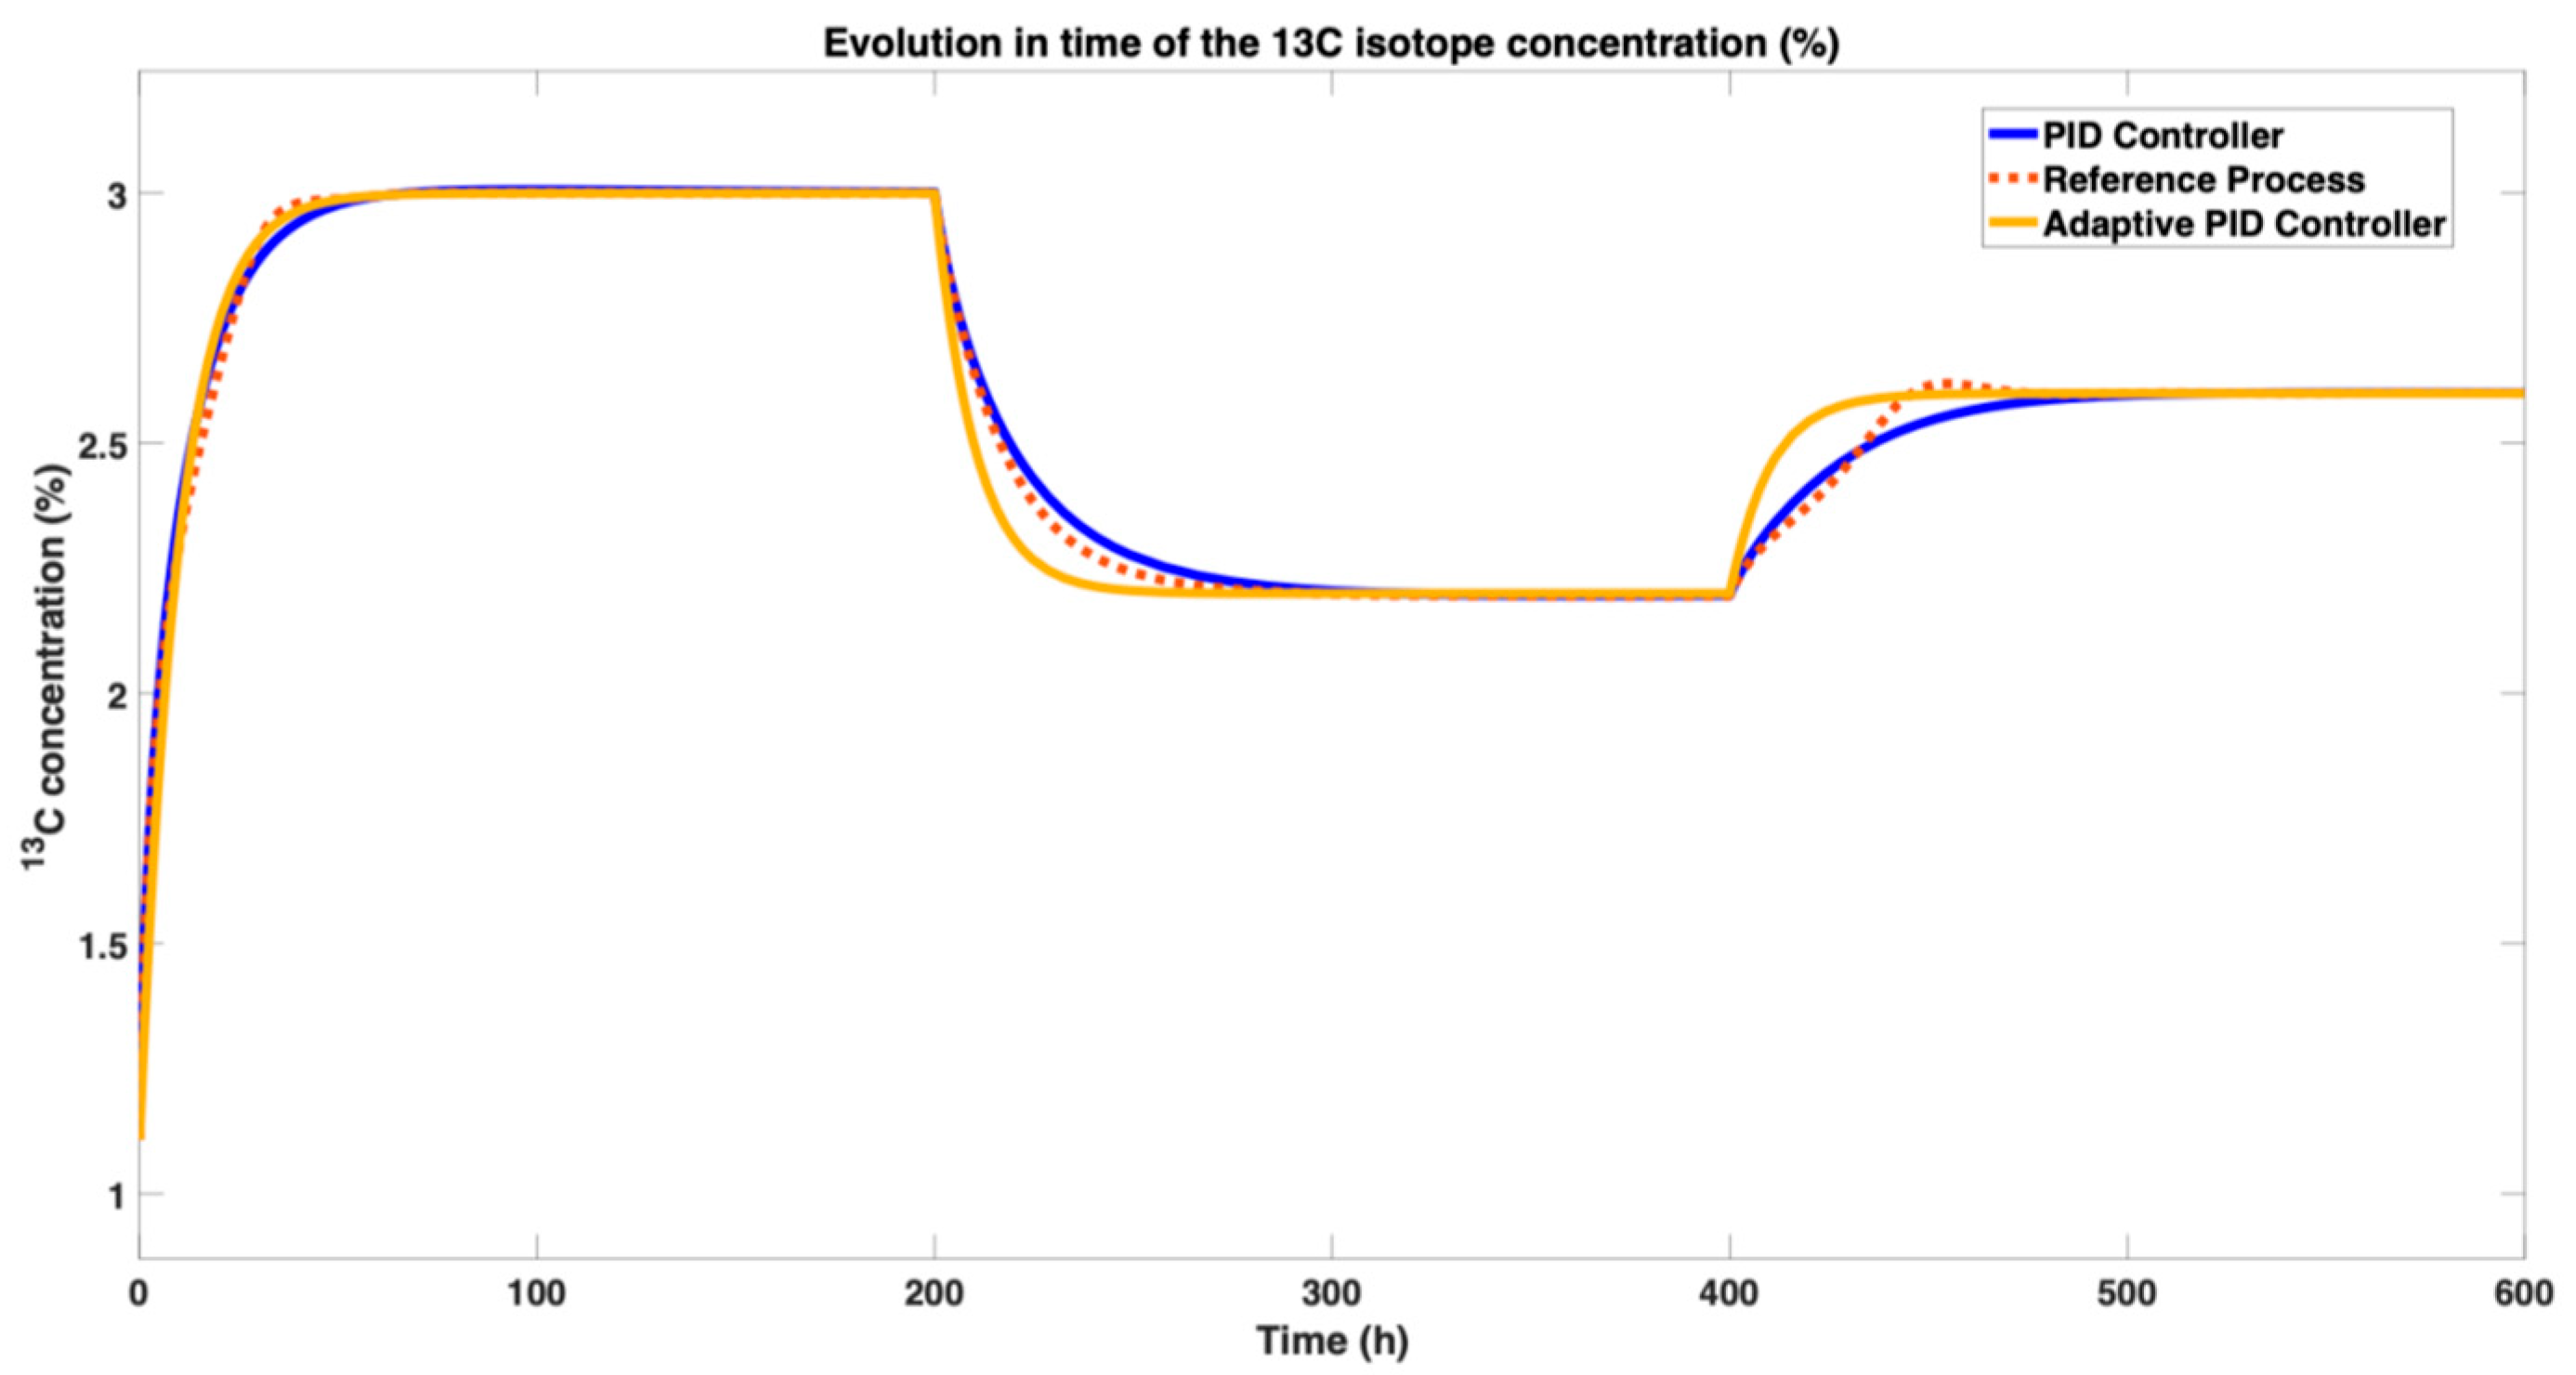
Figure 13 illustrates the evolution of the
13C isotope concentration over time for an input flow of
, comparing the standard online-tuned PID controller, an adaptive PID controller (where the supervisory PI controller’s output from
Figure 9 continuously adjusts the integral time,
, based on the error signal which is computed as the difference between the concentration’s output on the first-order function
and the output of the isotopic separation process in the closed loop, implementing the adaptive PID controller), and the reference model.
The adaptive PID controller demonstrates superior tracking performance, most closely following the reference process despite setpoint changes from
to
at
and subsequently to
at
. All three scenarios successfully achieve the setpoints with zero steady-state error and no overshoot, confirming the effectiveness of the underlying control structures. The performance of the adaptive control strategy was further validated by analyzing its settling time across each distinct setpoint phase in comparison to the standard PID controller. For the initial setpoint of
), the adaptive PID controller achieved a settling time of 64 h, a marginal improvement over the PID controller’s 67 h. However, its superior adaptability became profoundly clear during subsequent setpoint changes. When the setpoint was changed to
, the adaptive PID settled in just 49 h, outperforming the standard PID—which required 92 h to settle—by a remarkable
. This performance advantage was maintained during the final phase
for a setpoint of
, where the adaptive PID’s settling time of 65 h was
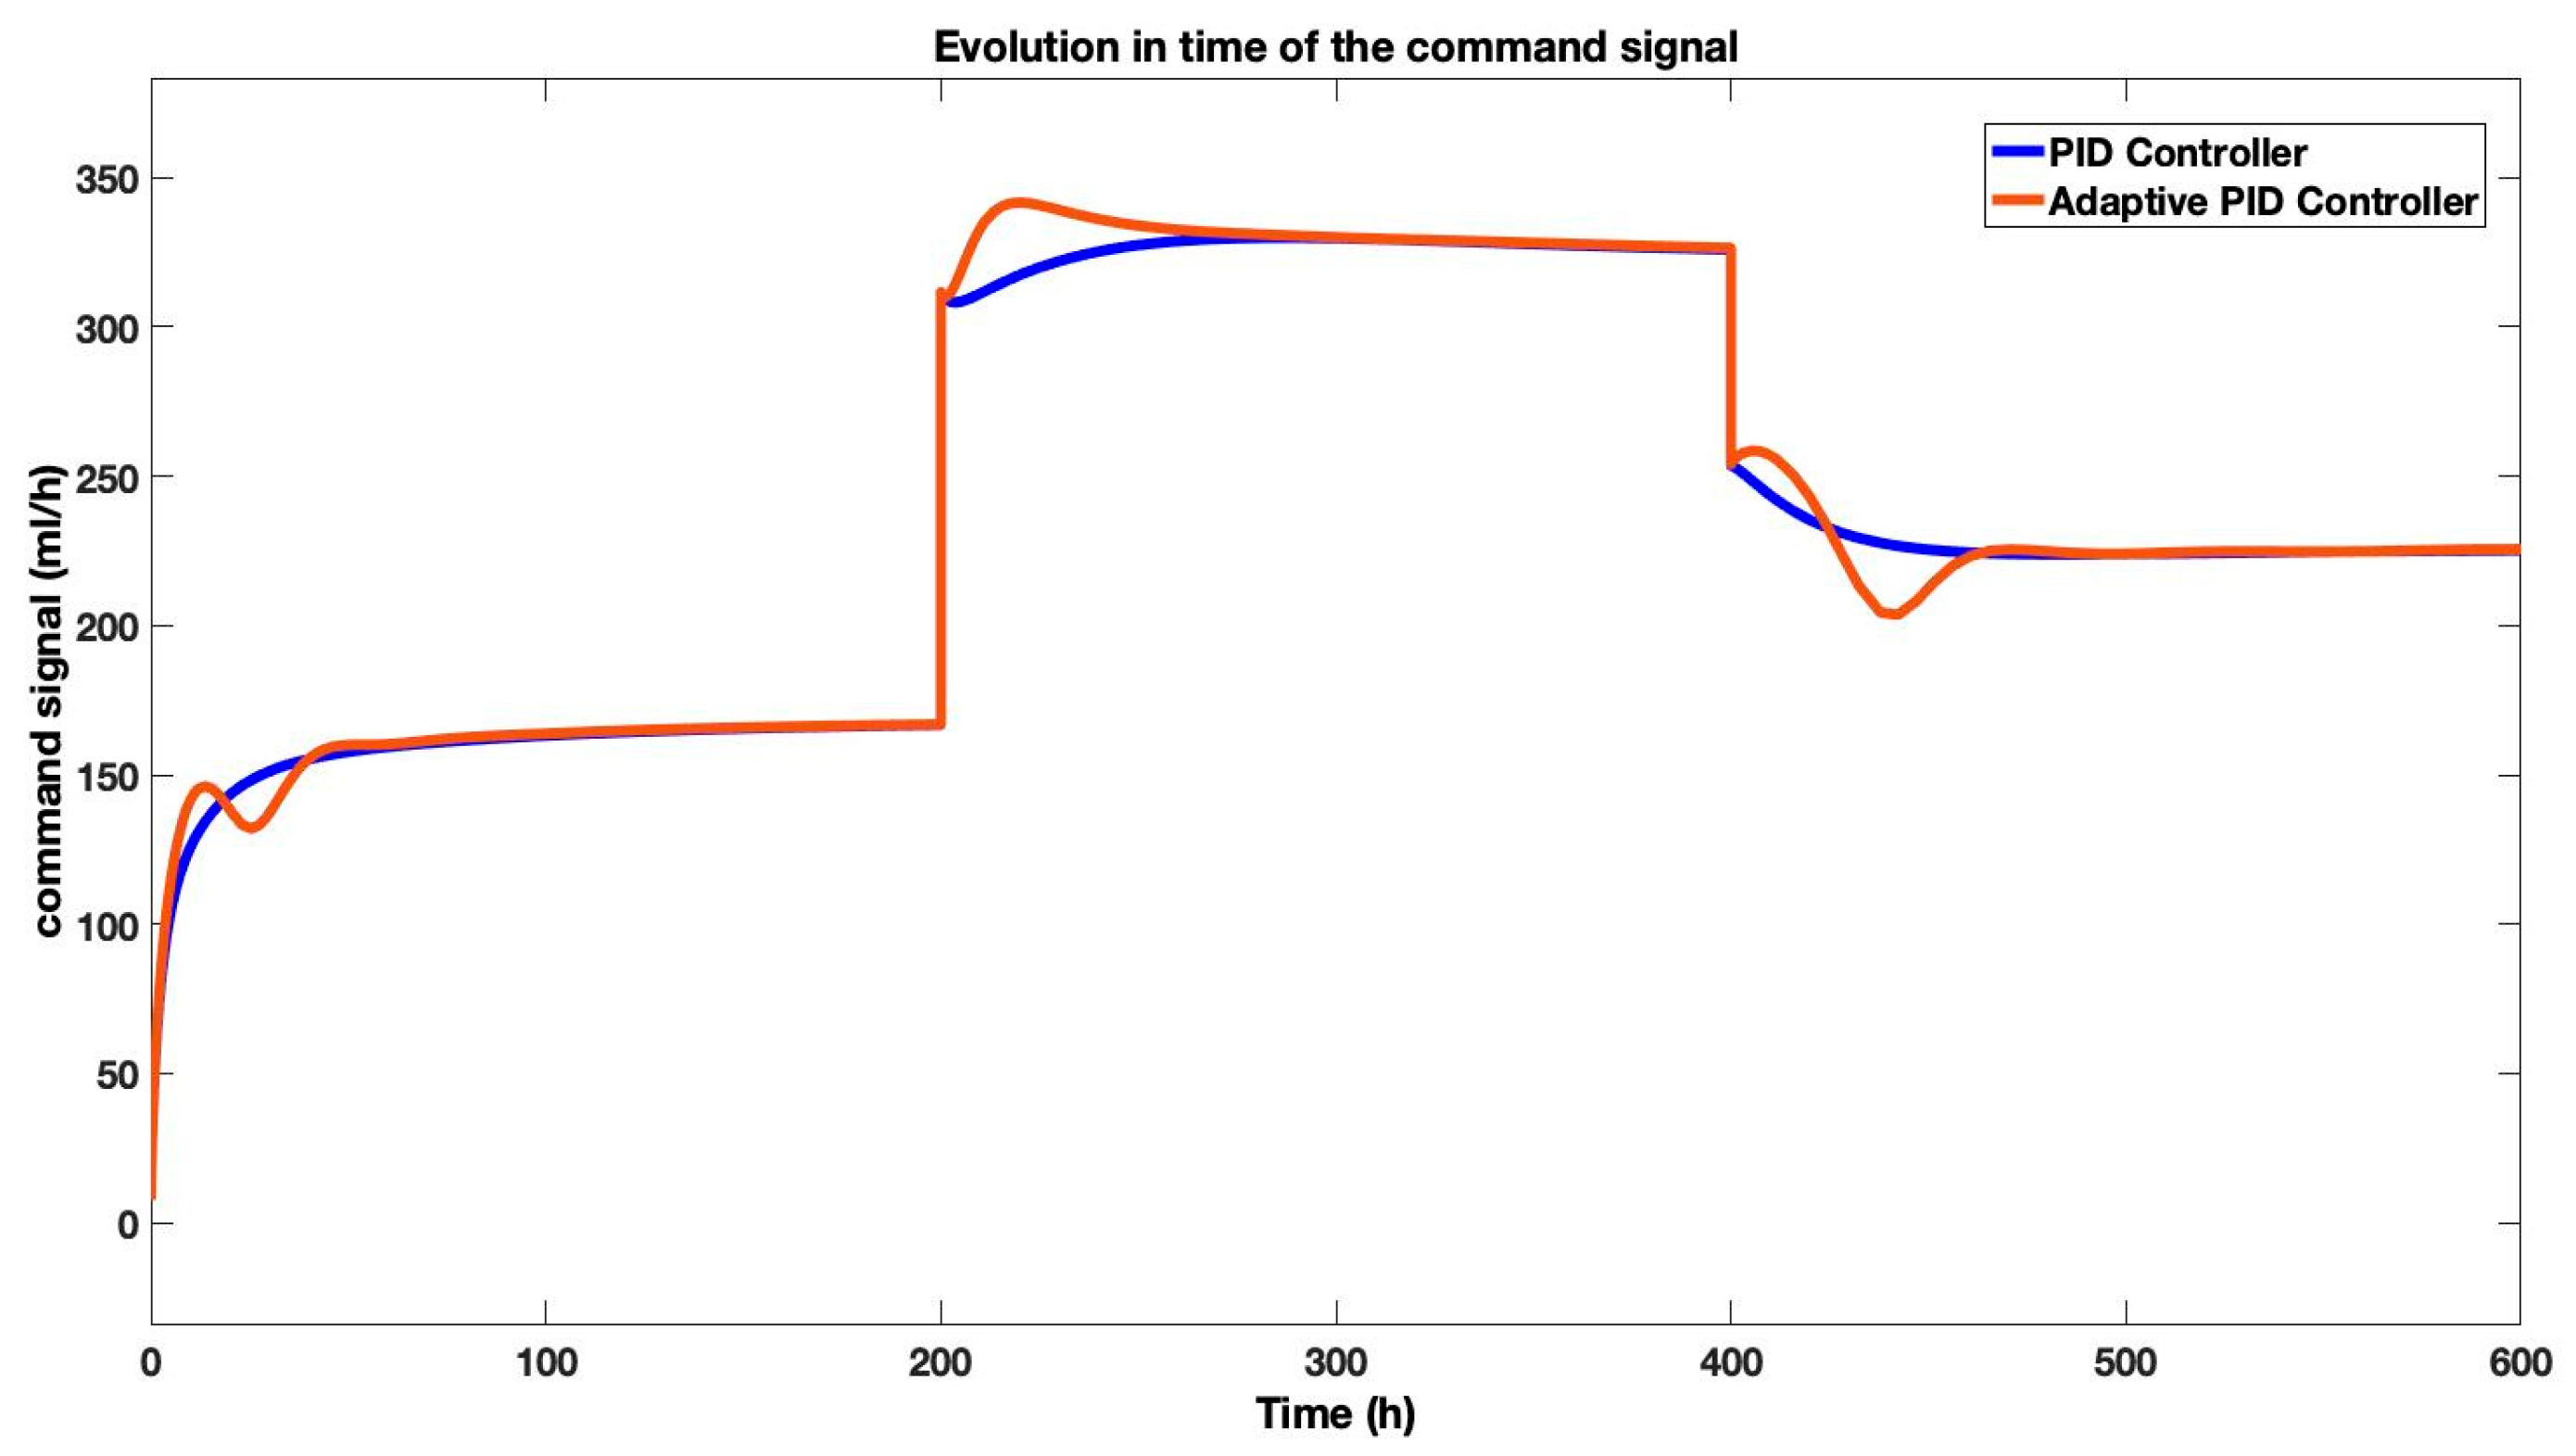
faster than the standard PID’s 75 h. This consistent and significant reduction in settling time, especially after setpoint changes, unequivocally demonstrates the adaptive controller’s enhanced responsiveness and robustness in managing the system’s dynamic behavior. The corresponding command signals for the gas flow rate (monoethanolamine) are presented in
Figure 14. While the command ranges for both controllers are similar and within feasible limits for real-world implementation, the adaptive PID controller requires a slightly higher, more aggressive flow rate during setpoint transitions to achieve its improved tracking performance. This trade-off between dynamic response and control effort highlights the practical value of the online adaptation approach in optimizing the
13C isotopic separation process.
From the analysis of
Figure 13 and
Figure 14, it is evident that the online adaptation strategy for the PID controller achieves notable success. Both the standard PID and the adaptive PID controllers effectively track the reference process, as illustrated by the close alignment between the actual concentration of the
13C isotope and the desired setpoints. This precise tracking, achieved with zero steady-state error, confirms the controllers’ capability to manage the process dynamics accurately.
A key distinction lies in their dynamic performance: the adaptive PID controller demonstrates superior tracking during setpoint changes, more closely following the reference model, while the standard PID controller exhibits a more conservative but stable response. Furthermore, the command signals generated by both controllers, detailed in
Figure 14, remain within a feasible and acceptable range for implementation. The standard PID maintains a stable command signal, crucial for operational efficiency, while the adaptive PID employs a slightly more aggressive, yet still practical, control action to achieve its improved performance. The consistent and robust performance of both controllers highlights the value of the online adaptation approach, ensuring the process operates smoothly and meets target concentrations without requiring impractical control inputs.
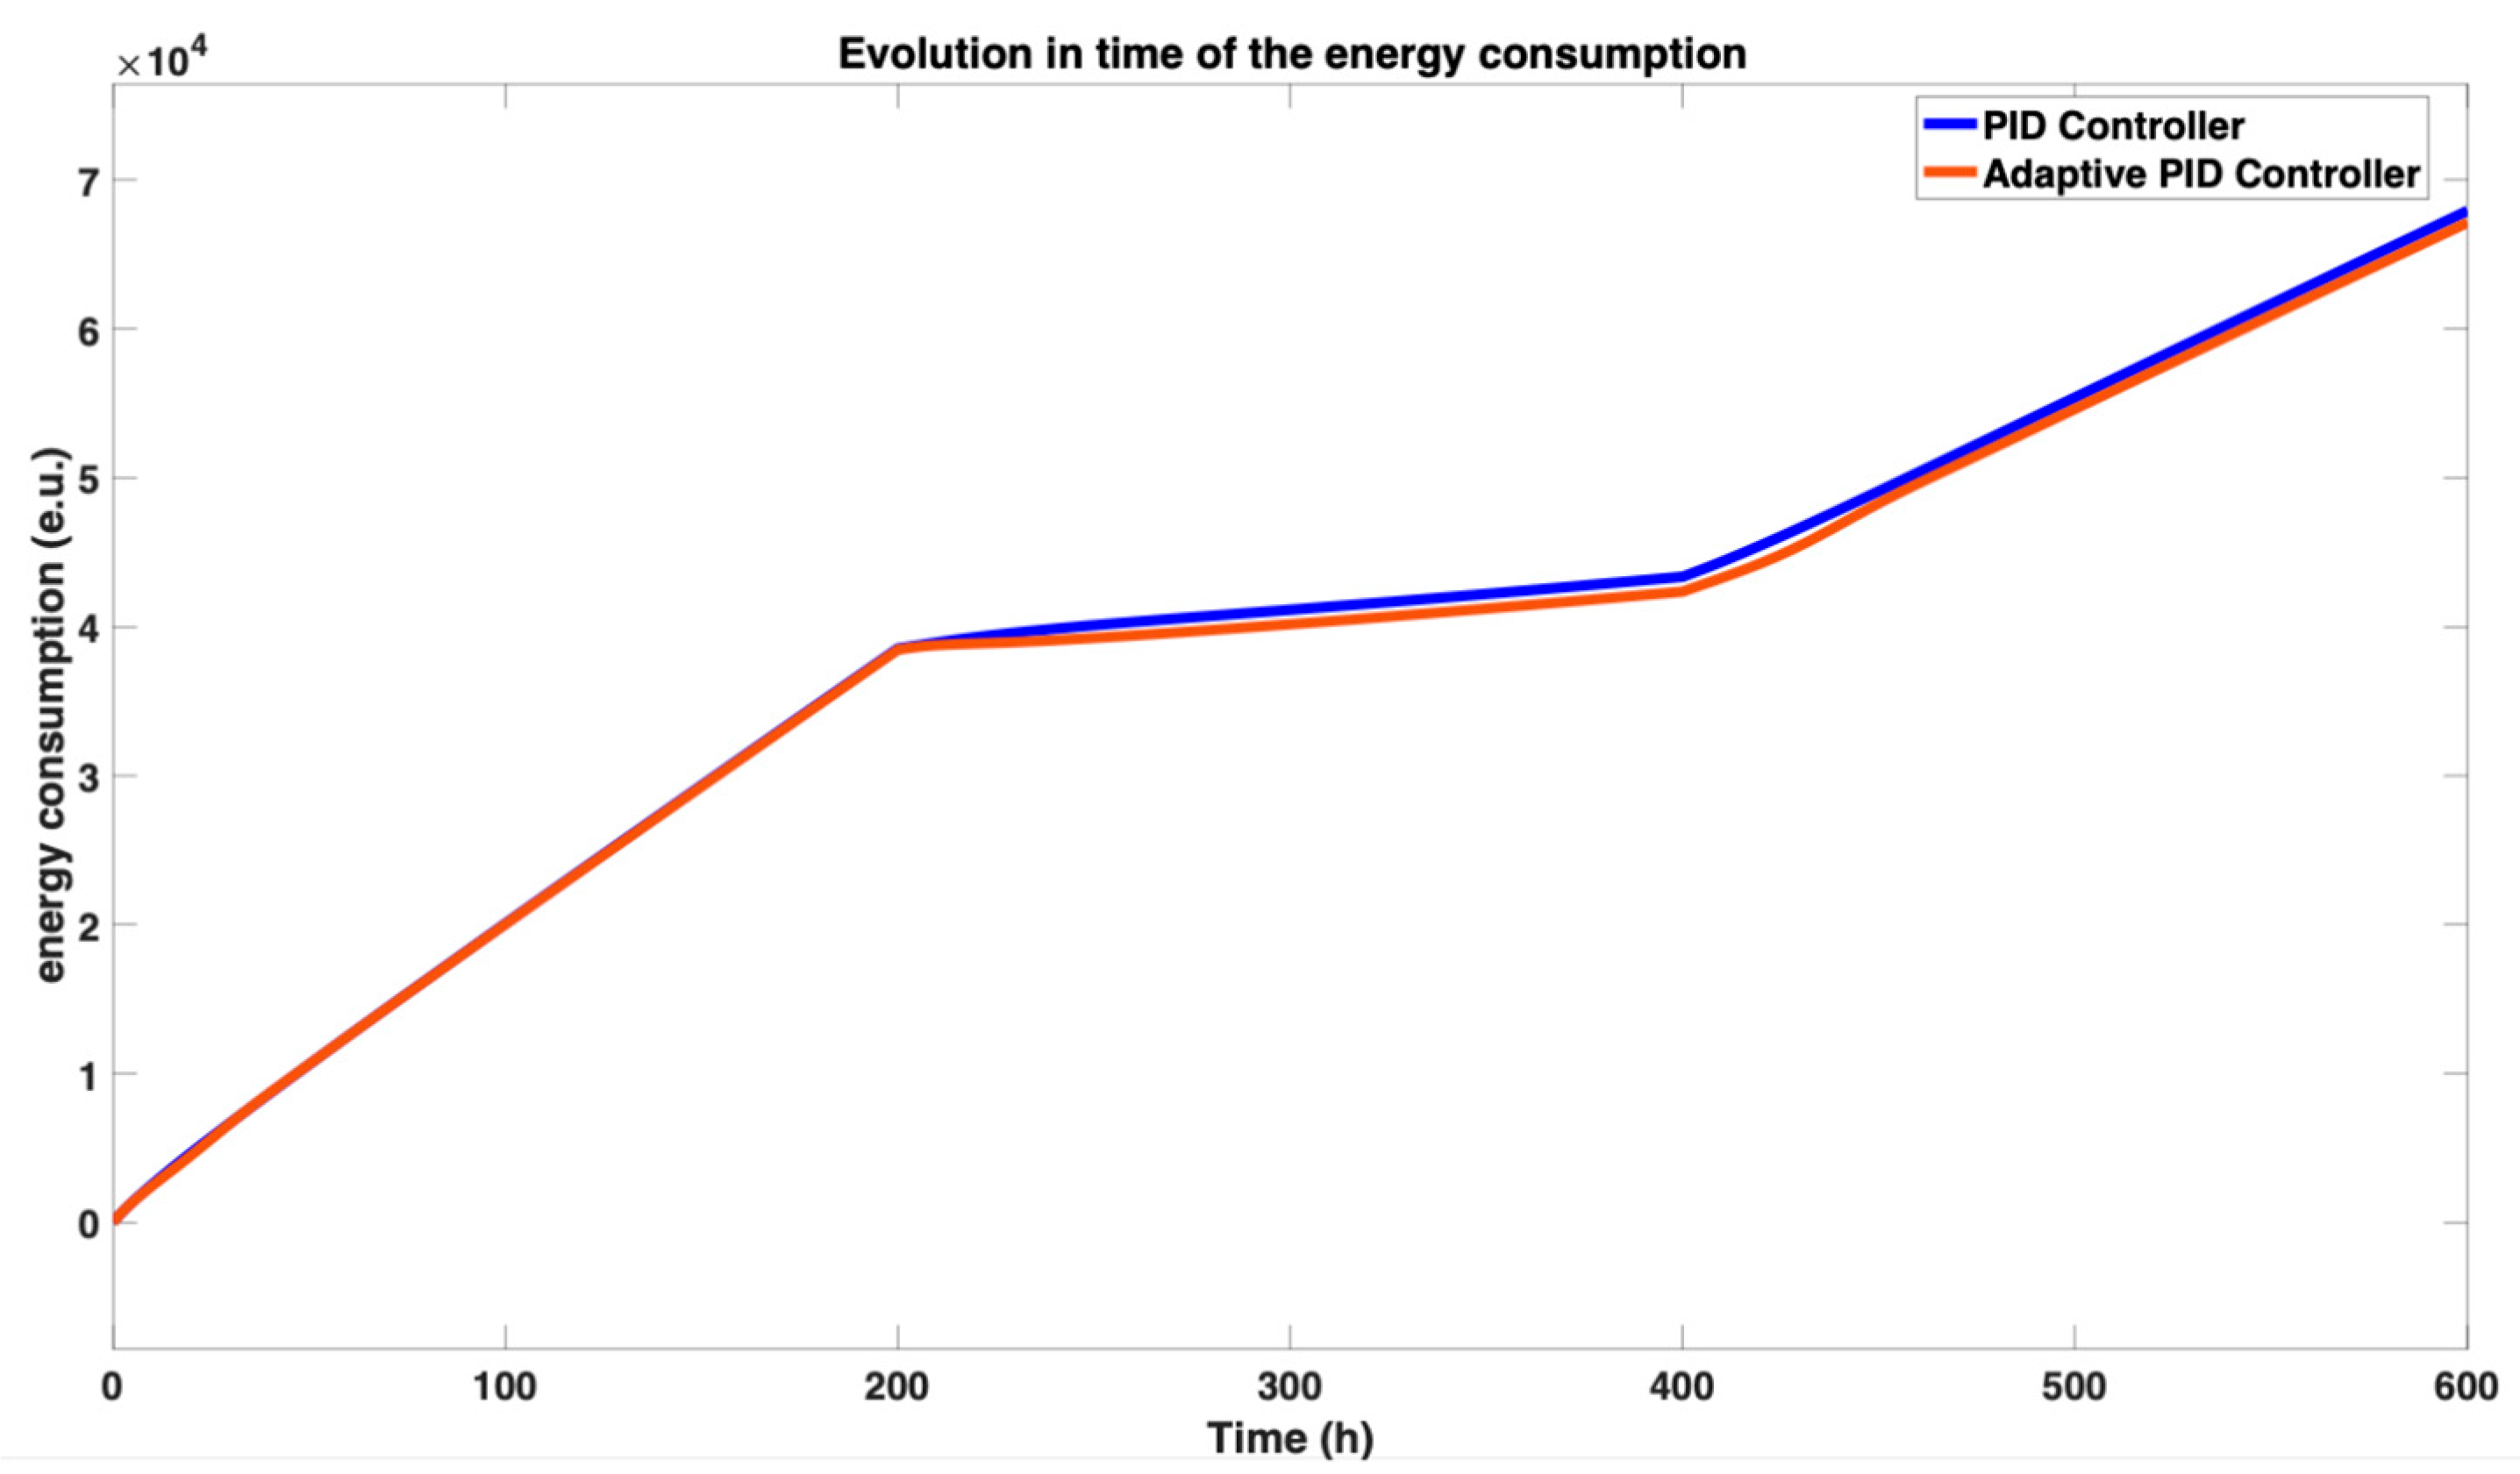
The energy consumption of the control strategies is a critical economic factor, particularly for a slow process like isotopic separation.
Figure 15 presents a comparative analysis of the cumulative energy usage for the standard PID and the adaptive PID controllers. The data reveals that the adaptive PID controller achieves a marginal yet consistent reduction in energy consumption, utilizing slightly fewer
over the operational timeframe. While the absolute difference may be small, this enhanced efficiency translates directly into lower operational costs. Given the extended duration typical of isotopic separation processes, even minor savings in energy usage per hour can accumulate into significant cost reductions over the complete production cycle. This finding further strengthens the case for the adaptive PID controller (with online integral time constant tuning), as it delivers not only superior tracking performance but also improved long-term economic efficiency.
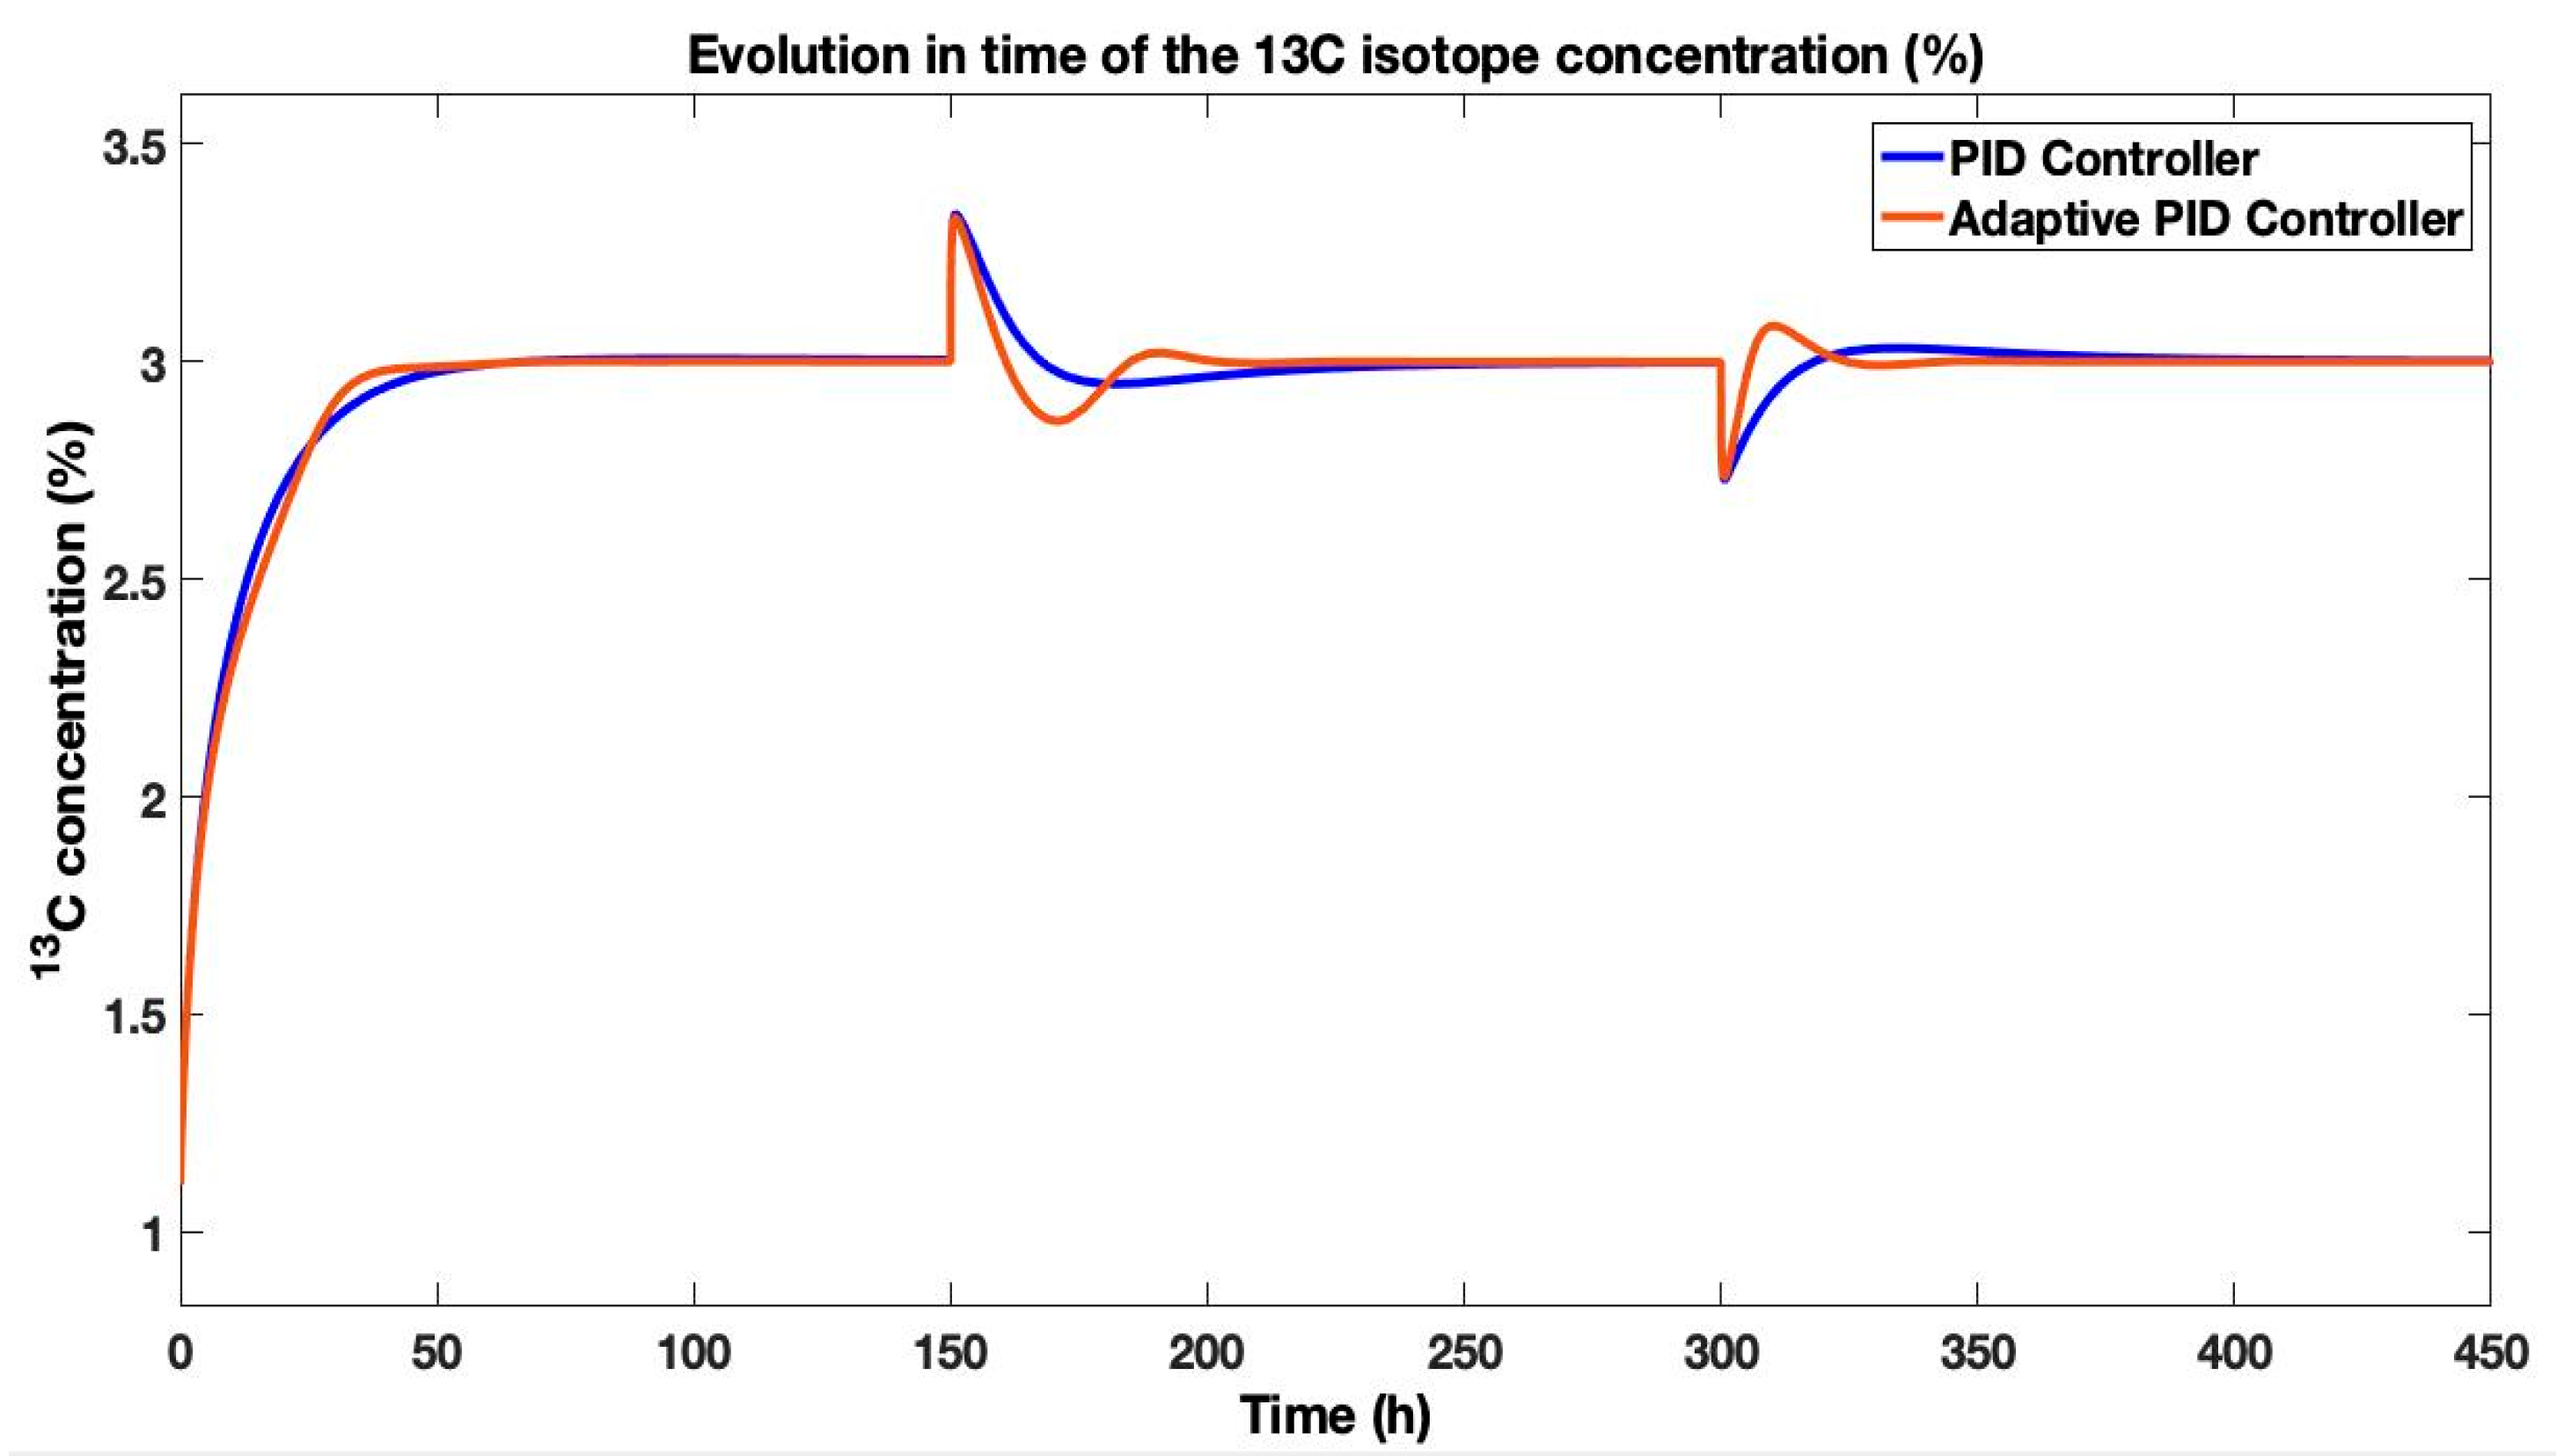
The robustness and disturbance effect rejection capabilities of the controllers were further evaluated by introducing variations in the system’s fractional order
, simulating a significant process disturbance. As shown in
Figure 16, the differential fractional order was modified from its nominal value of
to
at
and then to
at
Both the PID and adaptive PID controllers successfully rejected these perturbations, returning the isotope concentration to the
setpoint with zero steady-state error. A key distinction in their performance is observed in the recovery speed: the adaptive PID controller re-entered the accepted
concentration bandwidth around the setpoint noticeably faster than the standard PID controller after each disturbance. The corresponding command signals required to achieve this rejection, presented in
Figure 17, remained within an acceptable and practical range for monoethanolamine flow rates, confirming that the improved performance of the adaptive PID controller does not require impractical control effort. This demonstrates the enhanced robustness and adaptability of the online tuning strategy in maintaining stable control under dynamic process conditions.
6.3. Online Adaptation of the FOPI Controller Structure
To evaluate the effectiveness of the FOPI controller, its performance was benchmarked against the first-order reference model (17), following the same methodology applied to the PID controller. The online adaptation of the FOPI controller was tested by simulating the
13C isotope separation process with an input flow of
. The resulting concentration profile is presented in
Figure 18, with the corresponding command signal shown in
Figure 19.
Figure 18 compares the performance of the standard online-tuned FOPI controller, the adaptive FOPI controller, and the reference process. The simulation incorporated setpoint changes from
to
at
and subsequently to
at
. The results demonstrate that the adaptive FOPI controller delivers superior performance. It completely eliminates the small overshoot observed with the standard FOPI controller at the initial
setpoint and achieves the fastest settling time following each setpoint change, all while maintaining zero steady-state error.
For the initial 3% setpoint (), the adaptive FOPI controller achieved a settling time of 49 h with no overshoot, a slight improvement over the standard FOPI’s 50 h. The performance advantage of the adaptive strategy became more pronounced with subsequent setpoint changes. For the setpoint (), the adaptive FOPI settled in 47 h, outperforming the standard FOPI (58 h) by approximately . This trend continued for the final setpoint (), where the adaptive FOPI’s settling time of 45 h was faster than the standard FOPI’s 49 h. The combination of consistently faster response and the elimination of overshoot demonstrates the adaptive FOPI controller’s enhanced capability to maintain precise and stable control across varying operational setpoints.
The command signals required to achieve this performance, detailed in
Figure 19, confirm the practical feasibility of both controllers. The flow rates for monoethanolamine remain within an acceptable and implementable range for the actual process. This combination of precise reference tracking, robust adaptability, and practical command signals establishes the adaptive FOPI controller as a highly suitable solution for the advanced control of this complex industrial process.
The energy consumption of the control strategies is a critical economic factor, particularly for a slow process like isotopic separation.
Figure 20 presents a comparative analysis of the cumulative energy usage for the standard FOPI and the adaptive FOPI controllers. The data reveals a notable efficiency gain: while energy consumption is similar for both controllers during the initial operational period, the adaptive FOPI controller exhibits a considerable and sustained reduction in energy use starting from the second phase of the process. This resulted in a total consumption of approximately
for the adaptive FOPI, compared to
for the standard FOPI. This enhanced efficiency translates directly into lower operational costs. Given the extended duration of isotopic separation processes, such a measurable decrease in energy usage can accumulate into significant cost savings over a complete production cycle. This finding strengthens the case for the adaptive FOPI controller, as it delivers not only superior tracking and disturbance effect rejection performance but also improved long-term economic efficiency.
6.4. Online Adaptation of the FOPID Controller Structure
The performance of the fractional-order PID (FOPID) controller was evaluated using the same rigorous methodology applied to the PID and FOPI controllers, with the first-order transfer function from Equation (17) serving as the reference model. The online adaptation capability of the FOPID controller was tested by simulating the
13C isotope separation process with an input flow of
. The system’s concentration response is presented in
Figure 21, and the corresponding command signal (monoethanolamine flow rate) is shown in
Figure 22.
Figure 21 compares the online-tuned FOPID controller, the adaptive FOPID controller, and the reference process, incorporating setpoint changes from
to
at
and to
at
. The adaptive FOPID controller demonstrates superior transient performance: it eliminates the overshoot observed in the standard FOPID response at the
setpoint and achieves the fastest settling time of all controllers following each setpoint change, all while maintaining zero steady-state error.
For the initial setpoint of 3% (), it achieved a settling time of 62 h with no overshoot, a modest improvement over the standard FOPID’s 64 h. This margin increased for the setpoint (), where the adaptive variant settled in 51 h compared to 53 h for the standard controller. The most significant relative improvement was observed during the final phase () for the setpoint: the adaptive FOPID completed its response in just 39 h, outperforming the standard FOPID’s 41 h by approximately . While the absolute improvements in settling time were more modest than those observed with the FOPI controller, the adaptive FOPID maintained its key advantage of eliminating overshoot while providing faster response across all setpoint changes, confirming its value for precise operational control.
The command signals required to achieve this performance, detailed in
Figure 22, remain within a feasible and practical range for implementation, confirming the operational viability of both control strategies. Furthermore, an analysis of energy consumption, presented in a subsequent figure, reveals that the enhanced performance of the adaptive FOPID controller is achieved with a marginal reduction in cumulative energy usage compared to the standard FOPID, underscoring its overall efficiency. This combination of precise tracking, robust adaptability, and practical energy consumption solidifies the adaptive FOPID controller as a high-performance solution for managing the complex dynamics of the isotopic separation process.
The energy efficiency of the FOPID control strategies, a critical economic factor for the continuous isotopic separation process, is quantified in
Figure 23. The comparative analysis of cumulative energy usage reveals a distinct advantage for the adaptive tuning approach. While the total consumption for the standard FOPID controller reached approximately
,
, the adaptive FOPID controller achieved a reduction, consuming approximately
,
This measurable enhancement in efficiency translates directly into lower operational costs. Given the extended operational timeframe of isotopic separation plants, this consistent reduction in energy demand, coupled with the previously demonstrated superior transient performance, presents a compelling case for the adaptive FOPID strategy. It effectively demonstrates that improved dynamic response does not necessitate higher energy costs but can instead be achieved concurrently with greater economic efficiency.
While prior research, such as that presented in [
52], demonstrates a system capable of adapting to new concentrations using Oustaloup approximations and AI methods, this work proposes a more direct and computationally efficient strategy for disturbance effect rejection. The method introduced here handles variations in the fractional order
itself, a fundamental parameter representing shifts in system dynamics. Crucially, our approach bypasses the need for real-time Oustaloup recalculations, which are computationally intensive and time-consuming. Furthermore, even if Oustaloup coefficients were pre-computed using AI and stored on a microcontroller, the system would remain rigid; adjusting the fractional order
would still require recalculating the entire approximation chain—a task typically dependent on specialized software toolboxes like CRONE version Beta 1. Our online adaptation method, in contrast, allows the controller to dynamically reject disturbances caused by changes in
without this computational overhead, offering a more flexible and implementable solution for real-world control systems where operational conditions can drift.
6.5. Software Implementation and Simulation Setup
The software implementation and numerical simulations for this study were conducted within the MATLAB/Simulink R2020a environment, leveraging its extensive libraries for control system design and dynamic process modeling. The mathematical model of the isotopic separation process was implemented as a dedicated Simulink subsystem utilizing standard blocks for representing transfer functions and integration operations. The pre-trained feedforward neural network, with its final architecture and parameters detailed in
Table 1 and
Table 2, was deployed within the simulation using a MATLAB Function block that executed the forward propagation calculation as defined by Equation (16). All controller structures, including the fractional-order PID (FOPID) and PI (FOPI) variants, were constructed from fundamental Simulink elements. The fractional-order operators within these controllers were numerically realized using the Oustaloup recursive approximation method. The critical online adaptation mechanism, where a supervisory PI controller dynamically adjusts the main controller parameters, was implemented using embedded MATLAB Function blocks that contained the update law logic, ensuring real-time parameter tuning at each simulation step. All simulations were executed using the variable-step ode45 (Dormand–Prince) solver to effectively handle the process dynamics while maintaining numerical stability, with the absolute and relative tolerances set to
and
, respectively. The entire analysis was performed on a computing system equipped with an Intel Core i7 processor and 32 GB of RAM, ensuring efficient computational performance throughout the study.
7. Conclusions
The use of neural networks to model the dynamics of isotopic separation processes provides a significant enhancement in accuracy, particularly when dealing with variations in fractional differentiation orders. The proposed solution not only offers a novel approach to fractional-order system modeling but also improves the overall simulation and control of these complex processes.
Section 3 establishes the theoretical foundation and feasibility of implementing the separation process as a fractional-order system, confirming its effectiveness through mathematical modeling.
Section 4 introduces the neural network-based approach, which plays a crucial role in capturing the intricate dynamics of the process. In
Section 5, the design and practical implementation of the control strategies are discussed in detail, emphasizing how these strategies were fine-tuned to optimize process performance. Finally,
Section 6 provides comprehensive simulation results that validate the proposed methods, demonstrating their potential for real-world application in improving the efficiency and reliability of isotopic separation processes.
The comprehensive study presented in this paper showcases the successful integration of fractional-order control strategies and neural network modeling to enhance the performance of isotopic separation processes, specifically focusing on the separation of the 13C isotope. The challenges posed by the complex and nonlinear nature of the fractional-order dynamics in these processes were effectively addressed through the innovative use of neural networks, which provided a high level of accuracy in modeling the relationship between the structural parameters and the fractional differentiation order.
The development and implementation of the function, guided by AI to follow the differential fractional-order integrator within the mathematical model, has proven to be a crucial component in accurately simulating and controlling the isotopic separation process. The function, which represents the time-dependent dynamics of the process, was effectively learned by neural networks, allowing for precise tracking of the system’s behavior under varying operational conditions.
This approach has demonstrated significant benefits, particularly in capturing the intricate dynamics of the fractional-order system, which are often challenging to model using traditional methods. The AI-driven model not only enhances the accuracy of the simulations but also provides a robust foundation for the real-time adaptation of control strategies, ensuring that the process remains stable and efficient even in the face of parameter variations.
Overall, the successful integration of the function into the control framework underscores the potential of combining advanced AI techniques with fractional-order modeling to optimize complex industrial processes. This methodology offers a promising avenue for further research and application, particularly in areas where precision and adaptability are critical to achieving optimal performance.
The research emphasizes the importance of precise control in the operation of the separation process, where the correct tuning of controllers is crucial to achieving desired outcomes. The PID, FOPI, and FOPID controllers were systematically optimized through online methods, each configured to follow the response of a first-order transfer function. Among these, the FOPID controller demonstrated the most promising results, offering faster settling times and maintaining the command signal within feasible operational limits. This makes the FOPID controller particularly well-suited for implementation in real-world isotopic separation plants, where maintaining stability and efficiency is paramount.
The adaptability of the proposed control strategies, supported by the neural network model’s ability to learn and adjust to variations in process parameters, represents a significant advancement in the field. This adaptability is critical in managing the dynamic and often unpredictable nature of industrial processes, ensuring consistent performance even in the face of fluctuations in operational conditions.
This paper has demonstrated that the proposed online adaptation strategy for PID control delivers significant advantages in both disturbance effect rejection and operational efficiency for the 13C isotopic separation process. The adaptive PID controller proved exceptionally robust, successfully rejecting perturbations induced by variations in the fractional order and recovering to the setpoint faster than its standard counterpart. Furthermore, it achieved this superior performance while concurrently reducing energy consumption, a critical economic factor for continuous industrial processes. Most importantly, this method provides a practical and computationally efficient alternative to existing fractional-order control strategies. Unlike approaches that rely on pre-computed Oustaloup approximations—which are rigid and require specialized toolboxes or significant microcontroller resources for real-time adjustment—this online adaptation technique dynamically compensates for changes in system dynamics directly, offering a more flexible and implementable solution for real-world applications.
In conclusion, this research not only provides a robust solution for enhancing the control and efficiency of isotopic separation processes but also contributes to the broader field of process control by demonstrating the effectiveness of combining fractional-order control with AI-driven modeling techniques. The successful application of these methods suggests that they could be extended to other complex industrial processes, offering a pathway toward more intelligent and responsive control systems. Future work could explore the scalability of this approach, as well as its application to other types of fractional-order systems, further solidifying its role in advancing industrial automation and control.
The analysis of the command signals throughout this study confirms that the proposed adaptive controllers generate gas flow rates within a feasible and practical range for industrial metering pumps (e.g., ), even during demanding conditions such as aggressive setpoint tracking and disturbance effect rejection. Although this simulation study did not implement explicit hardware limits on the control signal, the inherent stability and consistently reasonable output of the controllers indicate a strong potential for physical deployment. For a real-world implementation, ensuring that the controller’s commands respect the pump’s physical maximum and minimum limits would be a necessary and straightforward step to guarantee safe and optimal operation.
The performance of the proposed adaptive controllers was evaluated under dynamic setpoint changes, as shown in
Figure 13,
Figure 18 and
Figure 21. While the tested scenarios involved specific sequential setpoint variations rather than strictly periodic signals, the consistent performance of all adaptive controllers provides strong evidence of their potential robustness under repetitive operational conditions. Each adaptive variant (PID, FOPI, FOPID) demonstrated stable convergence to new setpoints without exhibiting performance degradation or residual oscillations from previous transitions. This consistent behavior—characterized by minimal overshoot, fast settling times, and zero steady-state error across all setpoint changes—suggests that the online adaptation mechanism effectively recalibrates controller parameters without keeping the destabilizing errors of past states. The corresponding command signals (
Figure 14,
Figure 19 and
Figure 22) remained within feasible operational ranges throughout all transitions, further supporting the practical viability of these controllers for applications involving cyclical production schedules or frequent setpoint adjustments. Explicit testing with periodic reference signals represents a valuable direction for future work to further validate long-term stability under truly repetitive operating conditions.
While the proposed adaptive control framework demonstrates significant promise for the optimization of isotopic separation processes, it is important to acknowledge its limitations and broader applicability. The current approach requires an initial offline training phase for the neural network, which depends on the availability of comprehensive historical or simulated data across the system’s expected operational range; this may present a challenge for novel or poorly characterized processes where such data is scarce. Furthermore, the performance of the online adaptation mechanism is contingent on the manual tuning of the supervisory PI controller, which may need to be recalibrated for processes with fundamentally different dynamics or time scales. Despite these constraints, the core methodology—utilizing a neural network for the approximation of complex system dynamics and a supervisory loop for the real-time adaptation of controller parameters—holds substantial generalizability. It is particularly well-suited for a wide range of industrial applications characterized by variable operating conditions, slow process dynamics, and complex, non-ideal physics, such as those found in distillation columns, chemical reactors, fermentation processes, and the separation of other isotopes like 15N or 18O. The principal challenges for implementing this strategy in new domains would involve defining the key variable parameters, generating a representative training dataset, and tailoring the controller’s architecture to the new process’s specific requirements. Future work will therefore focus on developing guidelines for applying the learning process and on validating the framework’s effectiveness across these diverse industrial isotopic separation plants, together with the implementation of the proposed controllers on microcontrollers, thereby broadening its impact beyond the specific case study presented here.
This study provides a foundational framework for the control of variable fractional-order processes, demonstrating a significant advancement over methods reliant on static, pre-computed approximations. Building on this foundation, several compelling directions for future research emerge. A primary objective is the development of online adaptation mechanisms for the fractional differentiation order itself (both on identification and control phases), enabling the control system to dynamically track and respond to its temporal variations caused by operational shifts and disturbances. This would ensure sustained optimal performance where current strategies are rigid. Furthermore, the integration of specialized, predictive disturbance observers could significantly enhance the system’s resilience to external perturbations, such as fluctuations in temperature or pressure. Finally, incorporating these adaptive fractional-order strategies into an Internal Model Control (IMC) framework presents a powerful avenue for achieving superior robustness against model uncertainties. These advancements would not only solidify the control strategy’s effectiveness for isotopic separation but also establish a versatile methodology applicable to a wide range of complex industrial processes with non-stationary dynamics.

