1. Introduction
In urban environments, regardless of their size, mobility remains a central issue for the progress of any nation or region [
1]. Efficient mobility and effective city traffic management are crucial for sustaining economic activities and minimizing the unfortunate fatalities from traffic accidents [
2,
3].
In Mexico, a developing country, towns and cities are categorized based on their population sizes into small, medium, and large. These cities are experiencing, in some cases, rapid growth, underscoring the urgent need for the development of new roadways, road expansions, maintenance of the actual roadways, and the construction of advanced roadway infrastructure to support and manage the increasing number of vehicles.
A critical aspect of the analysis is urban traffic management, which significantly impacts the developmental trajectory of urbanizing cities [
4,
5].
Urban traffic management involves substantial challenges, such as in the case of Morelia, Mexico: a fast-growing city. This city is considered medium-sized with rapid population growth and increased vehicle ownership, resulting in complete congestion on roadways.
As cities expand, the vehicular infrastructure often fails to keep pace with the rising number of vehicles, leading to traffic bottlenecks, delays, and reduced overall transportation system efficiency [
6]. The challenges mentioned above in touristic cities like Morelia are stretched due to its cultural richness and historical significance [
7], which attract residents and tourists, further straining the transportation networks.
The urbanization process in cities like Morelia introduces complex traffic dynamics influenced by various factors such as land use patterns, economic activities, and social behaviors [
8]. The absence of comprehensive urban planning strategies and adequate transportation infrastructure worsens these complexities, leading to inefficient traffic flow and safety risks, underscoring the multi-faceted nature of the issue [
9].
To address this problem, it is necessary to integrate innovative solutions with advanced technologies, data analytics, and holistic urban planning approaches [
10] to effectively manage traffic and ensure sustainable mobility in rapidly urbanizing cities like Morelia. One of the main tasks for making this a reality is correctly managing the number of vehicles traveling on a particular road. In developing countries like Mexico, traditional traffic management methods are predominantly used to regulate the traffic system. These conventional systems often depend on static obsolete infrastructure and manual vehicle counting, which have several limitations in addressing the dynamic nature of urban traffic, leading to subjective and inaccurate assessments. One of these examples is the traditional counter that accounts for the number of vehicles that travel on a roadway.
Figure 1 shows a traditional pneumatic counter for counting the number of vehicles circulating on the road.
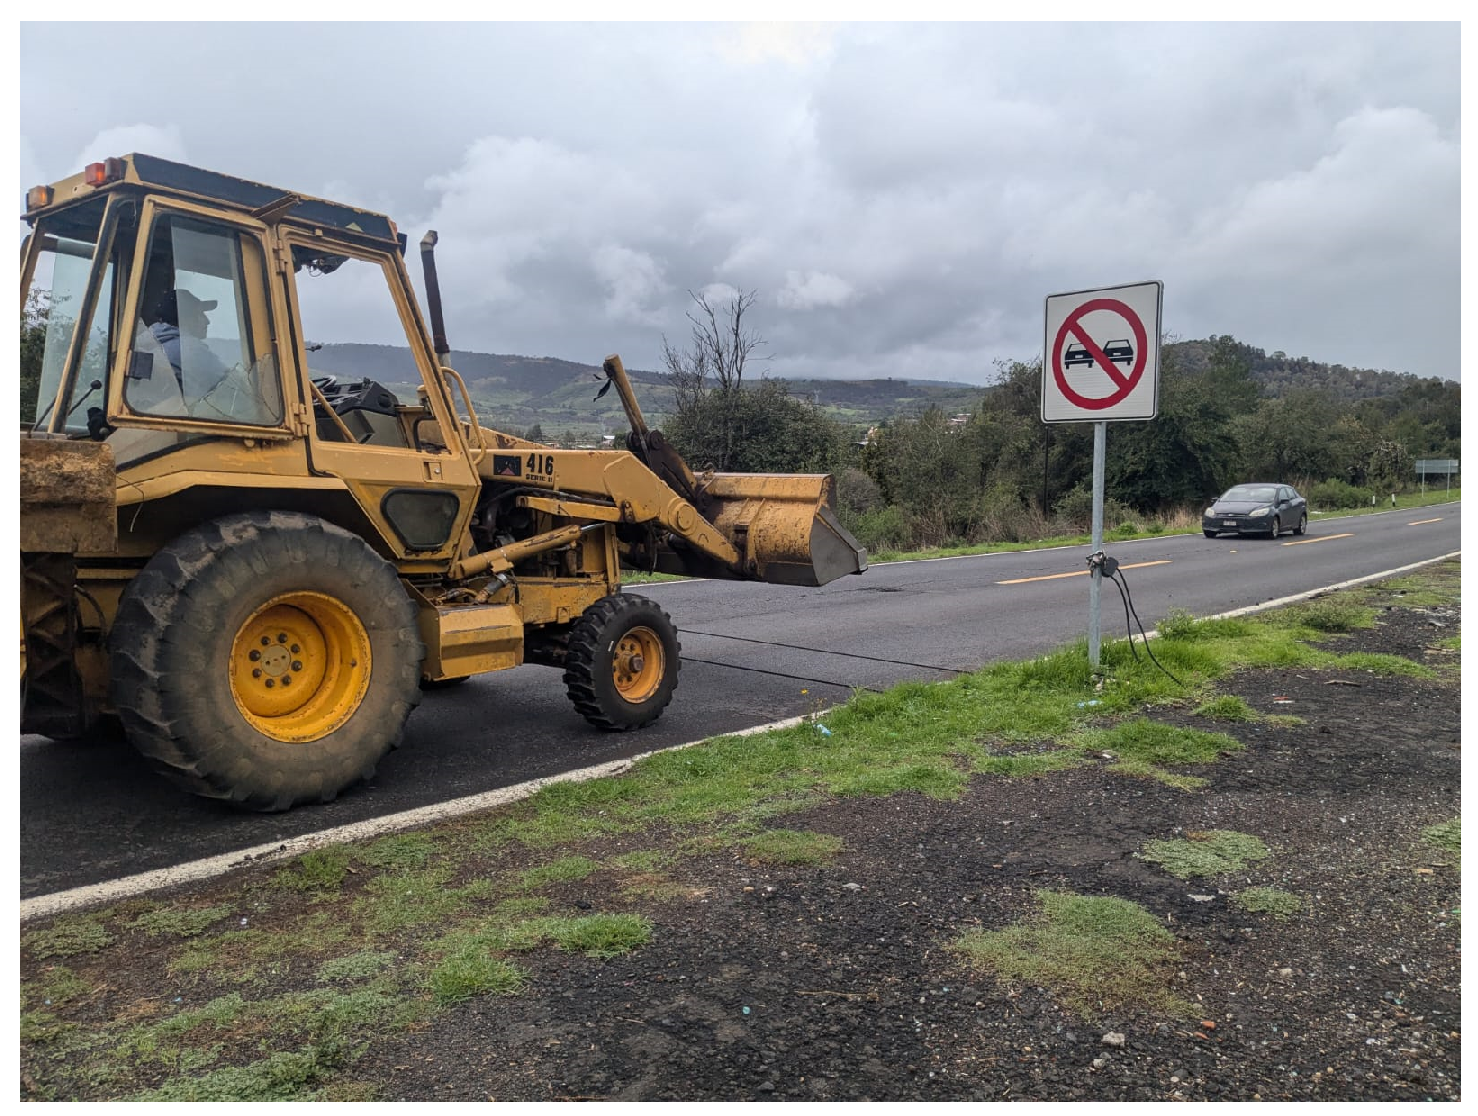
These traditional methodologies are not accurate and require complete security and constant monitoring of the device because, usually, it might be stolen. These approaches consume considerable human and economic resources. The essence of this type of study with this kind of device is counting the number of repetitions recorded by the counter, which is then converted into the number of vehicles. This transformation might be inefficient and subjective because the counter does not distinguish what kind of vehicle has crossed on the pneumatic bands.
Figure 2 demonstrates this affirmation, where it is possible to notice that the counter registers the crossing of two vehicles.
However,
Figure 2 depicts the apparent need for more accurate and efficient methods for counting vehicles because, in this case, two different types of vehicles will cross the counter, and the damage that each vehicle will produce to the pavement surface will be completely different.
Another area for improvement in this perspective is that traditional approaches typically lack real-time data and predictive capabilities, making it difficult to anticipate and alleviate traffic congestion effectively [
11]. Various technological approaches exist to mitigate these limitations, and artificial intelligence (AI) is one of the most innovative solutions.
This research investigates the performance of a complex deep learning (DL) algorithm to enhance the efficiency of vehicle-counting methods in Morelia and potentially extend this approach to other zones across the country. The aim of utilizing DL in this context is to address the current challenges of urban traffic management by leveraging the power of advanced DL algorithms to analyze large volumes of traffic data [
12]. For instance, adaptive traffic light control systems powered by DL are being developed to optimize traffic flow in real-time, highlighting the growing role of AI in traffic management [
13].
In recent years, DL techniques have been successfully applied in various fields of civil engineering [
14], from predicting the behavior of construction materials such as concrete with high accuracy to detecting and classifying damage in concrete and asphalt structures using complex convolutional neural networks [
15,
16,
17,
18].
This research focuses on adapting and testing a precise and scalable solution for the automatic detection, classification, and counting of vehicles in real-time from video recordings captured at selected monitoring stations throughout the city. This approach might provide insights into traffic patterns, identify congestion hotspots, and optimize traffic flow in Morelia. The complex architecture analyzed for this purpose is the YOLOR (You Only Learn One Representation) algorithm in conjunction with the Deep Sort algorithm. The YOLOR algorithm was tested at six monitoring stations in inference mode to explore the application of a computer vision system as a potential solution for building intelligent traffic monitoring systems.
The analysis includes varying confidence levels during the inference mode to determine the accuracy of vehicle-type classification. Additionally, different pre-trained weights (representing various levels of model complexity) were used during the video record analysis stage, ranging from the simplest to the most complex architectures. Consequently, the research evaluates the model’s performance in detecting, classifying, and counting vehicles under specific scenarios and conditions presented by Morelia City.
With this research, one of the most complex and recent state-of-the-art computer vision model architectures is tested under various conditions to evaluate its efficacy in counting vehicle tasks in real-world scenarios.
2. The AI Approach in the Traffic Management
As mentioned, advanced technologies need to be integrated into traffic-monitoring systems. Past research has outperformed the rising challenges due to the increasing number of vehicles, which complicates traffic dynamics and management [
19]. Notable studies such as “A Real-Time Vehicle Counting, Speed Estimation, and Classification System Based on Virtual Detection Zone and YOLO” have contributed to the understanding and development of real-time vehicle detection and classification systems using complex algorithms like YOLO [
20]. Recent advancements, such as the fine-tuning of the YOLO-v5 architecture, have significantly improved vehicle detection accuracy in complex traffic environments, demonstrating the potential of DL in real-time traffic monitoring [
21]. These systems have demonstrated substantial improvements in traffic monitoring efficiency.
The integration of convolutional neural networks with YOLO has led to enhanced accuracy in vehicle detection, facilitating more efficient traffic monitoring systems [
22]. Muhammad Azhad and Fadhlan Hafizhelmi have demonstrated the integration of YOLO and Deep Sort for vehicle detection and tracking, noting enhancements with the use of YOLOv4 for real-time applications in traffic management. Their research has achieved state-of-the-art results, supporting the effectiveness of combining DL algorithms and video surveillance technologies to enhance vehicle-counting and -tracking capabilities [
23]. Similarly, Al-Qaness et al. have presented an improved YOLO-based vehicle detection system for road traffic monitoring, showcasing enhanced detection and classification performance through training on diverse datasets and testing real-world traffic video sequences [
24]. This approach provides a solid foundation for intelligent traffic management solutions.
Another study titled “Towards Real-time Traffic Flow Estimation using YOLO and SORT from Surveillance Video Footage” highlights the potential of utilizing surveillance video footage alongside computer vision techniques to accurately and efficiently estimate traffic flow [
25]. This work effectively integrates the YOLOv4 and SORT algorithms to classify and track vehicles moving in various directions.
In another significant contribution, the study “Detection and tracking different types of cars with YOLO model combination and Deep Sort algorithm based on computer vision of traffic controlling” developed a traffic monitoring and control system using a combination of YOLOv4 and Deep Sort algorithms to effectively detect, track, and classify multiple vehicle types from CCTV footage, achieving a detection accuracy of 87.98% with mean Average Precision (mAP) [
26]. In similar approaches, Azimjonov and Özmen enhanced YOLO-based real-time vehicle detection and tracking, improving classification accuracy for highway traffic monitoring by integrating classifiers, thereby boosting performance from 57% to 95.45%.
Lin and Jhang performed an intelligent traffic-monitoring system that integrates YOLO and convolutional fuzzy neural networks for real-time vehicle classification and counting, demonstrating superior accuracy and performance across several datasets [
27]. Abbasi, Shahraki, and Taherkordi comprehensively reviewed the deployment of DL for Network Traffic Monitoring and Analysis (NTMA), emphasizing its efficacy in managing complex network behaviors and significant data challenges [
28]. Zhu et al. presented the MME-YOLO model, an innovative multi-sensor and multi-level enhanced convolutional network for robust vehicle detection in traffic surveillance, significantly improving detection performance under several conditions [
29]. DL algorithms have also been successfully applied to dynamic traffic signal control and vehicle counting, proving their adaptability and effectiveness in real-world traffic management as was emphasized by Modi et al. in [
30].
As the state of the art stands, integrating AI approaches in traffic monitoring tasks has shown promising results in addressing the challenges cities face with increasing vehicular populations. These studies highlight the limitations of traditional traffic management methods and the necessity for more advanced solutions. Lin et al. have integrated convolutional fuzzy neural networks with YOLO, achieving superior accuracy in vehicle classification and counting, which is crucial for intelligent traffic monitoring systems [
31].
The current work extends the previous research presented in [
32], introducing a comprehensive analysis of the YOLOR and Deep Sort algorithms across multiple monitoring stations with varying traffic, lighting, weather conditions, and vehicle classes. Unlike the aforementioned work, which focused primarily on initial testing at two stations, this research delves into the performance variations under different confidence levels and computational complexities. Additionally, the current study incorporates a novel application of algorithmic improvements, such as optimizing model configurations and including more complex vehicle classifications. These enhancements contribute to a more robust and scalable traffic monitoring solution, demonstrating significant advancements over the initial findings presented in previous studies.
In nations like Mexico, vehicle-counting tasks rely on traditional methods such as manual vehicle gauging and pressure sensors to measure vehicle quantities and estimate vehicular composition. These methods generally involve monitoring traffic flow at specific roadway points to ascertain daily traffic volumes. However, traditional vehicle gauging methods need to be improved, particularly regarding accuracy and reliability.
This research aims to test the performance of YOLOR and Deep Sort algorithms in vehicle-counting tasks. With this, it will be possible to propose a different way to optimize vehicle traffic registration and estimate the Annual Average Daily Traffic (AADT). Also, this research aims to address crucial gaps in the existing methodologies related to traffic management in Morelia, Mexico.
3. Methodology
3.1. YOLOR Algorithm
The YOLOR algorithm was selected for its distinctive capability to provide a unified representation that integrates both explicit and implicit knowledge [
33], which is crucial for addressing the complexities inherent in traffic analysis in cities like the case of Morelia. By harnessing both types of knowledge, YOLOR can capture the intricate dynamics of traffic patterns, including interactions among vehicles, pedestrians, and environmental factors. This integrated representation facilitates more accurate and robust predictions.
A significant advantage of YOLOR lies in its flexibility and scalability across various tasks [
34]. Its formulation, which combines explicit and implicit errors, enables YOLOR to adapt to a wide range of traffic-related tasks such as vehicle detection, classification, and traffic flow analysis. This versatility is essential for tackling the multi-faceted challenges present in Morelia’s traffic conditions, where multiple aspects of traffic management need to be addressed nowadays.
The YOLOR architecture allows it to learn and generalize from diverse data sources, making it well suited for complex urban environments [
35,
36]. Using DL techniques, YOLOR can process and analyze large volumes of traffic data in real-time, identifying patterns and anomalies that traditional methods might discard. This real-time processing capability is critical for dynamic traffic management, where immediate insights can lead to effective interventions.
The algorithm’s scalability means it can be deployed across different scales of traffic monitoring, from minor intersections to large urban networks. This scalability is achieved through its modular design, which allows for adding or removing components based on the specific requirements of the monitoring task. As traffic conditions in Morelia evolve, YOLOR can be adjusted to meet new demands, ensuring continuous improvement in traffic management.
In the context of neural networks, for a conventional network, the objective function can be formulated as follows:
where
x is the observation,
represents the set of parameters of a neural network,
denotes the operation of the neural network,
is the error term, and
y is the target of a given task. The goal is to minimize
to make
as close to the target as possible. The YOLOR proposes an enhanced formulation integrating explicit and implicit knowledge as is denoted in (
2):
where
and
model the explicit and implicit errors from observation
x and latent code
z, respectively.
is a task-specific operation that combines information from both explicit and implicit knowledge [
37]. In this study, the YOLOR algorithm is designed to handle both explicit and implicit errors, which are crucial for improving the accuracy and efficiency of vehicle detection in traffic monitoring systems. Explicit errors arise from the observable discrepancies in the data, such as misclassified vehicles or incorrect bounding boxes. In contrast, implicit errors emanate from non-observed factors, including model assumptions and latent variables. By separating these errors, the algorithm can better capture the complex interactions within the traffic data, leading to more accurate predictions and robust performance in real-world scenarios. This separation enhances the algorithm’s ability to adapt to varying traffic conditions, improving its overall efficacy in detecting and classifying vehicles. The biggest challenges in applying AI algorithms like YOLOR and Deep Sort for vehicle detection and tracking include dealing with occlusions, lighting variations, and complex dynamics in urban traffic. YOLOR effectively detects vehicles but can struggle with occlusions and overlapping objects, leading to missed detections. Deep Sort, on the other hand, can lose track of vehicles during abrupt changes in direction or speed, reducing tracking accuracy. These challenges highlight areas where further improvements are needed to enhance the robustness of these algorithms in real-world scenarios.
3.2. Deep Sort Algorithm
The Deep Sort algorithm is an extension of the original SORT (Simple Online and Real-time Tracking) algorithm [
38], which significantly improves tracking accuracy by incorporating DL features. Deep Sort combines motion and appearance information to track objects across frames in a video sequence. Deep Sort operates by following the subsequent steps:
Detection: In each frame, objects are detected, and their bounding boxes are output by an object detection model like YOLO or SSD.
Feature extraction: A CNN extracts features from each detected object to assist in distinguishing between different objects.
Prediction: For each track, the Kalman filter predicts the new state based on its previous state.
Association: The predicted states are matched with new detections based on a cost matrix that considers the predicted Kalman states and appearance features. The matching is optimized using the Hungarian algorithm.
Update: The Kalman filter updates the state of each matched track with the corresponding detection.
Track Management: Tracks are created for unmatched detections and are terminated if they remain unmatched for too long.
The essence of the Deep Sort algorithm is implanted in its state estimation and data association techniques, which are enabled by the Kalman filter and the Hungarian algorithm, respectively. These two components play a pivotal role in the algorithm’s operation.
The Kalman filter predicts and updates the state of each track with the following equations:
where
is the predicted state,
is the state transition model,
is the control input model, and
is the control vector:
where
is the updated state,
is the Kalman gain,
is the measurement, and
is the measurement model.
The cost matrix for matching predicted tracks to new detections is calculated as follows:
where
is a tuning parameter that balances the influence of distance metrics, Mahalanobis (
) calculates the Mahalanobis distance between the predicted state and the detection, and CosineDistance (
) measures the cosine distance between their appearance features.
The Hungarian algorithm is utilized to find the optimal assignment that minimizes the overall cost, defined by the cost matrix
C. This algorithm ensures that each detection is uniquely matched to a track based on spatial and appearance data, facilitating robust object tracking [
39].
This algorithm enhances the tracking performance by effectively integrating appearance features extracted via a deep neural network with motion predictions made by the Kalman filter. In contrast, the Hungarian algorithm optimizes the tracking associations across frames.
The adapting capacity of the YOLOR and Deep Sort algorithms for Morelia’s traffic conditions was tested across this research, considering the unique characteristics and challenges of the city, for instance, the types of vehicles commonly found on its roads, typical traffic patterns, and specific congestion points.
3.3. Data Collection
The researchers identified six critical points in Morelia in the data collection process: “Calzada La Huerta”, “Camelinas Avenue”, “Calzada La Huerta-East”, “Francisco I. Madero West”, “Federal Hwy 14”, and “Calzada La Huerta-Cosmos Avenue”. These locations were selected based on various engineering considerations, particularly the significant traffic volume observed during peak hours. These roads are major arteries for accessing different parts of the city, with a high vehicular traffic density, making them ideal candidates for a comprehensive traffic management and vehicle counting study.
The selected critical points are denominated as denoted in
Table 1.
The selection criteria included the volume of traffic and the diversity of vehicle types, traffic patterns, and the potential for congestion. These factors are crucial for developing a robust traffic monitoring system that can provide accurate and reliable data for traffic management purposes.
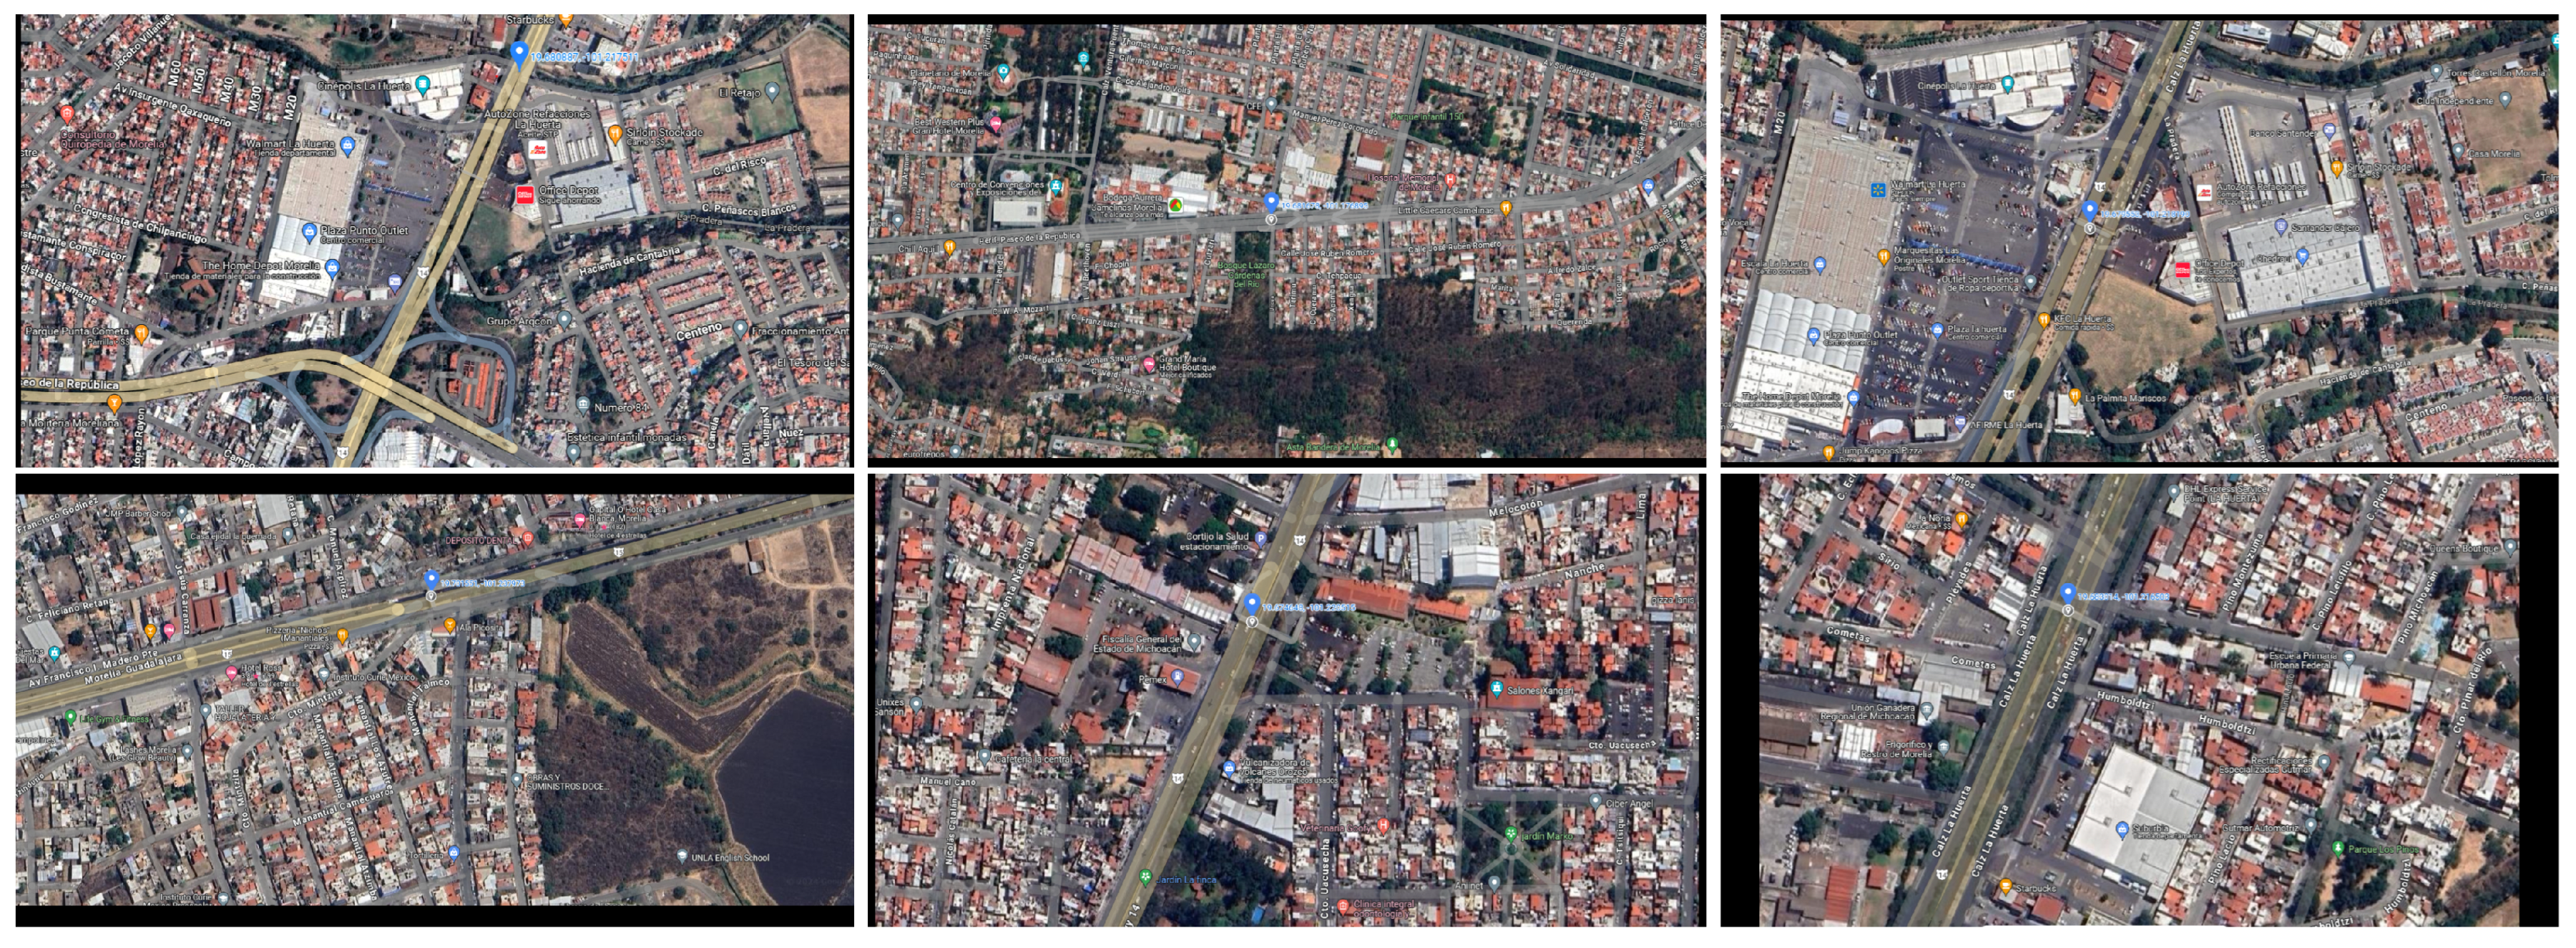
The geographical coordinates of the monitoring station points are detailed in
Table 2. Furthermore,
Figure 3 provides a comprehensive visual context with screenshots taken from the
Google Maps application, highlighting the specific areas of interest within the city. These figures not only illustrate the layout and surrounding infrastructure of the monitoring stations but also provide a reassuring level of detail for your planning and decision-making processes.
The authors installed high-definition cellphone cameras at strategic positions for the monitoring stations. These cameras, specifically, the Google Pixel smartphone camera, were equipped with a 12.2 MP 1/2.55” sensor, 1.4 µm pixels, 77° field of view, f/1.7 aperture lens, Dual Pixel Phase Detection Autofocus (PDAF), and Optical Image Stabilization (OIS). This setup allowed us to capture video data in 1080p resolution at 30 frames per second (FPS), ensuring a comprehensive dataset that covers various traffic and lighting conditions, including peak and off-peak hours, weekdays, and weekends. The detailed analysis of this data provides valuable insights into traffic patterns and the identification of trends and anomalies.
The video footage from all monitoring station points was processed using advanced DL algorithms, with a specific focus on the YOLOR model. This model was instrumental in detecting, classifying, and counting vehicles in real-time, thereby providing crucial insights into traffic management. The data obtained from the YOLOR model were compared to the ground truth information, which was acquired through a manual counting process by the authors.
To leverage the strategic importance of “Calzada La Huerta” and “Camelinas Avenue”, this study was divided into two parts. The first one involved a complete analysis of the model’s performance, which included variations in the confidence level and variation in the model’s version (different model depth) to know what combination of the model fits better to the vehicle-counting task. The second part consisted of analyzing the rest of the monitoring stations (MS3, MS4, MS5, and MS6) in inference mode to corroborate the first stage of the methodology and assess the capabilities of the YOLOR algorithm for counting vehicles in real scenarios considering a permanent vehicular flow.
At MS1, the camera was positioned at street level to evaluate the model’s performance in detecting and counting vehicles from a lateral perspective. In contrast, at MS2, the camera was placed 6 m above the road on a pedestrian bridge, providing an elevated and frontal view of the vehicular traffic. In both scenarios, a commercial tripod was utilized to ensure video stability.
The traffic density at both monitoring stations was high, with well-defined zones of changing traffic conditions. The typical composition of vehicles included passenger cars, trucks, motorcycles, buses, trailers, and bicycles. Notably, there were no significant variations in traffic patterns during the data collection period.
3.4. Inference Methodology
Each country generally has its vehicular classification system; in Mexico, vehicles are classified based on the equivalent single axle load (ESAL). This approach results in a detailed and comprehensive categorization of vehicles. However, for this research, a simplified classification was adopted, focusing on five main types of vehicles: cars, trucks, buses, motorcycles, and bicycles. This general classification aligns with the categories found in the COCO dataset, which contains 80 different classes of objects, including the aforementioned vehicle types [
40].
A critical aspect of this study is evaluating the YOLOR algorithm’s performance in inference mode and its combination with the Deep Sort algorithm. Thus, the study utilized transfer learning and fine-tuning techniques, leveraging pre-trained weights. The YOLOR algorithm was trained on various datasets to assess its effectiveness, and the COCO dataset was among those used in the training process. As a result, five sets of pre-trained weights are available for this customized analysis (
YOLOR P6,
YOLOR CSP,
YOLOR CSP STAR,
YOLOR CSP X STAR, and
YOLOR CSP X), each corresponding to different versions of the model.
Table 3 shows distinctions between the model’s version that were analyzed as the first instance across this research, depicting their performance on GPU, CPU, average precision (AP
val), and
obtained in the COCO dataset.
This study explored three pre-trained models, each differing in size and complexity. The models selected were YOLOR P6, YOLOR CSP, and YOLOR CSP X, representing the algorithm’s small, large, and extra-large versions, respectively. YOLOR P6 is the most compact model, designed for efficiency with a reduced computational load. YOLOR CSP is a larger version that balances complexity and performance, offering improved detection accuracy. YOLOR CSP X, the largest model, provides the highest precision and robustness in vehicle detection and classification. However, the latter requires sophisticated hardware and software to achieve a paramount performance, which in some cases is inefficient. The pre-trained weights associated with these models are crucial for customizing the YOLOR algorithm to the specific requirements of this research.
Another critical aspect to consider in this research is how the vehicles are counted employing the YOLOR and Deep Sort algorithms. To carry out the counting process, a virtual line is overlapped on each video footage for each monitoring station. The virtual line, also called the virtual counter, is set for each monitoring station, establishing two coordinates, and , coordinates that indicate the location where the virtual counter will be placed. This virtual counter simulates the pneumatic counter employed in the traditional methods; however, in this case, when a tracked vehicle (which previously has been detected and classified by the YOLOR algorithm) crosses the virtual counter, the class of the vehicle is counted by the virtual counter. In this manner, the number of vehicles is stored in the register. In this part, the Deep Sort algorithm enters the scene since the algorithm tracks the detected object. In reality, the virtual counter registers the tracked element, thus providing an accurate way of counting the number of vehicles.
3.5. Computational Details
All the experiments and tests were performed in a personal workstation with the following features:
A processor of 13th Gen Intel(R) Core(TM) i7-13620H 2.40 GHz, 48 GB of Random Access Memory.
A NVIDIA GeForce RTX 4060 Laptop GPU, CUDA cores: 3072, Max-Q Technology, 8,188 MB GDDR6.
A GPU-accelerated Python environment was created following the next: CUDNN 8.2.1, CUDAToolkit 11.3.1, Keras 2.4.3, Keras-GPU 2.4.3, Tensorflow-GPU 2.5.0, Tensorflow 2.5.0, and Python 3.7.16.
4. Results and Discussions
4.1. Model’s Performance in Its Different Variants
The main objective of this research is to test the performance of the combination of YOLOR and Deep Sort algorithms for developing traffic management tasks, such as vehicle counting, in real-world scenarios. The first stage was to evaluate all the possible features of the YOLOR model. As mentioned earlier, MS1 and MS2 were evaluated using various confidence levels and model versions, ensuring a thorough analysis of the algorithms’ performance under different conditions.
The parameters selection for performing this task is shown in
Table 4 and
Table 5. These tables detail the specific approaches for MS1 and MS2, including the parameter values and their configurations applied during the analysis. Additionally, computational details (computing time) have been included to offer a more comprehensive understanding of the model’s performance.
Table 4 and
Table 5 show how computational time decreases as the confidence level increases across all model versions. This reduction in computing time can be attributed to the algorithm’s reduced need to distinguish between object classes when the confidence level is high. The algorithm makes more definitive decisions with a higher confidence threshold, reducing the computational load. Similarly, the average frames per second (FPS) also shows improvement with increased confidence levels. This improvement in the FPS is closely linked to the reduction in computing time; as the model performs fewer computations per frame, the processing speed for each frame increases. Consequently, higher confidence levels lead to a more efficient processing rate, reflected in the increased FPS.
A notable distinction among the YOLOR model versions is their size and corresponding impact on performance. The YOLOR P6 is the smallest and lightest version of the YOLOR architectures, resulting in the highest average FPS due to its reduced computational requirements. In contrast, the YOLOR CSP X is the largest and most complex version, which, while offering greater accuracy, incurs a higher computational cost and, thus, lower FPS. The YOLOR CSP represents a middle ground, balancing computational load and processing speed.
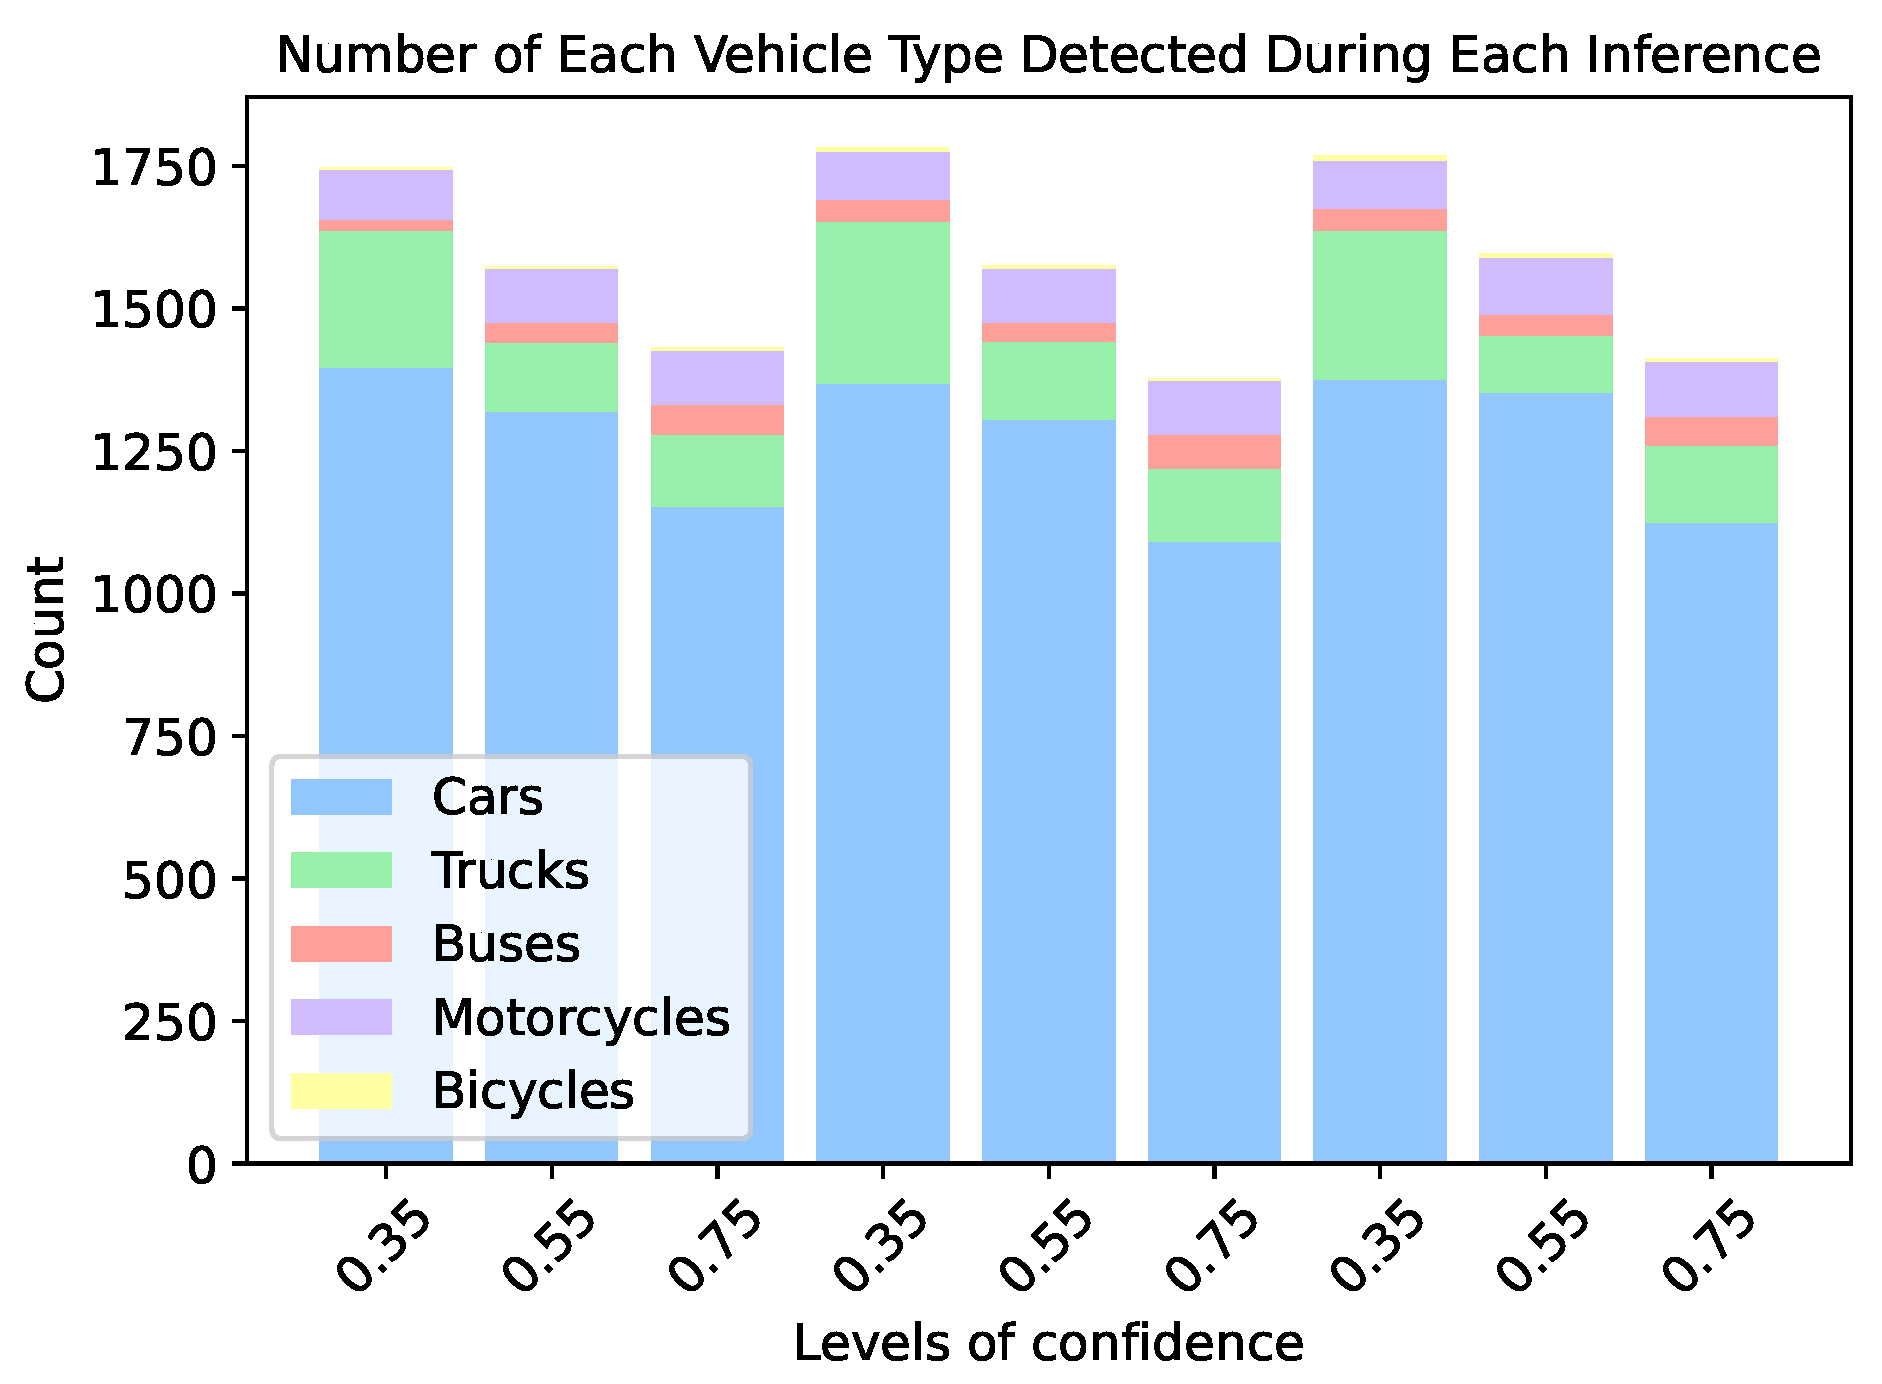
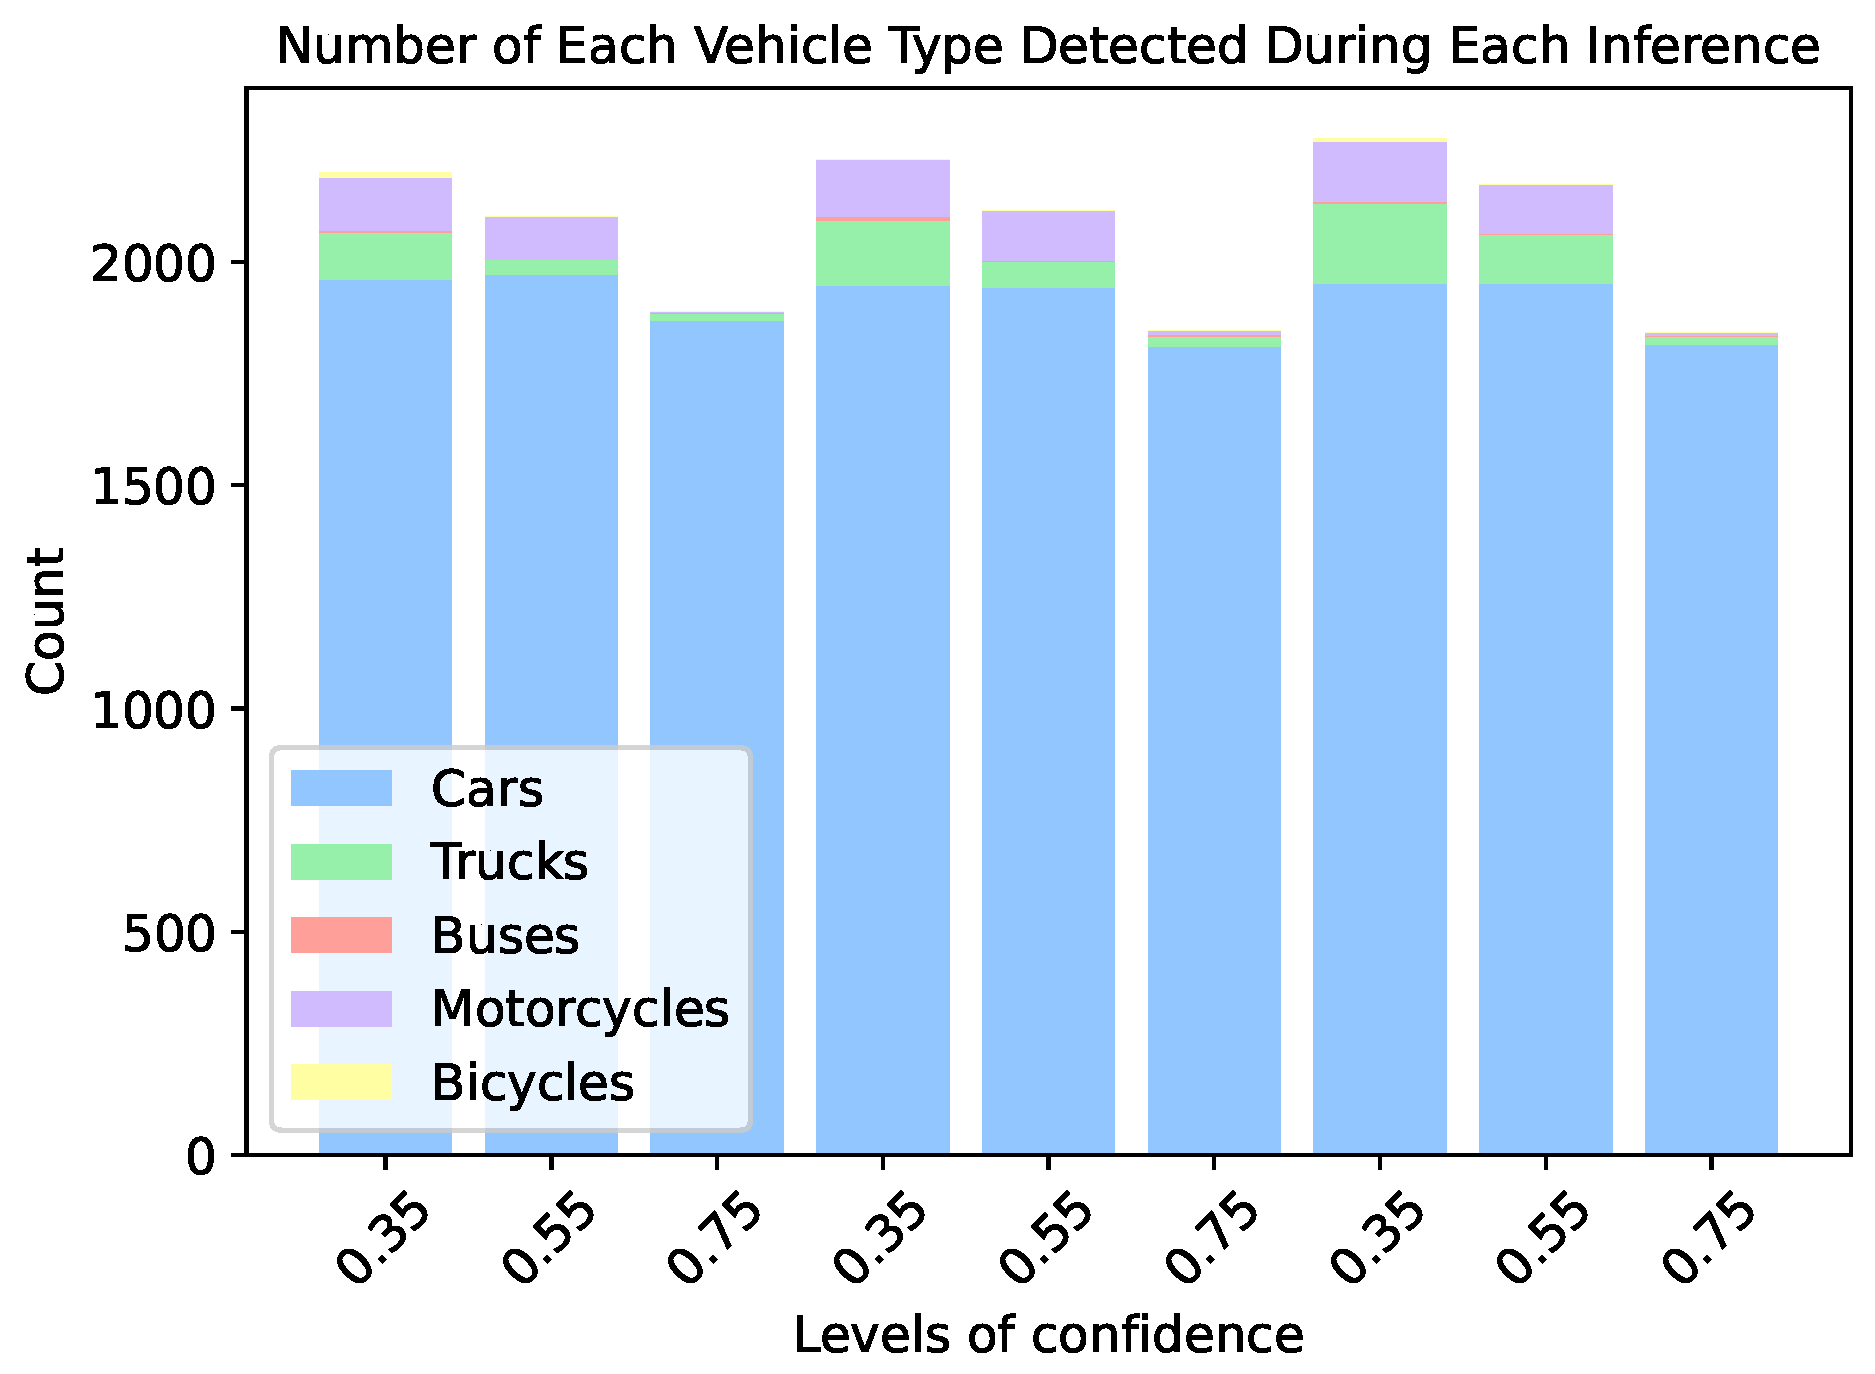
Figure 4 and
Figure 5 provide the number of vehicles detected in each tested confidence level for each model version. Vehicle classes are abbreviated as follows: Cars (
C), Trucks (
T), Buses (
B), Motorcycles (
M), and Bicycles (
Bi). These figures illustrate the variability in vehicle counts across different model versions and confidence levels. Despite this variability, the results fall within a 2% tolerance range as indicated by the standard deviation.
Given the differing scales of each vehicle class, the values were normalized to a range between 0 and 1 for consistency. The standard deviation (STD) for each class under each inference scenario was calculated to assess the consistency of the detections. The results for the MS1 are the following:
STD C = 0.36925
STD T = 0.36299
STD B = 0.29011
STD M = 0.32064
STD Bi = 0.31207,
while the results for the MS2 are the next:
STD C = 0.37424
STD T = 0.34863
STD B = 0.28571
STD M = 0.40356
STD Bi = 0.32578.
In this study, the “Car” vehicle type is the predominant category within the vehicular distribution, reflecting the typical urban traffic composition. This is a familiar situation where passenger cars comprise the majority of the traffic flow. However, it is crucial to underscore the significance of the“Trucks” category, as trucks substantially impact the roadway infrastructure. Trucks exert much greater stress on road surfaces compared to regular passenger cars due to their heavier weight and larger size, which leads to increased deformations. A similar distribution pattern is noticed at MS2, where the “Car” category remains the prevalent class. The “Truck” category is the second-most frequent, reinforcing the importance of considering the influence of trucks on traffic management and infrastructure maintenance.
4.2. Comparison Models
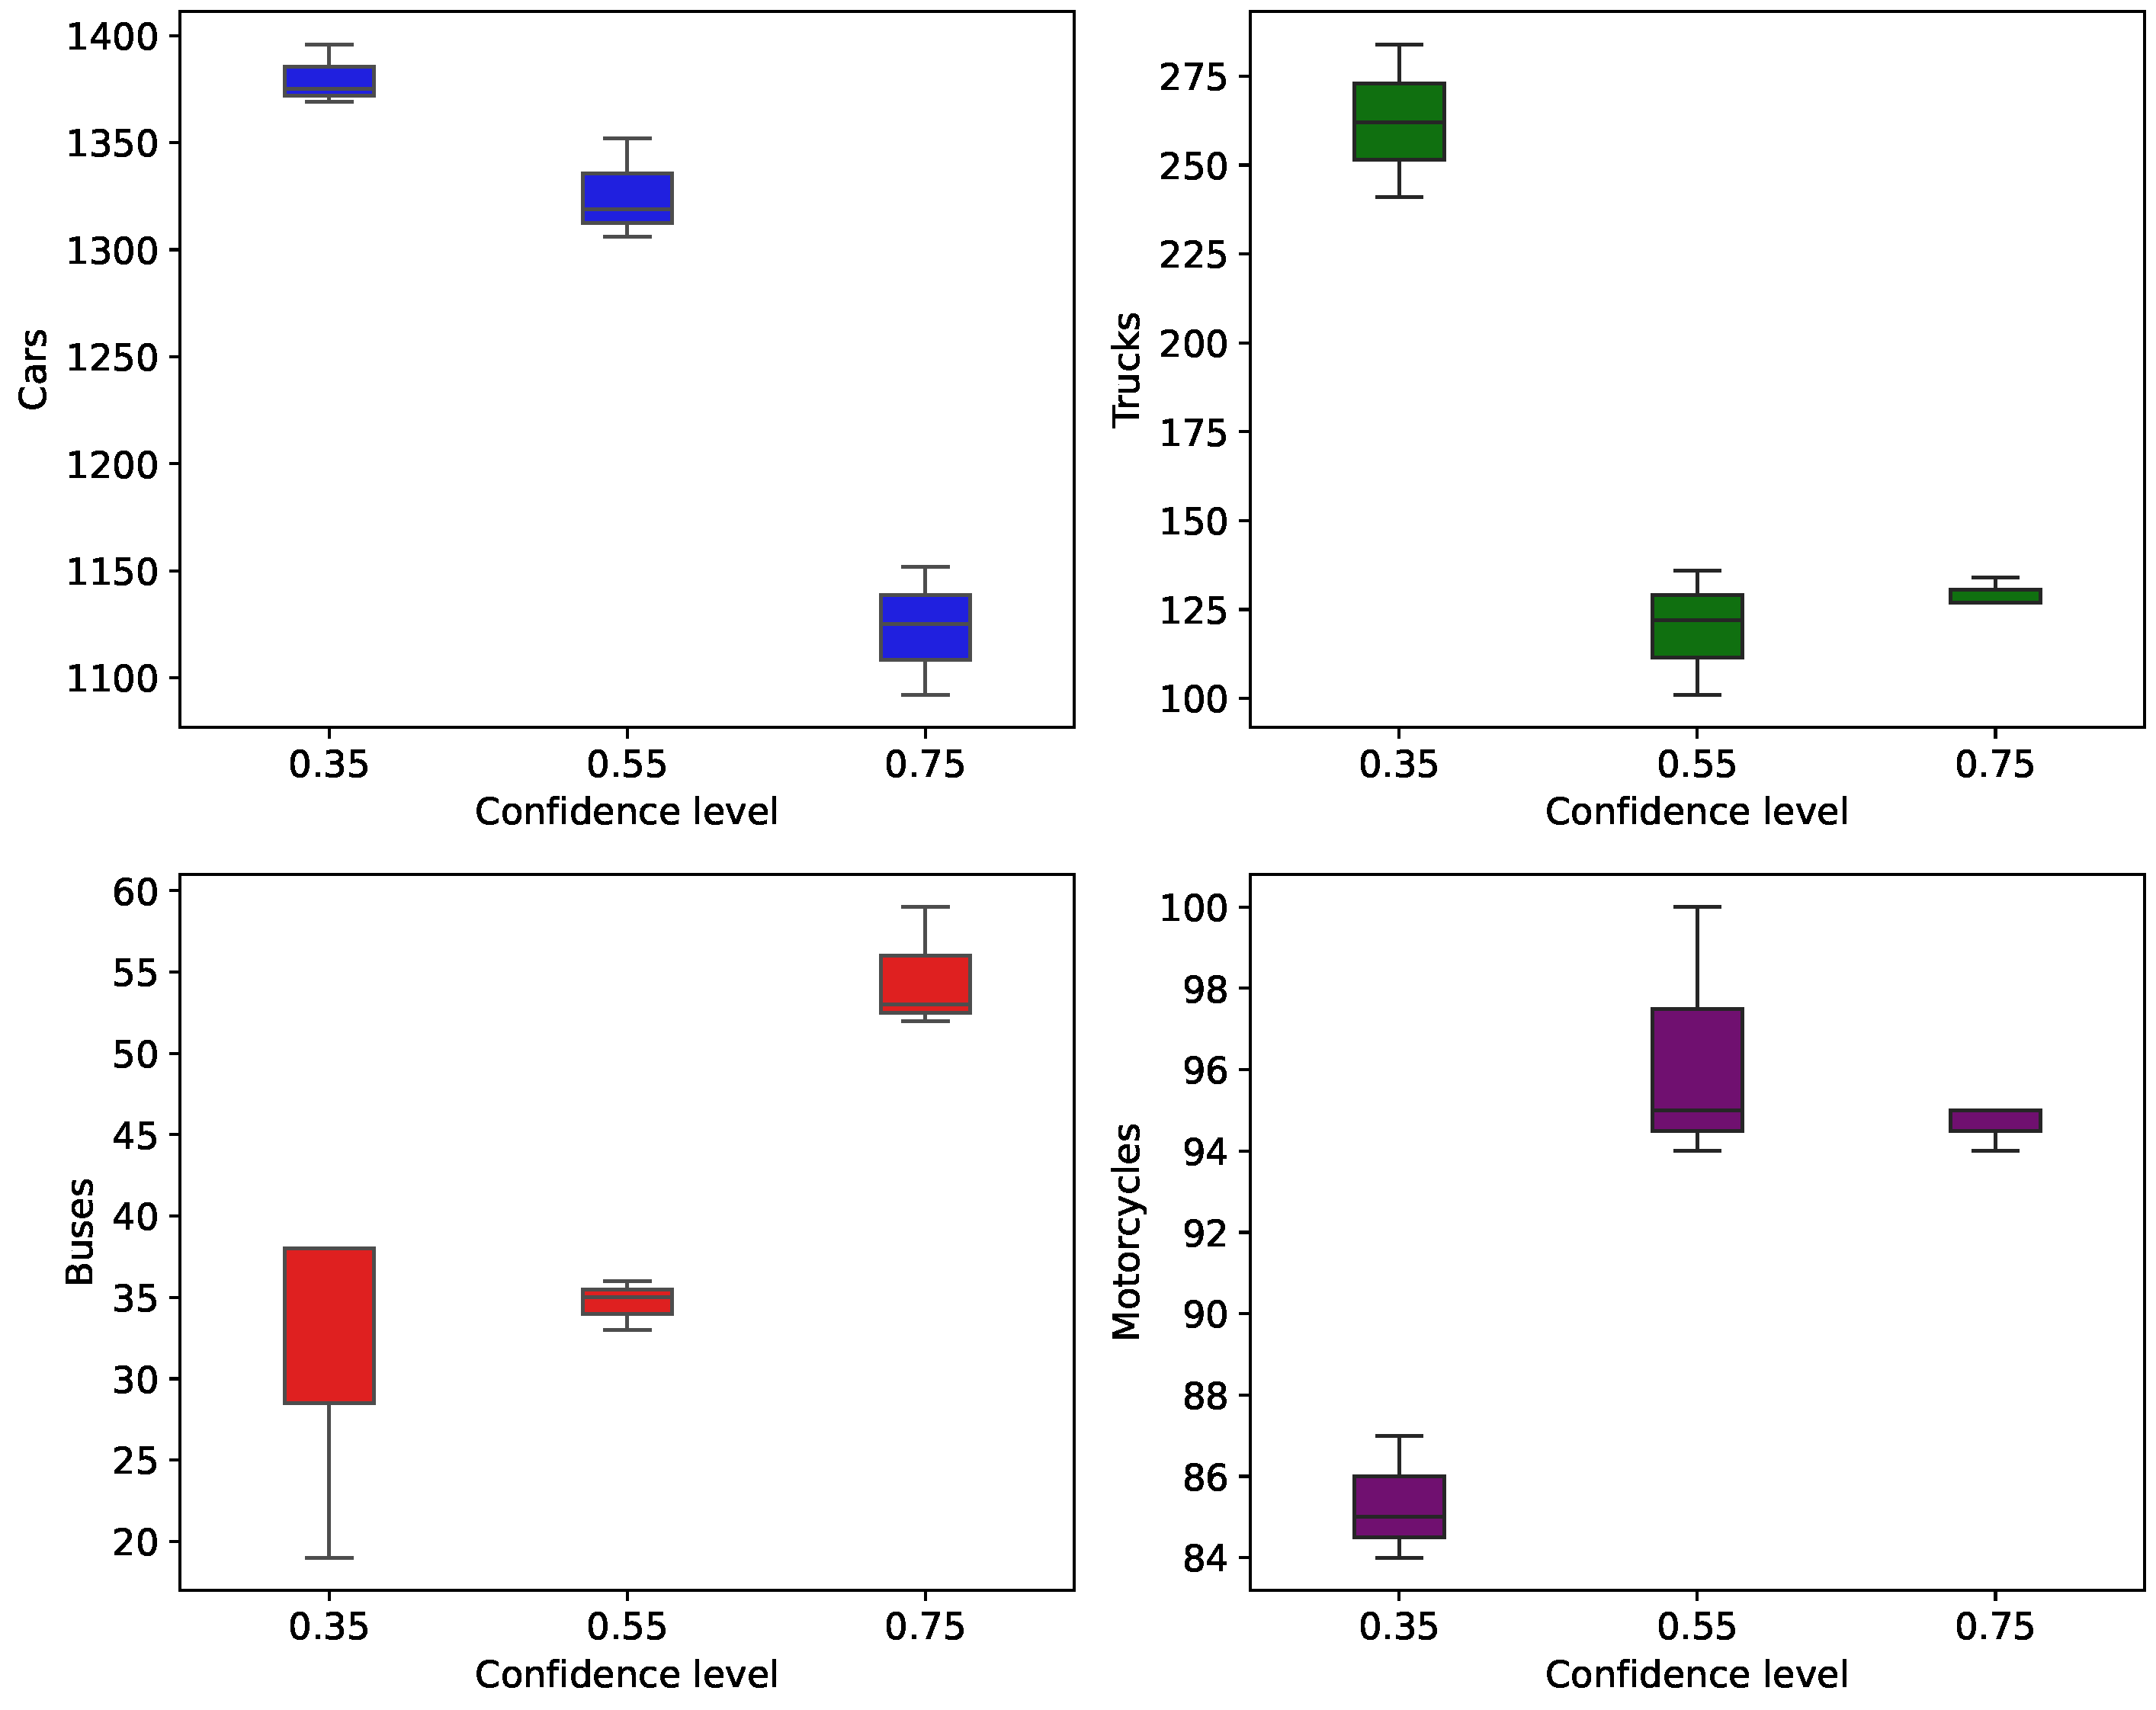
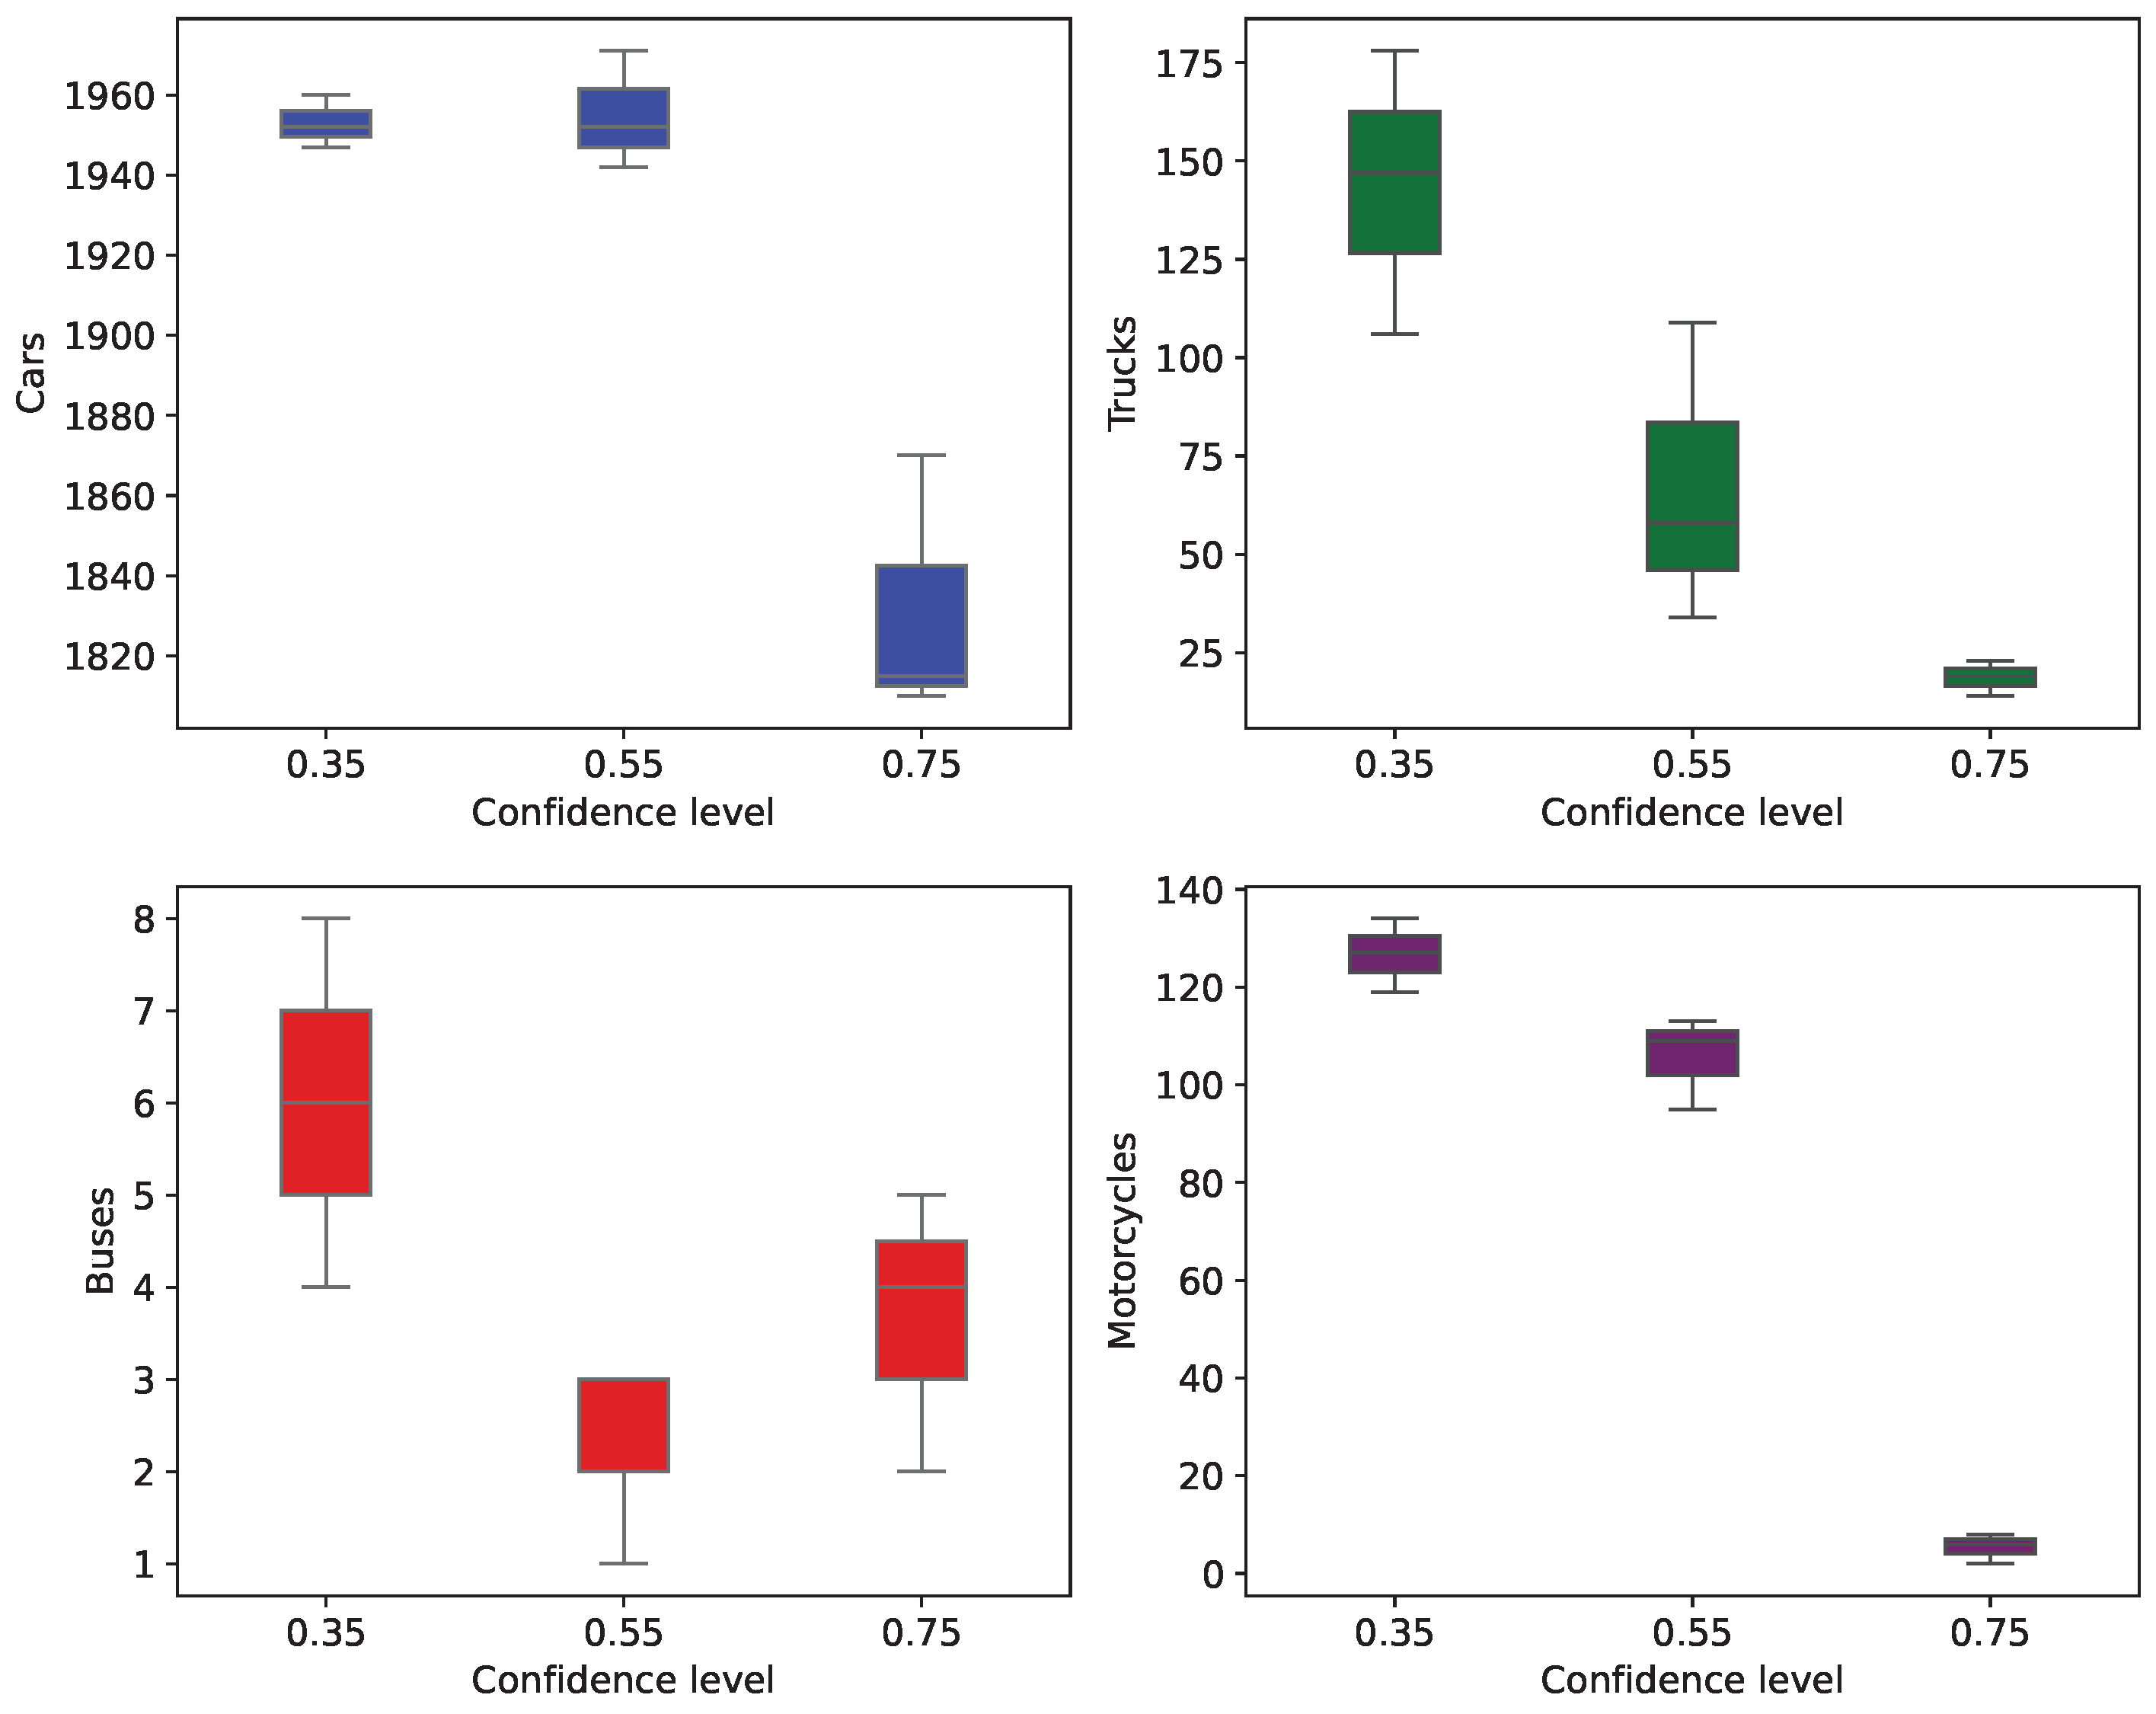
Once the model’s performance for each stage was computed, a statistical analysis was performed to recognize the more stable performance across all the tests. The distribution of the number of vehicles is visualized using boxplots, which categorize the variety of vehicles by confidence level across the classes: Cars (
C), Trucks (
T), Buses (
B), and Motorcycles (
M). These boxplots are depicted in
Figure 6 and
Figure 7, illustrating the inferences made by the
YOLOR P6,
YOLOR CSP, and
YOLOR CSP X models. Each confidence level contains the distribution for the three mentioned models in these boxplots.
The previous information provides a sense of the density of the information, which was computed by
YOLOR P6,
YOLOR CSP, and
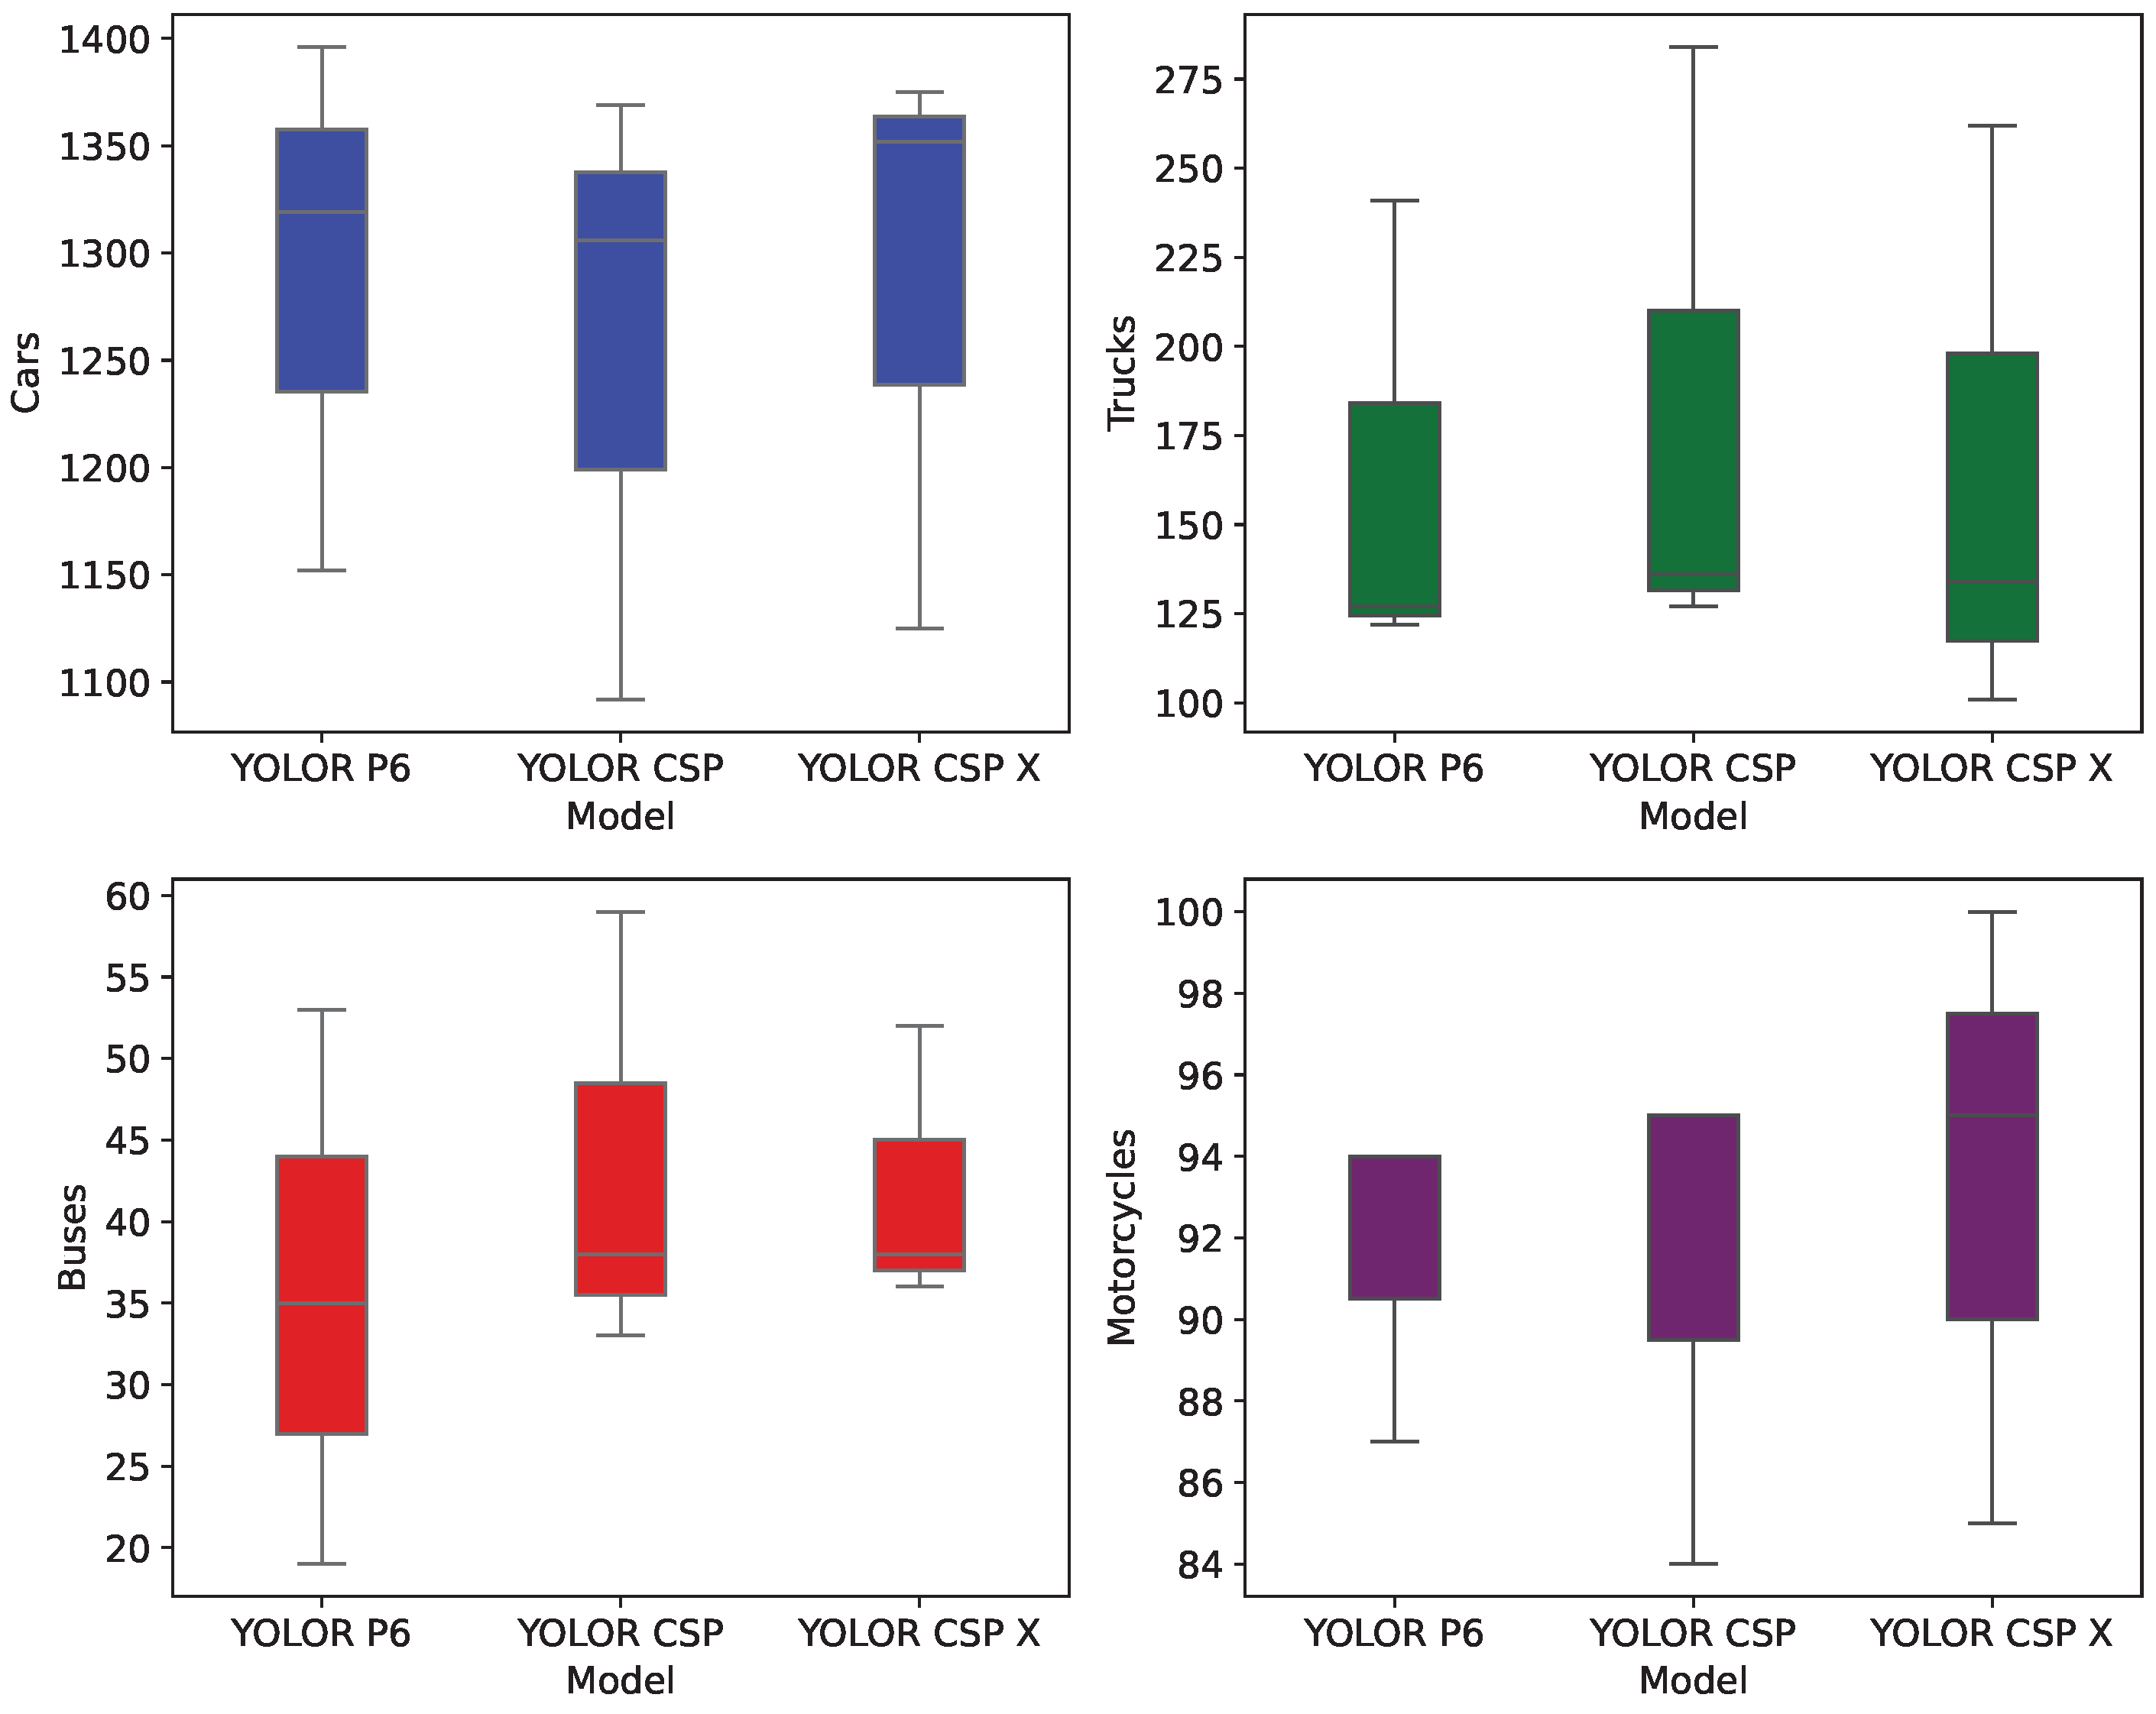
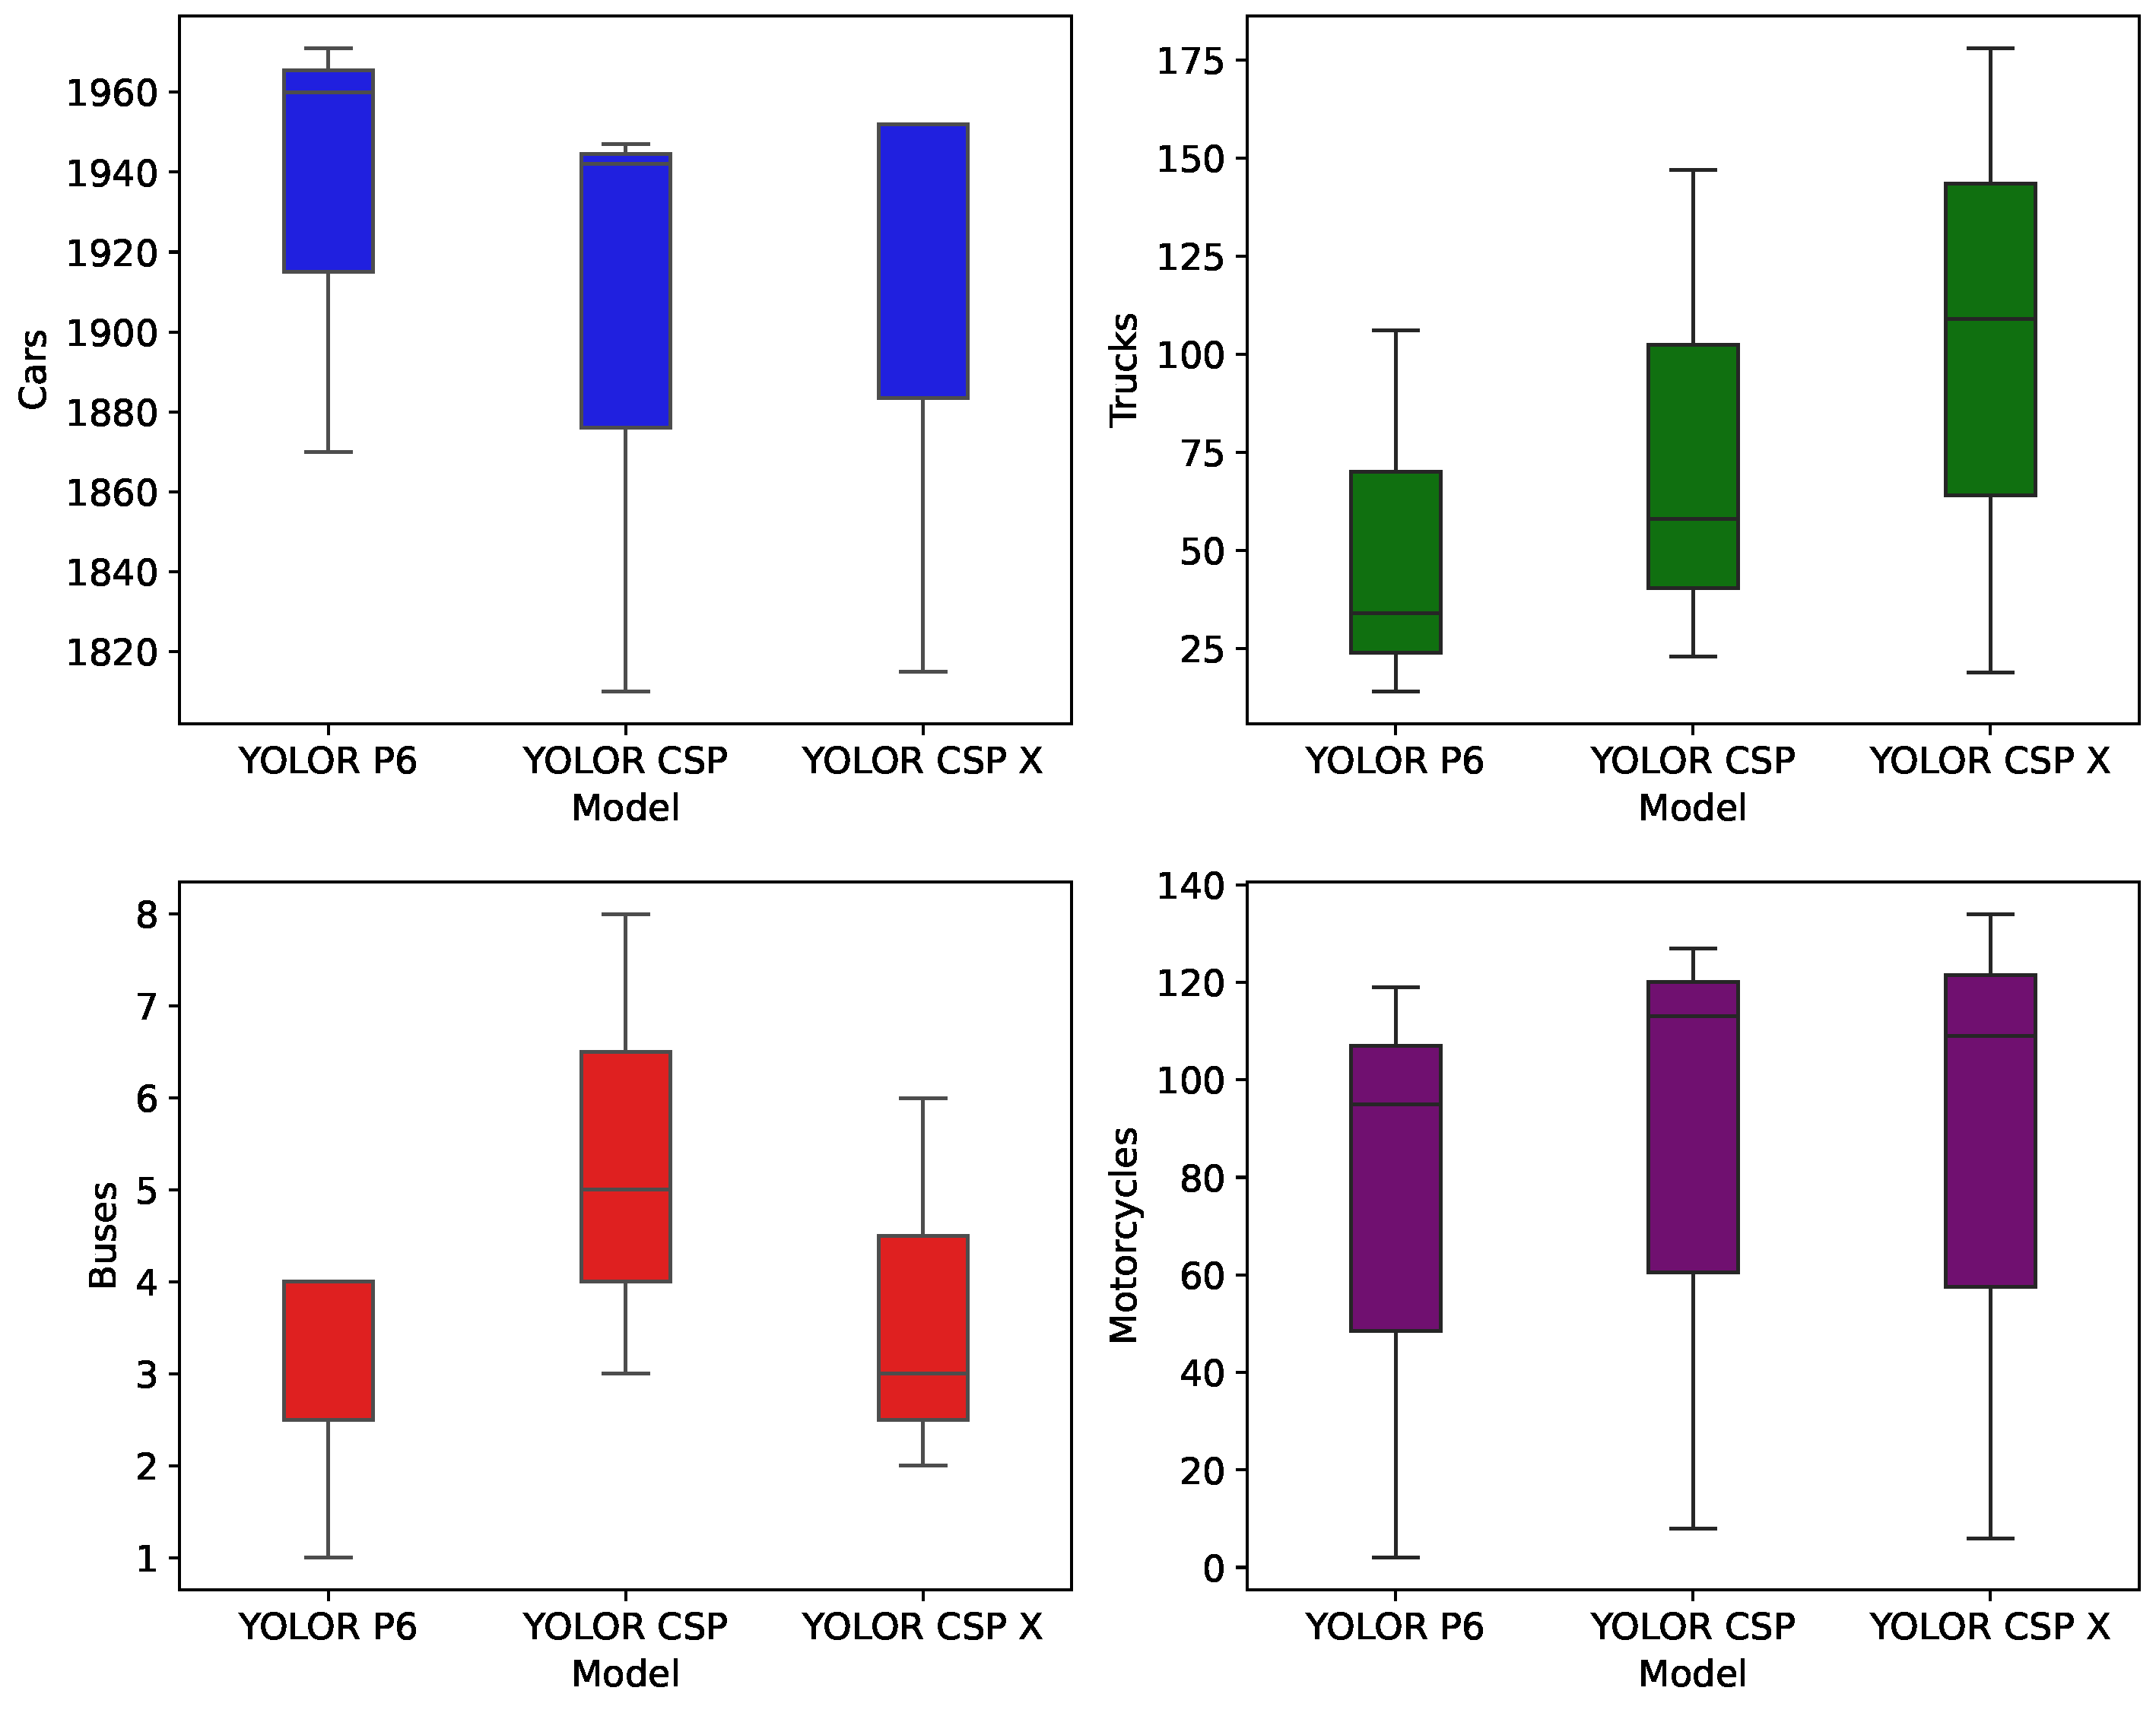
YOLOR CSP X models. This information showcases no significant variations in the amount outputted by the models, demonstrating consistency in their performance and the absence of outlier data. In addition, this analysis was performed using the models as reference points, where the results are illustrated in
Figure 8 and
Figure 9, and for this case, each model’s version contains the distribution for the three confidence levels, 0.35, 0.55, and 0.75.
Table 6 and
Table 7 present the ground truth data for the monitoring stations MS1 and MS2. These tables contain the actual counts of each vehicle class as recorded in the video footage, serving as a reference for evaluating the performance of the YOLOR and Deep Sort algorithms. The number of vehicles detected was compared with the ground truth at varying confidence levels across different model versions to assess accuracy.
For this analysis, the average accuracy was calculated by counting the number of vehicles detected in each inference mode (defined by the confidence level and model version) and comparing it against the ground truth. The computed average accuracy results are displayed in
Table 8 and
Table 9 for MS1 and MS2. These comparisons allow for a detailed understanding of how well the models performed in various configurations and conditions, highlighting the strengths and limitations of each approach in accurately identifying and counting vehicles.
By evaluating the data in this manner, the study provides a comprehensive overview of the efficacy of different YOLOR model versions and confidence levels in real-world traffic scenarios. This detailed analysis is crucial for determining the reliability and precision of these models, offering valuable insights into their potential applications in traffic management systems.
Table 8 and
Table 9 detail the overall performance metrics for each model version across all analyzed vehicle classes. The data indicate that the model generally performed well in identifying and counting vehicles in classes
C,
T, and
M, with the highest accuracy observed in these categories. However, the detection and classification of classes
B and
Bi are less consistent, leading to a slight decrease in the overall model performance. This discrepancy suggests that improvements are necessary in detecting these vehicle types to enhance the model’s overall accuracy.
At MS1, the best performance was achieved with the YOLOR CSP model configured at a confidence level of 0.35. Similarly, for MS2, the same model version and confidence level yielded superior results. This consistency indicates that the YOLOR CSP model at a 0.35 confidence threshold is optimal for the traffic conditions observed in this study.
Despite the generally robust performance of the YOLOR algorithm, there is a noticeable trend where lateral perspectives more accurately detected and classified vehicles in classes B, M, and Bi. In contrast, frontal and overhead views did not perform as well in these categories. This observation suggests that the camera angle and perspective might influence the model’s detection capabilities, highlighting a potential area for further refinement.
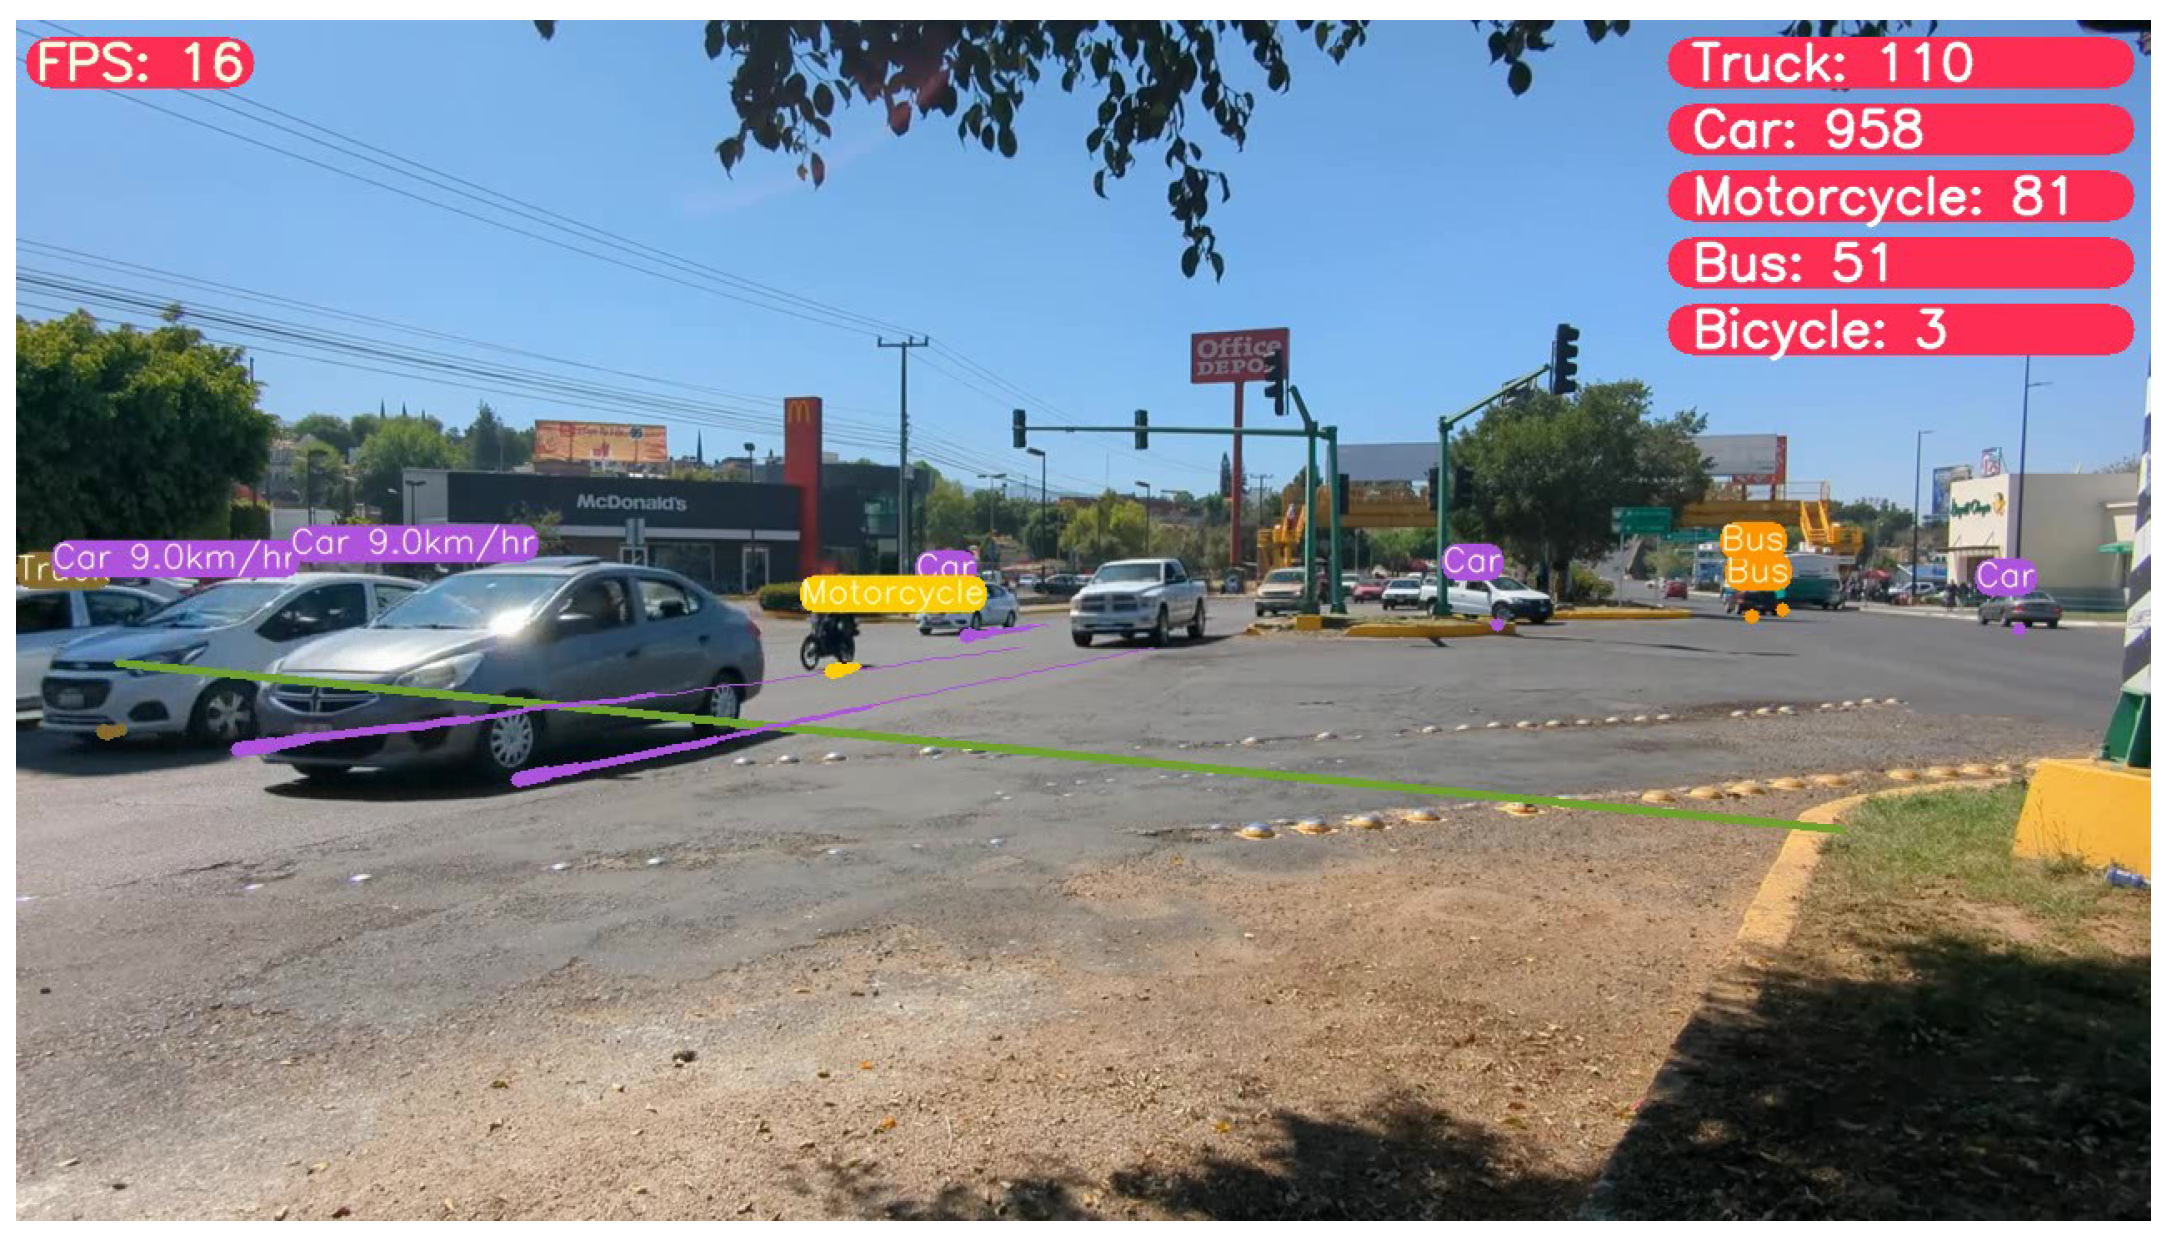
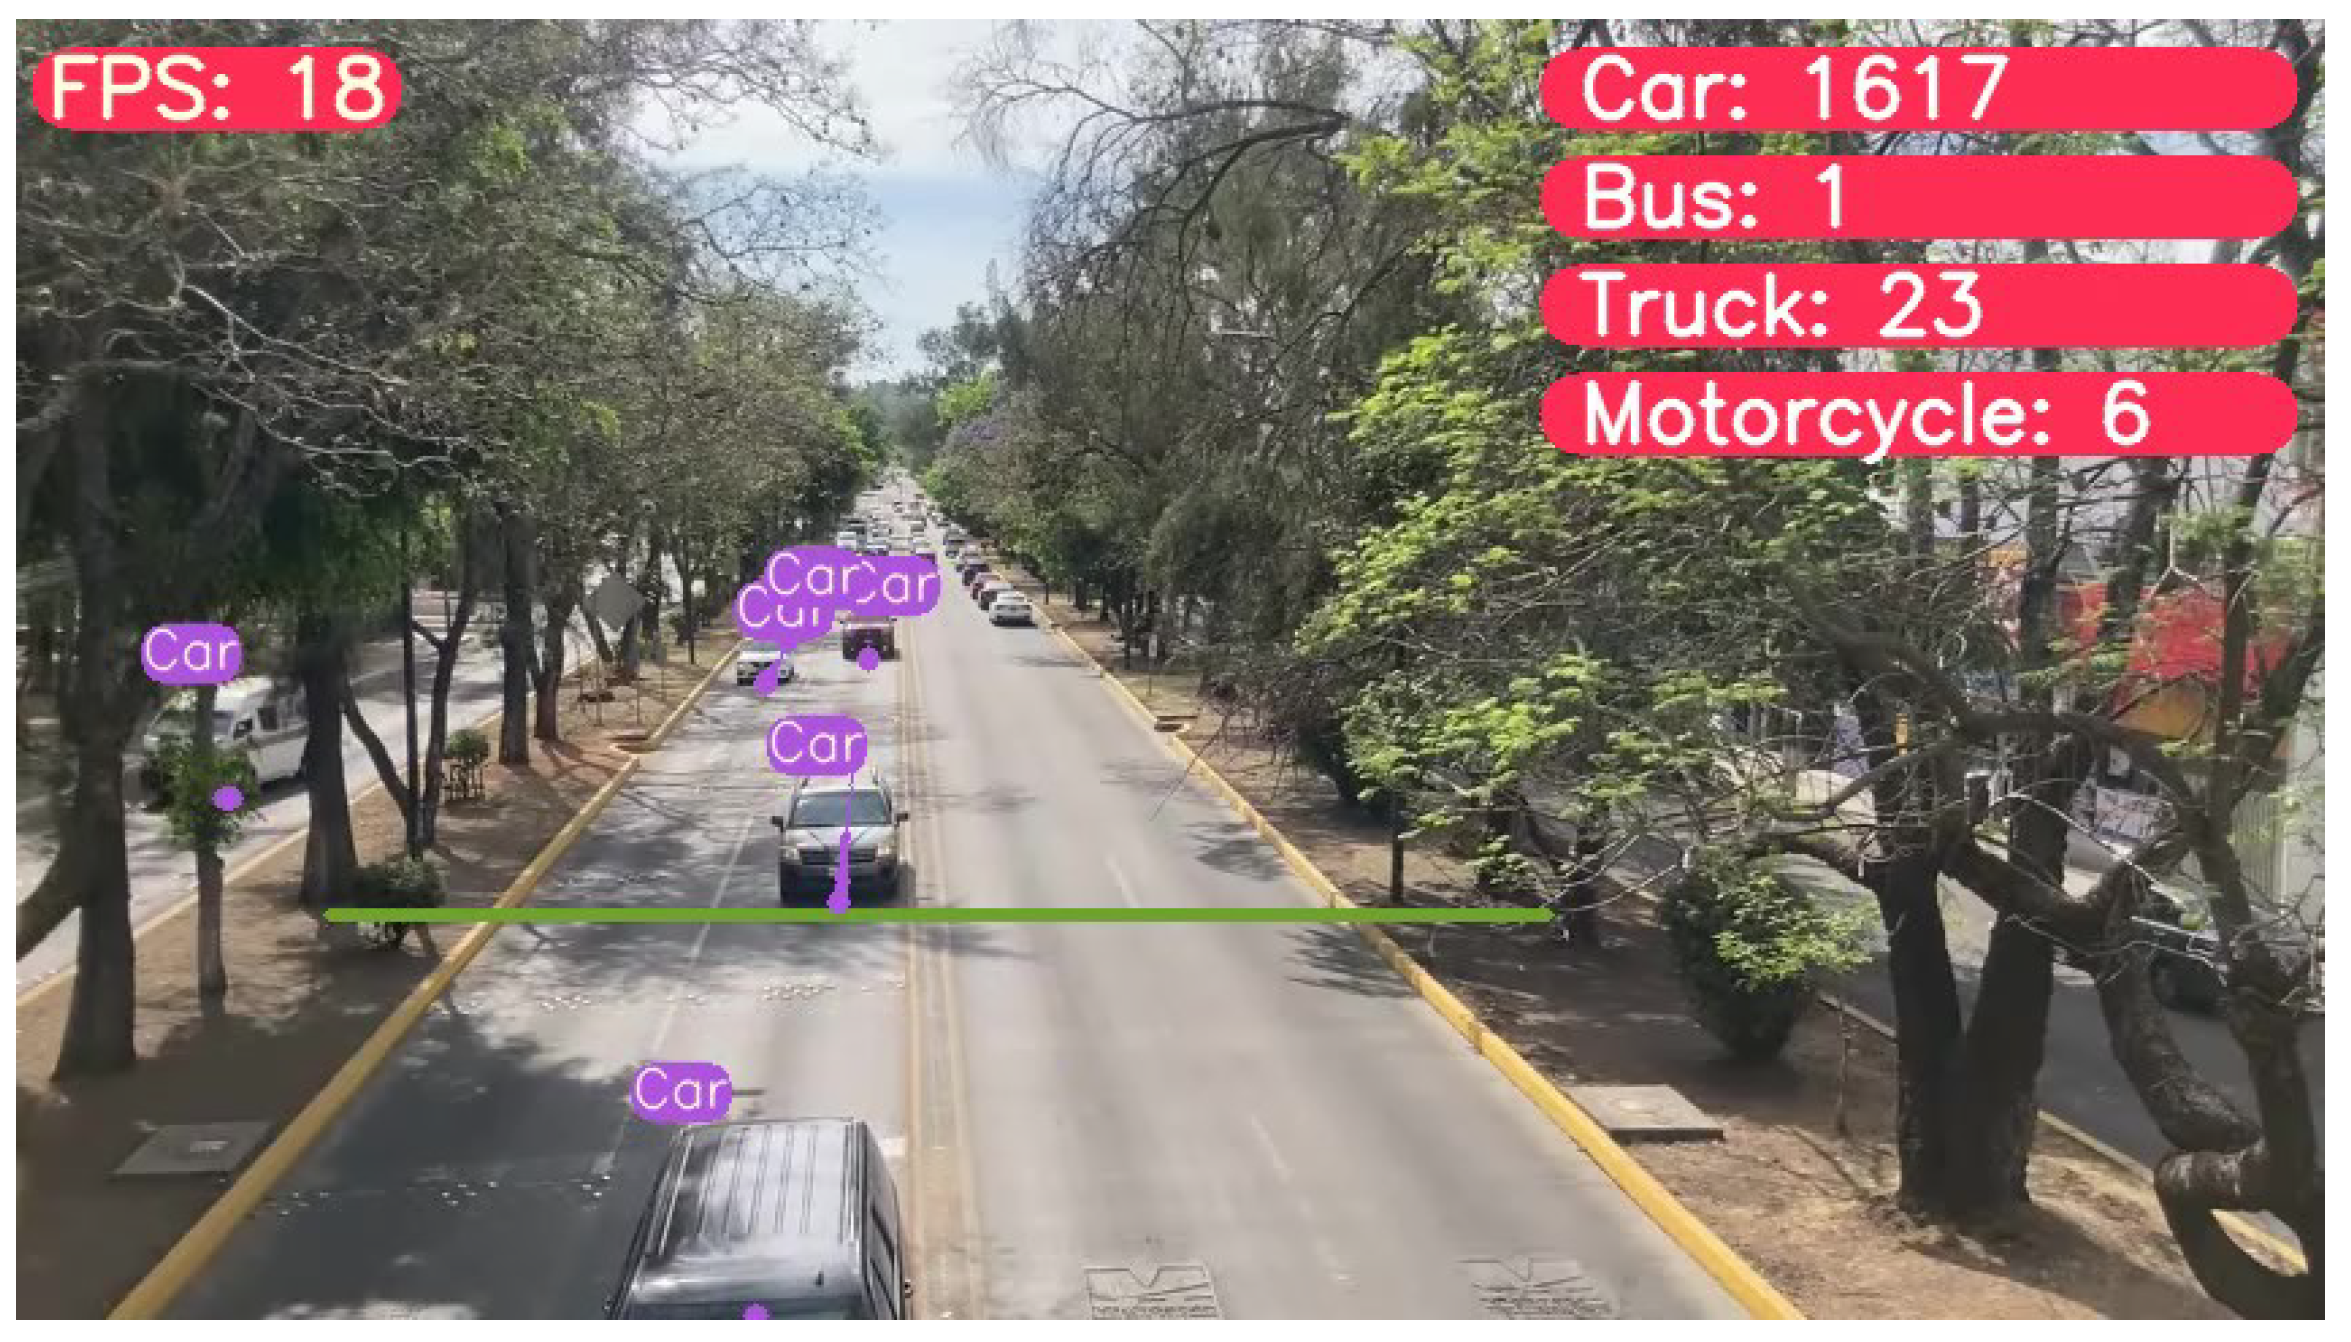
In order to give an overview of the model’s performance in MS1 and MS2,
Figure 10 and
Figure 11 show a screenshot by each monitoring station, depicting how the counting process looks.
For an extensive view of the model’s performance, the following demos represent a fragment of each video footage, MS1 and MS2, respectively.
4.3. Inferences from Monitoring Stations
Once all models were analyzed and tested with different confidence levels, and the best model and confidence level were selected, some changes were made in the analyzed inferences. First, the classes of interest were changed to
C,
T, and
B because these classes are the most well addressed by the algorithms and at the same time, in a vehicle capacity, these types of the vehicles are the most important because these are determinant in the exerted loads to the pavement surfaces. Second, the
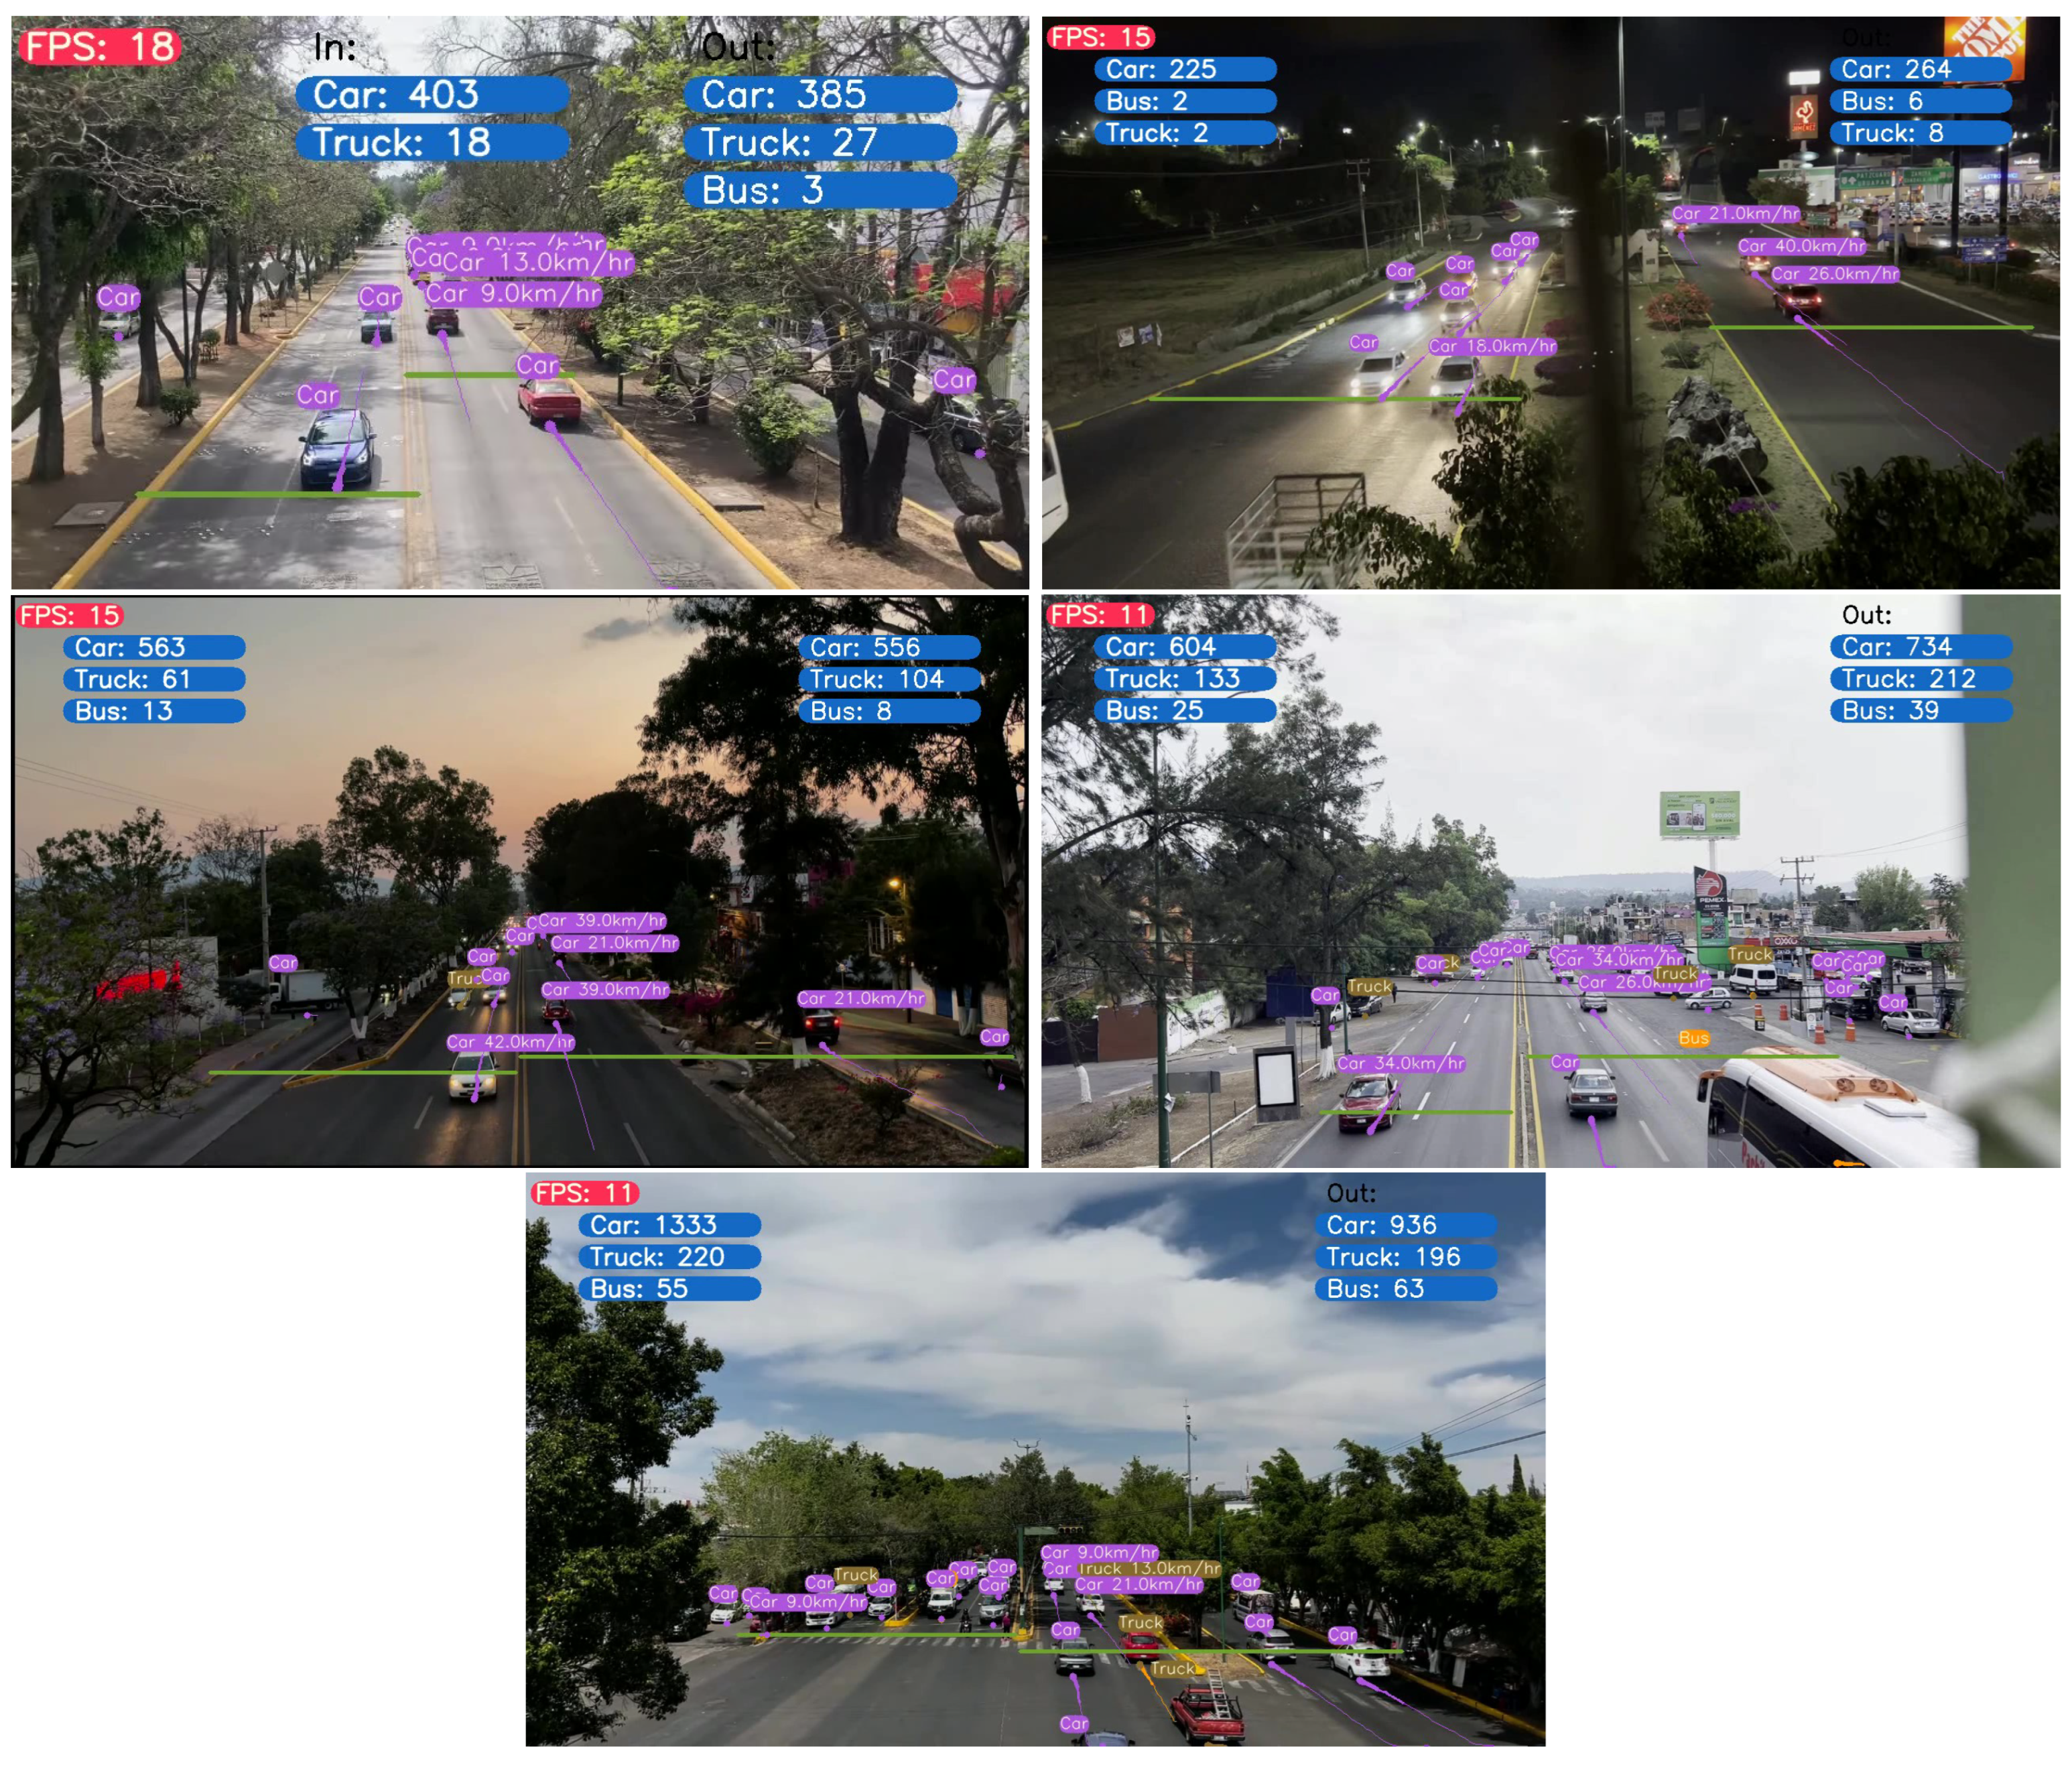
virtual counter was divided into two counters, one that is responsible for counting the vehicles in one direction and the second that counts the vehicles in the opposite direction. Screenshots of all monitoring stations are illustrated in
Figure 12.
The demos of the remaining monitoring stations can be found in:
With these findings and changes applied to the monitoring stations, the results are shown in
Table 10, where the results of the last column are the results of the total of vehicles detected by the AI approach and the number of vehicles registered as the ground truth.
From the demos and the results shown in
Table 10, it is possible to notice that the combination of the analyzed algorithms can solve the problem of the counting vehicles task with heavier accuracy. It is important to note that the higher accuracy observed in
Table 10 at MS1 and MS2 is due to the focus on well-detected vehicle classes—
C,
T, and
B—while other classes that presented challenges in classification were excluded, contributing to the improved performance metrics.
However, the combination of these algorithms can adopt various improvements to achieve the best performance in this type of analysis. Initially, the pre-trained weights used in this research correspond to a dataset with a significant general classification of the vehicles. In that sense, the vehicular classification for Mexico is different. This scenario suggests corrections in the type of vehicles that are implicit in the pre-trained weights, and it will be possible with a customized dataset. For instance, the models tend to confuse public transportation (which, in the case of México, is called “combis”) by C or T. This confusion produces a different number of detected elements during the inference. Also, a variety of T used in México are classified and detected as C because this type of vehicle was not defined previously during the training process.
Another critical finding is that the models perform better when the camera angle allows them to observe the shape of the vehicles, enabling better vehicular classification. Considering this observation, the angle of the cameras can be modified, or some frontal vehicle images will need to be trained to recognize the type of vehicle more accurately across the inference. Additionally, weather conditions and light intensity significantly impact the recognition results. Unfavorable weather and low-light scenarios increase the likelihood of false positives and negatives, particularly at night or in severe weather conditions.
In some cases, the algorithm needs to figure out the class of a detected vehicle, causing the output to show two classes simultaneously, duplicating the register of the vehicle, one by each class. Regarding the registered number of vehicles, the AI approach showcases an excellent accuracy of about 98% on average, which is relevant for data traffic management.
Comparing traditional vehicle counting methods, such as visual observation and pneumatic sensors, with the AI-based approach reveals clear advantages in terms of efficiency, speed, and real-time adaptability. The AI approach, exemplified by the YOLOR model, demonstrates significant potential for improving traffic management. However, it is essential to continue enhancing these computational methods. This emphasis on continuous improvement underscores the importance of the audience’s role in further distinguishing AI-based approaches from traditional techniques and fully leveraging their capabilities.
5. Conclusions
This research showcases that implementing the YOLOR algorithm combined with Deep Sort demonstrates a significant advancement in traffic monitoring systems. The integration of these technologies allows for accurate vehicle detection and classification, offering a reliable solution for real-time traffic management. This study highlights the importance of selecting appropriate model versions and confidence levels to optimize detection accuracy and processing speed, enabling traffic authorities to enhance road safety and manage resources effectively.
Furthermore, the findings underscore the need for continued research and development to refine these AI-based approaches. Future work can further improve the efficiency and reliability of these systems by addressing challenges such as vehicle misclassification and the impact of camera angles. The application of AI algorithms in Morelia sets a precedent for its potential adoption in other urban areas, contributing to the broader effort of developing intelligent traffic management solutions.
Regarding the computational efficiency, the authors corroborated that YOLOR P6 exhibits the fastest processing times due to its lightweight architecture, making it ideal for real-time applications where speed is critical. YOLOR CSP balances between computational efficiency and accuracy, suitable for scenarios requiring moderate speed and precision.
Another critical finding is the behavior of the confidence level since as the confidence level increases, the accuracy of vehicle detection improves, reducing false positives and negatives. This relationship underscores the importance of setting an optimal confidence threshold to balance detection accuracy and processing speed.
The variability in vehicle counts across different model versions and confidence levels is minimal, with standard deviations indicating a high level of consistency. This consistency ensures reliable vehicle detection and classification across varying factors.MDPI
The findings from this research highlight the potential of YOLOR combined with Deep Sort for efficient and accurate traffic monitoring. By selecting appropriate model versions and confidence levels, traffic authorities can optimize resource allocation, enhance traffic flow, and improve road safety. This study not only demonstrates the novel application of the YOLOR and Deep Sort algorithms for real-time vehicle detection and classification but also establishes their viability under controlled conditions in vehicle-counting tasks, providing a reliable approach for enhancing traffic management systems.

