Abstract
This paper examines the critical decision process of reducing the dimensionality of a dataset before applying a clustering algorithm. It is always a challenge to choose between extracting or selecting features. It is not obvious to evaluate the importance of the features since the most popular methods to do it are usually intended for a supervised learning technique process. This paper proposes a novel method called “Decision Process for Dimensionality Reduction before Clustering” (DPDRC). It chooses the best dimensionality reduction method (selection or extraction) according to the data scientist’s parameters and the profile of the data, aiming to apply a clustering process at the end. It uses a Feature Ranking Process Based on Silhouette Decomposition (FRSD) algorithm, a Principal Component Analysis (PCA) algorithm, and a K-means algorithm along with its metric, the Silhouette Index (SI). This paper presents five scenarios based on different parameters. This research also aims to discuss the impacts, advantages, and disadvantages of each choice that can be made in this unsupervised learning process.
1. Introduction
For decades, the “curse of dimensionality”, as defined in 1957 by mathematician R. Bellman in [1], has been an issue in machine learning [2]. This problem is caused by having too many dimensions in a dataset. Having more dimensions also means having a higher error rate and an exponential running time. Theoretically, having more dimensions (or features) implies having more information, which may seem to be a good thing. Practically, there is also more noise and, since several features are often covariants, the covariance of features leads to information redundancy. Hence, in some circumstances, there are benefits to gain by reducing the dimensionality of a dataset, namely, to reduce the error rate and processing time. There are several ways to address this “curse of dimensionality” problem. Both feature selection and feature extraction algorithms are commonly used to reduce dimensionality.
Even if dimensionality reduction algorithms are easy to use, it is still a challenge to select the best method based on requirements and the distribution of the data in the dataset. This paper addresses the difficulty in selecting an optimal method for dimensionality reduction in an unsupervised learning context. Basically, the objective of this paper is to discuss feature selection or feature extraction after having evaluated the feature importance. There are several combinations of algorithms that can be used to prepare the features. The choice of the right combination is not obvious, since each one has its pros and cons. There are different schools of thought on when extracting or selecting the features is required, as well as the option of leaving the totality of the features intact [3].
This research paper proposes a novel method, “Decision Process for Dimensionality Reduction before Clustering” (DPDRC). It has its own input, output, and metrics to make the optimal choice between feature extraction and feature selection. According to the input parameters, the right combination of algorithms is used in the dimensionality reduction, followed by a clustering process. This paper presents the clusters as both text and graphics (radar and stacked radar. It is based on the machine learning methods FRSD, PCA, k-means combined with its SI metric.
Principal Component Analysis (PCA) is a useful algorithm to extract features and reduce the dimensionality of a dataset [4]. It has been also used in a smart city context [5]. It consists of linear transformations that convert a set of correlated variables into a set of linearly uncorrelated variables. Wong [6] shows that a PCA algorithm can help determine indicators, such as local economic development (LED). He defines a framework of 11 features, based on an initial total of 29 features. He uses regression models to find relative strengths of the relationships between the LED indicator and performance variables. Others like [7] use a PCA algorithm combined with cluster analysis (CA) to study social-economic indexes (e.g., non-agriculture population, gross industry output value, business volume of post and telecommunications, and local government revenue). The analysis is applied to 17 counties and cities. In this example, a PCA algorithm is used to retrieve the first and second principal components (PC1 and PC2). According to PC1 and PC2, the CA classifies the cities into four classes of growth poles. Research like [8,9] also uses a PCA algorithm to extract features in the field of big data and smart cities.
There are several methods to select features after having analyzed the importance of each one in both supervised and unsupervised contexts. Important literature reviews on this subject include [10,11,12]. Some papers focus on feature selection in large-scale datasets [13], while others discuss feature selection in a clustering process [14,15].
One very recent technique [16] is particularly interesting when it is time to select features before performing a clustering process. To evaluate the importance of the features in an unsupervised learning context, it generates the label according to one criterion: cluster consistency. This method is called the Feature Ranking Process Based on Silhouette Decomposition (FRSD) algorithm. It aims to solve the evaluation of features for clustering using a Silhouette Index (SI) metric. It consists of generating an SI for every possible combination of features, for each value of k (the number of clusters) in a k-means clustering algorithm.
For the reduction of dimensionality, clustering is an important part of the unsupervised learning process. Different algorithms can be used, like k-means for standard crispy clustering [17], or c-mean for fuzzy clustering [18,19]. There are several techniques to evaluate the consistency of the generated clusters [20]. One of them is the Silhouette Index (SI) [21,22]. It is particularly useful when combined with a k-means algorithm.
This novel method can be used in different contexts. In this paper, the features used for the method’s validation are from smart city data. In this age of smart cities and intelligent urbanism, there is a need to analyze the data and understand its features [23,24]. In this specific context, an important part of the challenge comes from the fact that the data comes from multiple sources, including censuses, local health organizations, local dwelling organizations, the economic sector, and so on. Some research like [19,25] in smart urbanism has already shown the importance of having a good understanding of the data. Clustering methods have also been widely used over the years to regroup similar parts of a territory together [26].
The dataset used in this research comes from the London Datastore. It defines a deprivation index of each ward of the London area. In Great Britain, a ward is known to be a geolocational unit. This novel method uses a smart city dataset because the reduction of the dimensionality decision process is particularly important in this context. There are often many available features in a smart city dataset, and there is often a need to cluster the data. For instance, urbanists may want to regroup similar districts of a city and compare them according to some characteristics. Since there are several open city datasets like the one of the City of London, it is a good choice for validating this novel method. Data is available in both quantity and quality. The features are numeric and there is no categorical feature. Each one contains a score (IMD, income, employment, health, education, barriers, crime, and living) as described in Section 2.1.
2. Methodology
2.1. Selected Features
As previously mentioned, the dataset used in this research comes from the London Datastore and is called “Indices of Deprivation from the Ministry of Housing, Communities & Local Government (MHCLG)”. There are 4766 records in this dataset. Eight features have been kept for this research (see Table 1 [27]. There is also the ward code, which is the unique identification of a geographical sector in the United Kingdom. The ranking features of the wards have been dropped. The final feature list is as follows:

Table 1.
List of the features of the wards in the Greater London area.
1. IMD score is the Index of Multiple Deprivation. It is a combined index of other features. 2. The income deprivation score aims to give the proportion of people in an area who are living on low incomes. 3. The employment deprivation score is a simple proportion of working-age people who are involuntarily out of work–including those unable to work due to incapacity or disability. 4. The health deprivation score takes into account a wide range of aspects, including premature death and mental health issues as well as measures of morbidity and disability. 5. The education, skills, and training deprivation scores are formed from two subdomains combined with equal weights. The first includes measures for children and young people, using achievement and participation data at various educational stages. The second subdomain is a measure for working-age adults. 6. The barriers to housing and service score have two equally weighted subdomains–geographical barriers and wider barriers to suitable housing (household overcrowding, homelessness, etc.). 7. The crime score uses data on 33 types of recorded crime under four broad categories–burglary, theft, criminal damage, and violence. 8. The living environment deprivation score includes issues in terms of the standard of housing as the “indoor” living environment (central heating, poor conditions, etc.).
The London dataset is a good choice because it is available as open city data, there is no missing data or outliers, and is available in sufficient quantity. Although this novel method can be applied to any dataset, validating it on a smart city dataset is a good idea because its features are very intuitive and do not require special knowledge.
Table 1 shows the list of all the features that are processed by the machine learning methods.
There are 630 wards in the Greater London area. Section 3.1 gives additional information about the City of London and the ward system.
To visually represent the features, a radar graphic of a typical ward (00ADGM) is shown in Figure 1. It shows the values of the eight features on eight different axes. The values are normalized using a MinMax function to fit the graph scale from 0 to 1. The higher the values, the better the score is for each feature.
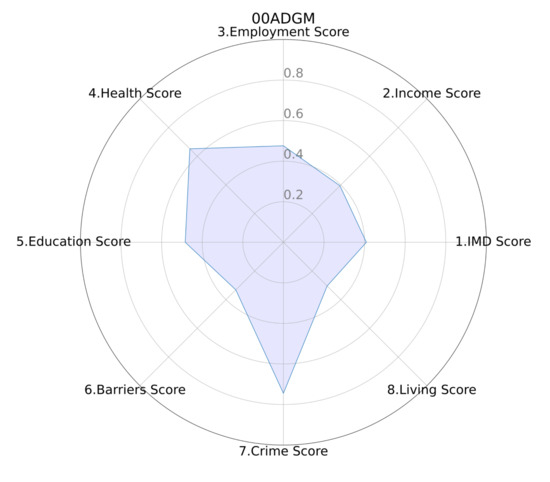
Figure 1.
Radar graphic representing every MinMax normalized feature.
2.2. Proposed Model Design
This novel method includes several parts that lead to a complete parametrized process. Figure 2 presents the methodology’s architecture. The first part is a three-step method to evaluate the importance of each feature in a clustering process using an FRSD algorithm. Step 1 is a loop that generates an SI from every feature combination. Step 2 aggregates the results. Step 3 normalizes the importance of the features using a MinMax algorithm. The second part evaluates feature importance according to a PCA algorithm. It converts the features into principal components (PCs), allowing the evaluation of the explained variance contribution of each feature. After having calculated the feature importance in an unsupervised machine learning context using both FRSD and PCA, the method has to choose between a feature selection (FS) or a feature extraction (FE) according to parameters defined by the user. It calculates two scores. Both scores are calculated according to the input parameters of the algorithm. These scores and their equations will be defined in Section 2.5. The user preference parameters allow the algorithm to orient the results toward either interpretability or integrity.
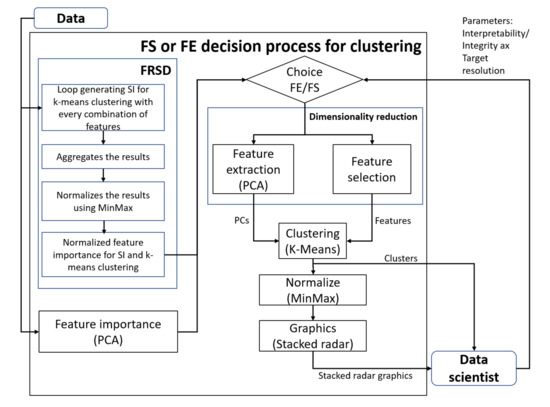
Figure 2.
Architecture of the methodology.
Having two scores, the process has to select the best option, knowing the data and the user’s preferences for interpretability and integrity. A higher score in interpretability leads to a feature selection. A higher score in integrity leads to a feature extraction using PCA. After having made a reduction of dimensionality (using FS or FE), clustering is applied using a K-means algorithm and returns the output to the user. The method also includes a normalization (using a MinMax algorithm) of the output and the production of stacked radar graphics (a stacking of several graphs presented in Figure 1) to better illustrate the results of the clustering process.
The features used to test this model are presented in Table 1. The following section describes each part of the process and its machine learning algorithms.
2.3. Evaluation of Features Using FRSD
It is more complicated to analyze the importance of the features in an unsupervised context than in a supervised context (the latter requires not only the data but also the label of each data). In an unsupervised context, the problem must be considered differently for two reasons: One, the feature number can be variable. For the City of London, the number of features can be between two and eight features. Two, in the case of a clustering algorithm like K-means, there is no label since it is an unsupervised technique.
Since there is no labeled data, it must be generated. The SI metric is used to evaluate the consistency of the clustering. In this method, it is also used to label the unlabeled features.
The FRSD algorithm calculates the importance of each feature by decomposing the average silhouette widths of the random subspaces. The goal is to solve the evaluation of the feature’s importance for clustering using an SI metric.
Before going further with the FRSD algorithm, let’s define the SI metric. There are several metrics to measure clustering performance. Each metric is not necessarily compatible with every clustering algorithm. Since the K-means algorithm is used, the clustering performance has been measured by the SI metrics. This metric is documented in [21] and [28]. The SI is defined by three equations. First, the distance between each point and the center of its cluster is defined by (1). The distance between the center of each cluster is shown in (2). Finally, (3) uses the result of (1) and (2) to calculate the final SI score that indicates the quality (consistency) of the clustering process. SI ranges from −1 to +1. Values from −1 to 0 indicate bad classification. SI values from 0 to 1 indicate the points associated with a good cluster. The higher the value, the better the cluster consistency [21].
The FRSD process uses the SI metric and is described in three steps [16]:
SI generation:
This step aims to generate the SI values for each combination of features and each evaluated cluster number k in a determined range. To determine it, a loop from a minimum number of possible clusters to a maximum number of possible clusters must be executed. A range of 3 to 15 has been used in this method to generate the SI. Inside this loop, a second loop generates an SI from every combination of the features. In the case of the City of London, a minimum of two and a maximum of eight features are needed. In this particular case, this means 248 results (possible combinations between 2 and 8 features), i times from i in range and . Since and = 12, a total of 148 × 12 = 1776 SI indexes will be created. Table 2 shows a partial example of the output generated for k = 10.

Table 2.
Generation of silhouette index for each combination of the features.
SI aggregation:
The algorithm aggregates the total of the SI for every feature. It sums the SI value if the feature n is in the feature’s list used to compute this SI. The result is a vector of the same size as the number of features. For each index, the sum of the SI for this feature index is divided by the sum of all the features.
Weighting feature:
The final ratio representing the feature importance is available in the final vector. Applying a MinMax function to the final vector will help to discriminate the values and improve the presentation. Equation (4) shows the MinMax normalization formula. It simply normalizes a number within a 0 to 1 range, associating the smallest value to 0 and the highest to 1. In (4), x is the input value to normalize.
The result is the importance of each feature in the clustering process. It can be summarized in (5) and (6).
where R is the resulting matrix, sub are the possible subsets of features, SI is the silhouette index, k is the number of clusters. The function kmeans(sub,k) applies a clustering process for the subset sub that must be divided into k clusters.
where NFI is the normalized feature importance, SI is the silhouette index, R is the resulting matrix of (5). feat and i are used to iterate the features and on the resulting matrices of (5). The final result NFI, a list of features and their importance that will be used in the decision process documented in Section 2.5.
2.4. Evaluation of Features Using PCA
This part simply runs a PCA algorithm on all the features. The number of principal components (PCs) specified is the same as the number of features in the input. Among other results, it provides a result in terms of explained variance for each feature. Aggregating this variable for each feature of each PC, and dividing by the total amount of explained variance provides the importance of each feature in the data extraction process.
This list of features and their importance will be important in the decision process documented in Section 2.5.
2.5. Choice between Feature Extraction and Feature Selection
This part of the algorithm uses parameters defined by users according to their feature requirements. Before defining the parameters, let’s define a key axis regarding dimensionality reduction – the “Interpretability/Integrity” axis. When choosing the method of dimensionality reduction, we have to choose between optimizing the interpretability of the features, or the integrity of the features. To optimize the interpretability of the features, a feature selection method must be used. Using this method, every feature will keep its name and significance but some features are completely dropped, causing a reduction in the resolution of the data. Contrarily, to optimize the integrity of the features, a feature extraction method (like PCA) must be used. With this method, every feature is used to generate a new set of normalized data. Since every feature is used in this process, the integrity of the data is better than with a feature selection that drops some of them. The counterpart of this method is that the names of the features are lost, being replaced by PCs. Consequently, there is a loss of feature interpretability.
In this method, two key parameters define the Interpretability/Integrity axis: interpretability-oriented and integrity-oriented. Both domains are a normalized number between 0 and 1, representing a percentage of importance. The sum of those numbers must equal 1. It simply describes the importance; a value of 0.1 means not very important and a value of 0.9 means very important.
Another parameter is the target resolution (target-resolution). This is used by the algorithm to select the correct amount of features in the reduction of the dimensionality process. Just enough features are kept to reach this resolution target. A high value means more features and a low value means fewer features.
There are two other important parameters: the minimum and the maximum k parameter of the K-means algorithm (k-min and k-max). It defines the domain of the possible number of clusters.
Now that we have defined the parameters, let’s define the decision part of the algorithm. First, the algorithm selects only the best features that reach the minimum resolution, based on the FRSD process. Then, the algorithm tries every possible value of k (number of clusters) between the range k-min and k-max. It keeps the value of k, resulting in the higher value of the SI. Using the interpretability-oriented parameter and the best-found value of SI (the “best SI” variable) in the clustering process, it computes the “interpretability score” as defined in (7).
The next part consists of finding the “integrity score”. It uses the PCA feature extraction algorithm. The algorithm uses only the required number of features to reach a minimum resolution, according to the PCA importance feature process. Then, it loops on every possible value of k in the k-min and k-max range. Containing the best consistency result in the clustering process, the best value of SI (“best SI” variable) is kept and the “integrity score” is computed as defined in (8).
The algorithm compares the two scores and selects the one having the greater value as an orientation for the dimensionality reduction. There are two possible cases. One, the interpretability score is higher than the integrity score and a feature selection is done. This process consists in keeping just enough features to reach the data resolution parameter. The others are dropped and lost. Two, the integrity score is higher than the interpretability score. In this case, a feature extraction must be done. This process is more complex than the simple feature selection. This process is explained in Section 2.6.
The results of this decision are displayed to the user to justify the algorithm choice. These values are 1. Normalized synthesis of features after the FRSD process. 2. Normalized synthesis of features after the PCA process. 3. Best SI for feature selection. 4. Best SI for feature extraction. 5. Interpretability score. 6. Integrity score. 7. Chosen method (selection of extraction). 8. Number of selected features to obtain the target resolution (if feature selection is used). 9. Number of principal components to obtain the target resolution (if feature extraction is used). 10. Best number of clusters (k).
2.6. Dimensionality Reduction Using PCA
A PCA algorithm aims to reduce the dimensionality of the dataset by extracting some features. It creates a new dataset having equal or less dimensionality than the original. The newly created features are named “principal components” (PCs). The first principal component (PC1) has the highest possible variance compared to the other principal components. The second principal component (PC2) has the second-highest possible variance, and so on. A PCA algorithm uses the concept of Eigen Vector and Eigen Value. It compares every possible combination of two features. For every pair of features, it calculates the direction of the data distribution (the Eigen Vector) and the magnitude of this vector (the Eigen Value). A projection of the data is made using the axis of the strongest Eigen Value. At the end of this process, a descending ordered list of features is produced, based on the Eigen Value criterion. The PCA algorithm extracts the most n significant components, where n is a received parameter.
2.7. Clustering with k-Means
The goal of this process is to create clusters after having reduced the dimensionality, based on the data and specified parameters. After having reduced the dimensionality using a feature selection or a feature extraction, a clustering algorithm must be used. To create the clusters from the data, it is necessary to use an unsupervised learning technique as there is no label for each input data. This algorithm will assign to each ward a reference cluster, according to the similarity level of their features.
Equation (9) defined the k-means clustering equation where J is a clustering function, k is the number of clusters, n is the number of features, is the input (feature i in cluster j) and is the centroid for cluster j. Centroids are obtained by randomly trying values and selecting the best according to the returned inertia value. This inertia value is the basic non-normalized metric used to evaluate cluster consistency.
The evaluation of the clusters’ consistencies using SI are defined earlier in Section 2.3.
As shown in Figure 2, there are two processes (Normalize and Graphics) added after the clustering. Both are required for visualizing the clustering process. A good way to visually represent the consistency of the clusters is by stacking the radar graphics representing their features. A MinMax algorithm (4) must precede this type of graphic. Using this type of graphic, the different profiles of the clusters are notable. This representation will be useful in Section 3.4.
3. Results
3.1. City of London
The City of London is the capital of England and the United Kingdom. The largest city in the country, it is located on the River Thames and has existed since the Roman era. In the London metropolitan area, there were 14,040,163 inhabitants in 2016. The United Kingdom territory is divided into wards and electoral divisions. The ward is the primary unit of English electoral geography for civil parishes as well as borough and district councils. Each ward/division has an average electorate of about 5500 people, but ward-population counts can vary substantially. At the end of 2014, there were 9,456 electoral wards/divisions in the United Kingdom [29].
Figure 3 displays a map of the wards in the Greater London area.
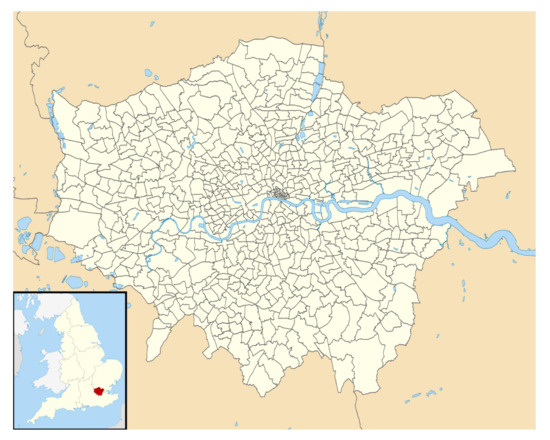
Figure 3.
Map of the ward divisions of the Greater London area [30].
Section 3.2, Section 3.3 and Section 3.4 present the results of the methodology presented in Section 2 applied to the wards of the Greater London area.
3.2. Feature Importance According to FRSD
No matter what the parameters are, this part is used to calculate the importance of the features for selection regarding the consistency of the clustering. The results of this part is useful in the dimensionality reduction process to decide between feature selection and feature extraction. As defined in the methodology, an unsupervised approach is different from a supervised approach in the evaluation of the importance of the features. To find it on unlabeled data, we must find a way to generate labels. One state-of-the-art way is to use an FRSD algorithm. The SI metric is generated for each of the data, so it becomes possible to evaluate the features in a supervised learning way.
Table 3 shows a list of all the features ordered by their importance according to the FRSD evaluation.

Table 3.
Feature importance according to FRSD.
3.3. Feature Importance According to PCA
This part is independent of the parameters and calculates feature importance in a feature extraction process. This is important to choose between a feature selection and a feature extraction. The PCA algorithm, as documented in the methodology, has been applied to the eight features in the London dataset.
Table 4 shows a list of all the features ordered by importance according to the PCA evaluation.

Table 4.
Feature importance according to the PCA algorithm.
3.4. Scenarios Using Different Parameters
This section describes five scenarios or test cases using different parameters values to test the novel method. The common parameters for all scenarios are k-min = 3 and k-max = 10. It is the same for all the cases since it is useful to specify the number of possible clusters, but useless in the decision made by the algorithm. The following scenarios show how the parameters affect the decision made by the algorithm.
Case 1: Interpretability oriented and high resolution of data
For this first scenario, let’s assume that it is more important to keep the feature names (interpretability) than it is to optimize feature integrity. Also, let’s assume that a good feature resolution is needed. For values, interpretability-oriented = 0.9, integrity-oriented = 0.1 and target-resolution = 85%. Table 5 shows the results using this configuration.

Table 5.
Algorithm results using interpretability-oriented = 0.9, integrity-oriented = 0.1 and target-resolution = 85%.
In this table, we can see that the value of the best feature selection (FS) silhouette index (0.3905) is greater than the value of the best feature extraction (FE) silhouette index (0.3530). Note that the consistency of the clustering process has nothing to do with the resolution of data. Often, better consistency comes with less dimensionality. It can be very hard to have a good consistency with a high number of features. That is why when using this method, orienting a process toward integrity (by using feature extraction instead of feature selection) does not result in a better consistency while clustering. Often, lowering the resolution results in an SI shows a better consistency.
In this scenario, the parameter interpretability-oriented (0.9) has a higher value than the integrity-oriented value (0.1). When (7) and (8) are applied, the interpretability score (0.3514) is higher than the integrity score (0.0353). To reach 85% of the resolution, we must use the best seven features. These features have a resolution of 88.3%. Doing the clustering process, the optimal number of clusters is three. Figure 4 shows the distribution of each element according to its silhouette index.
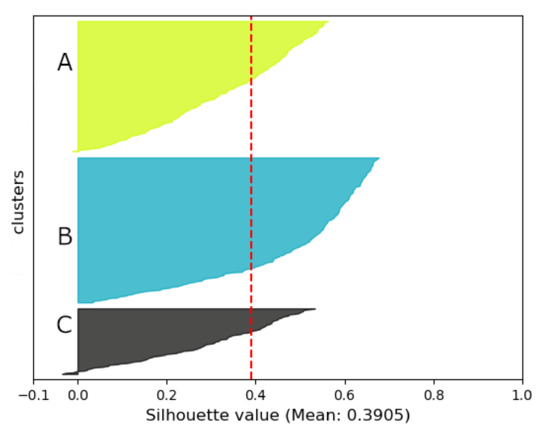
Figure 4.
Silhouette graphic for case 1 showing the consistency for clusters A, B, and C.
This figure shows the three different clusters, in three different colors. The larger the horizontal bar, the more data the cluster contains. The longer the bar, the more consistent the data is according to its cluster. This graphic shows very few misplaced values (negative values). It also shows an average of 0.3905 (red dotted line).
Figure 5 shows the representation of cluster A using a stacked radar graphic. It is easy to visualize the consistency of the normalized value. It shows that the feature names have been kept. It is the most important criterion (interpretability) for this case since the parameter interpretability-oriented is equal to 0.9.
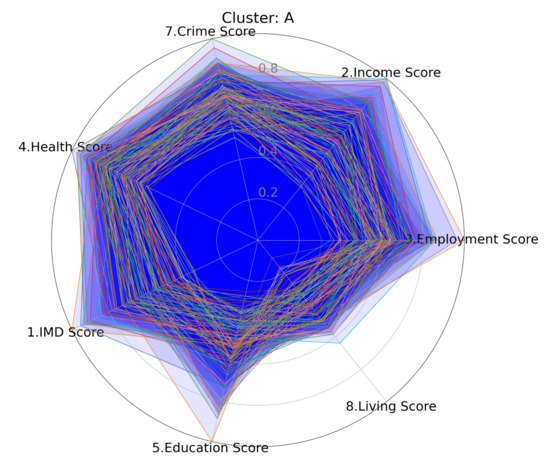
Figure 5.
Stacked radar graphics showing cluster A of normalized values for case 1.
Case 2: Integrity-oriented and high resolution of data
In this second scenario, integrity is more important than keeping the signification of the features (interpretability). A good feature resolution is also needed. For values, interpretability-oriented = 0.1, integrity-oriented = 0.9 and target-resolution = 85%. Table 6 shows the results for this configuration.

Table 6.
Algorithm results using interpretability-oriented = 0.1, integrity-oriented = 0.9 and target-resolution = 85%.
We can observe that the value of the best FE silhouette index (0.3530) is lower than the value of the best FS silhouette index (0.3905). Having an integrity parameter with a high value (0.9), the integrity score (0.3177) is higher than the interpretability score (0.0390). The feature extraction strategy is selected. Seven PCs are required to reach 85% of resolution. The optimal number of clusters is three. Figure 6 shows the distribution of the SI for this case.
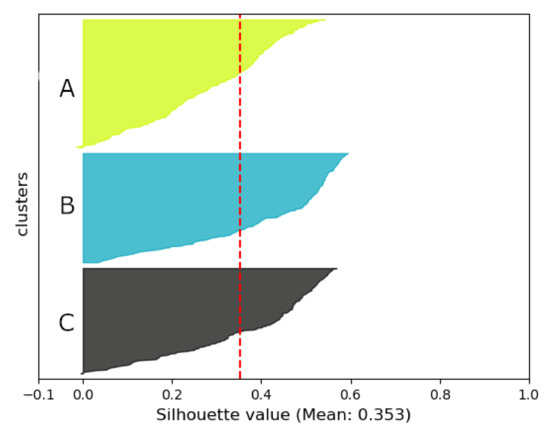
Figure 6.
Silhouette graphic for case 2 showing the consistency for clusters A, B, and C.
This figure displays the three clusters. There are a few misplaced values (between −1 and 0). The average of the SI is 0.353. Even if the consistency of the clustering is lower, the integrity of the data is better since every feature has been used to downsize to the seven PCs. The loss is kept at a minimum. Remember that the SI often becomes lower when reducing dimensionality. For instance, having only two PCs or features tends to provide the best SI results.
Table 7 shows cluster A using a stacked radar graphic.

Table 7.
Algorithm results using interpretability-oriented = 0.5, integrity-oriented = 0.5 and target-resolution = 85%.
Keep in mind that when a feature extraction is made, all the feature’s labels are lost. In this particular case, for instance, it becomes impossible to refer to feature 5 “Education Score”, since this value, like all the others, has been extracted to generate the new features called “principal components” (PCs). Original features can no longer be addressed. This may be an important drawback, depending on what has to be done next. For instance, if a clustering process is made (like in Figure 7), the clustering graphs would be represented having “PC1”, “PC2”, “PC3”, and so on, on its axis. Having fewer dimensions is an advantage; losing the identity of the features is a disadvantage and the opposite of “interpretability".
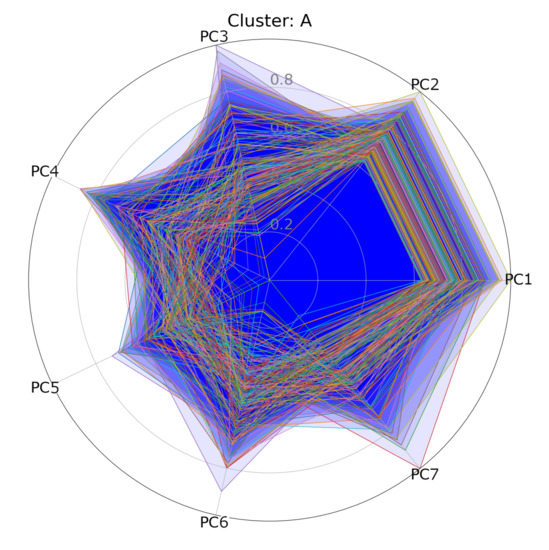
Figure 7.
Stacked radar graphics showing cluster A of normalized values for case 2.
Case 3: Equally integrity and interpretability oriented and high resolution of data
For this third scenario, we assume that it is equally important to keep feature signification in addition to optimizing the integrity of the features. We also assume that a good feature resolution is also needed. For values, interpretability-oriented is 0.5, integrity-oriented is 0.5 and target-resolution is 85%. Table 7 shows the results for this configuration.
The best FS silhouette index (0.3905) is greater than the value of the best FE silhouette index (0.3530). After applying the Equations (7) and (8) using the interpretability-oriented and integrity-oriented parameters, the interpretability score (0.1952) is higher than the integrity score (0.1765), so the selection process is used.
If interpretability and integrity are equally important, the nature of the data will determine which process is the best at generating a good SI (good clustering consistency). This plays a role in Equations (7) and (8).
To reach 85% of the resolution, we must use seven features, having a resolution of 88.3%. In the clustering process, the optimal number of clusters is three. The SI figure and the stacked radar graphic are the same as in scenario 1 (Figure 5 and Figure 7).
Case 4: Interpretability-oriented and low resolution of data
This case is oriented toward interpretability. Compared to case 1, the resolution value has been lowered. For values, interpretability-oriented = 0.9, integrity-oriented = 0.1 and target-resolution = 50%. The results are shown in Table 8.

Table 8.
Algorithm results using interpretability-oriented = 0.9, integrity-oriented = 0.1 and target-resolution = 50%.
The value of the best FS silhouette index (0.4393) is greater than the value of the best FE silhouette index (0.3775). Same as in case 1, the chosen method is feature selection because the parameter interpretability-oriented (0.9) has a higher value than the integrity-oriented value (0.1) and the interpretability score (0.3953) is higher than the integrity score (0.0377). To reach 50% of the resolution, we must use the best four features. Those features have a resolution of 52.3%. Doing the clustering process, the optimal number of clusters is three. Figure 8 shows the distribution of each element according to its silhouette index.
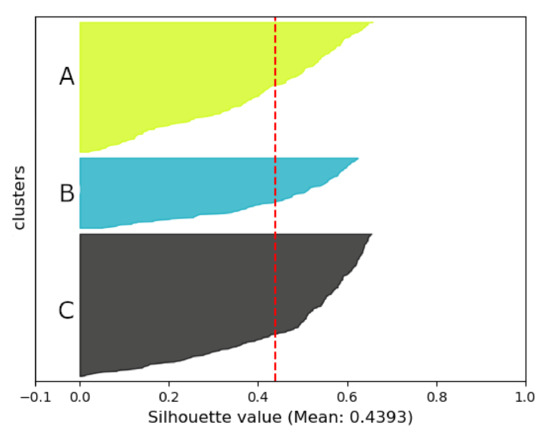
Figure 8.
Silhouette graphic for case 4 showing the consistency for clusters A, B, and C.
This figure shows the three different clusters. The graphic shows no misplaced values (negative values) and also shows an average of 0.4393 (red dotted line).
Figure 9 shows the representation of the clustering using a stacked radar graphic.
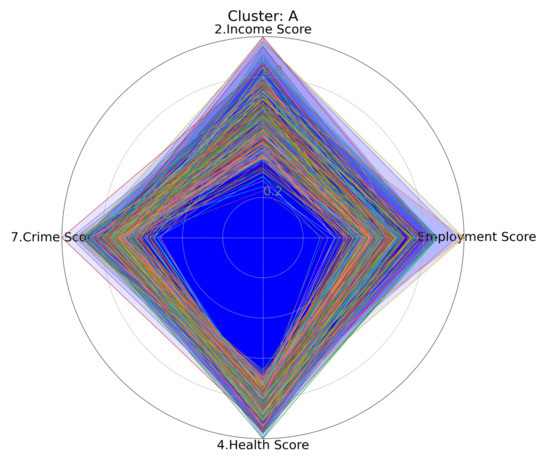
Figure 9.
Stacked radar graphics showing cluster A of normalized values for case 3.
The feature names have been kept as this scenario is oriented toward interpretability. Compared to case 1, which has a good resolution of data (seven features), this graphic shows only four features since the resolution value has been lowered to 50%. At a glance, we can see that there is a good consistency. It has an even better consistency than in case 1 (SI = 0.4392 for case 4 and SI = 0.3905 for case 1). Recall that a better consistency is often linked to fewer dimensions in the data.
Case 5: Integrity oriented and low resolution of data
For this last scenario, integrity is more important than keeping feature signification, but a lower feature resolution than in case 2 is defined. For values, interpretability-oriented = 0.1, integrity-oriented = 0.9 and target-resolution = 50%. Table 9 shows the results using this configuration.

Table 9.
Algorithm results using interpretability-oriented = 0.1, integrity-oriented = 0.9 and target-resolution = 50%.
The best FS silhouette index (0.4393) is greater than the value of the best FE silhouette index (0.3775). The interpretability score is low (0.0439) and the integrity score (0.3397) is high. A feature extraction process is selected. Four PCs are required to reach 50% of the resolution. The optimal number of clusters is three. Figure 10 shows the distribution of the SI for this case.
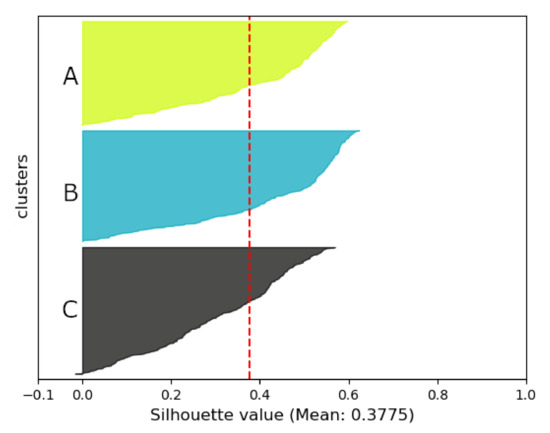
Figure 10.
Silhouette graphic for case 5 showing the consistency for clusters A, B, and C.
This figure shows three clusters and one misplaced value (located between −1 and 0). The average of the SI is 0.3775, which shows a significantly better SI than in case 2 (0.353), which has more dimensions.
Figure 11 presents a stacked radar graphic of cluster A.
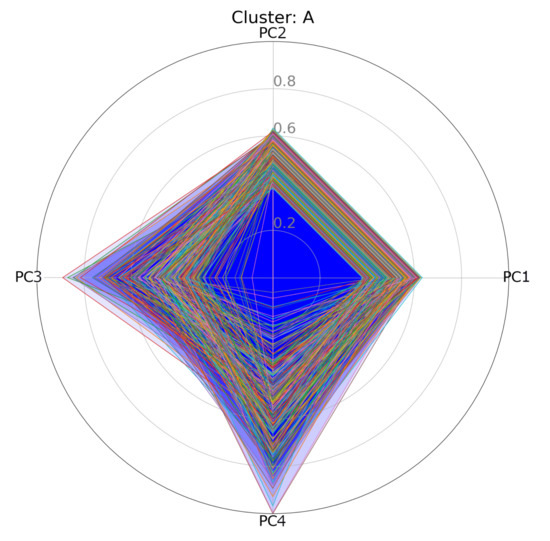
Figure 11.
Stacked radar graphics showing cluster A of normalized values for case 5.
The consistency is quite good. Although, like all the clusters whose features were kept during the feature extraction process, the feature names are lost and replaced by PCs, resulting in reduced interpretability.
3.5. Method Validation
The last part of the analysis is the validation of the method. This paper presents a novel approach with no other comparable published methods. It has no pretension of improving PCA or FRSD. It uses these algorithms but has different inputs and outputs as well as having distinct parameters. The improvement of the proposed approach is that it makes correct decisions about the reduction of dimensionality method and the number of features/PCs to keep. This novel method is a whole decision process that includes the evaluation of feature importance, a decision process based on parameters and data profiles, clustering, and the presentation of clusters. There is no known or documented method that can be used to compare the present method.
That being said, it is crucial to validate the algorithm. To ensure that the algorithm makes the correct decisions, 250 realistic random cases have been generated. Each of the random cases includes a random SI index (after a hypothetical feature selection), a random SI index (after a hypothetical feature extraction), and a random interpretability importance parameter. An integrity importance parameter has also been computed using 1-(the interpretability importance) parameter. Using this data, the decision algorithm is applied. For each case, an interpretability score and an integrity score have been calculated. A decision is then taken between feature selection or feature extraction. Figure 12 shows the classification of the points according to the interpretability scores and the integrity scores. The red points use a feature extraction process and the blue points use a feature selection process. The black line divides the interpretability (feature selection) and the integrity (feature extraction) domains.
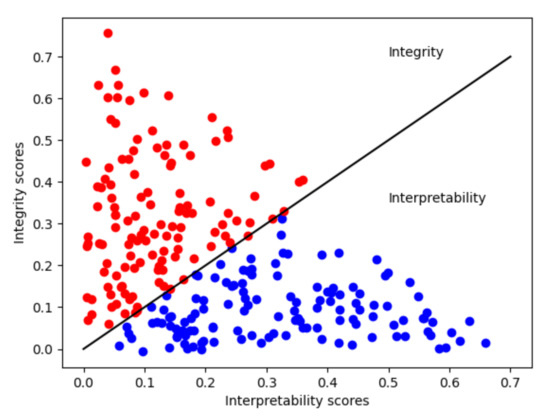
Figure 12.
Decision distribution classified into two groups: interpretability and integrity.
The points cannot have a high value on both axes because interpretability importance parameters are the inverse of the integrity importance parameters (alpha and 1 − alpha). These are used in (7) and (8), which are the axis. If one value is very high, the other must be very low. Both can have an average value. This graphic shows that the algorithm always makes a good decision, even when a human may have difficulty choosing. Since the algorithm uses a threshold, the classification is always correct. Hence, 250 points is sufficient to show the distribution of the results. This graphic is simple, but it validates the results of the complex previous parts of the process that uses FRSD and PCA.
Figure 13 shows the bar pairs of the number of features (blue) and the principal components (red), according to the target resolution of data (as specified in the parameters). As in the previously described scenario test cases, the London dataset has been used.
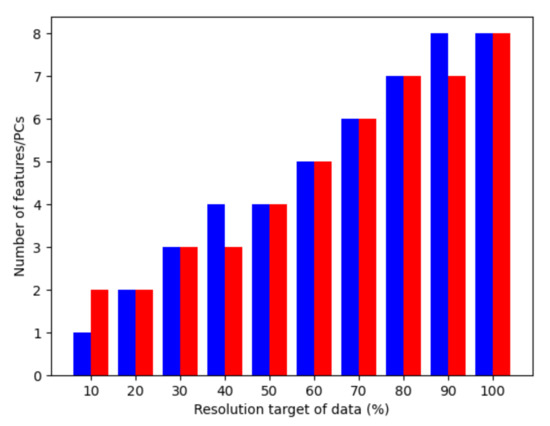
Figure 13.
Number of features/PCs according to the target resolution of data.
As expected, we can see that a perfect resolution of 100% requires all of the eight available features. This number slowly declines when subtracting each step of 10%. To validate the integrity advantage of the feature extraction over the feature selection, we subtract their respective resolutions. It can be compared only when they have the same number of features and principal components. Figure 14 displays the difference percentage for all the target resolutions having the same amount of features/PCs. For instance, reading the Figure 13 we can see that resolutions of 20%, 30%, 50%, 60%, 70%, 80% and 100% have the same number of features/PCs. This is where the values of Figure 14 are defined. Blue bars represent the resolution percentage differences between feature extraction and feature selection.
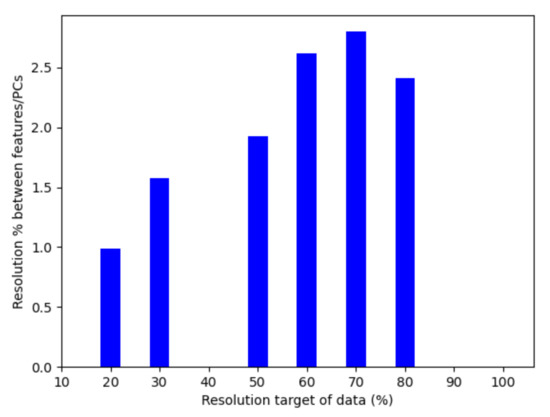
Figure 14.
Differences of resolution in percentage between feature extraction and feature selection.
We can see that there is a resolution advantage when using feature extraction. This validates the integrity-oriented parameter.
As for the interpretability-oriented parameter, the best way to validate it is simply to compare graphs after a feature selection and a feature extraction. For instance, let’s compare Figure 5 to Figure 7. It is easier to interpret real features names as in Figure 5 than it is to interpret abstract principal components (PC1, PC2...) (as in Figure 7). This validates the interpretability-oriented parameter.
4. Discussion
Deciding when to reduce dimensionality has always been a critical decision. Using the right technique to reduce the dimensionality of a set of features is also important, especially in an unsupervised learning context where data labels are not available. The main contribution of this paper is to define a novel, complete method that makes the right decision of dimensionality reduction according to the data scientist’s preferences and then completes the process by clustering the data.
Two different algorithms have been used to evaluate feature importance: FRSD and PCA. The first evaluates feature importance for use in feature selection and the second is used for feature extraction. In Table 3 and Table 4, it is notable that both methods provide similar results in terms of feature importance. The principal difference is the loss of feature names when using PCA.
The decision process uses two equations, (7) and (8). Both are based on the data scientist’s preferences regarding interpretability and integrity. The decision equations are also based on the best SI (a metric of cluster consistency) and the previously calculated feature’s importance. Comparing the best SI for feature selection and feature extraction in Table 5, we note that feature extraction does not mean a better consistency of clustering. Reading Table 7, where the values of the parameters (oriented-interpretability and oriented-integrity) are equal, we can see that using a method that keeps better integrity of data (like PCA) does not guarantee a better consistency of clustering. Better consistency of clustering is shown in cases 4 and 5 (due to the lower data resolution). Both feature selection and feature extraction allow a better cluster consistency when the dimension is reduced. A higher resolution of data (more features) implies that it is harder to maintain a good cluster consistency.
PCA is a useful tool to extract features and reduce dataset dimensionality. Consequentially, it helps to speed up the learning process and to simplify the presentation of the features. Before extracting some features, it is very important to evaluate the impact of such an operation. In some cases, features can be extracted without losing significant precision in the data. In other cases, significant resolution of the data will be lost. Feature extraction has the disadvantage of losing feature names. Consequently, a clustering process after a feature extraction can provide good results, but it becomes less significant when represented on figures as in Figure 7, since the feature names are lost. Having axis named PC1, PC2, PC3... PCn makes it harder to interpret.
Using a feature selection enables the keeping of the feature names, as shown in Figure 5, but at the price of losing some information. The trade-off must be carefully evaluated (and is precisely evaluated using this proposed method).
The final result is clustering. For each case from 1 to 5, two types of graphics are presented to represent the clustering process. One, the SI figures (Figure 4, Figure 6, Figure 8, and Figure 10) show the distribution of the data in each cluster. It shows the SI average, the number of clusters, the number of elements in each cluster, and the consistency of each cluster. Two, the stacked radar graphics (Figure 5, Figure 7, Figure 9, and Figure 11) display the normalized values of each feature or PC. Reading these graphics, it is possible to determine cluster consistency at a glance. Only one cluster per scenario is displayed (cluster A), as an example.
The validation of the method is shown in Figure 12, Figure 13 and Figure 14. Figure 12 shows that the algorithm makes the correct decision of feature selection or feature extraction using a set of 250 generated data and parameters. Figure 13 shows a good link between the target resolution parameters and the number of selected features and PCs. Finally, Figure 14 shows the advantage of using feature extraction, in terms of the integrity of data.
This research is a complement to the recent FRSD method presented in [16]. This methodology proposes a method to evaluate features in an unsupervised learning clustering context. Based on this work, we can compare the added value of the present paper. This paper takes this method and brings to it a more global and integrated context where FRSD and PCA are used to evaluate the importance of the features. From this evaluation along with interpretability and integrity parameters, a score is calculated and used to decide if feature selection or feature extraction is the best. In most cases, the utility of calculating the importance of the features with FRSD is to reduce dimensionality and to apply a clustering process. The reason is that FRSD aims to determine the importance of the feature relative to the consistency of the clustering process (the SI). FRSD and a clustering algorithm like K-means are linked. This method adds FRSD to the entire process, from the evaluation of features to the final clustering and the representation of the data (SI and stacked radar graphs).
5. Conclusions
The contribution of this paper is a novel method called Decision Process for Dimensionality Reduction before Clustering (DPDRC). It does the following: One, evaluates the importance of each feature regarding the consistency of the clustering process. Two, selects the correct technique of dimensionality reduction. Three, applies the selected technique and proceeds to the clustering and its representations. The decision of the correct dimensionality reduction technique is made according to user preferences (interpretability, integrity, and needed resolution of the data) and according to the profile of the data. It uses PCA and FRSD algorithms to evaluate the importance of the features, and to reduce dimensionality according to the parameters and data profile.
This method has the advantage of being the first decision algorithm to solve the decision problem of dimensionality reduction according to the preference of the user. For this reason, this method cannot be directly compared with other methods. This method also presents some limitations. For instance, there may be issues to solve regarding exponential feature combinations using FRSD. Indeed, to evaluate the importance of each feature, the FRSD algorithm needs to combine every possible combination of features, to apply clustering, and to evaluate its corresponding consistency with an SI metric. This process will typically be exponential. Past a certain amount of features, the processing time will become too long.
Future work will focus on using more datasets from different sizes to test the scalability of the propose method. The algorithm needs to be tested in terms of time consumed, especially with large datasets. Different presentations of the data and decision process can also be developed and some specific applications and use cases can be tested as well.
Finally, a similar method could be developed to automate the choice of dimensionality reduction in a supervised learning context. A Random Forest algorithm would replace the FRSD algorithm since the label of the data is already known in a supervised learning context and there would be no need to apply clustering afterward. Another classic supervised learning method like a classification or a non-linear regression could be applied to validate the method.
Author Contributions
Conceptualization, J.-S.D.; methodology, J.-S.D. and D.M.; software, J.-S.D.; validation, J.-S.D. and D.M.; formal analysis, J.-S.D.; investigation, J.-S.D.; resources, J.-S.D.; writing—original draft preparation, J.-S.D.; writing—review and editing, J.-S.D. and D.M.; supervision, D.M.; project administration, D.M.; funding acquisition, D.M. All authors have read and agreed to the published version of the manuscript.
Funding
This research was funded by Natural Sciences and Engineering Research Council of Canada (NSERC).
Institutional Review Board Statement
Not applicable.
Informed Consent Statement
Not applicable.
Data Availability Statement
Publicly available datasets were analyzed in this study. This data can be found here: https://data.london.gov.uk/dataset/indices-of-deprivation (accessed on 10 March 2021).
Acknowledgments
This work has been supported by the “Cellule d’expertise en robotique et intelligence artificielle” of the Cégep de Trois-Rivières.
Conflicts of Interest
The authors declare no conflict of interest.
References
- Bellman, R.; Bellman, R.; Corporation, R. Dynamic Programming; Rand Corporation Research Study; Princeton University Press: Princeton, NJ, USA, 1957. [Google Scholar]
- Verleysen, M.; François, D. The Curse of Dimensionality in Data Mining and Time Series Prediction. In International Work-Conference on Artificial Neural Networks; Springer: Berlin/Heidelberg, Germany, 2005; Volume 3512, pp. 758–770. [Google Scholar] [CrossRef]
- Khalid, S.; Khalil, T.; Nasreen, S. A survey of feature selection and feature extraction techniques in machine learning. In Proceedings of the 2014 Science and Information Conference, London, UK, 27–29 August 2014; pp. 372–378. [Google Scholar] [CrossRef]
- Keshava, N.; Mustard, J. Spectral unmixing|IEEE Journals & Magazine|IEEE Xplore. Available online: https://ieeexplore.ieee.org/xpl/RecentIssue.jsp?punumber=79 (accessed on 10 March 2021).
- Cantuarias-Villessuzanne, C.; Weigel, R.; Blain, J. Clustering of European Smart Cities to Understand the Cities’ Sustainability Strategies. Sustainability 2021, 13, 513. [Google Scholar] [CrossRef]
- Wong, C. Developing Indicators to Inform Local Economic Development in England. Urban Stud. 2002, 39, 1833–1863. [Google Scholar] [CrossRef]
- Chen, C.p.; Ding, Y.j.; Liu, S.y. City Economical Function and Industrial Development: Case Study along the Railway Line in North Xinjiang in China. J. Urban Plan. Dev. 2008, 134, 153–158. [Google Scholar] [CrossRef]
- Ang, L.M.; Seng, K.P.; Zungeru, A.M.; Ijemaru, G.K. Big Sensor Data Systems for Smart Cities. IEEE Internet Things J. 2017, 4, 1259–1271. [Google Scholar] [CrossRef]
- Marsal-Llacuna, M.L.; Colomer-Llinàs, J.; Meléndez-Frigola, J. Lessons in urban monitoring taken from sustainable and livable cities to better address the Smart Cities initiative. Technol. Forecast. Soc. Chang. 2015, 90, 611–622. [Google Scholar] [CrossRef]
- Solorio-Fernández, S.; Carrasco-Ochoa, J.A.; Martínez-Trinidad, J.F. A review of unsupervised feature selection methods. Artif. Intell. Rev. 2020, 53, 907–948. [Google Scholar] [CrossRef]
- Kumar, V.; Minz, S. Feature Selection: A literature Review. SmartCR 2014, 4, 211–229. [Google Scholar] [CrossRef]
- Cai, J.; Luo, J.; Wang, S.; Yang, S. Feature selection in machine learning: A new perspective. Neurocomputing 2018, 300, 70–79. [Google Scholar] [CrossRef]
- Li, F.; Zhang, Z.; Jin, C. Feature selection with partition differentiation entropy for large-scale data sets. Inf. Sci. 2016, 329, 690–700. [Google Scholar] [CrossRef]
- Cai, D.; Zhang, C.; He, X. Unsupervised feature selection for multi-cluster data. In Proceedings of the 16th ACM SIGKDD International Conference on Knowledge Discovery and Data Mining, Washington, DC, USA, 24–28 July 2010; pp. 333–342. [Google Scholar] [CrossRef] [Green Version]
- De Amorim, R.C. A Survey on Feature Weighting Based K-Means Algorithms. J. Classif. 2016, 33, 210–242. [Google Scholar] [CrossRef] [Green Version]
- Yu, J.; Zhong, H.; Kim, S.B. An Ensemble Feature Ranking Algorithm for Clustering Analysis. J. Classif. 2019, 37, 462–489. [Google Scholar] [CrossRef]
- Ameer, S.; Shah, M.A. Exploiting Big Data Analytics for Smart Urban Planning. In Proceedings of the 2018 12th International Conference on Signal Processing and Communication Systems (ICSPCS), Cairns, QLD, Australia, 17–19 December 2018; pp. 1–5. Available online: https://ieeexplore.ieee.org/document/8691036 (accessed on 10 March 2021). [CrossRef]
- Abed, J.; Kaysi, I. Identifying urban boundaries: Application of remote sensing and geographic information system technologies. J. Civ. Eng. 2003, 30, 992–999. [Google Scholar] [CrossRef]
- Grekousis, G.; Manetos, P.; Photis, Y.N. Modeling urban evolution using neural networks, fuzzy logic and GIS: The case of the Athens metropolitan area. Cities 2013, 30, 193–203. [Google Scholar] [CrossRef]
- Desgraupes, B. Clustering indices. Univ. Paris Ouest-Lab Modal’X 2013, 1, 34. [Google Scholar]
- Kaufman, L.; Rousseeuw, P. Finding Groups in Data: An Introduction to Cluster Analysis; John Wiley & Sons: Hoboken, NJ, USA, 2009. [Google Scholar]
- Rousseeuw, P.J. Silhouettes: A graphical aid to the interpretation and validation of cluster analysis. J. Comput. Appl. Math. 1987, 20, 53–65. [Google Scholar] [CrossRef] [Green Version]
- Covões, T.F.; Hruschka, E.R. Towards improving cluster-based feature selection with a simplified silhouette filter. Inf. Sci. 2011, 181, 3766–3782. [Google Scholar] [CrossRef]
- Kitchin, R. The real-time city? Big data and smart urbanism. GeoJournal 2014, 79, 1–14. [Google Scholar] [CrossRef] [Green Version]
- Tayyebi, A.; Pijanowski, B.C.; Tayyebi, A.H. An urban growth boundary model using neural networks, GIS and radial parameterization: An application to Tehran, Iran. Landsc. Urban Plan. 2011, 100, 35–44. [Google Scholar] [CrossRef]
- Dessureault, J.S.; Simard, J.; Massicotte, D. Unsupervised Machine learning methods for city vitality index. arXiv 2020, arXiv:2012.12082. [Google Scholar]
- Leeser, R. English Indices of Deprivation 2015. P. 53. Available online: https://data.london.gov.uk/dataset/indices-of-deprivation (accessed on 10 March 2021).
- Gueorguieva, N.; Valova, I.; Georgiev, G. M&MFCM: Fuzzy C-means Clustering with Mahalanobis and Minkowski Distance Metrics. Procedia Comput. Sci. 2017, 114, 224–233. [Google Scholar] [CrossRef]
- Council, T.D. Ward. Available online: https://data.gov.uk/dataset/b1a57d4f-d678-4444-ad3b-03e8e7577cbf/ward (accessed on 10 March 2021).
- Greater London UK Ward Map, Wikipedia. Available online: https://en.wikipedia.org/wiki/ (accessed on 10 March 2021).
Publisher’s Note: MDPI stays neutral with regard to jurisdictional claims in published maps and institutional affiliations. |
© 2021 by the authors. Licensee MDPI, Basel, Switzerland. This article is an open access article distributed under the terms and conditions of the Creative Commons Attribution (CC BY) license (https://creativecommons.org/licenses/by/4.0/).