
Abstract
Over the past three decades, five satellites have succeeded one another on the reference orbit, building the longest continuous climate record of global sea level measurements. Its continuity is ensured thanks to tandem flights between consecutive satellites. In this paper, we demonstrate that the first satellite of the Sentinel-6 series (Sentinel-6 Michael Freilich) has enabled the detection of a processing anomaly in the Jason-1/2/3 ground segment. An inconsistency in the altimeter range reconstruction has been identified, causing its underestimation by 3.65 mm. At certain latitudes, determined by the satellite’s orbital velocity, the altimeter range shows no effect from the anomaly. For the reference orbit, the range is not affected at the poles, around the equator and, for ascending tracks, at 40° S. All Jason Geophysical Data Record (GDR) versions prior to GDR-G are impacted by the described processing anomaly. While a full reprocessing of the Jason data with the GDR-G standard is pending, this paper presents a latitudinal empirical correction to be applied to Jason datasets generated with GDR-F and earlier ground segments. This correction, to be applied on the altimeter range, is derived from one month of patched Jason-3 data and is intended for reference orbit only. Additionally, SWOT Nadir ground processing is also affected by the same processing error and has been corrected from the GDR-S2 version onward. Finally, our analysis shows a negligible impact of this processing anomaly on Jason Level-2-derived products, models and metrics.
1. Introduction
Since 1992, the longest climate record of global sea level measurements has been built thanks to a series of five satellites. From TOPEX/Poseidon, launched in August 1992, it has been extended for three decades by the Jason series: Jason-1 launched in December 2001, Jason-2 launched in June 2008, and Jason-3 launched in January 2016. On 7 April 2022, the Copernicus Sentinel-6 Michael Freilich (MF) satellite took over from Jason-3 as the reference for the sea level climate record [1,2].
A seamless continuity between two consecutive satellites is crucial for maintaining the high accuracy of the sea level record. The derived Global Mean Sea Level (GMSL) relies on rigorous and precise inter-calibration of successive missions [3,4]. Even a systematic bias of only a few millimeters between two sea level time series must be accounted for in the GMSL uncertainty budget, thereby increasing uncertainties in both trend and acceleration estimates. This continuity between missions is ensured thanks to tandem flights conducted at the beginning of each new mission [5]. During these periods, satellites follow the same orbit track with only a small delay in time, ranging from 80 s between Jason-3 and Jason-2 to only 30 s between Sentinel-6MF and Jason-3. Such formation flight enables direct comparison of datasets from consecutive missions. By interpolating observations onto a common theoretical ground track, as described in [6], collocated datasets are obtained, enabling the calculation of direct differences between mission retrievals. Systematic analysis of these inter-mission biases, as performed in [7] for Jason-2/Jason-1 tandem flight, enables the characterization and correction of potential artifacts.
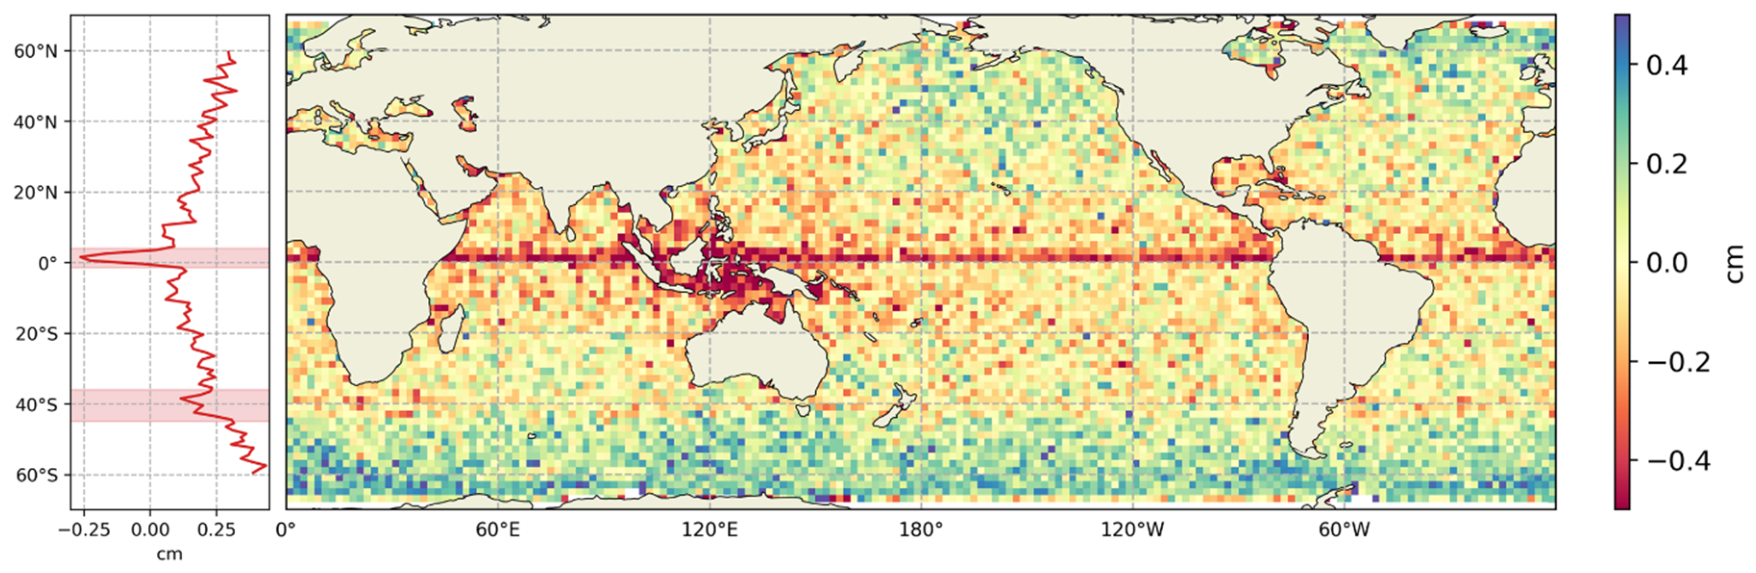
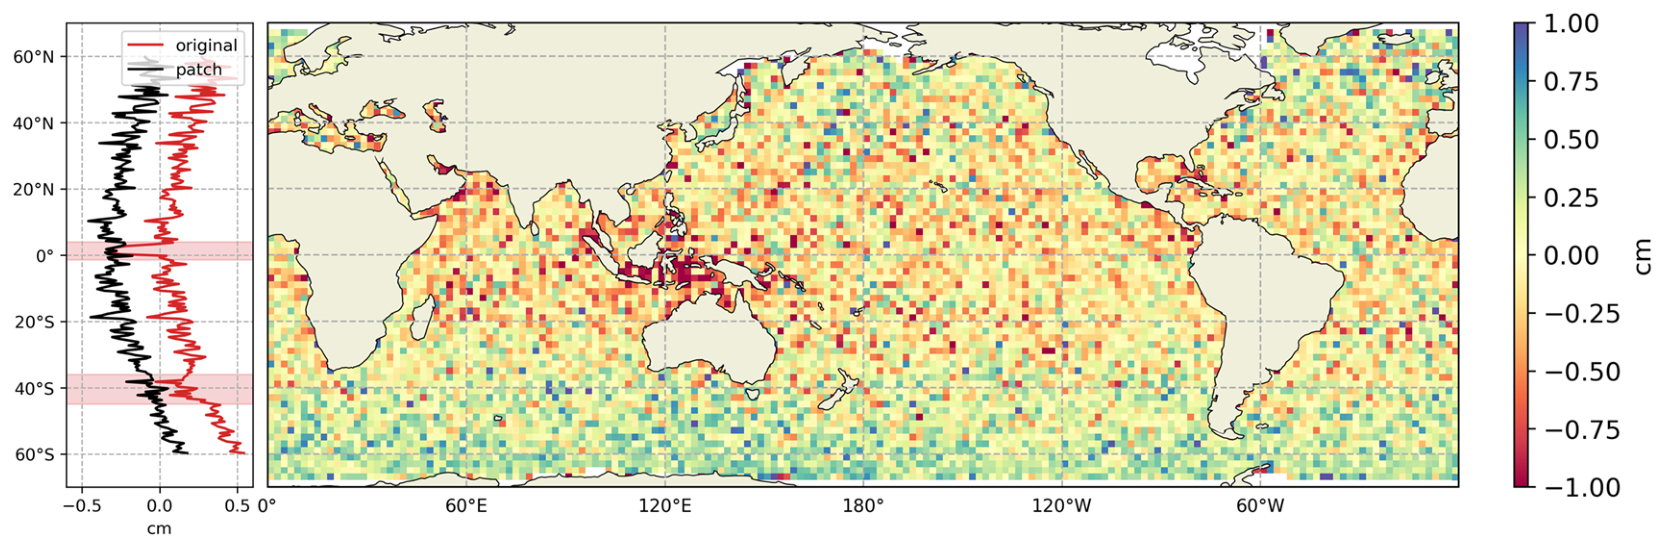
Using this method, each Sentinel-6MF Level-2 parameter has been assessed against those of Jason-3’s during their tandem flight [8], from the primary retracker outputs (range, significant wave height, backscatter coefficient and mispointing) to the derived Sea Surface Height Anomaly (SSHA). To limit interpolation errors associated with its high variability, range comparison is performed using the SSHA without geophysical correction, i.e., on orbit minus range minus mean sea surface. Geophysical corrections are not applied to the SSHA to avoid potential inconsistencies between missions (for example different model versions). The resulting collocated difference for the Ku-band range, shown in Figure 1, exhibits unexpected behavior: two latitudinal bands are observed. The first one is located around the equator, between 1° S and 3.5° N. Over this band, the difference between Sentinel-6MF and Jason-3 ranges decreases by 4 mm. Located near 40° S, the second latitudinal band also exhibits a 4 mm amplitude, consistent with that of the first band. Its impact is limited to ascending tracks, with a non-systematic distribution. As a result, this second band seems to have a lower amplitude when averaging all data in Figure 1.
Figure 1.
Sentinel-6MF LR NR minus Jason-3 MLE4 difference in the Sea Surface Height Anomaly without geophysical corrections (i.e., orbit minus range minus MSS), computed over Jason-3/Sentinel-6MF tandem flight. Gridded mean map (right) and the corresponding latitudinal average (left). The map has been centered to zero by removing the mean value (0.2 cm).
These two latitudinal bands raise questions because they do not resemble typical geophysical effects commonly observed, as reported in [9] in coastal areas. The objective of this paper is to investigate and present the origin of these two latitudinal bands (Section 2). An empirical correction aiming to correct this effect pending the actual correction is presented in Section 3. Finally, Section 4 discusses the impacts of such signatures on altimeter data and derived metrics.
2. The Origin of the Latitudinal Bands
This section outlines the origin of these two latitudinal bands from the responsible satellite to the underlying cause.
2.1. The Jason Series
Sentinel-6MF data used in Figure 1 are derived from the Low-Resolution mode products (see Appendix A). Identical signatures are observed with High-Resolution mode products [10] and with the CNES/CLS Sentinel-6 Processing Prototype products (Low and High Resolutions) [11]. The two latitudinal bands are also consistent regardless of the retracker: internal tests have shown similar patterns with the Maximum Likelihood Estimators 4 and 3 (MLE4 and MLE3) retrackers or with the numerical retrackers (NR for Sentinel-6MF and adaptive for Jason-3).
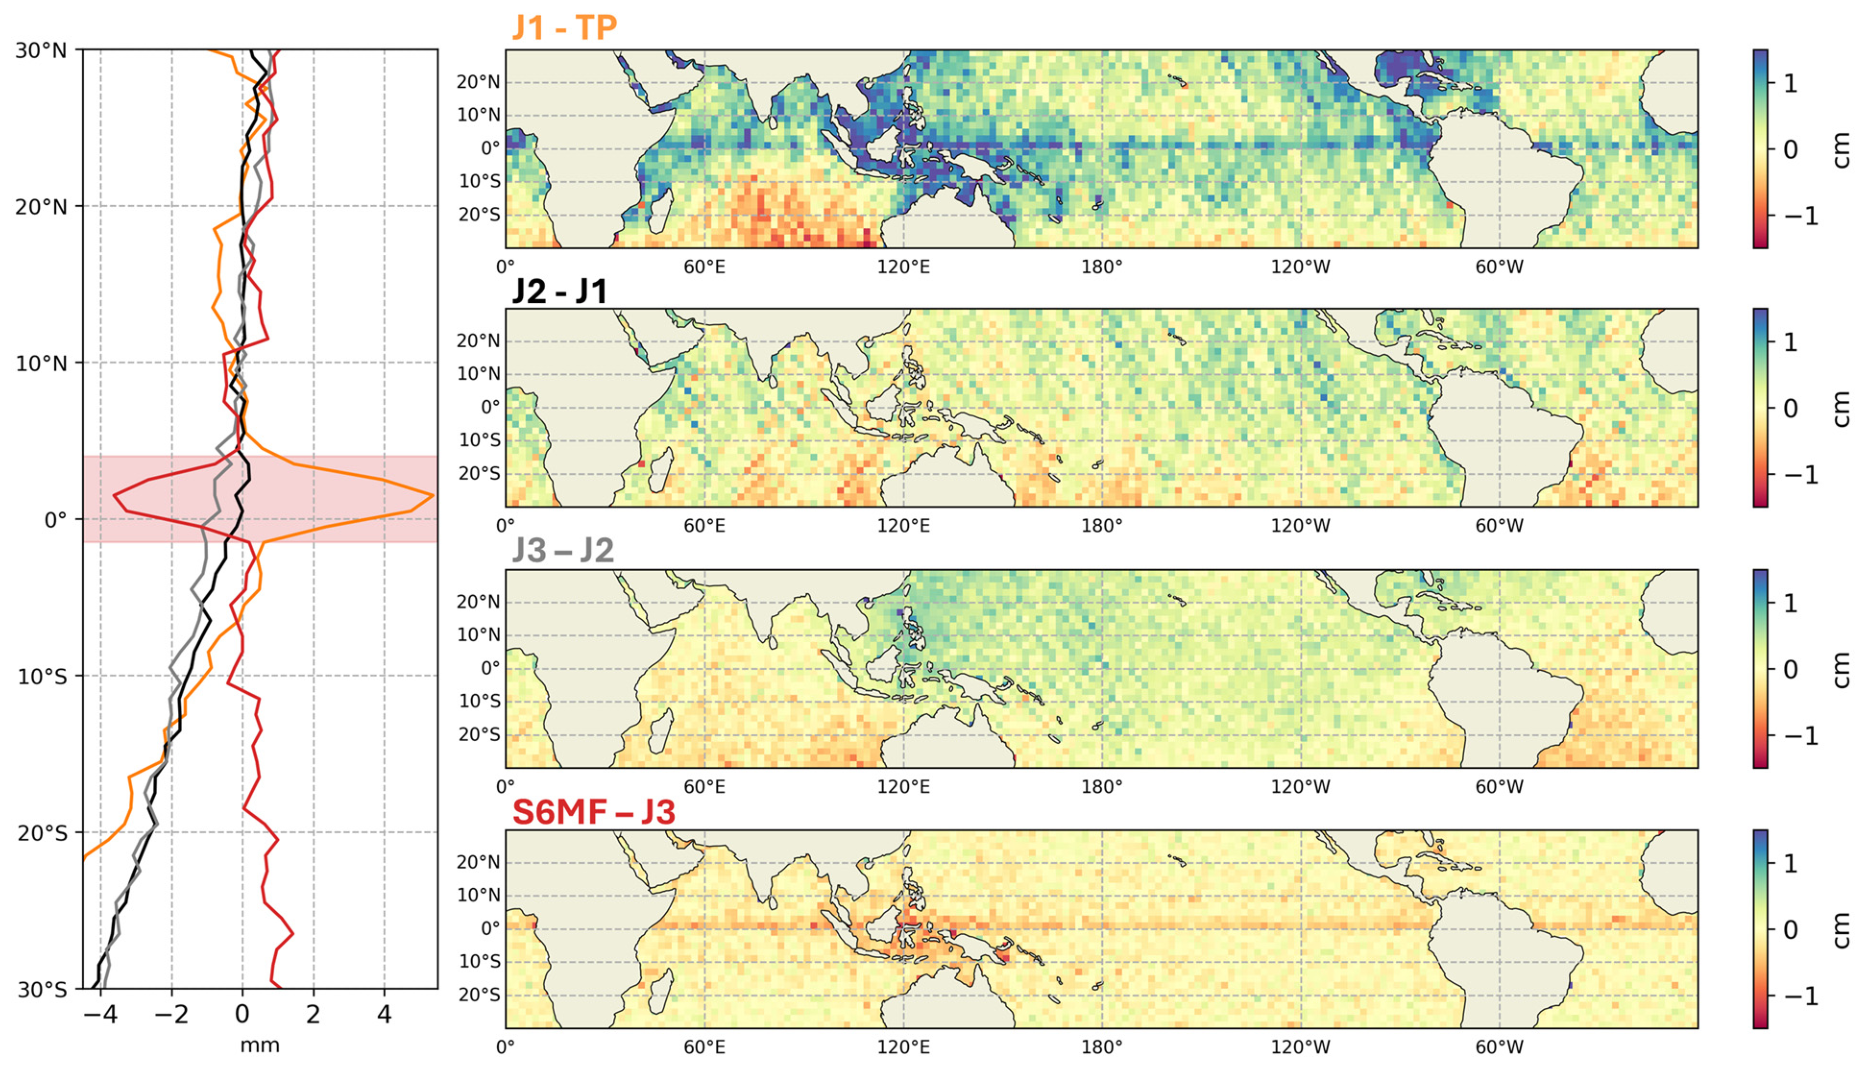
Looking at the other tandem phases on the reference orbit, these two latitudinal bands were not observed on Jason-1 versus Jason-2 [12] nor on Jason-2 versus Jason-3 [13] range comparisons. However, the same signature was observed between TOPEX and Jason-1, as shown in Figure 2 for the equatorial band. Given the consistency between the Jason missions, the cause of this signature was naturally attributed to TOPEX. However, the introduction of Sentinel-6MF into the reference orbit prompted a re-evaluation of this hypothesis. How can TOPEX and Sentinel-6MF, two satellites separated by three decades, with different platforms and instrument designs, share the same signature? Or are the three Jasons the origin of this behavior?
Figure 2.
Difference in the Sea Surface Height Anomaly without geophysical corrections (i.e., orbit minus range minus MSS), computed between 30° S and 30° N, over the four tandem phases of the reference orbit. (Right) from (top) to (bottom): maps for Jason-1 minus TOPEX, Jason-2 minus Jason-1, Jason-3 minus Jason-2 and Sentinel-6MF minus Jason-3. The maps have been centered to zero by removing the mean value (1.4 cm, −1 cm, −2.3 cm and 0.2 cm respectively). (Left): the corresponding latitudinal average in orange, black, gray and red respectively. To improve readability, values have been subtracted to each curve (+2 cm, −0.7 cm, −2 cm and 0.1 cm respectively).
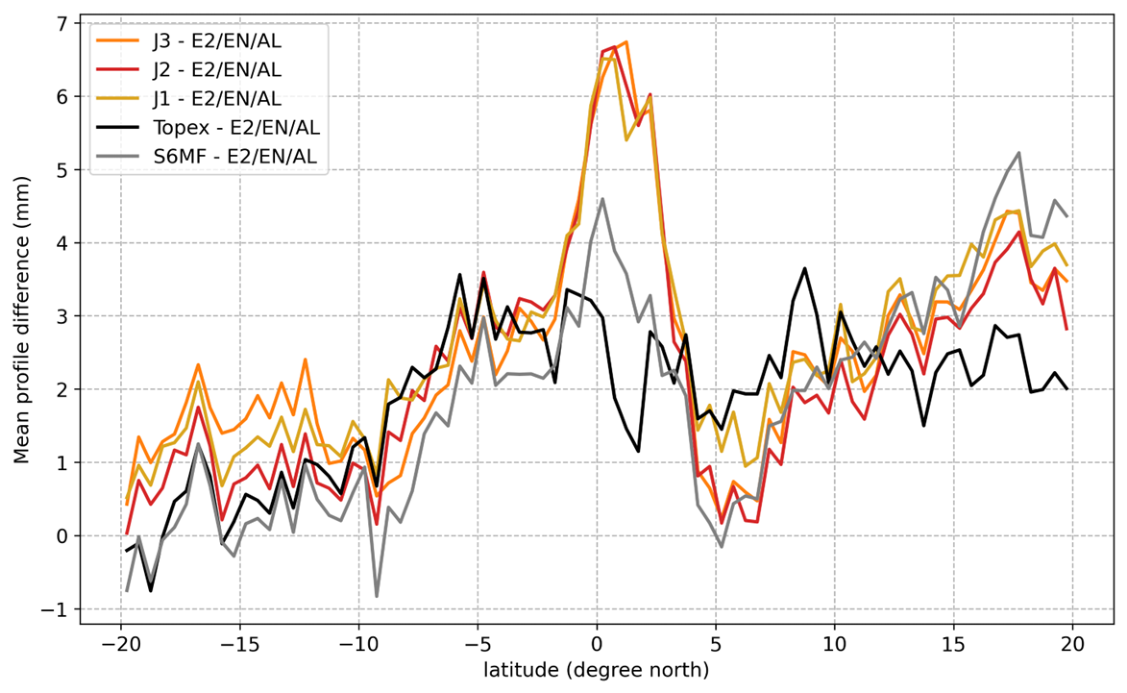
To identify the mission(s) at the origin of these latitudinal bands, comparisons were performed with independent missions, operating on different orbits: Sentinel-3A and -3B, ERS2, Envisat and SARAL/AltiKa. Mission mean profiles [14] were averaged in 0.5° latitude bins, and differences were computed between the binned profiles of reference-orbit missions and those of independent missions. The result is presented in Figure 3 for the comparison to the ERS2–Envisat–SARAL/AltiKa series. A positive bias at the equator is detected for the three Jasons, while no band is observed either for TOPEX or Sentinel-6MF. As for this initial observation between Sentinel-6MF and Jason-3 (Figure 1), this band is located between 1° S and 3.5° N, with a 4 mm amplitude. The same results are observed in comparisons to Sentinel-3A and -3B. With these results, we can confirm that the band observed at the equator originates from the Jason series.
Figure 3.
Mean profile difference across latitude bins: reference orbit−ERS2/Envisat/SARAL–AltiKa. The curves have been manually aligned: −7.6 mm for Jason-3, +2.6 cm for Jason-2, +2.4 cm for Jason-1, +3.3 cm for TOPEX and −2 mm for Sentinel-6MF.
The origin of the 40° S band could not be identified using this method. A higher noise level at these latitudes, combined with an effect limited to ascending tracks, prevents a clear separation between Jason and non-Jason contributions in the comparison of the mean profiles.
2.2. A Ground Segment Anomaly
First, it is important to remind that the assessment of the Ku-band range presented in Figure 1 is not performed directly on the ranges themselves but on the SSHA without geophysical correction, i.e., orbit minus Ku-band range minus mean sea surface. Therefore, this behavior might originate either from the orbit, the range or the mean sea surface. Verifications have thus been performed to identify which component of this formula is the source. Potential inconsistencies in geophysical corrections applied to the range are not considered in this analysis, as these corrections are not used in the initial diagnostics.
The mean sea surface is excluded as the same model (CNES/CLS 2015 [15]) is applied to both Sentinel-6MF and Jason-3 datasets. Regarding the orbit, identical results were obtained using another source (the JPL POE orbit (downloaded from the Global GNSS Data Service, https://sideshow.jpl.nasa.gov/pub/, last accessed on 1 July 2026)): the two latitudinal bands remain [8]. While this does not entirely rule out the orbit solution as a possible source, it suggests that this behavior is most likely related to the Ku-band range.
Several potential sources of the range have been considered and discarded, such as the temperature and the echo centering. The spatial distribution of the latitudinal bands suggests a dependence on the satellite’s radial velocity. Along the reference orbit, the satellite altitude reaches a maximum at the poles and a minimum slightly north of the equator (around 1.4° N), where the radial velocity approaches zero. Furthermore, the radial velocity reaches extrema (approximately ±15 m/s) near 40° N and 40° S, with the sign depending on the track orientation. At 40° S, it is minimal along ascending tracks and maximal along descending tracks; the reverse applies at 40° N.
Following extensive investigations, an anomaly has been found in Jason’s ground segment. It impacts the range estimate and more particularly its on-ground reconstruction from the altimeter telemetry: in some cases of radial orbital velocity, there is an inconsistency between the on-board and ground processing in the numerical methods used in a truncation step of the processing. This anomaly has an impact on all ranges: for all retrackers, for the two Ku- and C bands and at all posting rates (20 Hz and 1 Hz).
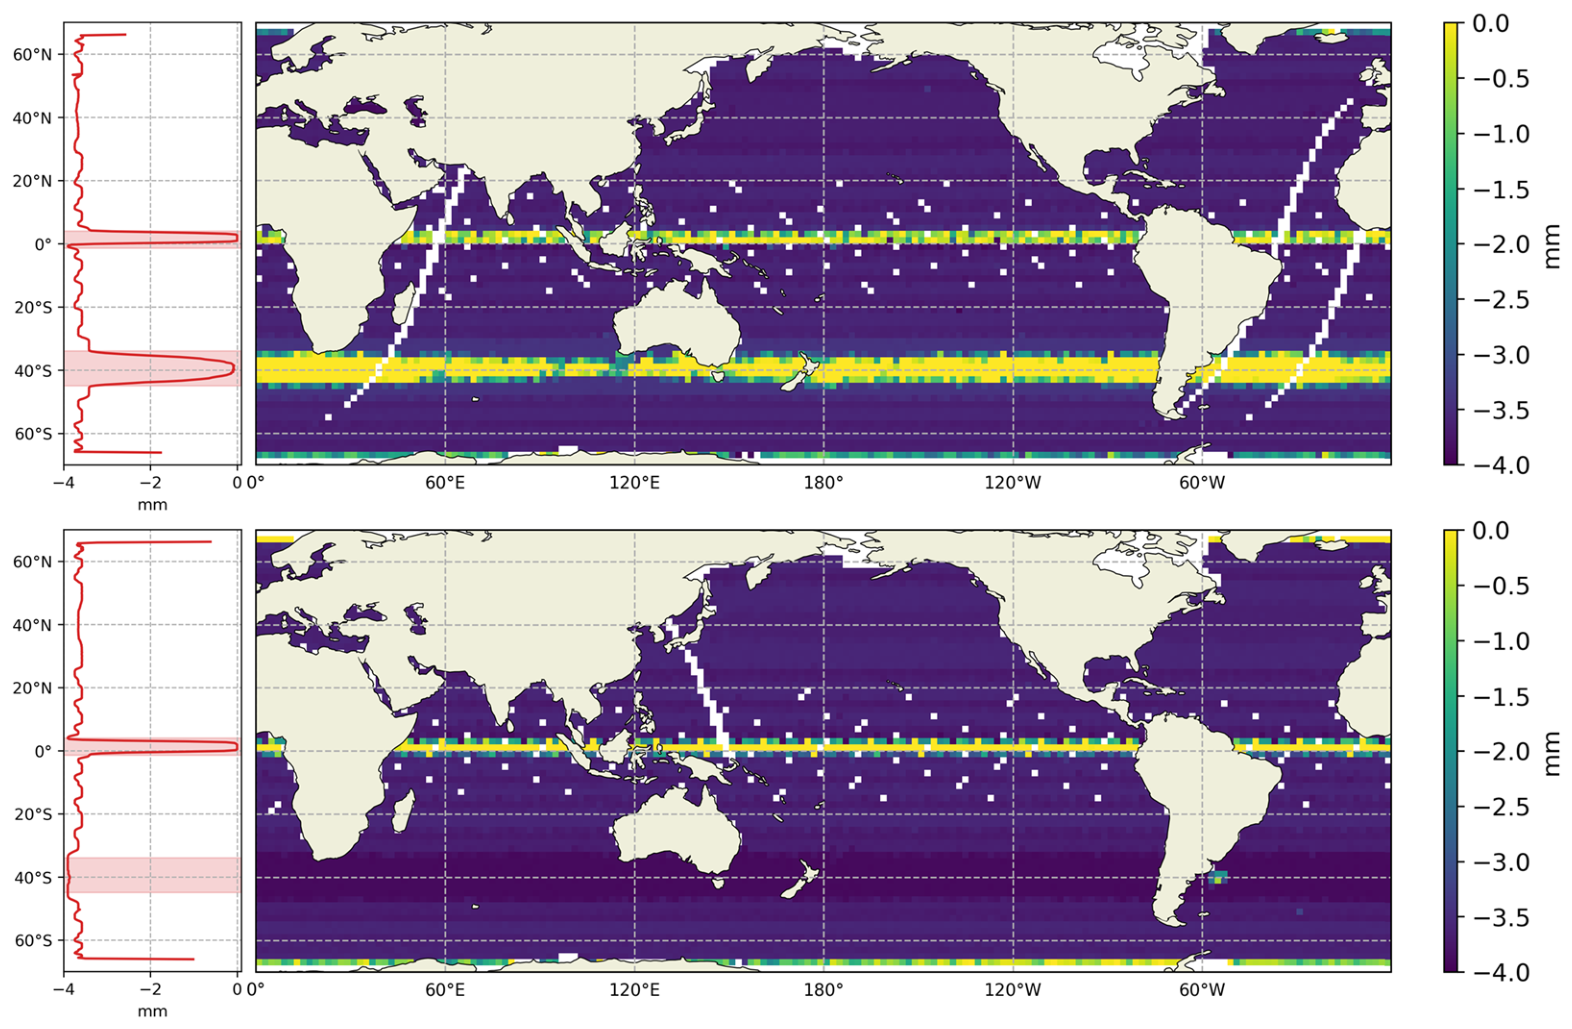
To determine whether this anomaly is the cause of the latitudinal bands discussed here, one month of Jason-3 data was processed using a test version of Geophysical Data Record F (GDR-F). This version includes a patch designed to correct the anomaly. This dataset is compared to the original GDR-F data to quantify the impact of the correction. As expected, this correction only affects the range retrieval, for Ku- and C bands and for all retrackers (MLE3, MLE4 and adaptive), at 20 Hz and 1 Hz. The impact, similar for all ranges, is illustrated in Figure 4 with the Ku-band MLE4 range. The difference between the patched and original dataset shows a bias of −3.65 mm with minor oscillations below one tenth of a millimeter across most latitudes. At the equator, at track extrema and for ascending tracks only, around 40° S, the averaged maps and latitudinal binnings shown in Figure 4 tend toward zero. Examination of the raw data indicates that the bias between patched and original ranges is effectively zero across these latitudes. The precise position and width of these bands vary slightly from pass to pass, which explains the smoothed behavior observed in Figure 4. Around 40° S, the band extends between 34° S and 45.2° S, with a median width of 8° ± 2°. At the equator, the band is more stable, spanning 0.6° S to 4.1° N, with a narrower median width of 3.3° ± 0.7°. Over the study period, all ascending tracks demonstrate the same behavior around 40° S, although this behavior has proven to be non-systematic across different temporal windows.
Figure 4.
Jason-3 Ku-band MLE4 range difference: patch dataset minus original GDR-F dataset. Computed over one month of data, from 27 January 2022 to 26 February 2022, for ascending tracks (top) and descending tracks (bottom). Gridded mean maps (right) and the corresponding latitudinal averages (left). Oscillations around the −3.65 mm plateaus are below 0.1 mm.
Looking at the bias with respect to Sentinel-6MF (Figure 5), the two latitudinal bands are suppressed with this patched dataset, and the mean difference is shifted by −3.5 mm. Based on this analysis, we can confirm that this processing anomaly is the cause of the two latitudinal bands observed on the Jasons’ ranges. Furthermore, this indicates that the variations in range within these latitudinal bands are intrinsic to the measurements, rather than being caused by the anomaly.
Figure 5.
Sentinel-6MF LR NR minus Jason-3 MLE4 difference in the Sea Surface Height Anomaly without geophysical corrections (i.e., orbit minus range minus MSS), computed over one month of data, from 27 January 2022 to 26 February 2022). Right: gridded mean map computed using patched data for J3. The map has been centered to zero by removing the mean value (−0.15 cm). Left: latitudinal average for the original J3 dataset (red) and the patched J3 dataset (black).
Due to a similar orbital altitude rate, the impact of this ground segment anomaly is expected to be identical for the three Jasons over their period on the reference orbit.
This processing anomaly has been detected in version F of the Geophysical Data Record (GDR, Jason’s ground segment) but was present in all previous versions. Its correction is implemented in the latest ground segment version: the GDR-G. This version is used for Jason-3 data production since cycle 500, starting on 30 January 2025. Users can easily verify the ground segment version used by checking the “source” global attribute in the product. Jason-1, -2 and -3 will be corrected from this anomaly over their complete lifetime after their reprocessing in GDR-G (planned to start in 2026).
The SWOT Nadir ground segment also exhibits this processing anomaly up to and including the GDR-F version. In fact, the SWOT Nadir ground segment is inherited from Jason-3 processing, meaning the underlying anomaly mechanism is the same as for the Jasons. The anomaly was corrected in the GDR-S2 version (see https://www.aviso.altimetry.fr/en/news/front-page-news/news-detail.html?tx_ttnews%5Btt_news%5D=3084 for more details, last accessed on 1 July 2026), deployed in February 2025, which was subsequently used for full mission reprocessing in 2025. However, over its two orbits (the 1-day and 21-day phases), SWOT Nadir has a different orbital velocity compared to the reference orbit, which alters the way the anomaly manifests in SWOT data. The impact is shown in Figure 6, presenting the Ku-band MLE4 range difference between the corrected and original dataset over 10 days of SWOT 1-day orbit. The anomaly correction has no impact along the following latitudes:
- At 11.1° N, 13.1° S and at the track extrema for all tracks;
- At 66.3° S for ascending tracks;
- At 64° S for descending tracks.
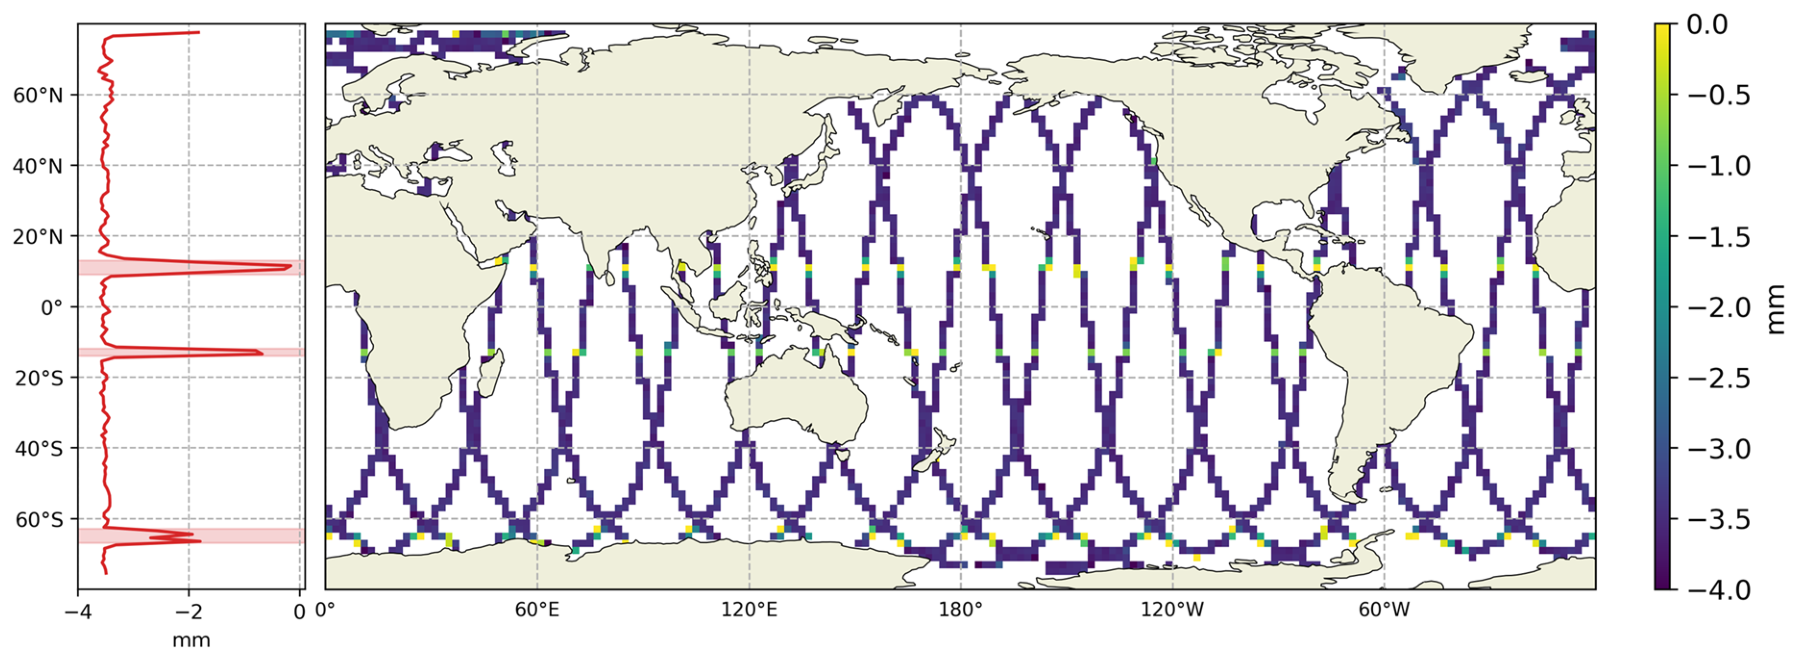
Elsewhere, a bias of −3.5 mm is observed.
Figure 6.
Difference in the SWOT Nadir Ku-band MLE4 ranges: GDR-S2 minus GDR-F. GDR-S2 included other updates impacting the altimeter range. To isolate the correction of the processing anomaly discussed in this paper, the instrumental corrections, included in the “net_instr_cor_range_ocean” field, are removed from the ranges considered here. Computed using data from 15 March to 26 March 2023.
Other satellite processing, such as SARAL/AltiKa or Sentinel-3A and 3-B, are not affected by this processing anomaly as their ground segment is different from that of the Jasons.
3. Range Latitudinal Empirical Correction
Pending full mission reprocessing of the Jason data in GDR-G, this section presents an empirical correction to be applied to the current Jason datasets (GDR-F and previous standards).
This correction is derived from the Jason-3 test dataset presented in Section 2.2. It is based on the Ku-band MLE4 range differences (patch dataset minus original dataset), averaged by latitude, with a 0.25° latitude bin size, from 66.9° S to 66.9° N. Ascending and descending tracks are considered separately to account for the different impact of the anomaly. No smoothing was applied to the binned data when deriving the correction, ensuring that the full latitudinal structure of the anomaly is preserved. The resulting binnings are similar to those shown in the left panels of Figure 4. Sub-millimetric oscillations detected around −3.65 mm were suppressed by setting the corresponding intervals to a constant value of −3.65 mm, while the remaining bins were left unchanged to preserve the full latitudinal peak profile. The final look-up tables are presented in Figure 7. It is available for downloading in netCDF format on AVISO (https://www.aviso.altimetry.fr/en/data/products/auxiliary-products/range-latitudinal-empirical-correction-for-jason-1-2-3-gdr, last accessed on 1 July 2026), along with the corresponding user handbook, and should be referenced using its associated DOI (https://doi.org/10.24400/527896/a01-2024.008). This file contains three variables:
- “latitude”: the latitude;
- “correction_asc”: the look-up table for the ascending tracks (i.e., odd pass number);
- “correction_dsc”: the look-up table for the descending tracks (i.e., even pass number).
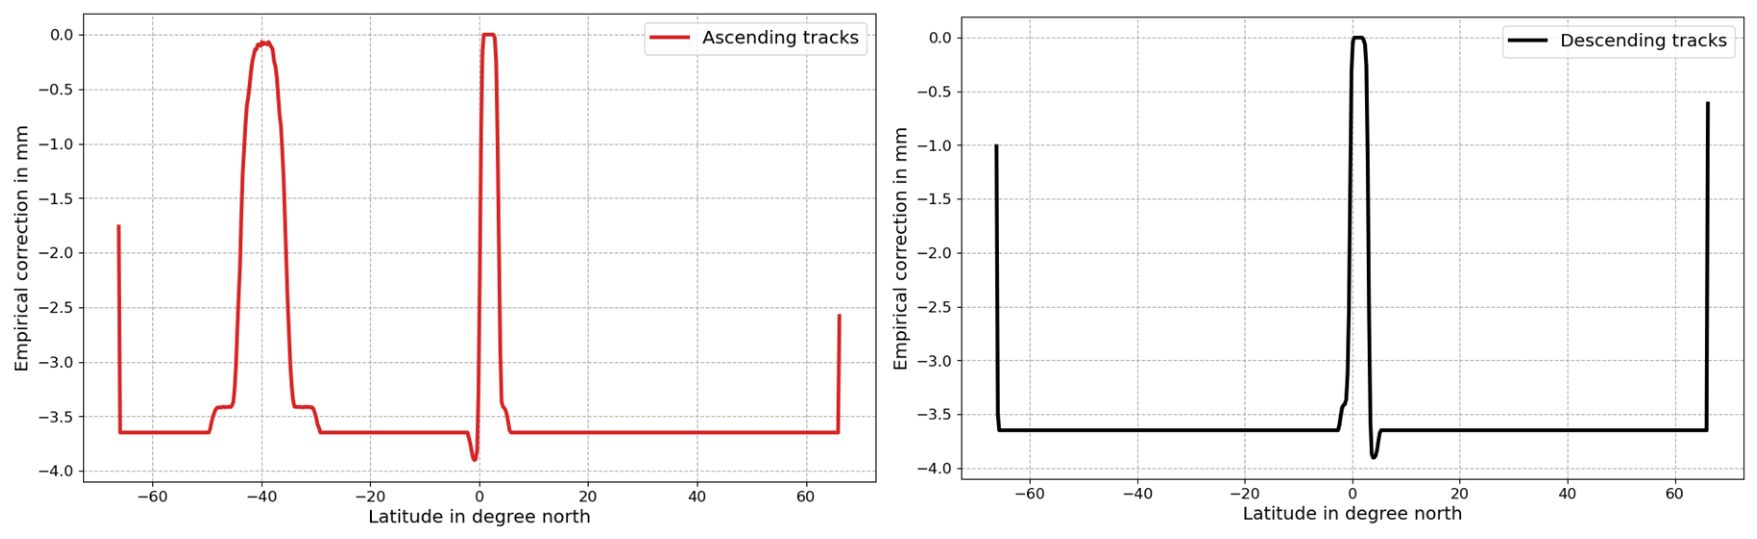
This correction should be applied to the range itself. All ranges present in the Jasons’ products can be corrected using these look-up tables, regardless of the band (Ku or C) or the retracker used, at 1 Hz and 20 Hz. In fact, due to its origin, the impact of the processing anomaly is identical in all these cases (see Section 2.2). The correction value must be added to the range. Linear interpolation can be used to get the correction value at a given latitude.
This correction is valid for the three Jason GDR–F (and previous standards) data. It is important to keep in mind that the use of this correction is restricted to the reference orbit only. It cannot be applied to other orbits (interleaved or drifting), as the effect of the anomaly depends on the satellite’s orbital velocity.
Figure 7.
Empirical correction for ascending (left) and descending tracks (right).
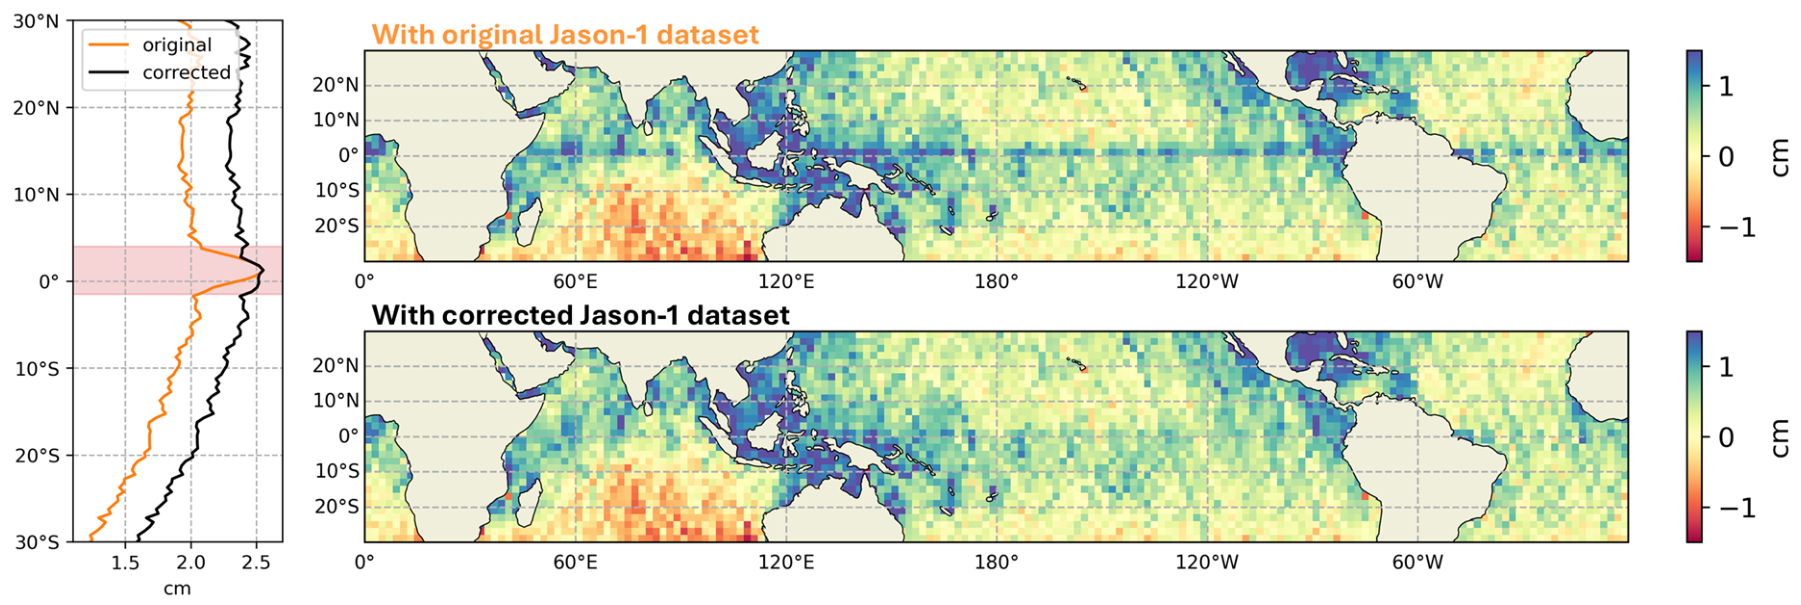
In Figure 8, we show the effect of this empirical correction on the Jason-1 dataset, over the tandem phase with TOPEX. With the original Jason-1 dataset (top right panel), the equatorial band is clearly visible on the range difference with TOPEX. On the bottom right panel, the Jason-1 Ku-band MLE4 range is corrected with the above look-up tables over the whole TOPEX/Jason-1 tandem phase. It results in a complete suppression of the equatorial band on the difference map. It is confirmed by the latitudinal binning of these differences (left panel).
Figure 8.
Jason-1 minus TOPEX difference in the MLE4 SSHA without geophysical corrections (i.e., orbit minus range minus MSS), computed over TOPEX/Jason-1 tandem phase. (Right) gridded mean maps computed using current Jason-1 dataset (top) and using Jason-1 range corrected with the empirical LUT (bottom). The maps have been centered to zero by removing the mean values (1.4 cm and 1.8 cm respectively). (Left) corresponding latitudinal average in orange and black respectively.
This empirical correction is subject to certain limitations due to the computation approach. First, it does not account for variations in position and width of the latitudinal bands. Furthermore, the 40° S is systematically included in the correction, while this behavior is not consistently observed. Residuals of the anomaly may therefore remain after its application.
Note that no similar empirical correction is provided for SWOT Nadir since GDR-S2 products include the processing anomaly correction and are already available to users over the mission lifetime.
4. Impact Assessment on Global Mean Sea Level and Level-2-Derived Products
The processing anomaly affecting the Level-2 data may impact L2-derived products or metrics. In this section, we discuss the impact of the processing anomaly exposed in Section 2.
4.1. Global Mean Sea Level
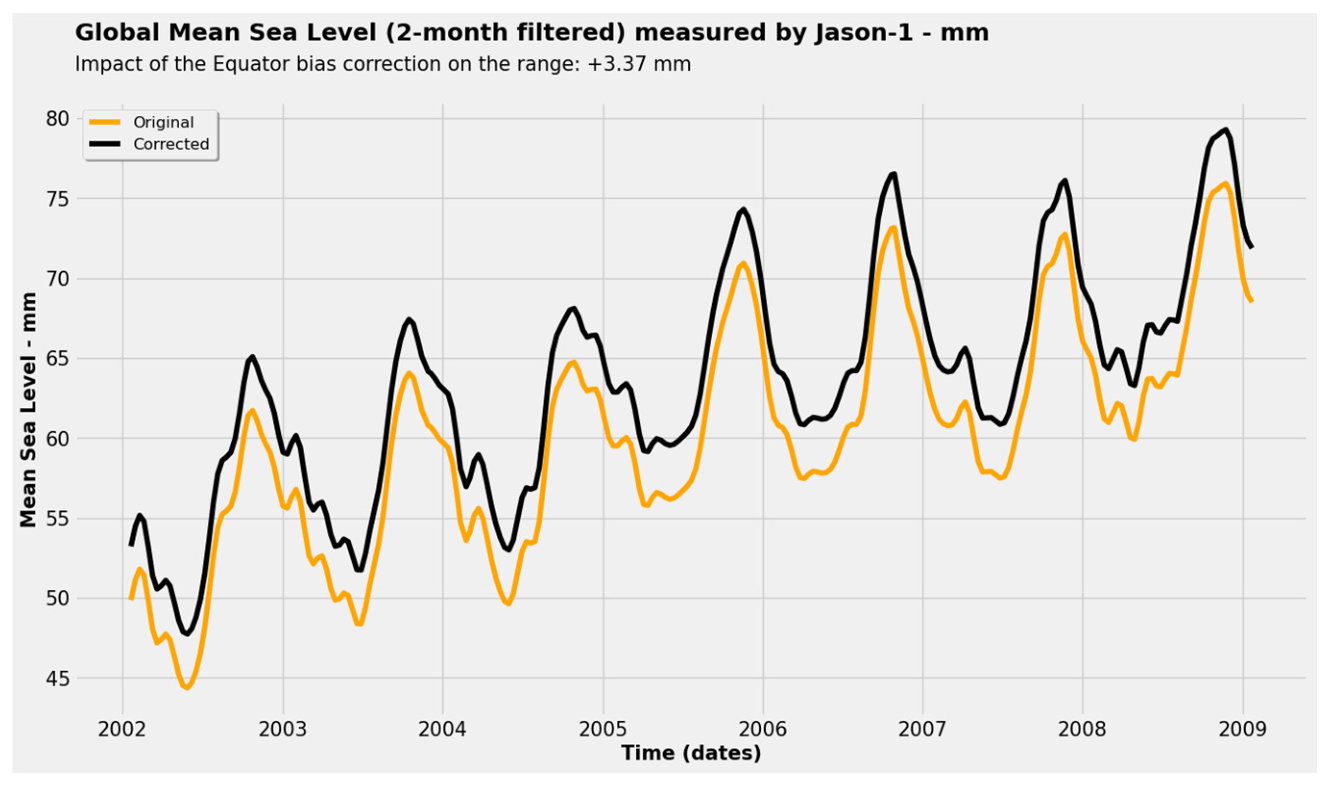
The impact of this processing anomaly on the GMSL measured by all Jason-1/2/3 missions was checked using the empirical correction presented in Section 3. Only a global shift in the GMSL curves is observed, as shown in Figure 9 for Jason-1. The uncertainty associated with this empirical correction on the Sea Level Rise Stability Uncertainty Budget (SLRSUB, [16]) is estimated on the order of 2.10−3 mm.
Figure 9.
Global Mean Sea Level measured by Jason-1. A 2-month cut-off Lanczos filter is applied to the time series. Computed with current Jason-1 dataset (orange) and using Jason-1 range corrected with the empirical LUT (black). A bias of +3.37 mm is detected between the two curves.
As the dynamics remain unchanged, there is no impact on the estimation of the GMSL parameters (trend and acceleration). Additionally, the high-frequency correlated noise from all missions used to define the uncertainty budget of the GMSL is unaffected. As a result, the uncertainties associated with the GMSL parameters remain unchanged. For more details about the GMSL uncertainty budget, its definition, and its use, please refer to [16].
4.2. Level-2P 2024
The Level-2 plus (L2P) goal is to provide intercalibrated, homogenous and up-to-date physical content for more than 15 altimetric missions, as described in https://www.aviso.altimetry.fr/en/data/products/sea-surface-height-products/global/along-track-sea-level-anomalies-l2p.html (last accessed on 1 July 2026). It ensures mesoscale accuracy and climate continuity for the Copernicus Marine Service (see https://marine.copernicus.eu/about/producers/sl-tac for more details, last accessed on 1 July 2026). In 2024, the L2P datasets underwent complete reprocessing (DT24), including the latest altimetric products and most recent geophysical models [17].
In the previous L2P version (DT21), Jason-3 was the regional reference mission, leading to the propagation of the Jasons’ anomaly to TOPEX data.
The L2P products in the DT24 version were generated prior to the identification of the anomaly’s root cause. However, it had already been demonstrated that the anomaly originates from the Jason series (Section 2.1). Consequently, correcting the Jason datasets within the Copernicus Marine Service became necessary. This was enabled by adopting Sentinel-6MF as the regional reference in DT24. The newly reprocessed L2P dataset is now corrected at first order for this anomaly through the application of a regional bias. Specifically, a correction based on the latitudinal mean difference between Sentinel-6MF and Jason-3 is applied to adjust all the Jasons data (see [17] for further details). While this correction is not flawless (particularly due to the lack of differentiation between ascending and descending tracks), it still offers a reliable first-order correction for the Copernicus Marine Service. For TOPEX, comparison to Jason-1 has shown significant differences depending on the track orientation [17]. The origin of this behavior is beyond the scope of this study. However, the impact was substantial enough to require separate corrections, thereby improving the accounting for the Jason ground segment anomaly in DT24.
Future L2P reprocessing will benefit from Jason’s GDR-G reprocessing, ensuring complete anomaly correction at its source.
4.3. Models Assimilating Altimetric Data
This processing anomaly has been present in sea level products assimilated by numerical forecasting models over the past 30 years. It is the case for the global high-resolution system from Mercator Ocean [18], which assimilates sea level altimetric products derived from L2P datasets. It exhibits a slight equatorial bias on the order of a few millimeters. This behavior could be due to several reasons (such as the model vertical resolution), but correcting this anomaly (with DT24 and future versions, see Section 4.2) could partially resolve the budget closure in this area (Mounir Benkiran, personal communication).
Sea level products are also used to compute mean sea surface (MSS) models, such as the latest 2023 Hybrid Model [19]. To evaluate the impact of the Jason processing anomaly on these models, sensitivity tests were conducted in the equatorial region by introducing an artificial bump into the mean profiles used as the model input. Comparisons with the reference MSS indicate that the resulting differences are negligible.
5. Conclusions
Early comparisons between TOPEX and Jason-1 sea surface height measurements revealed inter-mission biases of approximately 14 cm, with hemispheric patterns exhibiting amplitudes around 2 cm [20]. In contrast, the latitudinal bands analyzed in this study have amplitudes on the order of 4 mm—an order of magnitude smaller—and thus were not a primary concern at the time.
With constant improvements in sea level datasets and the addition of Sentinel-6MF to the reference orbit, the origin of these latitudinal signatures has now been identified. Contrary to initial assumptions that attributed the issue to TOPEX, the anomaly stems from a processing error in the ground segments of the Jason missions. Importantly, the issue is not linked to onboard instrumentation, and as such, is straightforward to correct.
This anomaly caused an underestimation of all ranges provided in Jason products by 3.65 mm across most latitudes. At the equator, at track extrema and for ascending tracks only, around 40° S, the ranges remain unbiased, causing the latitudinal bands originally observed (Figure 1).
The correction of this issue is implemented in the GDR-G version of the Jason ground segment, which has been used for Jason-3 data processing starting in January 2025. Reprocessing campaigns using GDR-G will also retroactively correct Jason-1, Jason-2, and Jason-3 data for their full mission lifetimes. In the interim, we proposed an empirical correction (Section 3) to temporarily mitigate the effect of this anomaly for data acquired during their corresponding periods on the reference orbit. This latitudinal empirical correction is limited to the reference orbit and should be applied with caution, as it does not completely resolve the anomaly. In particular, it does not account for variations in the position and width of the latitudinal bands, nor for the fact that not all ascending tracks exhibit a band at 40° S.
The same processing anomaly also affects the SWOT Nadir dataset, which has been corrected since the deployment of ground segment version GDR-S2 in February 2025. This version was used for full mission reprocessing conducted in 2025.
The identification and resolution of this anomaly underscore the importance of tandem missions in advancing the accuracy and consistency of satellite altimetry data.
Author Contributions
E.C. and C.M. discovered the latitudinal bands between Sentinel-6MF and Jason-3 ranges. C.K., B.C. and E.C. attributed these signatures to the Jason series. The understanding of the anomaly and its correction in the ground segment was performed by C.M., F.B.-C., N.C. and F.B., G.B. and F.B.-C. specified the Jason-3 ground segment patch. The validation of the corrected datasets was performed by E.C. for Jason-3 and by A.D. and F.B.-C. for SWOT Nadir. The empirical correction was elaborated by F.B.-C. and E.C., validated by E.C. and published on aviso by C.G., V.Q., F.O. and P.P. quantified the impact on the GMSL and C.K. on the L2P products. The manuscript was written by E.C., with the contributions of A.D. for SWOT Nadir, V.Q. for the GMSL section and C.K. for the L2P and model sections. The entire manuscript was reviewed and revised by F.B.-C., C.G., N.C., G.B., C.K., B.C. and P.P. All authors have read and agreed to the published version of the manuscript.
Funding
This work was entirely funded by the Centre National d’Etudes Spatiales (CNES) as part of the SALP (Service Altimétrie & Localisation Precise) project.
Data Availability Statement
The original contributions presented in this study are included in the article. Further inquiries can be directed to the corresponding author.
Acknowledgments
The authors would like to thank Mounir Benkiran for his input on the Mercator model, and Philippe Schaeffer for his input on mean sea surface models.
Conflicts of Interest
Authors Emeline Cadier, Bastien Courcol, Cécile Kocha, Victor Quet, Pierre Prandi, Aurélien Deniau and Geoffrey Bracher were employed by the company Collecte Localisation Satellites, Ramonville-Saint-Agne, France. Author Franck Octau was employed by the company ALTEN, Toulouse, France. The remaining authors declare that the research was conducted in the absence of any commercial or financial relationships that could be construed as a potential conflict of interest.
Appendix A
Level-2 altimetric data over the ocean are used for this analysis. It includes datasets from the five consecutive missions flying on the reference orbit: TOPEX, Jason-1, Jason-2, Jason-3 and Sentinel-6MF. The periods considered correspond to the four tandem phases of the reference orbit. The corresponding dates are provided in Table A1. For Sentinel-6MF, only the period where Sentinel-6MF operates on its redundant altimeter (Poseidon-4B) is considered.
Table A1.
Dates of the reference orbit tandem flights.
Figure 1, Figure 2 and Figure 8 use data from the full tandem periods, whereas Figure 4 and Figure 5 are computed over a single month, as indicated in the figure legends.
The Sentinel-6MF dataset is derived from the Level-2 Non-Time Critical products, processed with the processing baseline F08. The corresponding product notice is available at https://www.eumetsat.int/media/50743, version 8 (last accessed on 1 July 2026). The Jason-3 dataset is derived from the Level-2 Geophysical Data Record products, processed in version F (GDR-F). The corresponding product handbook is available at https://www.aviso.altimetry.fr/fileadmin/documents/data/tools/hdbk_j3.pdf (last accessed on 1 July 2026). TOPEX, Jason-1 and Jason-2 datasets are respectively derived from M-GDR, GDR-E and GDR-D products. Level-2 products from the Surface Water and Ocean Topography (SWOT) Nadir are also used (Figure 6) over one month of data, from 15 March 2023 to 26 March 2023. We used GDR data in version F and S2.
References
- Donlon, C.; Cullen, R.; Giulicchi, L.; Vuilleumier, P.; Francis, R.; Kuschnerus, M.; Simpson, W.; Bouridah, A.; Caleno, M.; Bertoni, R.; et al. The CopernicusSentinel-6 mission: Enhanced continuity of satellite sea level measurements from space. Remote Sens. Environ. 2021, 258, 112395. [Google Scholar]
- Remko, S.; Hans, B.; Christelle, P.; François, P.; Axel, E.; Milen, T.; Kristiaan, V.; François, M. Jason continuity of services: Continuing the Jason altimeter data records as Copernicus Sentinel-6. Ocean Sci. 2016, 12, 471–479. [Google Scholar] [CrossRef] [Scilit]
- Ablain, M.; Legeais, J.-F.; Prandi, P.; Marcos, M.; Fenoglio-Marc, L.; Dieng, H.B.; Benveniste, J.; Cazenave, A. Satellite Altimetry-Based Sea Level at Global and Regional Scales. In Integrative Study of the Mean Sea Level and Its Components; Springer: Berlin/Heidelberg, Germany, 2017; Volume 58, pp. 9–33. [Google Scholar]
- Legeais, J.-F.; Ablain, M.; Zawadzki, L.; Zuo, H.; Johannessen, J.; Scharffenberg, M.; Fenoglio-Marc, L.; Fernandes, J.; Andersen, O.B.; Rudenko, S.; et al. An improved and homogeneous altimeter sea level record from the ESA Climate Change Initiative. Earth Syst. Sci. Data 2018, 10, 281–301. [Google Scholar] [CrossRef] [Scilit]
- Donlon, C.J.; O’Carroll, A.; Smith, D.; Scharroo, R.; Bourg, L.; Kwiatkowska, E.; Merchant, C.; Sathyendranath, S.; Labroue, S.; Larnicol, G. Scientific Justification for a Tandem Mission Between Sentinel-3A and Sentinel-3B During the E1 Commissioning Phase; European Space Agency: Noordwijk, The Netherlands, 2017. [Google Scholar]
- Dorandeu, J.; Ablain, M.; Le Traon, P.-Y. Reducing cross-track geoid gradient errors around topex/poseidon and jason-1 nominal tracks: Application to calculation of sea level anomalies. J. Atmos. Ocean. Technol. 2003, 20, 1826–1838. [Google Scholar] [CrossRef] [Scilit]
- Beckley, B.D.; Zelensky, N.P.; Holmes, S.A.; Ray, L.F.G.; Mitchum, R.D.; Desai, G.T.; Brown, S.D. Assessment of the Jason-2 Extension to the TOPEX/Poseidon, Jason-1 Sea-Surface Height Time Series for Global Mean Sea Level Monitoring. Mar. Geod. 2010, 33, 447–471. [Google Scholar]
- Cadier, E.; Courcol, B.; Prandi, P.; Quet, V.; Moreau, T.; Maraldi, C.; Bignalet-Cazalet, F.; Dinardo, S.; Martin-Puig, C.; Donlon, C. Assessment of Sentinel-6MF low resolution numerical retracker over ocean: Continuity on reference orbit and improvements. Adv. Space Res. 2025, 75, 30–52. [Google Scholar] [CrossRef] [Scilit]
- López-García, P.; Gómez-Enri, J.; Muñoz-Pérez, J.J. Accuracy assessment of wave data from altimeter near the coast. Ocean Eng. 2019, 178, 229–232. [Google Scholar] [CrossRef] [Scilit]
- Courcol, B.; Cadier, E. Sentinel-6 MF: F08 Reprocessing Calval. 2023. Available online: https://user.eumetsat.int/s3/eup-strapi-media/S6_A_F08_Reprocessing_Calval_Assessment_v2_1_c6273b0e23.pdf (accessed on 1 July 2026).
- Dinardo, S.; Maraldi, C.; Cadier, E.; Rieu, P.; Aublanc, J.; Guerou, A.; Boy, F.; Moreau, T.; Picot, N.; Scharroo, R. Sentinel-6 MF Poseidon-4 radar altimeter: Main scientific results from S6PP LRM and UF-SAR chains in the first year of the mission. Adv. Space Res. 2024, 73, 337–375. [Google Scholar] [CrossRef] [Scilit]
- Coquelin, J.; Roinard, H. Global Validation over Ocean of the Jason-2 GDR-F Data Reprocessing. 2025. Available online: https://www.aviso.altimetry.fr/fileadmin/documents/calval/validation_report/J2/SALP-RP-MA-EA-23622-CLS_Jason-2_GDR-F_reprocessing_report_v1-1.pdf (accessed on 1 July 2026).
- Roinard, H.; Coquelin, J. Jason-3 Validation of GDR-F Data over Ocean. 2021. Available online: https://www.aviso.altimetry.fr/fileadmin/documents/calval/validation_report/J3/SALP-RP-MA-EA-23480-CLS_Jason3_Reprocessing_Report_v1-2.pdf (accessed on 1 July 2026).
- Schaeffer, P.; Faugère, Y.; Legeais, J.-F.; Ollivier, A.; Guinle, T.; Picot, N. The CNES_CLS11 Global Mean Sea Surface Computed from 16 Years of Satellite Altimeter Data. Mar. Geod. 2012, 35, 3–19. [Google Scholar] [CrossRef] [Scilit]
- Pujol, M.-I.; Schaeffer, P.; Faugère, Y.; Raynal, M.; Dibarboure, G.; Picot, N. Gauging the Improvement of Recent Mean Sea Surface Models: A New Approach for Identifying and Quantifying Their Errors. JGR Ocean. 2018, 123, 5889–5911. [Google Scholar] [CrossRef] [Scilit]
- Guérou, A.; Meyssignac, B.; Prandi, P.; Ablain, M.; Ribes, A.; Bignalet-Cazalet, F. Current observed global mean sea level rise and acceleration estimated from satellite altimetry and the associated measurement uncertainty. Ocean Sci. 2023, 19, 431–451. [Google Scholar] [CrossRef] [Scilit]
- Kocha, C.; Lievin, M.; Pageot, Y.; Rubin, C.; Quet, V.; Octau, F.; Pujol, M.-I.; Philipps, S.; Dibarboure, G.; Denis, I.; et al. Three decades of sea level multi-mission satellite data reprocessed to improve mesoscale quality while ensuring climate scale consistency. Earth Syst. Sci. Data Discuss. 2026. preprint. [Google Scholar] [CrossRef] [Scilit]
- Benkiran, M.; Ruggiero, G.; Greiner, E.; Le Traon, P.-Y.; Rémy, E.; Lellouche, J.-M.; Bourdallé-Badie, R.; Drillet, Y.; Tchonang, B. Assessing the Impact of the Assimilation of SWOT Observations in a Global High-Resolution Analysis and Forecasting System Part 1: Methods. Front. Mar. Sci. 2021, 8, 691955. [Google Scholar] [CrossRef] [Scilit]
- Laloue, A.; Schaeffer, P.; Pujol, M.-I.; Veillard, P.; Andersen, O.; Sandwell, D.; Delepoulle, A.; Dibarboure, G.; Faugère, Y. Merging Recent Mean Sea Surface Into a 2023 Hybrid Model (From Scripps, DTU, CLS, and CNES). Ocean Sci. 2025, 12, e2024EA003836. [Google Scholar] [CrossRef] [Scilit]
- Dorandeu, J.; Ablain, M.; Faugère, Y.; Mertz, F.; Soussi, B.; Vincent, P. Jason-1 global statistical evaluation and performance assessment: Calibration and cross-calibration results. Mar. Geod. 2004, 27, 345–372. [Google Scholar] [CrossRef] [Scilit]
Disclaimer/Publisher’s Note: The statements, opinions and data contained in all publications are solely those of the individual author(s) and contributor(s) and not of MDPI and/or the editor(s). MDPI and/or the editor(s) disclaim responsibility for any injury to people or property resulting from any ideas, methods, instructions or products referred to in the content. |
© 2026 by the authors. Licensee MDPI, Basel, Switzerland. This article is an open access article distributed under the terms and conditions of the Creative Commons Attribution (CC BY) license.