Article

Analyzing the Seasonal Variability in South China Sea Surface Currents with Drifter Observations, Satellite-Derived Data, and Reanalysis Data

by
Zhiyuan Hu
1,
Longqi Yang
1,*,
Zhenyu Sun
1,2,
Zhaozhang Chen
1,
Jia Zhu
1 and
Jianyu Hu
1,2,3
1
State Key Laboratory of Marine Environmental Science, College of Ocean and Earth Sciences, Xiamen University, Xiamen 361102, China
2
Southern Marine Science and Engineering Guangdong Laboratory (Zhuhai), Zhuhai 519082, China
3
Center for Marine Meteorology and Climate Change, Xiamen University, Xiamen 361102, China
*
Author to whom correspondence should be addressed.
Oceans 2025, 6(3), 58; https://doi.org/10.3390/oceans6030058
Submission received: 15 June 2025 / Revised: 28 August 2025 / Accepted: 2 September 2025 / Published: 9 September 2025
(This article belongs to the Special Issue Ocean Observing Systems: Latest Developments and Challenges)

Abstract

This study examines the seasonal variability of surface currents in the South China Sea (SCS) and its adjacent regions, employing trajectory data from four seasonal deployments of Beidou drifters in the northern SCS. These observations are supplemented by reanalysis datasets, as well as satellite-derived sea surface wind and sea surface height data. The principal findings of this research are summarized as follows: (1) Drifter trajectories in the SCS exhibit pronounced seasonal characteristics. During autumn and winter, drifters predominantly move westward, ultimately merging with the SCS Western Boundary Current (SCSWBC). In spring, drifters are frequently entrained by mesoscale eddies. In summer, drifter trajectories generally move northeastward toward the Luzon Strait and the Taiwan Strait, with drifters subsequently returning to the SCS through these straits in autumn or winter before either joining the SCSWBC or settling in the coastal waters of Hainan. (2) The observed average drifter velocities show strong consistency with the CMEMS-reanalyzed current data during both the summer and winter seasons. (3) The surface current speeds along drifter trajectories in winter exhibit significant interannual variability, primarily driven by variations in wind speed. When the Niño 3.4 index exceeds ±0.5 °C (positive/negative phase), wind speeds and current speeds often reach their minimum (positive phase) or maximum (negative phase) values. These results enhance our understanding of the seasonal dynamics of surface currents in the SCS and their linkage to large-scale climatic variability.

1. Introduction

The South China Sea (SCS) is the largest marginal sea in the western Pacific Ocean. It is contiguous with the East China Sea via the Taiwan Strait (TWS) to the north and with the Northwest Pacific Ocean through the Luzon Strait (LZS) to the northeast. The SCS is also connected to the Indian Ocean via the Malacca Strait and the Andaman Sea to the south, and to the Java Sea through the Karimata Strait. Situated in both the subtropical and tropical zones, the SCS is characterized by a wind-driven circulation that constitutes the primary component of its overall circulation [1,2]. The complex topography of the region, which includes islands, continental shelves, shoals, and intricate coastlines, exerts a significant influence on the hydrodynamic characteristics of the SCS. These topographical features modulate key oceanographic processes, such as temperature and salinity distributions, meridional circulation patterns, and the generation of mesoscale and submesoscale eddies. The SCS is located in the typical East Asian monsoon region. During winter, the prevailing northeast monsoon has an average wind speed of 9 m/s, while in summer, the southwest monsoon prevails with an average wind speed of 6 m/s. This alternation in wind direction between the winter and summer monsoons induces a significant seasonal variation in the SCS circulation [3].
Early investigations of the SCS surface circulation primarily relied on monsoon wind patterns, ship drift data, and hydrographic measurements [4,5]. Wyrki (1961) [4] provided a comprehensive description of the SCS surface circulation based on ship drift data and hydrographic observations, revealing a cyclonic circulation during winter and an anticyclonic circulation during summer. Xu et al. (1982) [5] computed seasonal geostrophic current fields using dynamic height anomaly data from over 6000 stations.
Since the 1990s, numerical models have been employed to simulate the SCS surface circulation [6,7,8,9,10,11,12]. Over the past two decades, satellite sea surface height data have been extensively utilized in studies of the SCS surface circulation [13,14,15,16,17,18,19,20,21,22,23]. Bao et al. (2005) [17] utilized high-precision satellite altimeter data to calculate the SCS surface circulation. During winter, a cyclonic circulation is observed in the northern SCS, characterized by a strengthened western boundary current along the coast of Vietnam and a compensating northward current in the central region of the southern SCS. In summer, an offshore northeasterly current is evident, including the SCS Warm Current, which originates from the northward western boundary current and flows into the TWS (see Figure 1).
In recent years, Lagrangian drifters have emerged as a powerful tool for observing ocean surface currents [20,24,25,26,27,28,29,30,31,32,33,34]. Su et al. (2002) [24] analyzed the surface current field in the SCS using data from 26 drifters deployed during the period 1988–1998. They constructed a mean current vector map with a spatial resolution of 0.5° × 0.5°. Liu et al. (2014) [28] utilized satellite-tracked drifter data from 1989 to 2013 and satellite altimetry data from 1993 to 2012 to investigate the SCS surface circulation. They generated maps of the mean surface flow field for each season and compared the observed flow fields with the geostrophic flow fields. Data analyzed by Tuo et al. (2023) [31] indicate that submesoscale ageostrophic currents within the eddies in the SCS contribute to the shaping of asymmetric trajectories. Seasonal drifter experiments conducted in the Pearl River Estuary, located in the nearshore waters of Guangdong, have shown the effectiveness of drifters in tracing the movement of floating debris, highlighting distinct transport pathways and high-risk retention areas during winter and summer [32,33]. Li et al. (2025) [34] pioneeringly presented an observed image of the Yuexi cyclonic eddy, obtained from surface Lagrangian drifters deployed on the continental shelf of the northwestern SCS.
In this study, four batches of Beidou satellite-tracked drifters were deployed in the SCS across four seasons, from December 2020 to September 2021. The analysis of these data offers novel insights into the seasonal variability of the SCS surface circulation. Given that drifter observations are unable to cover the entire SCS, entire seasons, or multiple years, and considering that reanalysis data lack enough accuracy verification, this study further compares the flow speeds of the drifters with those simulated by an operational reanalysis model. Based on the consistency between these two datasets, we further investigate the seasonal and interannual variations in the SCS surface circulation using reanalyzed current data. This approach yields valuable results that enhance the model-based characterization of current variability in the SCS.
For the purposes of this study, the seasons are defined as follows: winter extends from December to February of the following year, spring includes March to May, summer spans June to August, and autumn covers September to November.

2. Data and Methods

2.1. Data

The drifter data in this study are derived from satellite-tracked drifters developed in China, which employ the Beidou Navigation Satellite System for high-precision positioning and data transmission. These “Beidou drifters” integrate a Beidou positioning module and operate via the Beidou communication network. Their design is consistent with that of internationally used drifters. Each drifter comprises a surface buoy with a diameter of 38 cm, and a drogue (water sail) 6 m long and 60 cm in diameter, suspended 15 m below the buoy. This configuration ensures a drag area ratio above 40, effectively minimizing wind-induced motion [35]. The Beidou drifters sample at a 30 min interval, providing higher temporal resolution than the 1 h interval used by the Global Drifter Program. The Beidou drifter can effectively reflect the actual flow field characteristics [36,37].
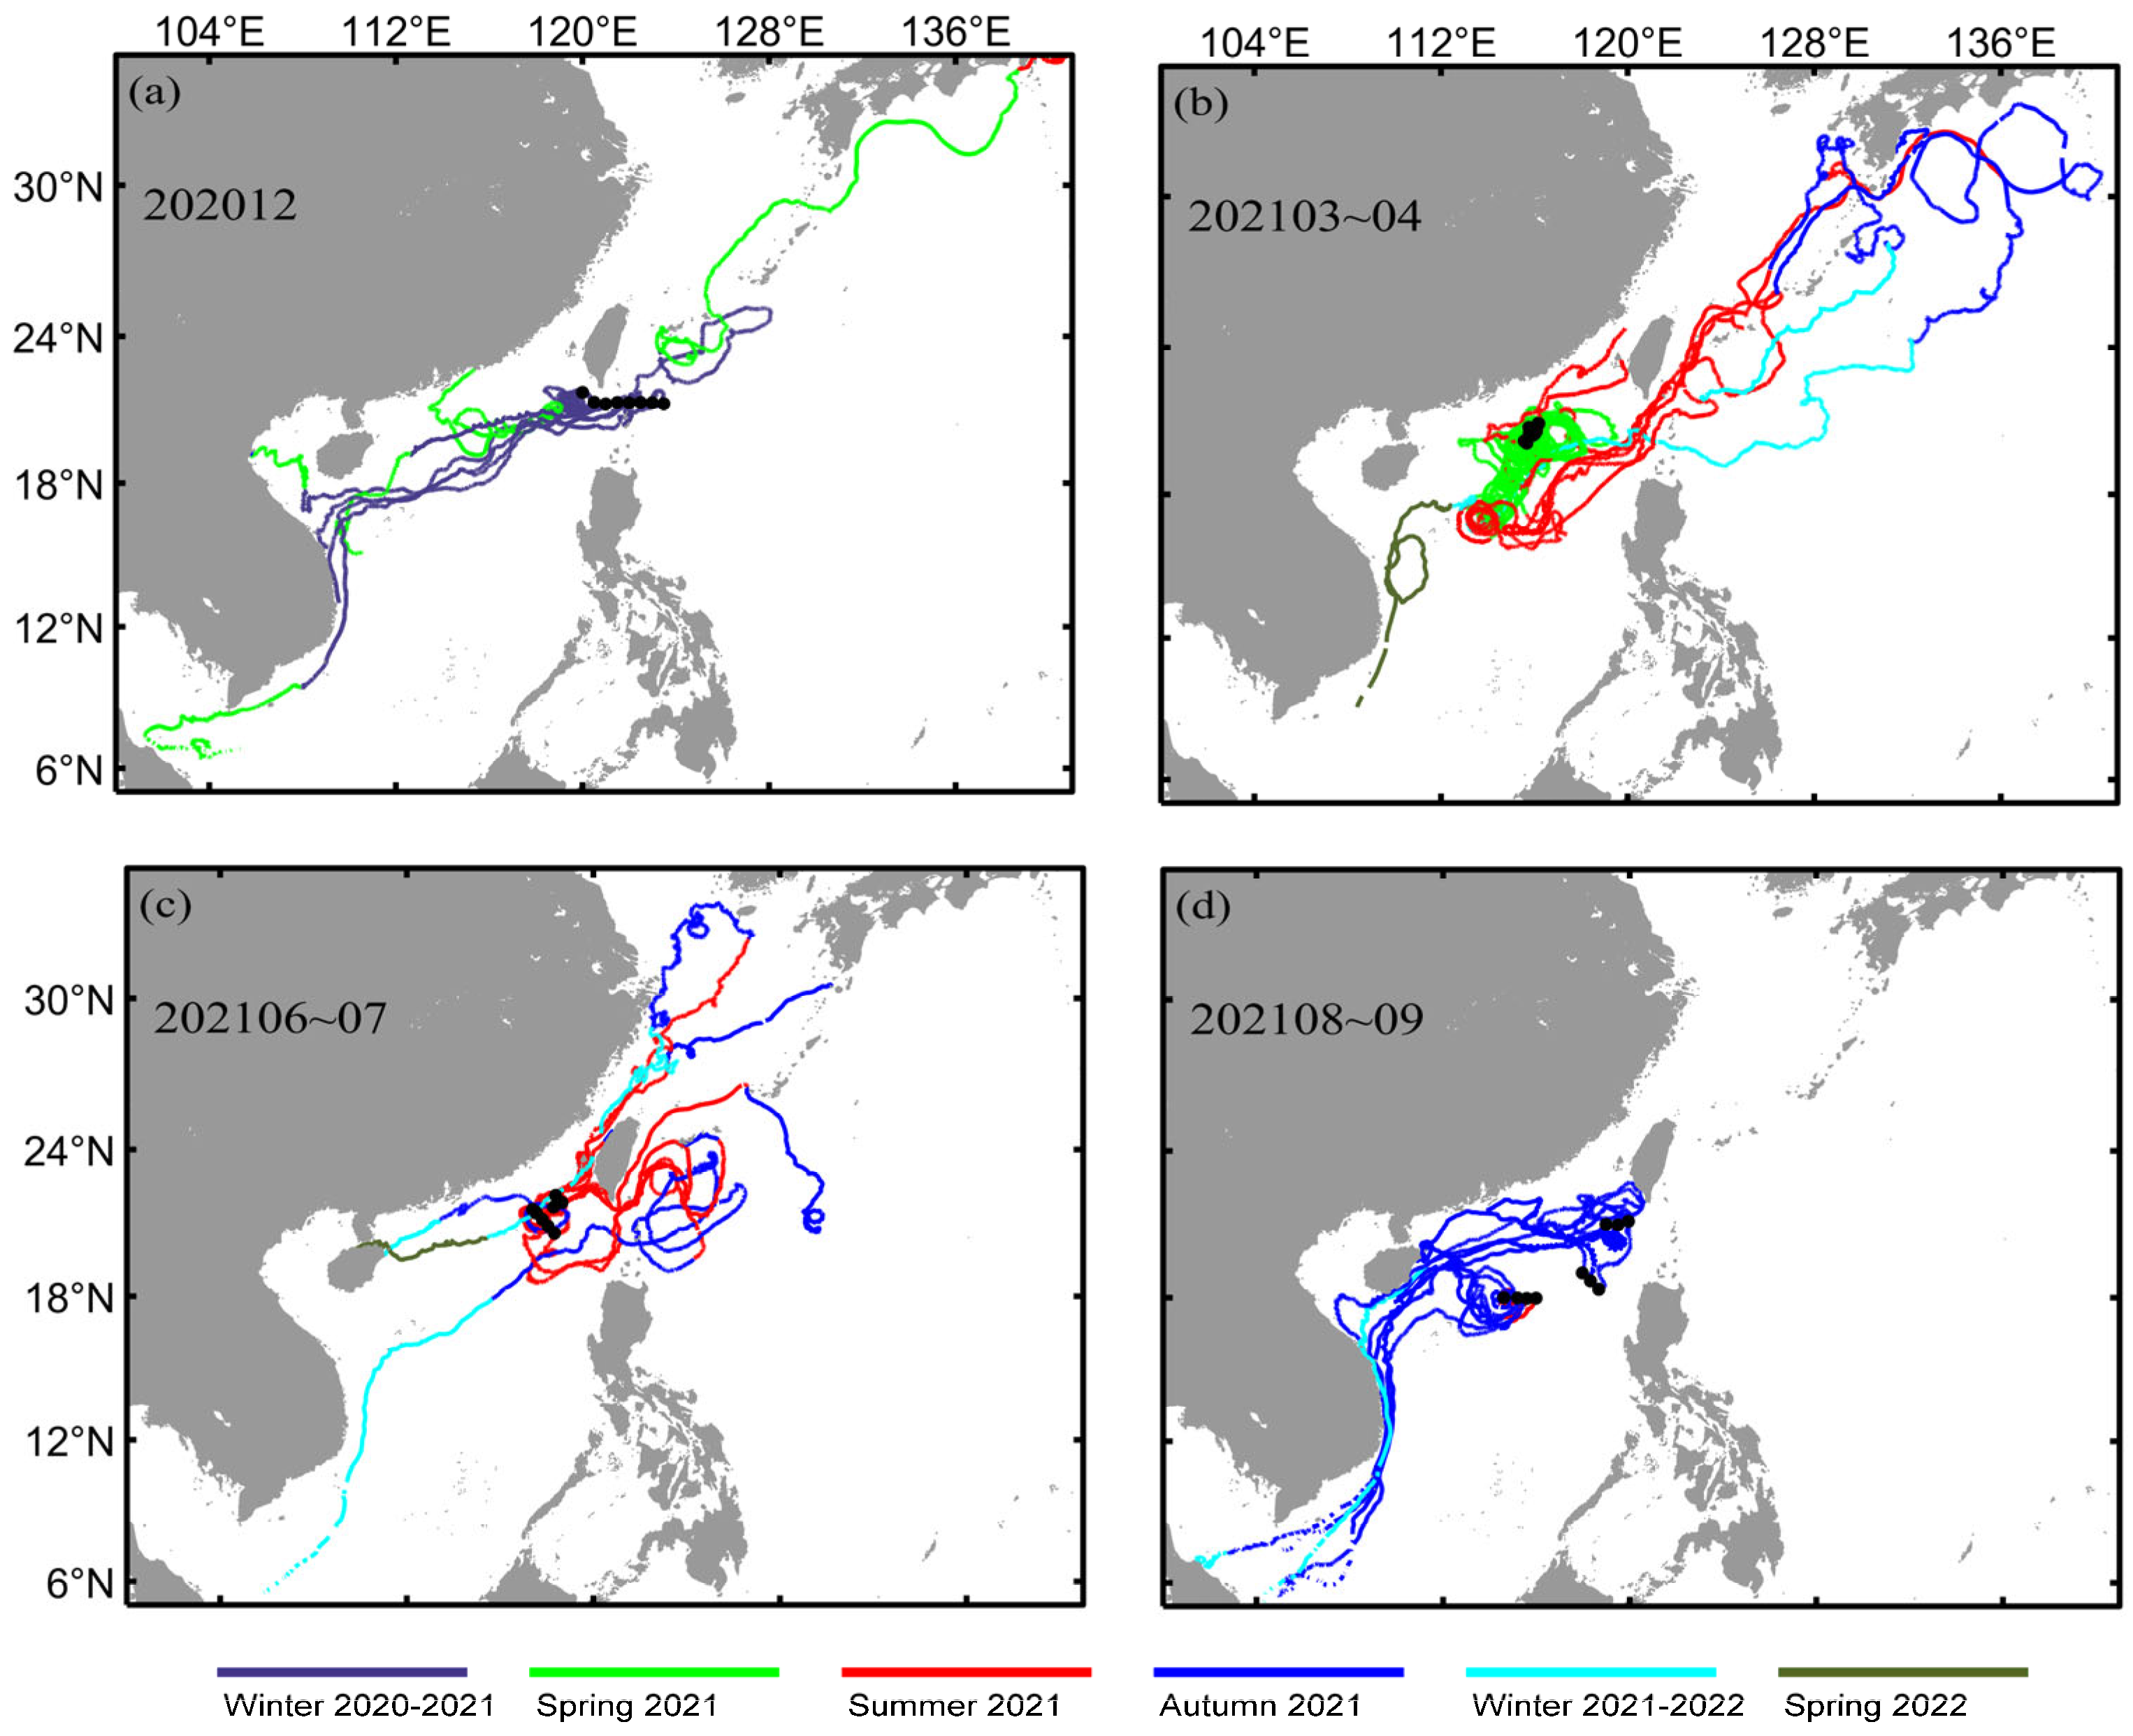
Between December 2020 and September 2021, four deployments of drifters were conducted. In December 2020, eight drifters were deployed. Subsequently, each of the remaining three deployments consisted of ten drifters. The primary deployment locations were predominantly in the northeastern SCS, where the LZS and the TWS facilitate water exchange between the SCS and adjacent seas. The drifter observational data underwent a two-step de-spiking procedure. Initially, positions located on land or associated with ships were discarded as invalid. Subsequently, unrealistic positions were identified and removed by applying velocity thresholds (>5 kt in the first pass, and >3 kt in a secondary pass); only those positions that satisfied both forward and backward checks were retained [38]. Figure 2 illustrates the number of drifters deployed in each of the four seasons and their corresponding trajectories. The legend in Figure 2 employs color coding to represent different seasons. It is important to note that the observed drifter trajectories frequently extended across multiple seasons, with some trajectories lasting for more than one year.
Both the reanalysis ocean current data and the satellite-derived sea surface height anomaly (SSHA) data are obtained from the Copernicus Marine Environment Monitoring Service (CMEMS, https://marine.copernicus.eu/, accessed on 19 February 2024). The reanalyzed current data have a spatial resolution of 1/12° × 1/12° and a daily temporal resolution. The SSHA data have a spatial resolution of 1/4° × 1/4°, and also include daily temporal resolution. In addition, this study utilizes ASCAT (Advanced Scatterometer) satellite-derived sea surface wind data from IFREMER (Institut Français de Recherche pour l’Exploitation de la Mer; ftp.ifremer.fr/ifremer/cersat/products/gridded/, accessed on 19 February 2024), which have a spatial resolution of 1/4° × 1/4° and a temporal resolution of 1 day.
The eddy dataset detected by the altimeter comes from the French satellite altimeter website (https://www.aviso.altimetry.fr/, accessed on 9 February 2022). The eddy data product used in this study is “META3.2 DT” [39,40,41]. The product is built upon the sea level anomaly (SLA) maps produced by the Copernicus Climate Change Service (C3S) and distributed in the C3S Climate Data Store. The eddy detection algorithm is based on the fact that closed contours of SLA correspond approximately to the streamlines of a geostrophic flow.

2.2. Methods

To compare the speeds of the drifters with the reanalyzed current speeds from the CMEMS, a comparative method was employed, the details of which are described as follows:
  • First, the daily average speed values along the drifter trajectories were calculated; subsequently, the average speeds for the first, middle, and last deciles (ten-day periods) of the month were derived from these daily values.
  • Given that the overall speed values from CMEMS are generally lower than those recorded by the drifters, an alternative approach was adopted for processing the CMEMS data. Specifically, for each day along the drifter trajectory, the maximum CMEMS speed value corresponding to that day was selected as the daily representative value. Based on these daily maxima, the average speeds for the first, middle, and last deciles of the month were subsequently calculated.
  • The results obtained from (1) and (2) were compared, as presented in Table 2 and Table 3.
To further investigate the interannual variations in the flow field, we employed an additional processing method based on the observed consistency between the speeds of the drifters and the reanalyzed speeds from the CMEMS. The specific procedure is as follows:
  • Averaging of winter CMEMS current fields: For each year, the CMEMS-reanalyzed current field was averaged over the months of January and February to represent the winter flow field.
  • Selection of consistent trajectories: Trajectory segments from the drifter data were selected based on consistency between drifter-derived speeds and CMEMS current speeds, following the methodology outlined above.
  • Extraction of daily representative speeds: For each consistent segment, CMEMS current speeds at the corresponding drifter positions were extracted. The maximum value within each segment was then selected as the representative daily speed, in accordance with the previously described method.
  • Computation of annual winter speed: The representative speeds obtained in step (3) were averaged to yield the annual mean winter current speed for each year.
This approach ensures that the selected data points are strictly collocated and grounded in the consistency between drifter and CMEMS velocities, thereby guaranteeing that the interannual winter analysis is both meaningful and comparable.
In addition, the calculation formula for the ageostrophic velocity of drifters within the eddy radius [31] is
U a u a , v a = U d u d , v d U g ( u g , v g )  
where Ud denotes the velocity of the drifter, Ug represents the geostrophic velocity derived through interpolation of altimetry data, and Ua signifies the ageostrophic velocity, with all velocities expressed in meters per second (m/s).
The calculation formula for the ageostrophic kinetic energy of drifters is:
A K E = 1 2 u a 2 +   v a 2
where AKE represents the ageostrophic kinetic energy (AKE), with units of (m2/s2).

3. Results

3.1. General Characteristics of the Seasonal Surface Current in the SCS

Figure 3 illustrates that the drifter trajectories are qualitatively consistent with the seasonal circulation patterns, with each panel corresponding to a specific season. Overall, the majority of the drifter trajectories qualitatively matches with the seasonal circulation and eddy patterns derived from the CMEMS in the SCS and its adjacent sea areas. During winter 2020 (Figure 3a), the strong northeast monsoon led to relatively straight trajectories, with most drifters from the northeastern SCS moving westward and southwestward before heading south in the western SCS. Notably, one drifter flowed toward the Northwest Pacific Ocean before changing direction to the southwest, while another remained within a warm eddy southwest of Taiwan Island. In spring (Figure 3b), the weakening wind field resulted in more chaotic drifter trajectories characterized by continuous turning and circling, indicative of mesoscale eddy activity. In summer (Figure 3c), the southwest monsoon notably influenced the trajectories, with some drifters moving northeastward toward the TWS and eventually reaching the East China Sea, while others initially flowed southward before joining the Kuroshio Current or being captured by nearby eddies. As the monsoon shifted in autumn, trajectories primarily converged into the reformed SCS Western Boundary Current (SCSWBC) and flowed southward. Trajectories originating from different deployment locations exhibited variations: some directly joined the SCSWBC from the central SCS, while others from the northeastern slope passed through the sea east of Hainan Island before ultimately merging into the SCSWBC (Figure 3d).
In fact, the observed drifter trajectories spanned multiple seasons, with some lasting over a year (Figure 2). To gain a further understanding of the seasonal water exchange in the SCS through the LZS and the TWS, we conducted individual analyses on long trajectory Drifters 1485580, 1485616, 1485620, and 1490024 (Figure 4). As illustrated in Figure 4, all four drifters were located within the SCS during the summer season and subsequently re-entered the SCS during either winter or autumn. Regarding their exit routes from the SCS, Drifters 1485580 and 1485616 exited through the LZS, Drifter 1485620 exited via the coastal waters off the southern part of Taiwan Island, and Drifter 1490024 exited through the TWS. In terms of their re-entry paths into the SCS, Drifters 1485580 and 1485620 re-entered through the LZS, while Drifter 1490024 re-entered via the same channel it had exited through, namely the TWS. Clearly, these trajectories illustrate the seasonal variations in water exchange between the SCS and its adjacent seas, and even the sea areas around Japan in the northwestern Pacific Ocean.
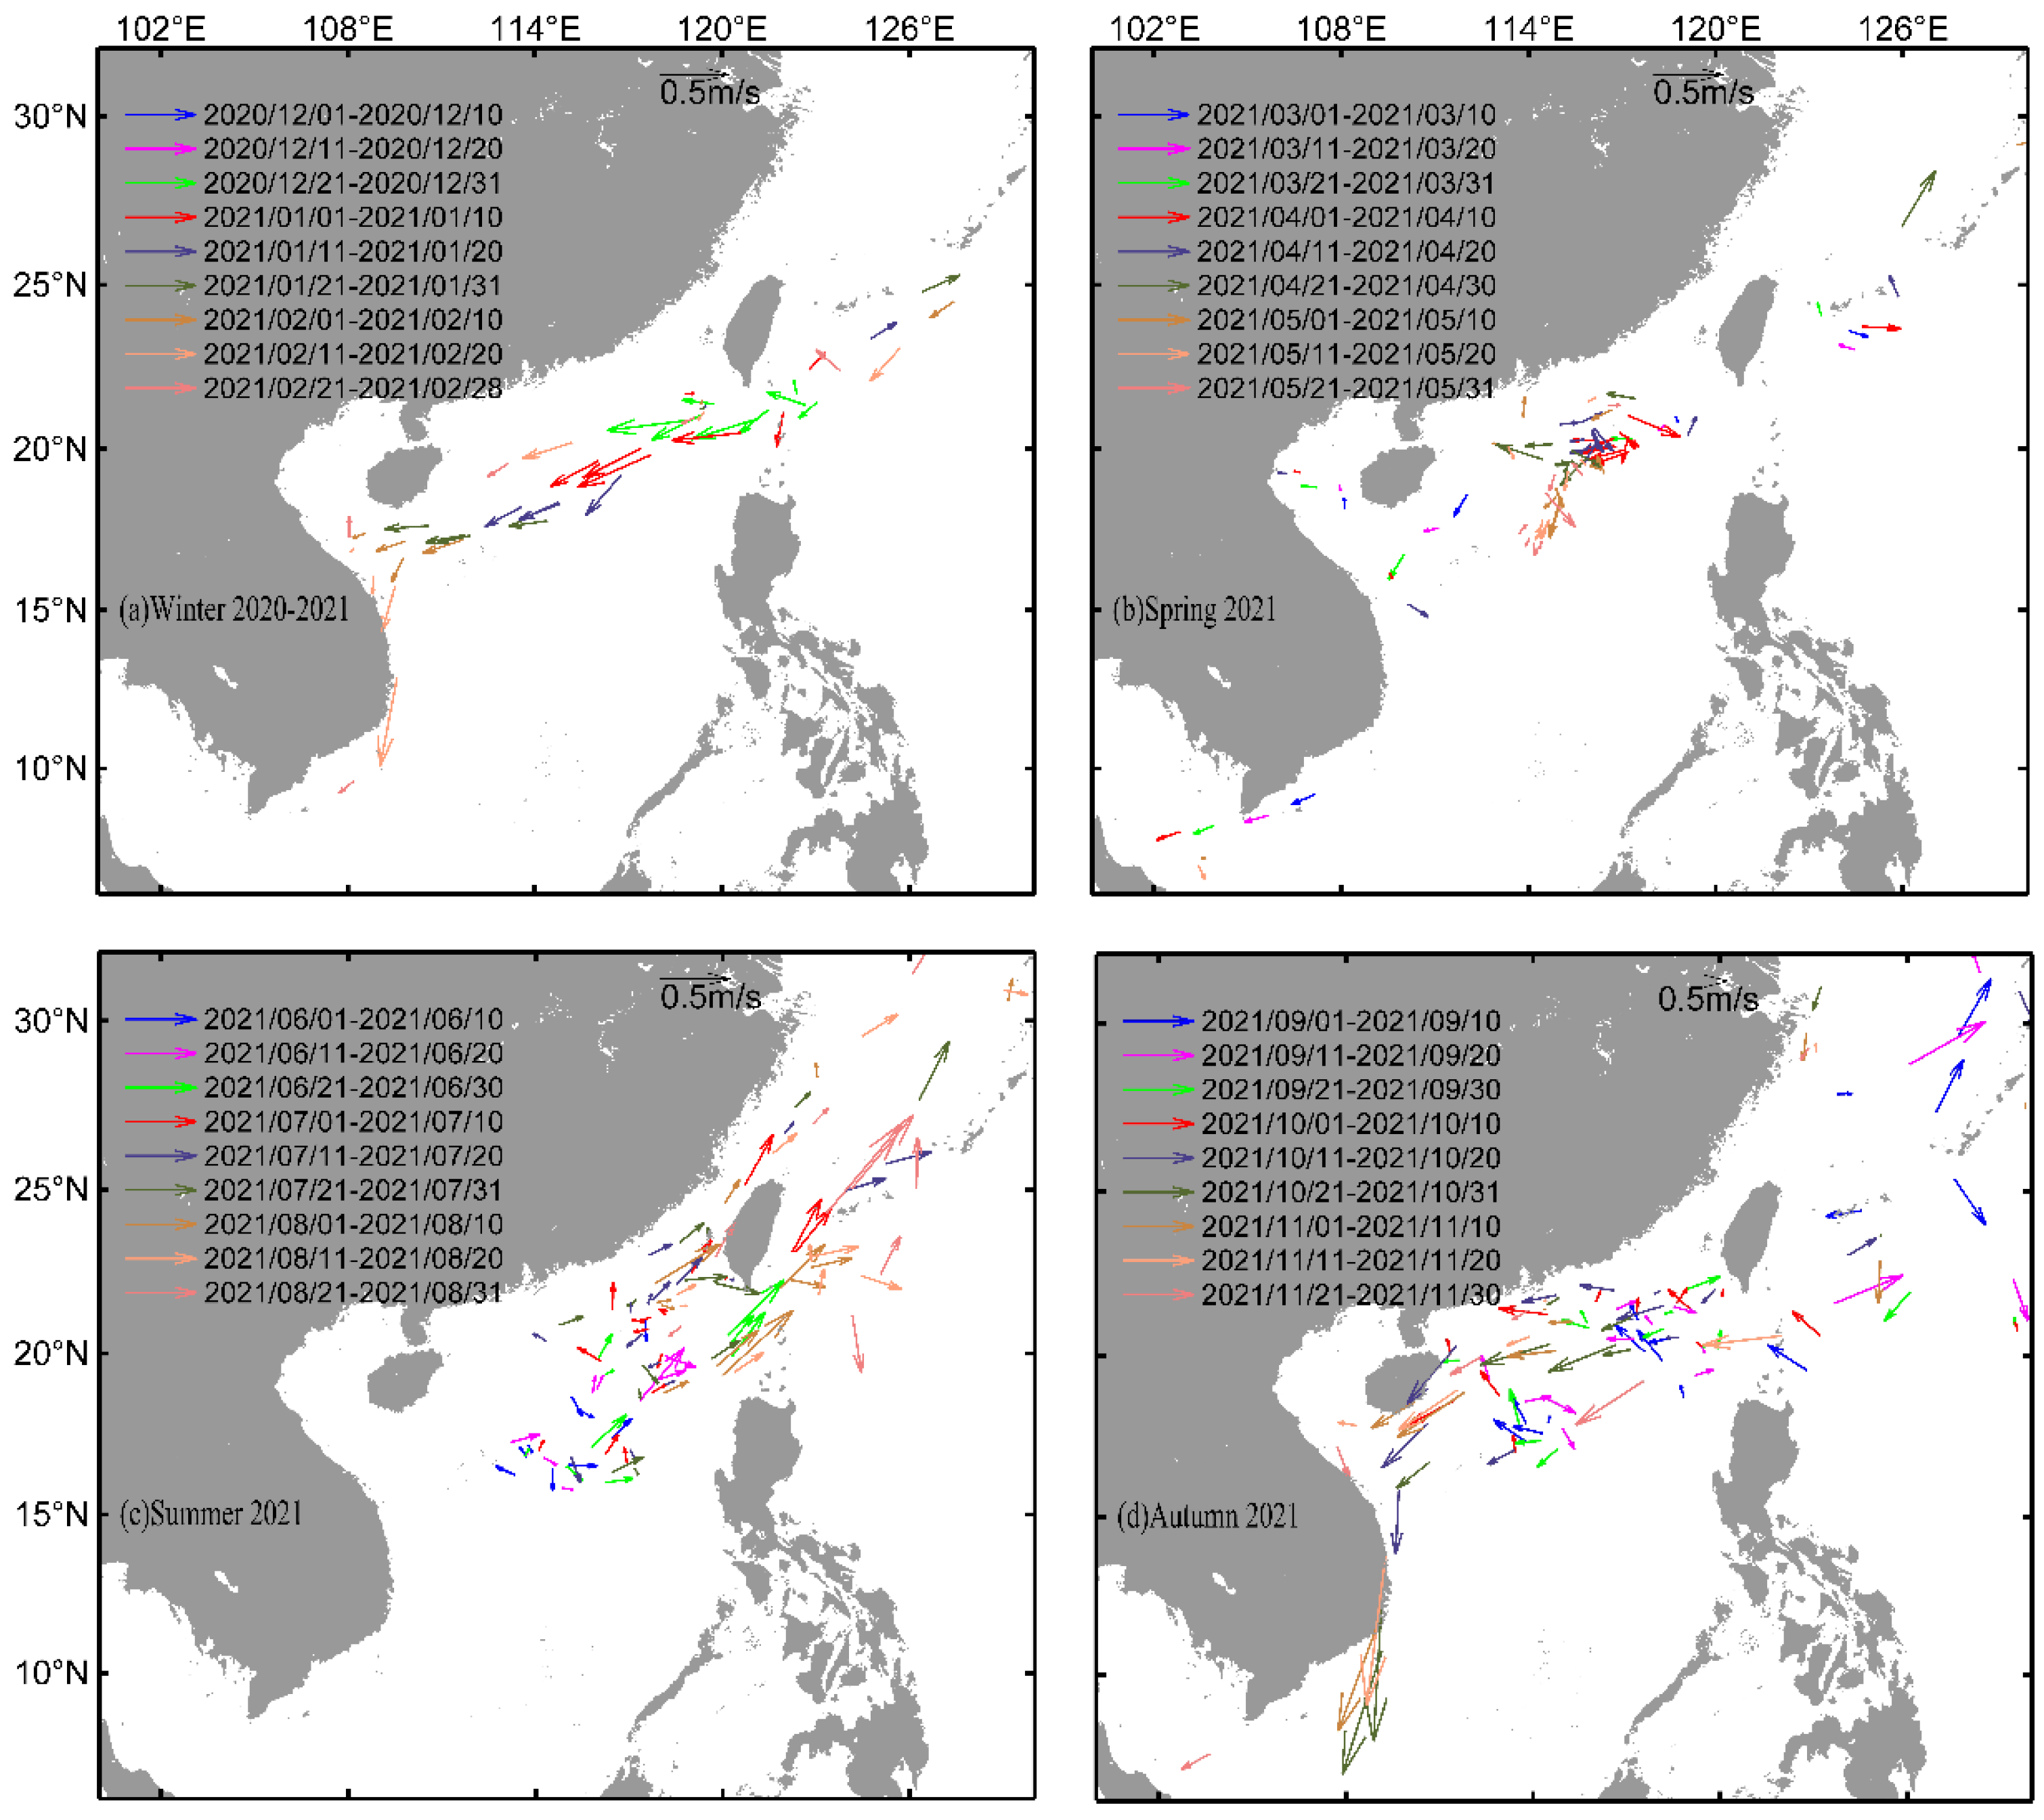
Figure 5 presents the average current speed distribution of the drifters during the first, middle, and last ten days of each month for the four seasons. Figure 5a shows a nearly southwestward current direction in the northern SCS during winter. The current speed within the Kuroshio intrusion region near the LZS reached 0.59 m/s between 21 December 2020 and 10 January 2021. For instance, during the period from 21–31 December 2020, current speeds within the intrusion region varied across different sea areas, ranging from 0.25 to 0.59 m/s. By the end of winter, particularly during the period from 21–28 February 2021, the current speed had weakened, while the coastal waters off northern Vietnam had already exhibited a northward flow. In spring (Figure 5b), the current speed and direction were variable, primarily due to the influence of eddies. In summer (Figure 5c), the current direction appeared to be influenced by eddies in the early stage, as evidenced by the variable directions observed. In the later stage, the current direction gradually stabilized, showing a predominant flow out of the SCS through the LZS and the TWS. However, significant temporal variability in current speeds persisted. Specifically, during June to August 2021, the current speed exiting the SCS through the LZS ranged from 0.25 to 0.70 m/s. Similarly, during July to August 2021, the current speed exiting the SCS through the TWS varied between 0.17 and 0.53 m/s. In autumn (Figure 5d), the monsoon winds began to shift, and the distribution of current vectors indicated that both flow speed and direction were highly variable during this period. Despite this variability, the currents ultimately converged into the SCSWBC in the western SCS.

3.2. Characteristics of the SCS Surface Current in Spring

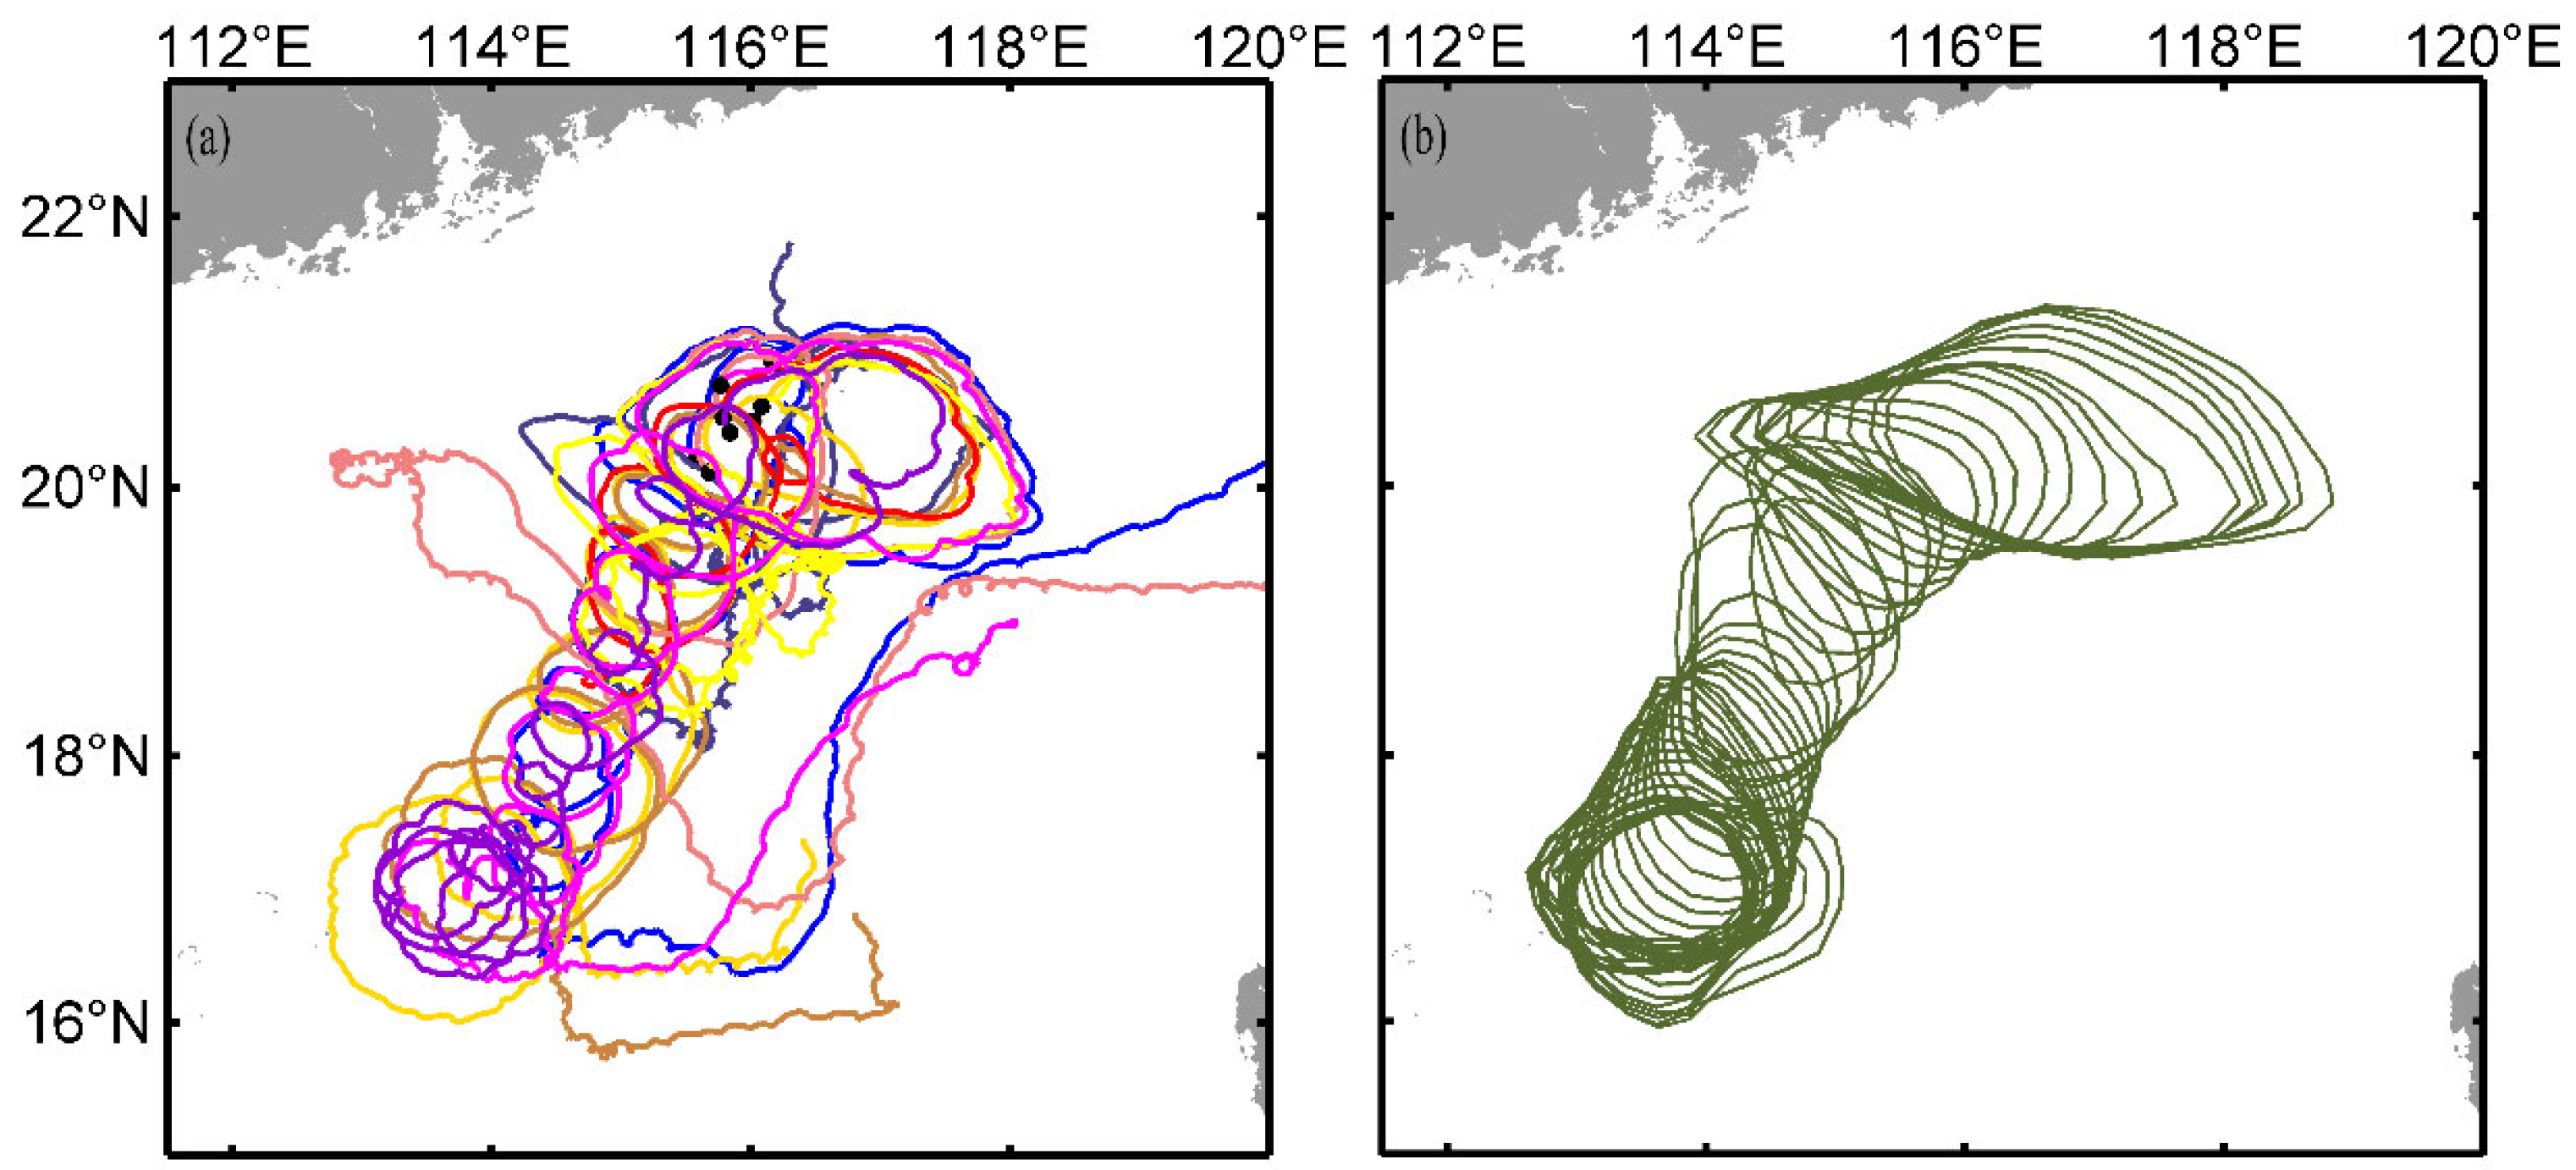
As evident from Figure 2a,b, Figure 3b and Figure 5b, the speed and movement direction of the drifters in spring exhibited significant variability, indicative of substantial eddy activity. Consequently, the correspondence between the drifter speed and the reanalyzed current speed was relatively poor. Figure 6 presents the trajectories of the drifters (Figure 6a) alongside the ensemble of the same eddy identified from altimeter data (Figure 6b; the dark green contours indicate the maximum geostrophic current speed associated with the eddy). As depicted in Figure 6, from 27 March to 8 July 2021, the overall movement direction of the drifters was consistent with that of the eddies detected by the altimeter. In the later stages of the eddy movement, drifters were successively shed from the eddy.
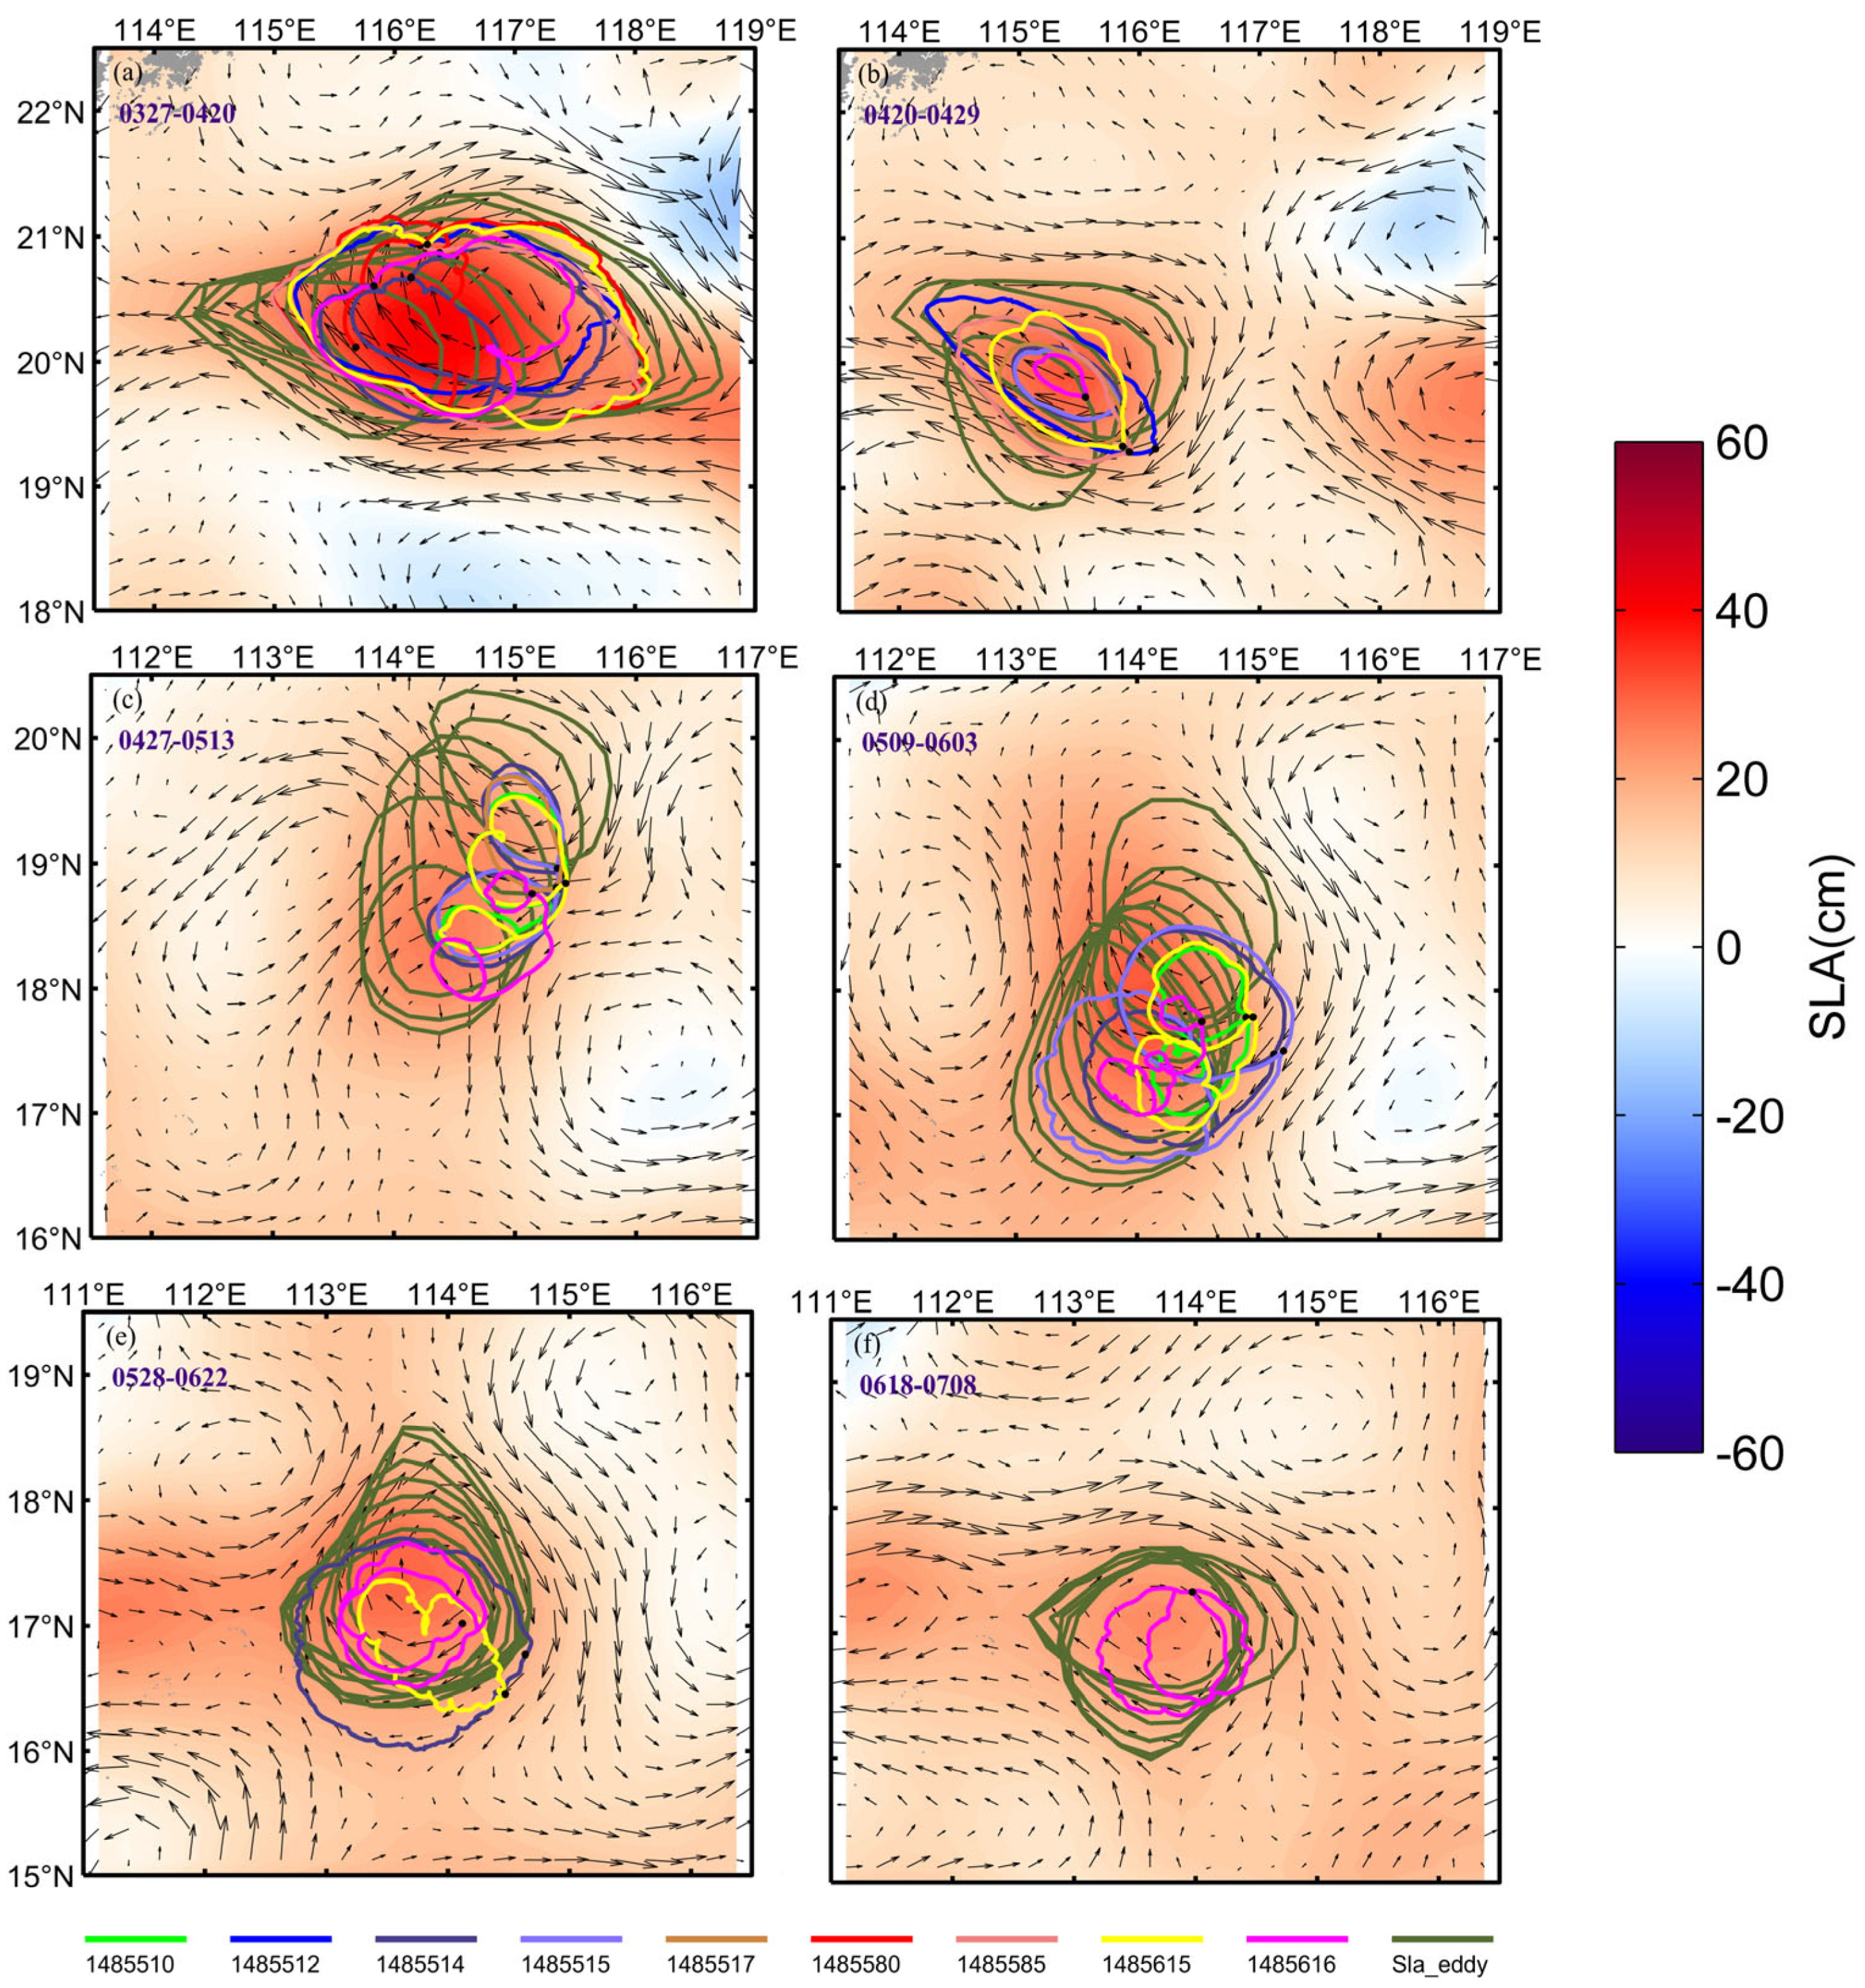
Figure 7 illustrates the drifter trajectories and ensemble of eddies detected by satellite altimeters over six distinct periods. These periods were defined based on the formation of closed trajectories by the drifters. As depicted in Figure 7, multiple drifters were entrained by the eddy, exhibiting distinct orbital patterns within the eddy structure. Collectively, these observations demonstrated the significant influence of eddies on the trajectories of drifters during the six periods examined. Notably, drifters, with their high-resolution sampling capabilities, were able to capture submesoscale signals [42]. Therefore, when combined with satellite altimetry data, drifters emerge as a powerful tool for studying both mesoscale eddies and submesoscale motions, particularly those characterized by AKE.
Table 1 summarizes the average eddy amplitude derived from altimeter data and the eddy’s AKE derived from drifter data using Equation (2) for the six defined periods. As indicated by Table 1, the first three periods exhibited larger eddy amplitudes, indicative of stronger eddies. These periods also displayed a clear weakening trend in eddy amplitude, accompanied by a concurrent increase in the average AKE measured by the drifters. The formation of eddies in the SCS is primarily driven by two mechanisms: (1) the intrusion and subsequent unstable detachment of the Kuroshio Current [43,44,45,46], and (2) the influence of local wind stress vorticity [47]. The more intense eddies observed during the first three periods were likely attributable to their closer proximity to the Kuroshio intrusion region. As the distance from the intrusion region increased, the eddy intensity gradually diminished, reflecting the declining influence of the Kuroshio Current on the eddy intensity. Research has demonstrated that submesoscale ageostrophic motions can effectively extract energy from mesoscale flows, driving an inverse energy cascade process [48,49]. This phenomenon may account for the concurrent reduction in eddy intensity and accumulation of AKE measured by Lagrangian drifters during the first three measurement periods. Compared to the initial three periods, the latter three periods displayed a consistent pattern of reduced eddy intensity and a progressive decline in eddy amplitude. However, the AKE measured by drifters remained relatively constant during these periods. During the transition from the third to the fourth period, a pronounced reduction in eddy intensity occurred simultaneously with a marked decline in AKE, representing a distinct departure from the established pattern of earlier periods. Tuo et al. (2023) [31] documented an evident shift in regional wind patterns commencing on 8 May, characterized by a reversal from prevailing northerly to southerly winds coupled with diminished wind speeds. Although submesoscale processes are known to modulate eddy intensity [50], extant research has demonstrated that background currents [51] and wind forcing [52] constitute equally critical determinants. These findings collectively suggest that the observed post-8 May modifications in both wind regimes and background circulation patterns likely constituted the primary mechanisms responsible for both the attenuation of eddy kinetic energy and the breakdown of the previously stable correlation between eddy intensity and AKE.

3.3. Characteristics of the SCS Surface Current in Summer

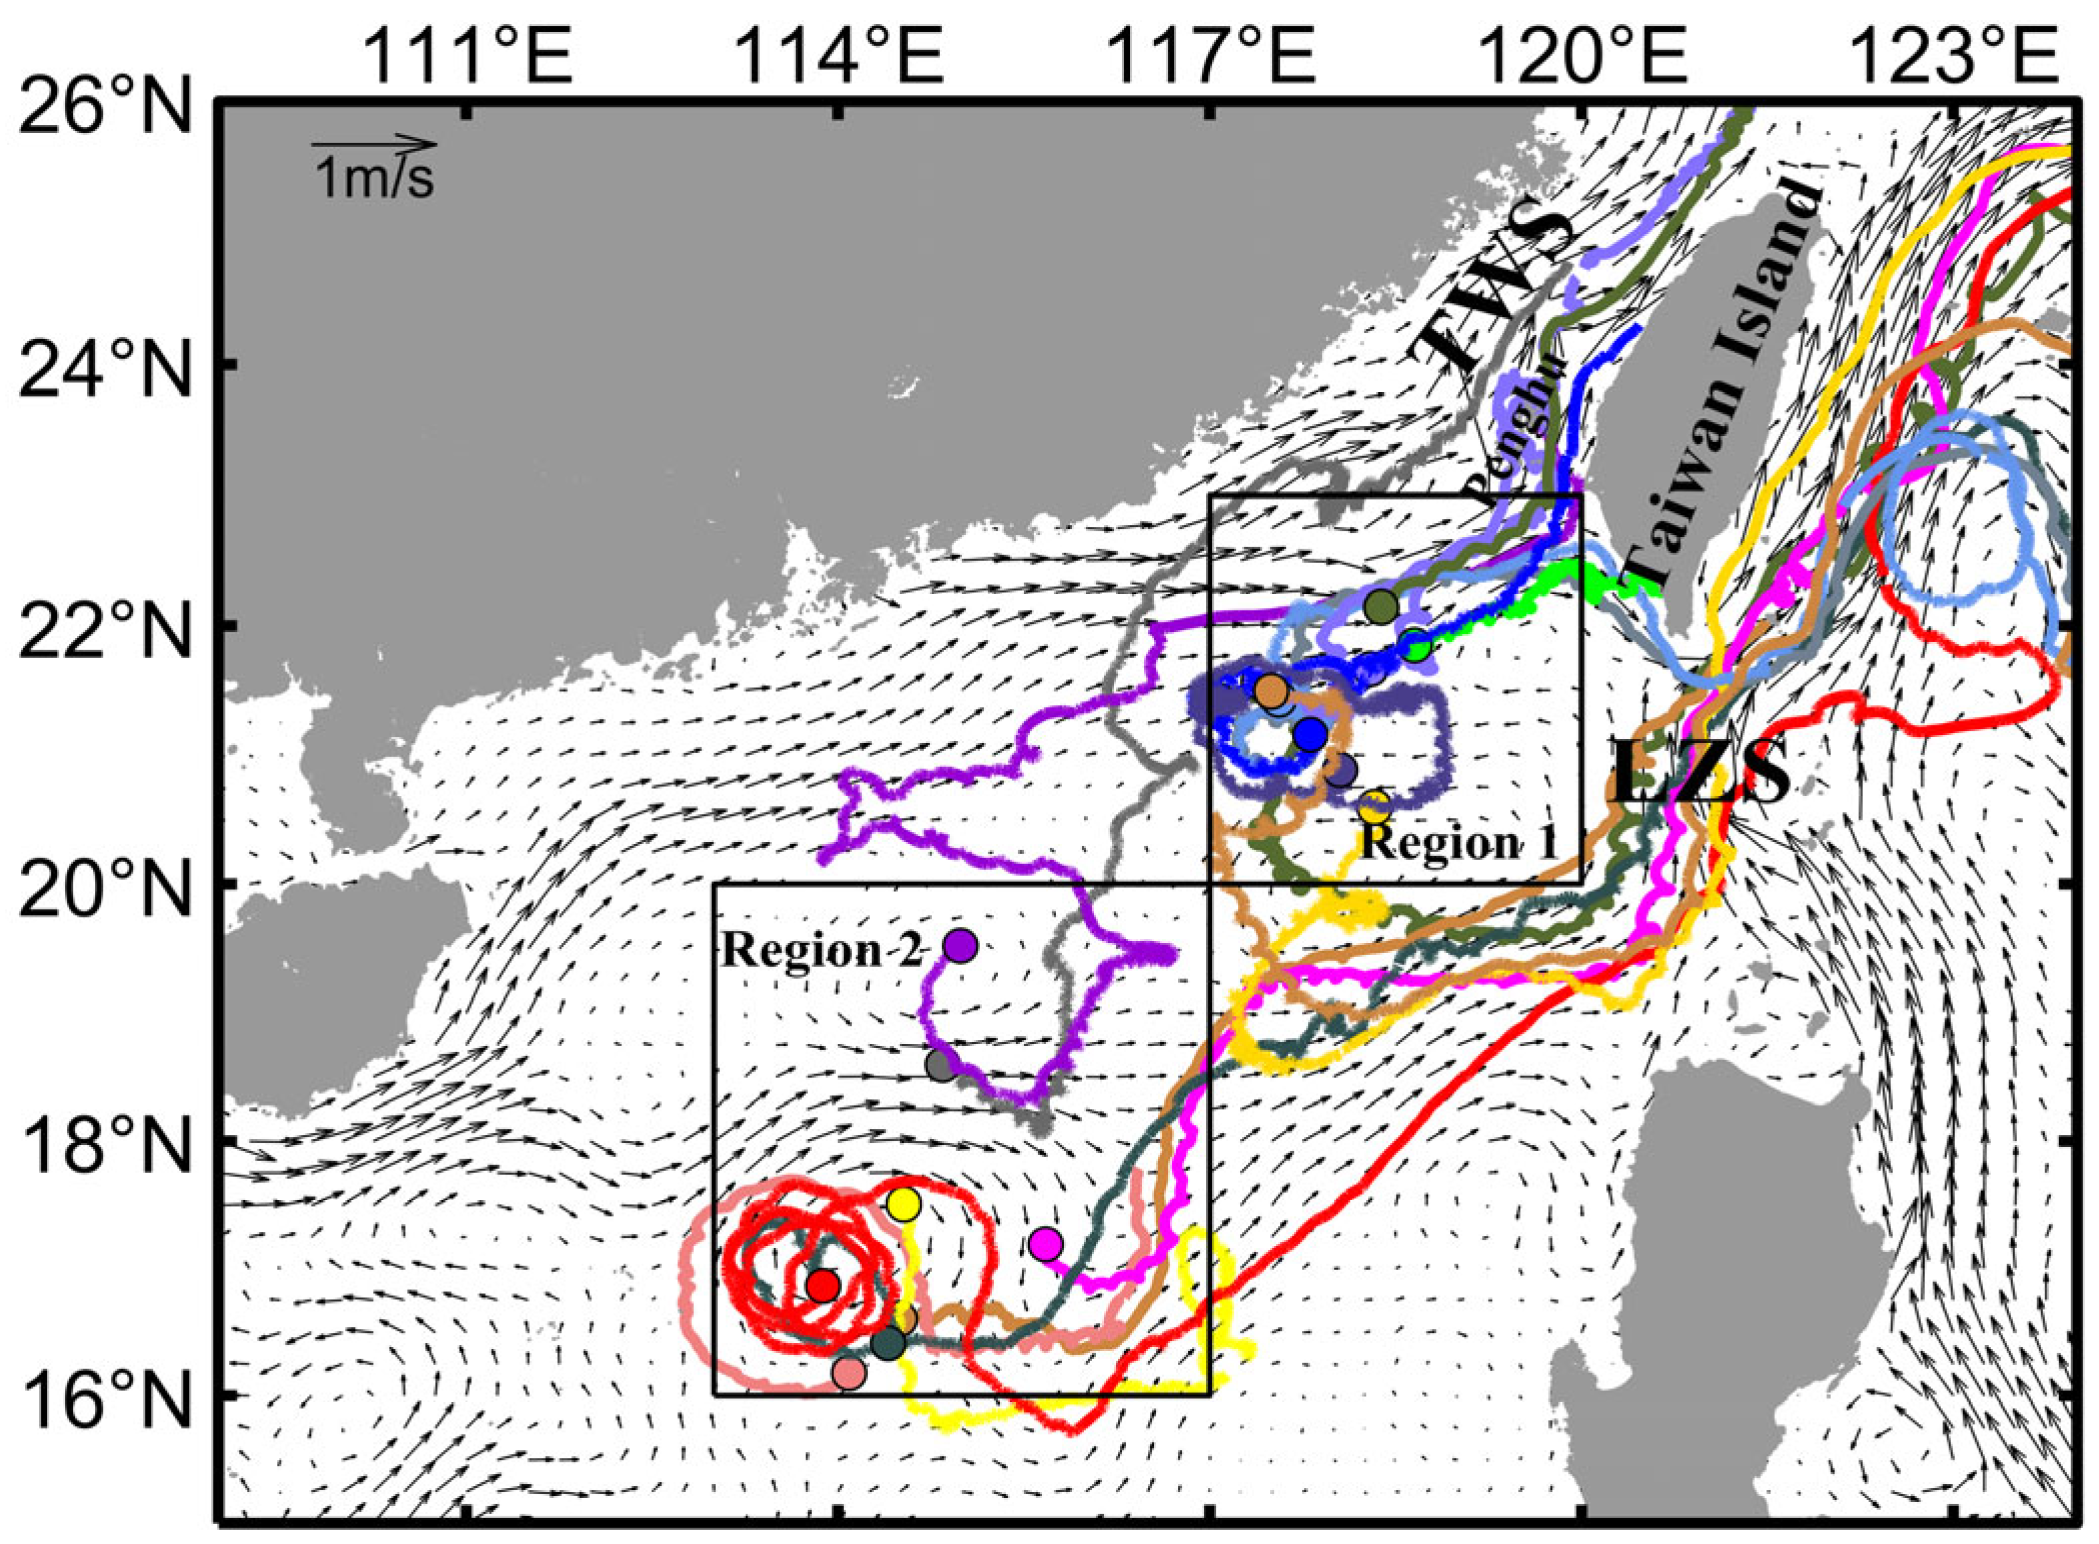
Figure 8 displays the trajectories of all drifters and the reanalyzed surface current field during the summer of 2021. The reanalyzed surface current field reveals the following features: (i) the establishment of a northeastward coastal flow along the mainland of China, (ii) an attenuated Kuroshio intrusion into the SCS, and (iii) the emergence of a northeastward current extending from (117° E, 17° N) to the central LZS region.
In Figure 8, the drifters exited the SCS through three primary pathways: the Penghu Channel in the eastern TWS, the coastal area off southern Taiwan Island, and the LZS. Based on the drifter release locations, two source regions were identified: Region 1 (20–23° N, 117–120° E) and Region 2 (16–20° N, 113–117° E). In Region 1, 11 drifters were deployed. The majority exited the SCS via the TWS or along the southern coast of Taiwan Island, while others drifted southward before turning northeastward through the LZS. One drifter remained trapped within an eddy. Notably, Lagrangian drifters deployed at similar initial positions exhibited divergent trajectories, indicating modulation by mesoscale eddies—a known mechanism for enhanced horizontal dispersion [53]. In Region 2, which included eight drifters, those north of 18° N primarily exited through the TWS, whereas those south of 18° N passed through the LZS. Multiple drifter trajectories exhibited clear signatures of eddy modulation during their initial phase of deployment. Compared to Region 1, the pathways in Region 2 were more consistent.
Table 2 presents a comparative analysis of mean summer velocity measurements derived from nine Lagrangian drifters and corresponding CMEMS-reanalyzed surface current data, based on the trajectories illustrated in Figure 9. The drifter ensemble exhibited three trajectory regimes: TWS-directed, LZS-directed, and eddy-modulated pathways. Over multiple 10-day periods, the speed differences between drifters and CMEMS reanalysis generally remained within ±0.06 m/s, indicating a high level of consistency (see Table 2). Six drifters maintained such agreement over two consecutive 10-day intervals. Spatially, the drifters are distributed across three characteristic regions: (1) the continental shelf of the northern SCS (e.g., Drifters 1485585, 1485622, 1485512); (2) the northeastern SCS influenced by Kuroshio intrusion (e.g., Drifters 1490030, 1485509, 1485615, and the latter trajectory of 1485580); and (3) an eddy-active zone in late spring (e.g., the early trajectories of Drifters 1485514 and 1485515).
Table 2. Comparison of the average speed of some drifters in summer and the corresponding flow speed from the CMEMS.
Drifter IDPeriodLongitude
(° E)
Latitude
(° N)
Average Speed of Drifter (m/s)Average Flow Speed from CMEMS (m/s)Speed Deviation (m/s)
148550911–20 June 2021118.139919.92790.27
[0.185, 0.351]
0.27
[0.195, 0.352]
0.00
148550921–30 June 2021120.211020.25240.31
[0.232, 0.394]
0.37
[0.315, 0.433]
−0.06
148551221–31 July 2021118.611823.38660.25
[0.138, 0.369]
0.22
[0.118, 0.330]
0.03
148551411–20 June 2021113.173417.24820.24
[0.099, 0.415]
0.29
[0.173, 0.431]
−0.05
148551421–30 June 2021114.972816.51650.18
[0.112, 0.271]
0.21
[0.158, 0.276]
−0.03
14855151–10 June 2021114.546916.44920.18
[0.094, 0.275]
0.20
[0.115, 0.292]
−0.02
148551521–30 June 2021116.233015.99610.23
[0.185, 0.272]
0.20
[0.167, 0.237]
0.03
14855801–10 June 2021116.429317.36410.23
[0.144, 0.346]
0.21
[0.121, 0.316]
0.02
148558011–20 June 2021117.780319.14480.27
[0.203, 0.348]
0.28
[0.206, 0.360]
−0.01
148558521–31 July 2021114.761420.86580.20
[0.106, 0.307]
0.24
[0.219, 0.271]
−0.04
14855851–10 August 2021117.833422.14630.59
[0.361, 0.860]
0.53
[0.347, 0.728]
0.06
148561511–20 July 2021118.168619.02340.08
[0.039, 0.149]
0.08
[0.042, 0.126]
0.00
148561521–31 July 2021119.648519.83710.27
[0.199, 0.341]
0.22
[0.169, 0.266]
0.05
148562211–20 July 2021118.524122.11470.30
[0.212, 0.417]
0.35
[0.269, 0.428]
−0.05
149003021–31 July 2021117.418619.65450.20
[0.145, 0.262]
0.14
[0.056, 0.253]
0.06
Note: Values in [ ] denote the 95% confidence interval.

3.4. Characteristics of the SCS Surface Current in Autumn

Figure 10 displays the drifter trajectories for autumn 2021 superimposed on the corresponding reanalyzed surface current field. The current field reveals three principal circulation features: (1) the SCSWBC flowing from the northern SCS continental shelf toward the area east of Hainan Island before continuing to Vietnamese coastal waters, (2) an anticyclonic eddy west of the Luzon Island, and (3) a dipole eddy structure in the western SCS, comprising adjacent cyclonic and anticyclonic eddies, with the SCSWBC exhibiting enhanced flow along the western flank of this eddy pair.
Analysis of the drifter trajectories reveals distinct spatial patterns in their flowing characteristics (Figure 10). The majority of drifters ultimately converged within the SCSWBC, while a minority terminated their trajectories near the coastal regions of Hainan and Guangdong. Based on deployment locations, the drifters segregated into two distinct geographical zones. In the first zone (16–19° N, 113–116° E) in the central and northern SCS, the four drifters deployed in this zone exhibited three characteristic pathway types influenced by early autumn mesoscale eddies: One drifter exhibited direct entrainment into the SCSWBC, two drifters demonstrated westward flowing along the Hainan Island before joining the SCSWBC, and another drifter terminated at the northeastern Hainan coastal zone. In the second zone (18–21.5° N, 117.5–120.5° E) in the northeastern SCS, seven drifters were deployed. In the southern part of this zone, three drifters exhibited distinct trajectories. The drifter with a blue trajectory (Figure 10) initially moved northwest, subsequently turned west, and eventually headed southward into the SCSWBC. The drifter with a purple trajectory (Figure 10) initially moved northward before shifting southwest and ultimately stopping along the eastern coast of Hainan. The drifter with a light blue trajectory (Figure 10) moved northward initially and then shifted westward into the SCSWBC. In the northern part of the second zone, four drifters were influenced by the Kuroshio intrusion. These drifters exhibited circular movement before drifting westward toward the Pearl River Estuary or southward into the intensified SCSWBC.

3.5. Characteristics of the SCS Surface Current in Winter

Figure 5 illustrates that the surface current speed and direction in the SCS remained relatively stable during winter. As shown in Table 3, a comparative analysis was conducted between the average speed of the drifters and the CMEMS surface current data. Notably, Drifters 1485506 and 1485518 exhibited consistent agreement with CMEMS estimates across multiple observation periods, with this correlation persisting for up to 40 days. In contrast, Drifters 1485505 and 1485508 showed shorter periods of agreement, lasting 20 days or less. During the observation period from January 11 to February 20, 2021, the velocity differences between Drifters 1485506/1485518 and the CMEMS data ranged from 0.03 to 0.09 m/s. A particularly significant deviation of 0.09 m/s was recorded for Drifter 1485518 between 1–10 February 2021, when it entered the SCSWBC. This discrepancy coincided with a directional shift in the SCSWBC from southwesterly to southerly, suggesting a potential causal relationship between the current regime transition and the observed velocity variation. The trajectories of these drifters are illustrated in Figure 11, depicting their southwestward movement from 11 January to 20 February 2021, followed by eventual integration into the SCSWBC system.
Table 3. Comparison of the average speed of some drifters in winter and the corresponding flow speed from the CMEMS.
Drifter IDPeriodLongitude (° E)Latitude (° N)Average Speed of Drifter (m/s)Average Flow Speed from CMEMS (m/s)Speed Deviation (m/s)
148550611–20 January 2021114.801018.30920.35
[0.293, 0.408]
0.38
[0.344, 0.419]
−0.03
148550621–31 January 2021111.771917.33820.33
[0.280, 0.372]
0.38
[0.347, 0.414]
−0.05
14855061–10 February 2021109.785116.64800.22
[0.137, 0.321]
0.25
[0.181, 0.321]
−0.03
148550611–20 February 2021109.577612.86400.74
[0.637, 0.852]
0.70
[0.624, 0.777]
0.04
148551811–20 January 2021116.764619.19720.43
[0.362, 0.493]
0.36
[0.259, 0.486]
0.07
148551821–31 January 2021114.399017.78080.31
[0.262, 0.364]
0.40
[0.333, 0.466]
−0.09
14855181–10 February 2021111.686117.19150.30
[0.244, 0.358]
0.25
[0.200, 0.308]
0.05
148551811–20 February 2021109.519715.74990.39
[0.257, 0.541]
0.34
[0.217, 0.479]
0.05
148550511–20 February 2021115.194120.19980.41
[0.332, 0.492]
0.38
[0.339, 0.413]
0.03
14855081–10 January 2021117.414720.01880.51
[0.389, 0.646]
0.49
[0.376, 0.598]
0.02
148550811–20 January 2021114.767218.35950.34
[0.276, 0.409]
0.37
[0.343, 0.406]
−0.03
Note: Values in [ ] denote the 95% confidence interval.

4. Discussion

The analysis presented above reveals distinct seasonal variations in the trajectories of drifters within the SCS, reflecting corresponding changes in the surface circulation throughout the year. However, the four seasonal deployments of Beidou drifters were confined to the northern SCS, leaving other regions unobserved. Although these drifters captured key characteristics of seasonal circulation variability, their spatial coverage was insufficient to represent the entire SCS basin. To address this limitation, future studies should implement a well-designed drifter deployment strategy that ensures comprehensive spatial coverage of the SCS. Such an approach would enhance the utility of drifters as a cost-effective observational tool for investigating surface circulation dynamics, including mesoscale and submesoscale eddies across the region.
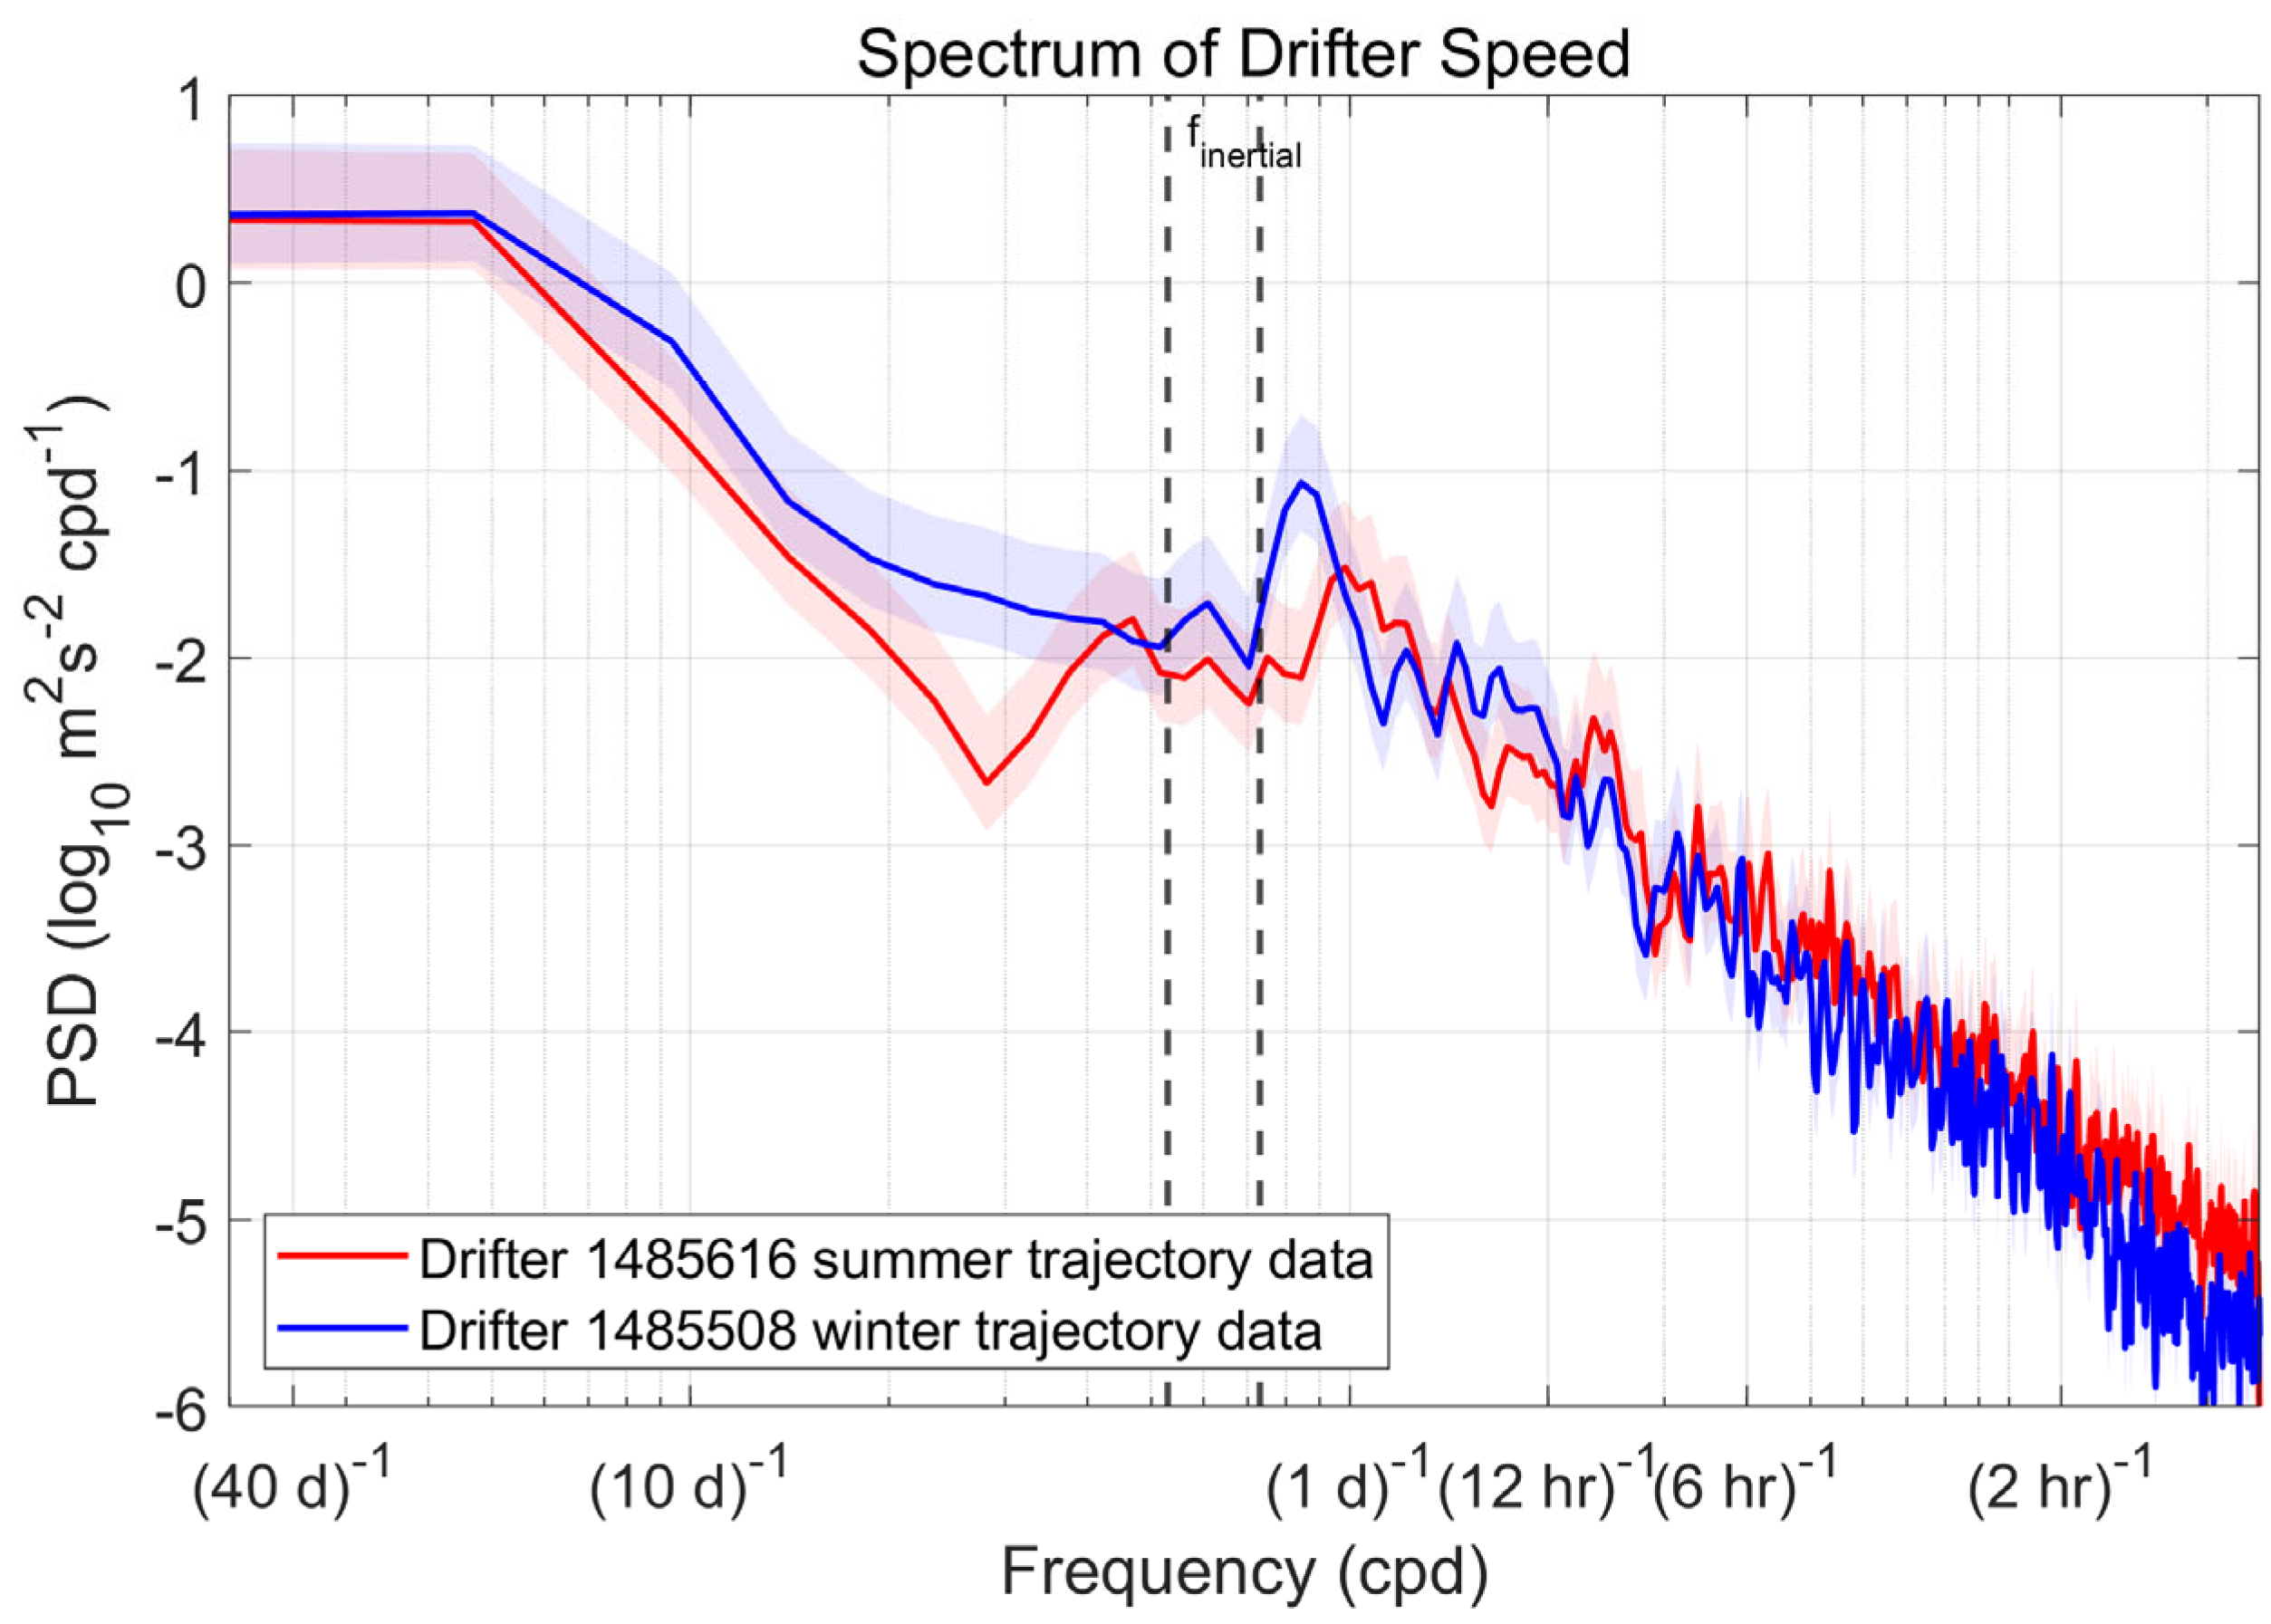
In addition to trajectory-based circulation patterns, the spectral characteristics of drifter velocities offer further insight into the dynamical processes governing surface flow variability in the SCS (Figure 12). Here, only two representative trajectories are selected for analysis, while a more comprehensive analysis of additional trajectories will be conducted in future work. As shown in Figure 12, the spectra exhibit enhanced energy in the low-frequency band (10–40 days), particularly during winter, highlighting the stronger influence of basin-scale circulation in this season. A distinct spectral peak is also evident near the diurnal band (~1 cpd), coinciding with the local inertial frequency and indicating intensified near-inertial oscillations during winter, likely sustained by seasonal wind forcing. At higher frequencies (> 2 cpd), however, the spectra of summer and winter converge, suggesting that short-period perturbations exert a largely season-independent influence on drifter motion.
To date, a comparative analysis has been conducted between drifter-derived average speeds and CMEMS-reanalyzed current speeds for both summer and winter periods. The results demonstrate a strong agreement between drifter observations and CMEMS data during the summer, with nine out of the analyzed drifters showing consistent patterns, including six drifters that maintained good agreement for periods up to 20 days. These well-correlated drifters were distributed across three distinct regions: the SCS continental shelf, the Kuroshio intrusion zone, and areas influenced by late spring eddies. This spatial distribution clearly indicates the dominant influences of topographic effects, Kuroshio dynamics, and mesoscale eddies on surface current patterns. However, a comprehensive understanding of interannual variability in the summertime surface current requires systematic consideration of these influencing factors, warranting further investigation in future studies. During winter, two drifters exhibited particularly strong agreement with CMEMS data, maintaining consistent correlations for extended periods of up to 40 days. Based on these findings, the winter analysis will focus on time periods demonstrating robust correspondence between long-duration drifter trajectories and CMEMS current speeds to examine interannual variations in the SCS surface current in winter.

4.1. Interannual Variation in the SCS Surface Current in Winter
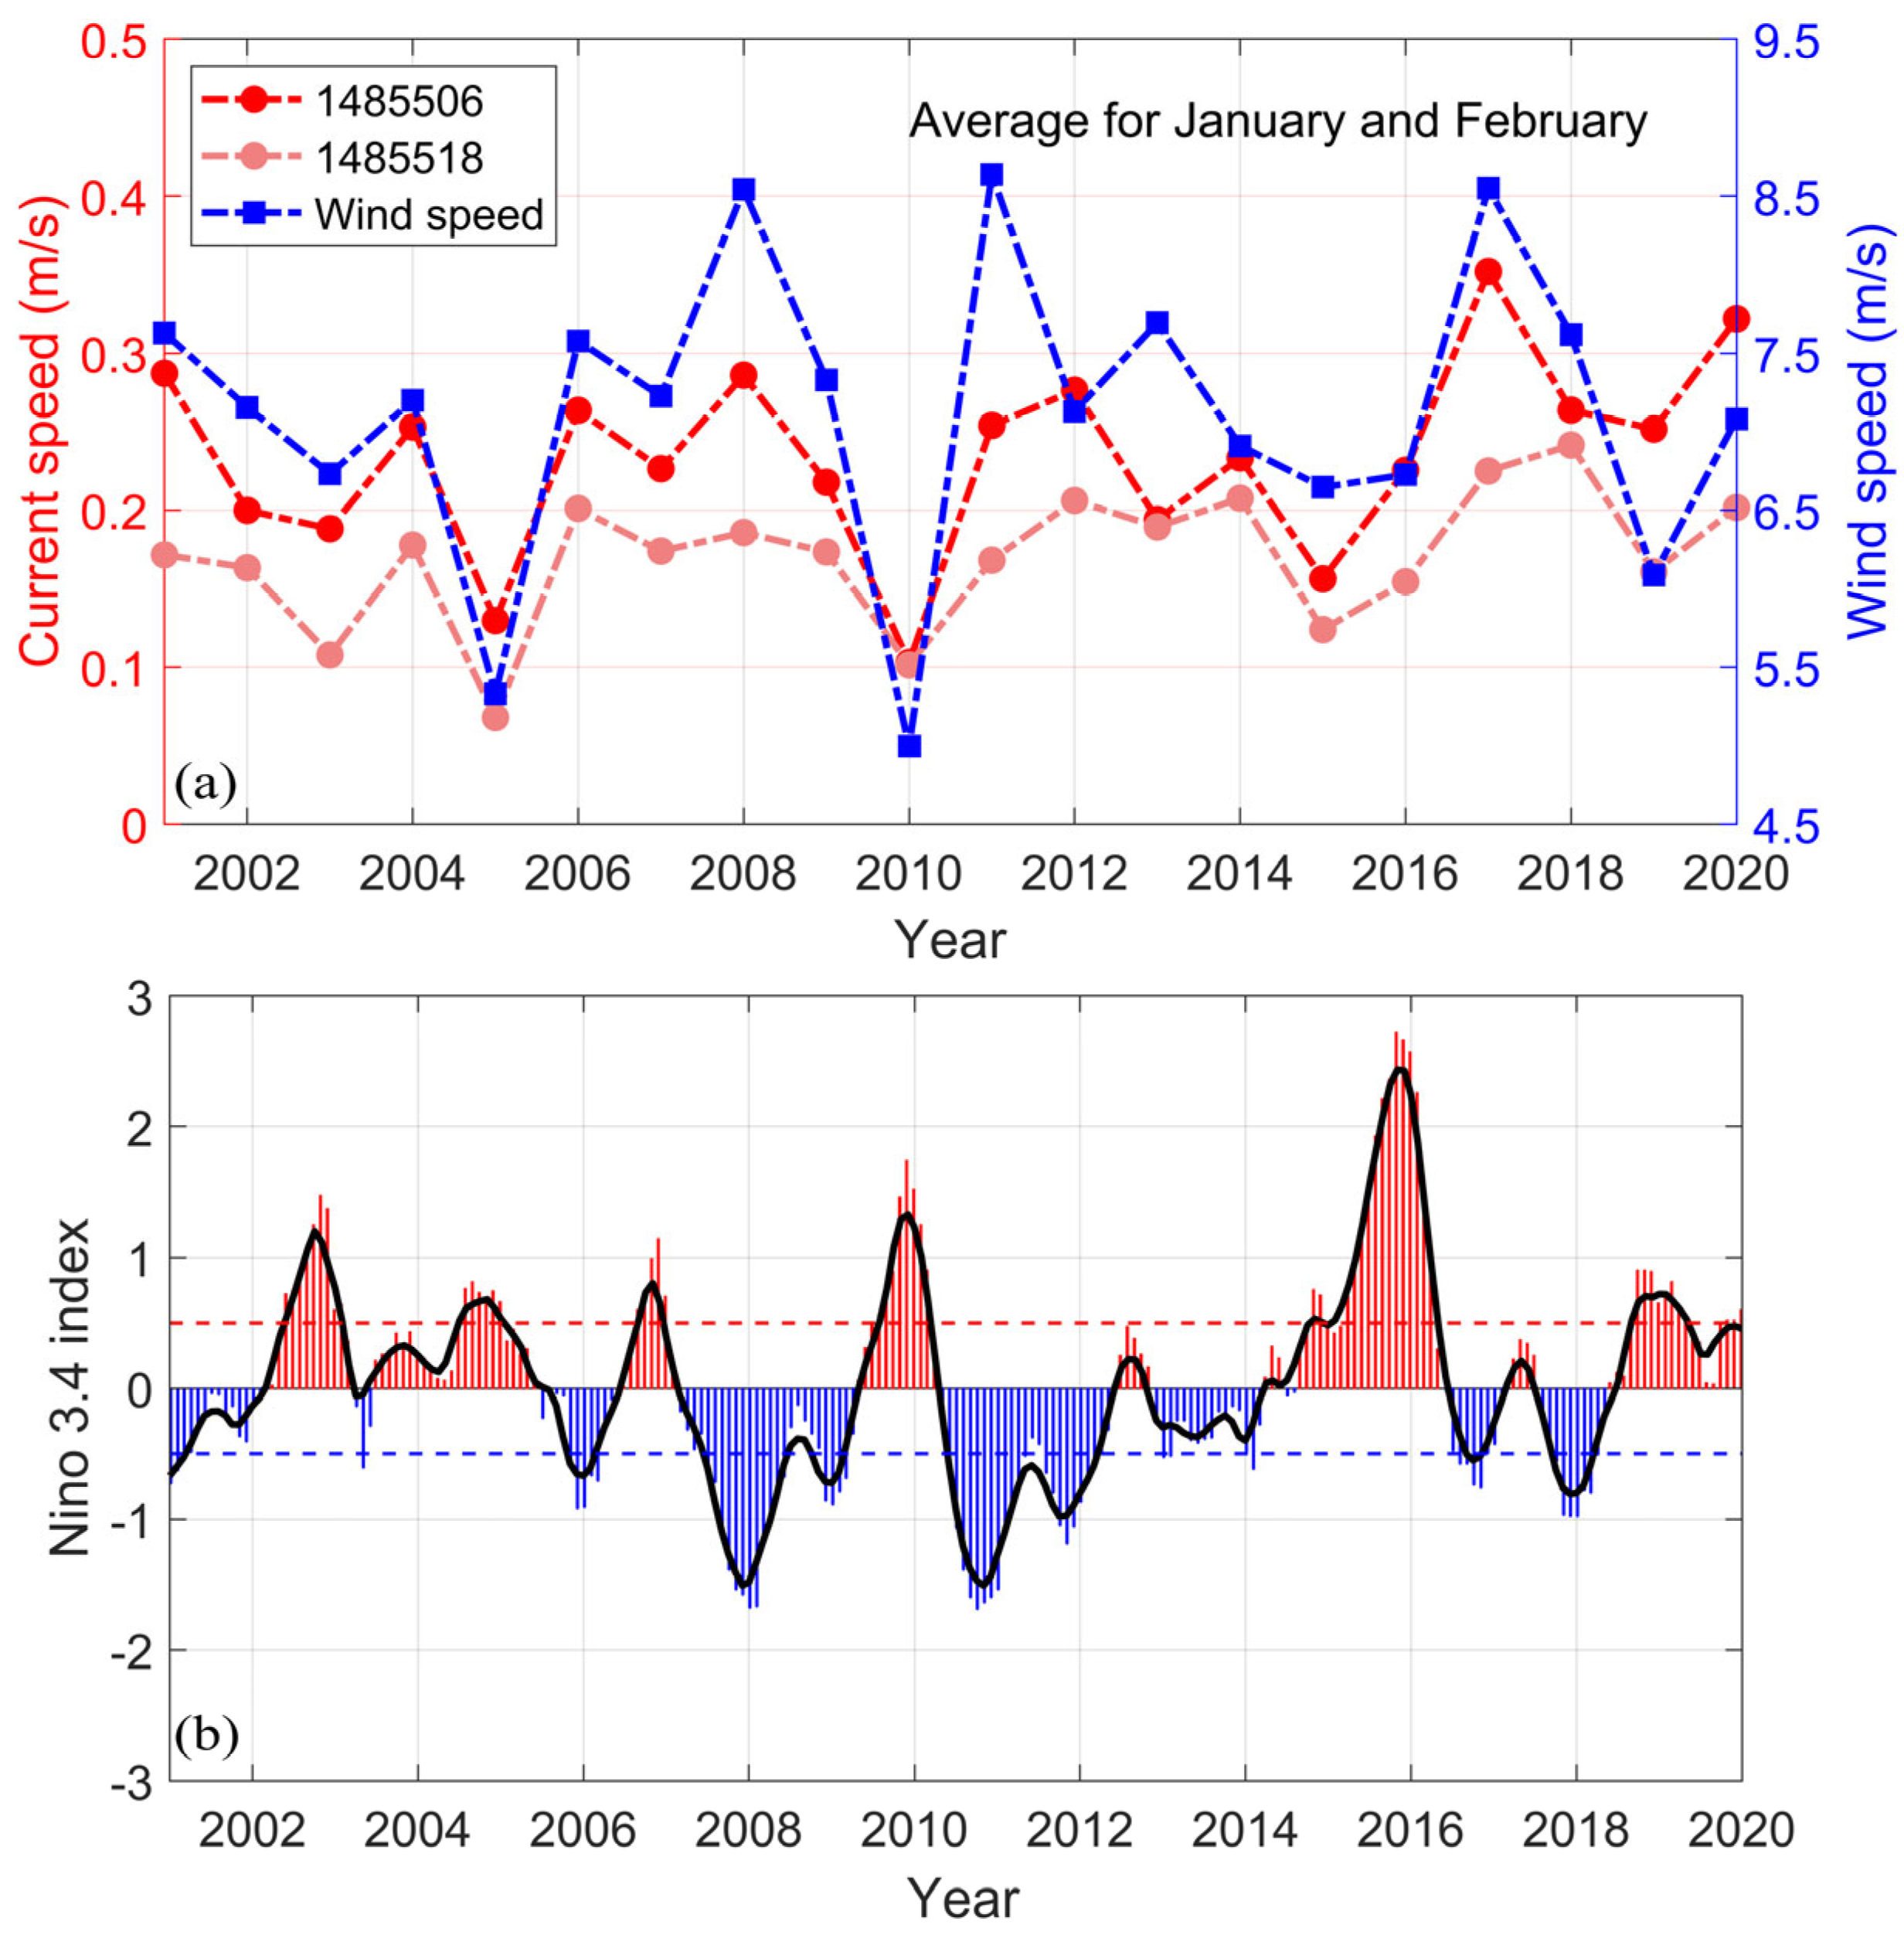
Figure 11 and Table 3 illustrate a strong correspondence between the trajectories of Drifters 1485506 and 1485518 and the reanalyzed current field during the continuous observation period from 11 January to 20 February 2021. The winter trajectories reveal a consistent southwestward drift pattern from the northeastern SCS to the area south of Hainan Island, where the drifters merged with the SCSWBC before continuing southward along the western SCS. For the analysis of interannual variability, we utilize the trajectory points from these two winter drifters and extract corresponding CMEMS current speed data for the same locations across multiple years. The detailed methodology for this analysis is presented in the Methods section above.
Figure 13 presents the average winter current speed corresponding to the trajectory points of two drifters, along with the area-averaged wind speed (Figure 13a) and Niño 3.4 index variations (Figure 13b) from 2001 to 2020. Figure 13a illustrates the temporal variations in average current speed and wind speed during January and February. The interannual variability patterns of the two drifters’ average speeds exhibit remarkable consistency. Notably, Drifter 1485506 recorded higher speeds than Drifter 1485518, as its trajectory encompassed the strong current region of the SCSWBC in the western SCS (Figure 11). As shown in Figure 13a, winters with larger current speeds occurred in 2001, 2008, 2012, 2017, and 2020, whereas years with smaller speeds included 2003, 2005, 2010, and 2015. The blue line in Figure 13a represents the average wind speed, derived from spatial averaging within the blue dashed box in Figure 11. Except for 2012 and 2013, wind speed variations generally align with those of current speed. Figure 13b displays the Niño 3.4 index, with red and blue dashed lines indicating the ±0.5 °C thresholds. A clear relationship emerges: when the Niño 3.4 index reached a positive-phase peak exceeding 0.5 °C, both wind speed and current speed tended to reach minimum values (e.g., 2003, 2005, 2007, 2010, 2015, and 2019). Conversely, during negative-phase troughs where the index fell below −0.5 °C, maximum wind and current speeds were typically observed (e.g., 2001, 2006, 2008, 2011, and 2018).
Figure 13. Time series of the current speed corresponding to the trajectory points and the wind speed averaged for January and February (a), and Niño 3.4 index (b). The black line in (b) is the Butterworth low-pass filter of the Niño 3.4 index, the red dashed line is 0.5 °C, and the blue dashed line is −0.5 °C. The Niño 3.4 index is from https://psl.noaa.gov/data/correlation/nina34.anom.data, accessed on 1 March 2025.
Oceans 06 00058 g013
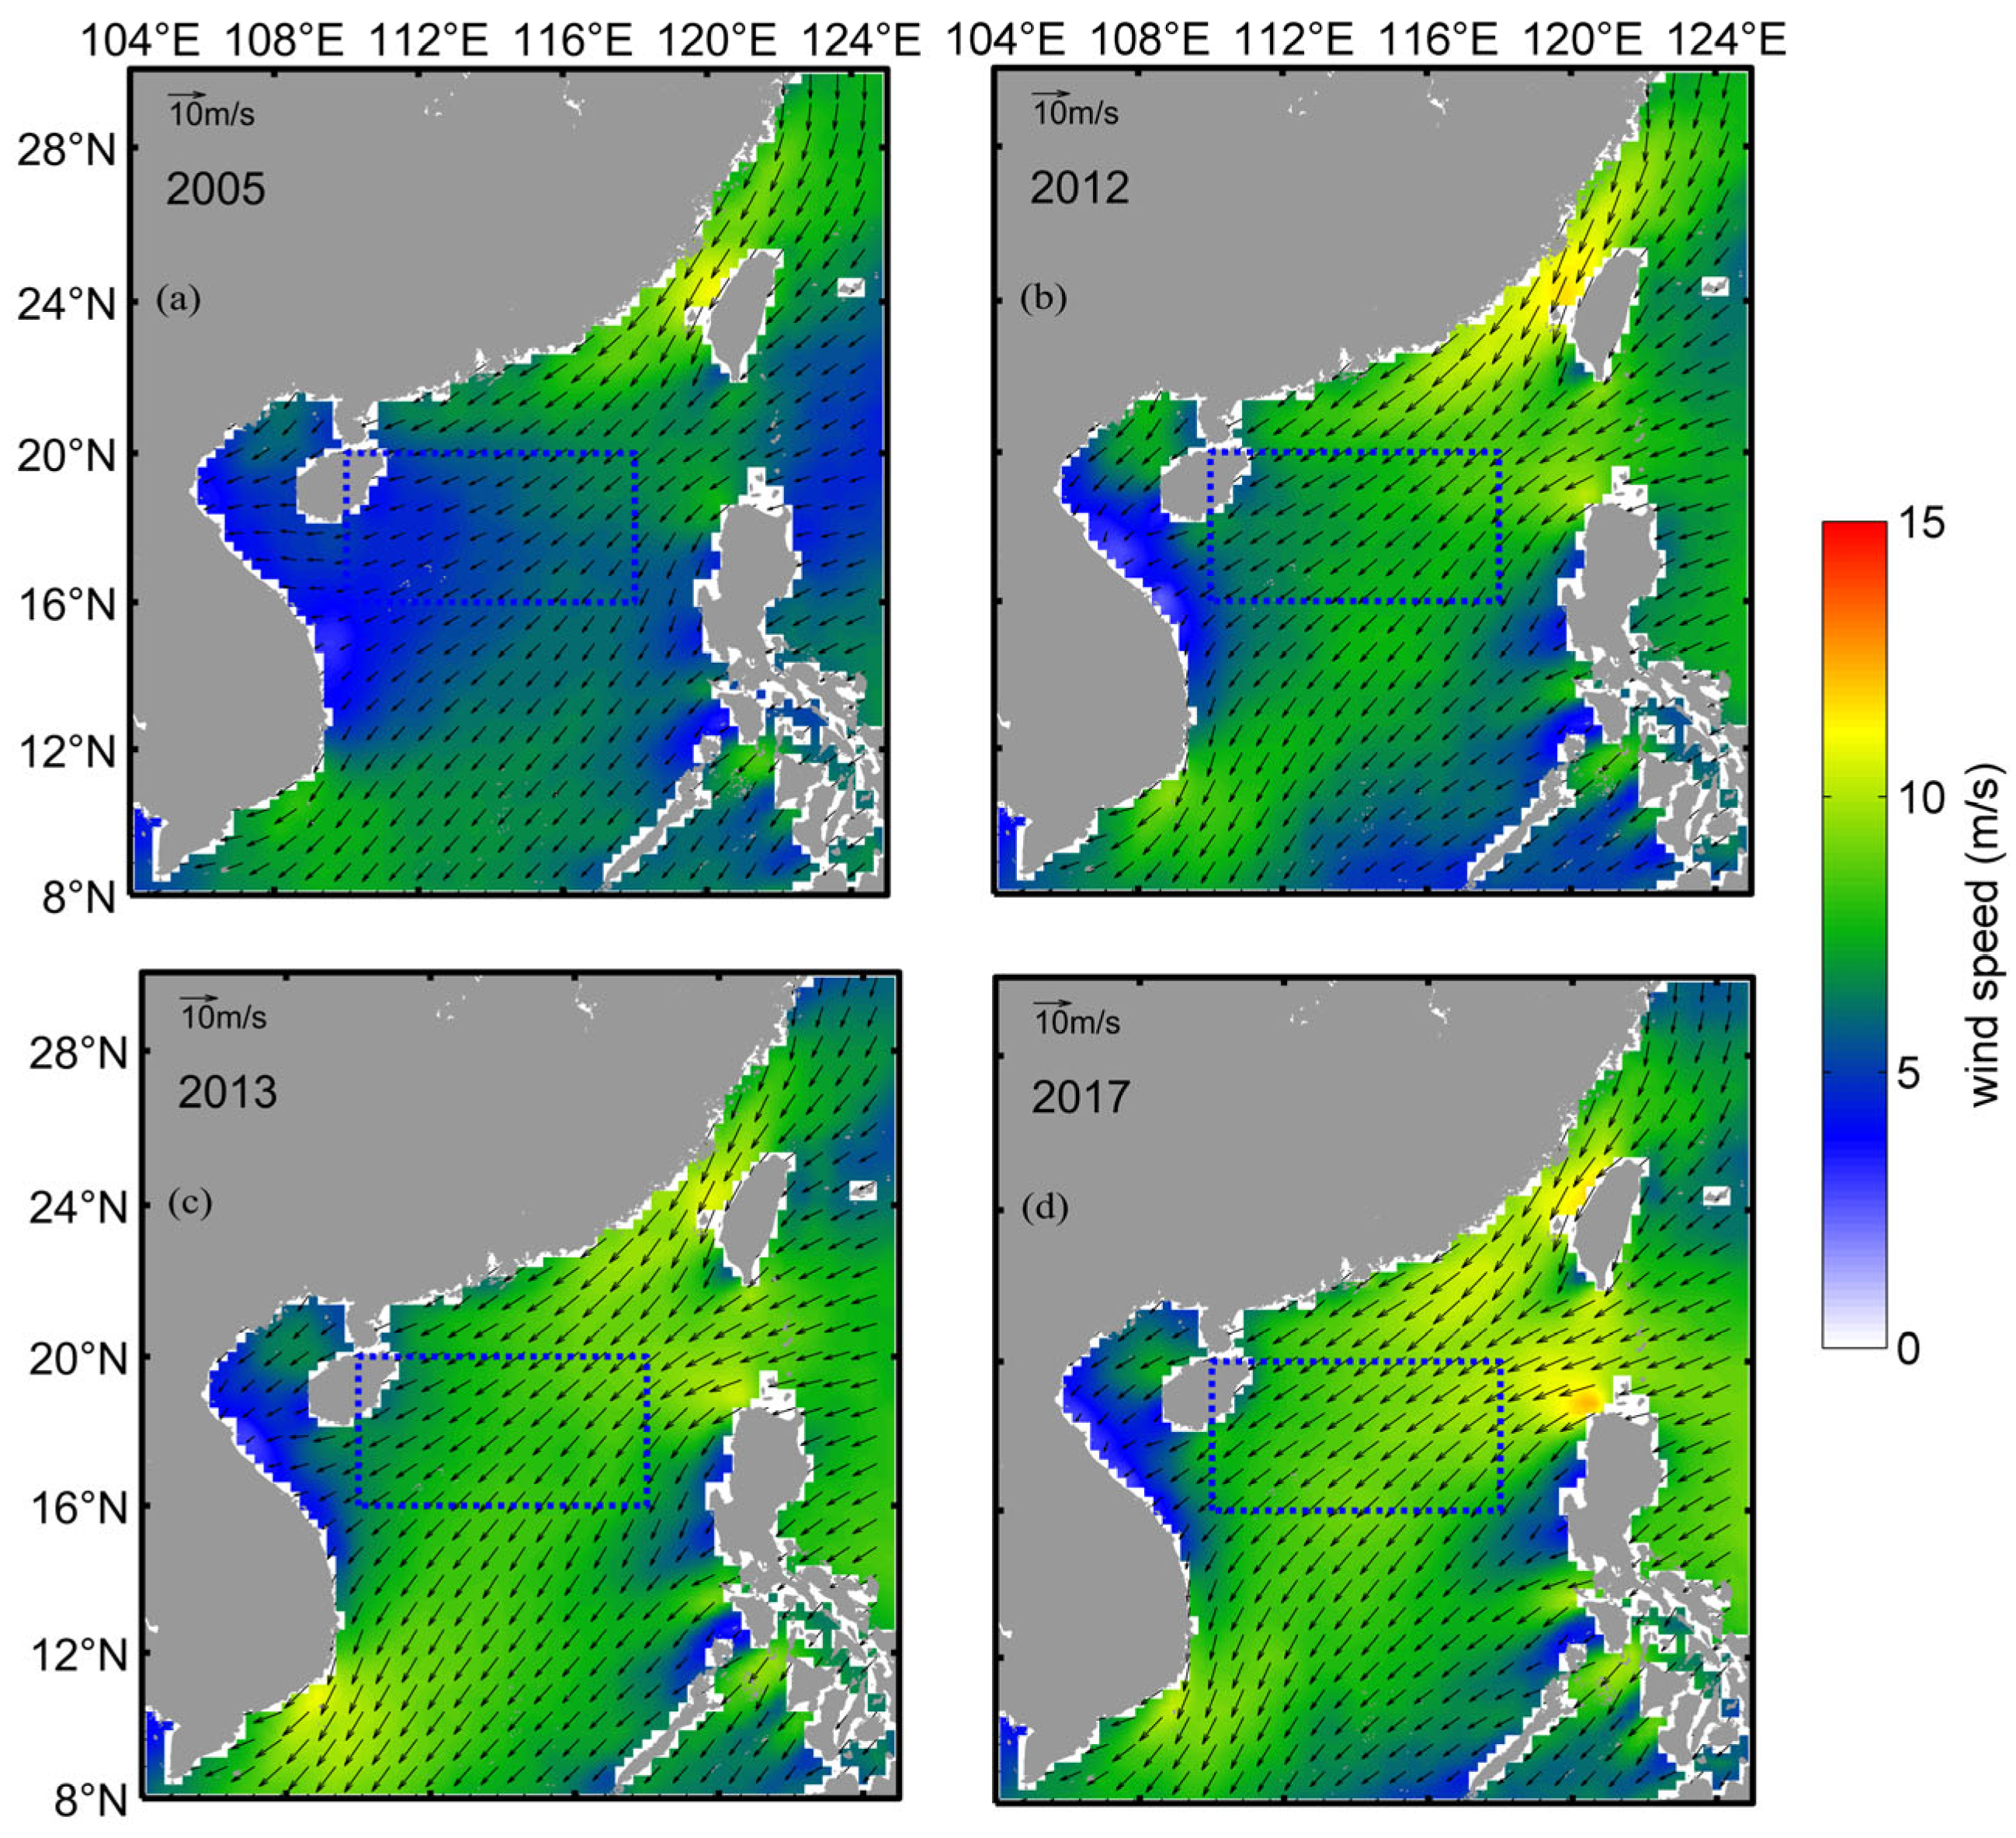
The year 2005 was characterized by a relatively low current speed, whereas 2017 exhibited a significantly higher current speed. Additionally, 2012 and 2013 displayed inconsistencies between wind speed and current speed trends (Figure 13a). To further elucidate these phenomena, we present the distributions of the mean wind field and the reanalyzed current field in January and February of 2005, 2012, 2013, and 2017 for comparative analysis (Figure 14 and Figure 15).
In 2005, the northeasterly monsoon winds were notably weaker, with wind speeds confined to 5–6 m/s within the blue dashed box. Correspondingly, the SCSWBC in this region contracted, as the core flow axis (exceeding 0.3 m/s) narrowed to a width of approximately 80 km (Figure 14a and Figure 15a). In contrast, 2017 experienced stronger northeasterly winds, with speeds reaching 9–10 m/s in the same region, accompanied by a broadening of the SCSWBC. Here, the 0.3 m/s current axis expanded to approximately 160 km (Figure 14d and Figure 15d).
In 2012, the enhanced Kuroshio intrusion into the SCS (Figure 15b) likely counteracted the expected reduction in current speed due to weaker winds, resulting instead in a slight increase (Figure 13a). This observation is consistent with previous studies: Chen & Xue (2014) [54] identified the winter SCSWBC as primarily monsoon-driven but modulated by Kuroshio intrusion, while Quan et al. (2016) [55] emphasized wind forcing as the dominant factor in interannual variability, with Kuroshio dynamics playing a secondary role. In 2013, the current field within the drifter trajectory region (Figure 15c) deviated from the typical band-like structure observed in other years (Figure 15a,b,d), instead exhibiting pronounced curvature. This anomalous flow pattern likely contributed to the reduced current speed recorded in 2013 (Figure 13a).

4.2. Patterns of the SCSWBC in Winter and Summer

He & Wang (2009) [25] analyzed drifter data from 2003 to 2006 and identified two distinct sources for the winter surface SCSWBC: (1) a northern branch originating from Kuroshio intrusion and (2) a southern branch comprising westward flow along the eastern basin boundary at approximately 18° N. Their study further revealed that the southern branch either merges with the northern branch over the northern continental shelf in December before flowing southwestward, or alternatively crosses the basin independently toward the central Vietnamese coast. The analysis of autumn drifter trajectories presented in this study generally confirms the SCSWBC source regions identified by He & Wang (2009) [25], but reveals notable differences in pathway dynamics. Specifically, unlike previous winter SCSWBC studies, the southern branch of the SCSWBC can both merge with the northern branch near the coastal waters off Hainan Island and independently cross the basin toward Vietnam. These pathway variations appear to be primarily influenced by the presence of mesoscale eddies in early autumn [53], underscoring the significant role of mesoscale processes in modulating branch interactions. In contrast, winter drifter trajectories consistently demonstrate merging of the southern branch with the northern branch over the northern continental shelf, followed by southwestward flow.
The summer SCSWBC similarly comprises two distinct branches. The eastward branch diverges from the Vietnamese coast near 12° N before merging with the southern anticyclonic gyre [56,57]. Meanwhile, the northward branch follows the continental slope of the SCS [9,58]. The northeastward currents observed along the southern China coast, including the broad-scale SCS Warm Current, derive primarily from this northward SCSWBC branch before flowing toward the TWS [17]. The interannual variability of the summer SCSWBC fundamentally reflects dynamic competition between these eastward and northward branches [28,58]. Enhanced summer monsoon conditions and stronger Kuroshio intrusion tend to favor the eastward branch, whereas weaker monsoon activity promotes dominance of the northward branch [58]. Consequently, investigating interannual variations in summer surface currents requires comprehensive consideration of both SCSWBC branches, coupled with analysis of wind field dynamics and Kuroshio intrusion patterns. The underlying mechanisms governing these interactions remain complex and warrant further investigation.

5. Conclusions

This paper analyzes some seasonal variations in SCS surface currents based on the trajectories of Beidou drifters deployed in four seasons, combined with reanalyzed current fields, satellite altimetry data, and satellite remote sensing wind field. The following can be concluded:
(1) The surface drifter trajectories in the SCS exhibit distinct seasonal characteristics. During autumn and winter, drifters predominantly follow westward pathways, ultimately converging into the SCSWBC. In spring, trajectories display markedly different behavior, with drifters frequently being entrained by mesoscale eddies—a pattern consistent with enhanced eddy activity during this season. Summer presents yet another distinct circulation regime: drifters originating from the LZS and the TWS flow northeastward before typically re-entering the SCS through these same straits in subsequent autumn or winter months. These returning drifters eventually either merge with the SCSWBC or terminate in the coastal waters near the Hainan Island.
(2) During spring 2021, satellite altimeter data revealed that multiple drifters were captured by the same mesoscale eddy, as identified through eddy ensemble analysis. The trajectories of these drifters closely mirrored the rotational characteristics of the host eddy. However, during the late spring to summer transition, concurrently with seasonal wind field variations, the drifters gradually disengaged from the eddy structure. Our analysis delineates the observed mesoscale eddy evolution into six distinct phases. The initial three phases exhibited progressive weakening of the eddy’s amplitude, coinciding with a substantial increase in the drifter’s AKE. This inverse relationship suggests an energy transfer from the mesoscale eddy to submesoscale ageostrophic motions. Between the third and fourth phases, while the eddy continued to weaken, the AKE of drifters decreased significantly. This energy reduction appears correlated with the shift in prevailing winds from northerly to southerly directions occurring after 8 May. The intensity modulation of mesoscale eddies involves complex interactions among multiple factors, including submesoscale motions [50], background flow conditions [59], and wind forcing [52]. The precise mechanisms governing these energy exchange processes remain incompletely understood and merit further systematic investigation.
(3) The winter current speeds in the SCS are characterized by significant interannual variability, with wind forcing being a primary determinant of surface current magnitude. Our analysis reveals distinct patterns dependent on the phase of the El Niño–Southern Oscillation (ENSO): during positive Niño 3.4 index phases exceeding +0.5 °C, both wind speeds and current velocities typically reach minimum values, whereas negative phases below −0.5 °C correspond to maximum flow speeds. The Kuroshio intrusion constitutes an additional modulating factor. Notably, Yan et al. (2019) [59] demonstrated that winter buoyancy effects in the northern SCS represent another critical control mechanism for both regional surface currents and the SCSWBC. Their findings indicate that buoyancy forcing can partially offset wind- and Kuroshio-driven intensification of the SCSWBC, potentially leading to flow weakening. The complex interplay between these competing forcings—wind stress, Kuroshio intrusion, and buoyancy effects—remains incompletely understood. Future research should focus on quantifying their relative contributions and nonlinear interactions to better elucidate the fundamental dynamics governing SCSWBC variability.

Author Contributions

Conceptualization, L.Y. and J.H.; methodology, Z.H. and L.Y.; formal analysis, Z.H. and L.Y.; investigation, Z.S., Z.C., and J.Z.; validation, Z.S., Z.C., and J.Z.; visualization, Z.S., Z.C., and J.Z.; writing—original draft preparation, Z.H. and L.Y.; writing—review and editing, Z.H., L.Y., and J.H.; funding acquisition, J.H. All authors have read and agreed to the published version of the manuscript.

Funding

This study was supported by the National Natural Science Foundation of China (91958203 and 41730533).

Data Availability Statement

The reanalysis current dataset and remote sensing datasets for this research are publicly available and were downloaded from https://data.marine.copernicus.eu/product/GLOBAL_ANALYSISFORECAST_PHY_001_024/description, accessed on 1 January 2024; ftp.ifremer.fr/ifremer/cersat/products/gridded/, accessed on 19 February 2024; https://www.aviso.altimetry.fr/, accessed on 9 February 2022. We appreciate the provision of these publicly available datasets.

Acknowledgments

We appreciate all the constructive comments from the two anonymous reviewers that have improved the early version of the manuscript.

Conflicts of Interest

The authors declare no conflicts of interest. The funders had no role in the design of the study; in the collection, analyses, or interpretation of data; in the writing of the manuscript; or in the decision to publish the results.

References

  1. Hu, J.Y.; Kawamura, H.; Hong, H.S.; Qi, Y.Q. A review on the currents in the South China Sea: Seasonal circulation, South China Sea warm current and Kuroshio intrusion. J. Oceanogr. 2000, 56, 607–624. [Google Scholar] [CrossRef]
  2. Zhu, Y.H.; Sun, J.C.; Wang, Y.G.; Li, S.J. Overview of the multi-layer circulation in the South China Sea. Prog. Oceanogr. 2019, 175, 171–182. [Google Scholar] [CrossRef]
  3. Guo, J.J.; Fang, W.D.; Fang, G.H.; Chen, H.Y. Variability of surface circulation in the South China Sea from satellite altimeter data. Sci. Bull. 2006, 51, 1–8. [Google Scholar] [CrossRef]
  4. Wyrki, K. Physical Oceanography of the Southeast Asian Waters, 1st ed.; University of California, Scripps Institution of Oceanography Press: California, CA, USA, 1961; pp. 1–195. [Google Scholar]
  5. Xu, X.; Qiu, Z.; Chen, H. The general description of the horizontal circulation in the South China Sea. In Proceedings of the 1980 Symposium on Hydrometeorology; Chinese Society of Oceanology and Limnology, Ed.; Science Press: Beijing, China, 1982; Volume 3, pp. 137–145. (In Chinese). [Google Scholar]
  6. Shaw, P.T.; Chao, S.Y. Surface circulation in South China Sea. Deep Sea Res. Part I 1994, 41, 1663–1683. [Google Scholar] [CrossRef]
  7. Chu, P.C.; Edmons, N.L.; Fan, C.W. Dynamical mechanisms for the South China Sea seasonal circulation and thermohaline variabilities. J. Phys. Oceanogr. 1999, 29, 2971–2989. [Google Scholar] [CrossRef]
  8. Chern, C.S.; Wang, J. Numerical study of the upper-layer circulation in the South China Sea. J. Oceanogr. 2003, 59, 11–24. [Google Scholar] [CrossRef]
  9. Gan, J.P.; Li, H.; Curchitser, E.N.; Haidvogel, D.B. Modeling South China Sea circulation: Response to seasonal forcing regimes. J. Geophys. Res. Oceans 2006, 111, C06034. [Google Scholar] [CrossRef]
  10. Fang, G.H.; Wang, Y.G.; Wei, Z.X.; Fang, Y.; Qiao, F.L.; Hu, X.M. Interocean circulation and heat and freshwater budgets of the South China Sea based on a numerical model. Dynam. Atmos. Oceans 2009, 47, 55–72. [Google Scholar] [CrossRef]
  11. Tangang, F.T.; Xia, C.S.; Qiao, F.L.; Juneng, L.; Shan, F.Z. Seasonal circulations in the Malay Peninsula eastern continental shelf from a wave-tide-circulation coupled model. Ocean Dyn. 2011, 61, 1317–1328. [Google Scholar] [CrossRef]
  12. Wei, Z.X.; Fang, G.H.; Xu, T.F.; Wang, Y.G.; Lian, Z. Seasonal variability of the isopycnal surface circulation in the South China Sea derived from a variable-grid global ocean circulation model. Acta Oceanol. Sin. 2016, 35, 11–20. [Google Scholar] [CrossRef]
  13. Shaw, P.T.; Chao, S.Y.; Fu, L.L. Sea surface height variations in the South China Sea from satellite altimetry. Oceanol. Acta 1999, 22, 1–17. [Google Scholar] [CrossRef]
  14. Ho, C.R.; Kuo, N.J.; Zheng, Q.A.; Soong, Y.S. Dynamically active areas in the South China Sea detected from TOPEX/POSEIDON satellite altimeter data. Remote. Sens. Environ. 2000, 71, 320–328. [Google Scholar] [CrossRef]
  15. Wang, L.P.; Koblinsky, C.J.; Howden, S. Mesoscale variability in the South China Sea from the TOPEX/Poseidon altimetry data. Deep Sea Res. Part I 2000, 47, 681–708. [Google Scholar] [CrossRef]
  16. Xie, S.P.; Xie, Q.; Wang, D.X.; Liu, W.T. Summer upwelling in the South China Sea and its role in regional climate variations. J. Geophys. Res. Oceans 2003, 108, 3261. [Google Scholar] [CrossRef]
  17. Bao, L.F.; Lu, Y.; Wang, Y.; Xsu, H.Z. Seasonal variation of upper ocean circulation over the South China Sea from satellite altimetry data of many years. Chin. J. Geophys. 2005, 48, 543–550. [Google Scholar] [CrossRef]
  18. Rong, Z.R.; Liu, Y.G.; Zong, H.B.; Cheng, Y.C. Interannual sea level variability in the South China Sea and its response to ENSO. Global Planet. Change 2007, 55, 257–272. [Google Scholar] [CrossRef]
  19. Cai, S.Q.; He, Y.H. Association of the Sulu Sea surface circulation with the South China Sea. J. Mar. Syst. 2010, 81, 335–340. [Google Scholar] [CrossRef]
  20. Benny, N.P.; Mridula, K.R.; Razali, M.M.; Ses, S.; Omar, K.M. Northern South China Sea surface circulation and its variability derived by combining satellite altimetry and surface drifter data. Terr. Atmos. Ocean. Sci. 2015, 26, 193–203. [Google Scholar] [CrossRef]
  21. Liu, J.; Dai, J.J.; Xu, D.F.; Wang, J.; Yuan, Y.P. Seasonal and interannual variability in coastal circulations in the northern South China sea. Water 2018, 10, 520. [Google Scholar] [CrossRef]
  22. Fu, Y.G.; Zhou, X.H.; Zhou, D.X.; Li, J.; Zhang, W.J. Estimation of sea level variability in the South China Sea from satellite altimetry and tide gauge data. Adv. Space Res. 2021, 68, 523–533. [Google Scholar] [CrossRef]
  23. Zhong, Y.S.; Zhou, M.; Waniek, J.J.; Zhou, L.; Zhang, Z.R. Seasonal variation of the surface Kuroshio intrusion into the South China Sea evidenced by satellite geostrophic streamlines. J. Phys. Oceanogr. 2021, 51, 2705–2718. [Google Scholar] [CrossRef]
  24. Su, J.Z.; Lu, J.; Hou, Y.J.; Fang, G.H.; Wei, Z.X.; Yin, B.S. Analysis of satellite-tracked drifting buoys in the South China Sea. Oceanol. Limnol. Sin. 2002, 33, 121–127. [Google Scholar]
  25. He, Z.G.; Wang, D.X. Surface pattern of the South China Sea western boundary current in winter. Adv. Geosci. 2009, 12, 99–107. [Google Scholar] [CrossRef]
  26. Centurioni, L.R.; Niiler, P.N.; Lee, D.K. Near-surface circulation in the South China Sea during the winter monsoon. Geophys. Res. Lett. 2009, 36, L06605. [Google Scholar] [CrossRef]
  27. Qiu, Y.; Li, L.; Chen, C.T.A.; Guo, X.; Jing, C. Currents in the Taiwan Strait as observed by surface drifters. J. Oceanogr. 2011, 67, 395–404. [Google Scholar] [CrossRef]
  28. Liu, K.F.; Jiang, G.R.; Chen, Y.D.; Yao, J.; Sheng, C. Analysis of upper-ocean surface currents of the South China Sea derived from satellite-tracked drifter data. J. Trop. Oceanogr. 2014, 33, 13–21. [Google Scholar] [CrossRef]
  29. Hsu, P.C.; Centurioni, L.; Shao, H.J.; Zheng, Q.A.; Lu, C.Y.; Hsu, T.W.; Tseng, R.S. Surface current variations and oceanic fronts in the southern East China Sea: Drifter experiments, coastal radar applications, and satellite observations. J. Geophys. Res. Oceans 2021, 126, e2021JC017373. [Google Scholar] [CrossRef]
  30. Hu, Z.Y.; Yang, L.Q.; Chen, Z.Z.; Zhu, J.; Sun, Z.Y.; Hu, J.Y. Drifter-observed reversal of the South China Sea Western Boundary Current from summer to autumn. Mar. Technol. Soc. J. 2023, 57, 34–46. [Google Scholar] [CrossRef]
  31. Tuo, P.F.; Hu, Z.Y.; Chen, S.L.; Hu, J.Y.; Yu, P.N. Asymmetric drifter trajectories in an anticyclonic mesoscale eddy. Remote Sens. 2023, 15, 3806. [Google Scholar] [CrossRef]
  32. Gu, J.T.; Zhang, Y.; Tuo, P.F.; Hu, Z.Y.; Chen, S.L.; Hu, J.Y. Surface floating objects moving from the Pearl River Estuary to Hainan Island: An observational and model study. J. Mar. Syst. 2024, 241, 103917. [Google Scholar] [CrossRef]
  33. Gu, J.T.; Zhang, Y.; Sui, Y.; Chen, S.L. Lagrangian study of floating debris transport around the Pearl River Estuary in summer. Mar. Pollut. Bull. 2025, 211, 117494. [Google Scholar] [CrossRef]
  34. Li, J.Y.; Li, M.; Xian, Z.Y.; Xie, L.L. Satellite tracked Lagrangian drifters observed Yuexi cyclonic eddy. Acta Oceanol. Sin. 2025, 44, 150–152. [Google Scholar] [CrossRef]
  35. Niiler, P.P.; Sybrandy, A.S.; Bi, K.; Poulain, P.M.; Bitterman, D. Measurements of the water-following capability of holey-sock and TRISTAR drifters. Deep Sea Res. Part I 1995, 42, 1951–1964. [Google Scholar] [CrossRef]
  36. Sun, Z.Y.; Hu, J.Y.; Lin, H.Y.; Chen, Z.Z.; Zhu, J.; Yang, L.Q.; Hu, Z.Y.; Chen, X.R.; Wu, X.W. Lagrangian observation of the Kuroshio current by surface drifters in 2019. J. Mar. Sci. Eng. 2022, 10, 1027. [Google Scholar] [CrossRef]
  37. Sun, Z.Y.; Hu, J.Y.; Chen, Z.Z.; Zhu, J.; Yang, L.Q.; Chen, X.R.; Wu, X.W. Strong Kuroshio intrusion into the South China Sea and its accompanying cold-core anticyclonic eddy in winter 2020–2021. Remote Sens. 2021, 13, 2645. [Google Scholar] [CrossRef]
  38. Hansen, D.V.; Poulain, P.M. Quality control and interpolations of WOCE-TOGA drifter data. J. Atmos. Ocean. Technol. 1996, 13, 900–909. [Google Scholar] [CrossRef]
  39. Mason, E.; Pascual, A.; Gaube, P.; Ruiz, S.; Pelegrí, J.L.; Delepoulle, A. Subregional characterization of mesoscale eddies across the Brazil–Malvinas Confluence. J. Geophys. Res. Oceans 2017, 122, 3329–3357. [Google Scholar] [CrossRef]
  40. Mason, E.; Pascual, A.P.; McWilliams, J.C. A new sea surface height–based code for oceanic mesoscale eddy tracking. J. Atmos. Ocean. Technol. 2014, 31, 1181–1188. [Google Scholar] [CrossRef]
  41. Pegliasco, C.; Delepoulle, A.; Mason, E.; Morrow, R.; Faugère, Y.; Dibarboure, G. META3.1exp: A new Global Mesoscale Eddy Trajectories Atlas derived from altimetry. Earth Syst. Sci. Data 2022, 14, 1087–1107. [Google Scholar] [CrossRef]
  42. Qiu, C.H.; Yang, Z.H.; Wang, D.X.; Feng, M.; Su, J.Z. The enhancement of submesoscale ageostrophic motion on the mesoscale eddies in the South China Sea. J. Geophys. Res. Oceans 2022, 127, e2022JC018736. [Google Scholar] [CrossRef]
  43. Li, L.; Nowlin, W.D.; Su, J.L. Anticyclonic rings from the Kuroshio in the South China Sea. Deep Sea Res. Part I 1998, 45, 1469–1482. [Google Scholar] [CrossRef]
  44. Jia, Y.L.; Liu, Q.Y.; Liu, W. Eddy shedding from the Kuroshio bend at Luzon Strait. J. Oceanogr. 2004, 60, 1063–1069. [Google Scholar] [CrossRef]
  45. Yuan, D.L.; Han, W.Q.; Hu, D.X. Surface Kuroshio path in the Luzon Strait area derived from satellite remote sensing data. J. Geophys. Res. Oceans 2006, 111, C11007. [Google Scholar] [CrossRef]
  46. Zhang, Z.W.; Zhao, W.; Qiu, B.; Tian, J.W. Anticyclonic eddy sheddings from Kuroshio loop and the accompanying cyclonic eddy in the northeastern South China Sea. J. Phys. Oceanogr. 2017, 47, 1243–1259. [Google Scholar] [CrossRef]
  47. Wang, D.X.; Xu, H.Z.; Lin, J.; Hu, J.Y. Anticyclonic eddies in the northeastern South China Sea during winter 2003/2004. J. Oceanogr. 2008, 64, 925–935. [Google Scholar] [CrossRef]
  48. Capet, X.; McWilliams, J.C.; Molemaker, M.J.; Shchepetkin, A.F. Mesoscale to submesoscale transition in the California current system. Part II: Frontal processes. J. Phys. Oceanogr. 2008, 38, 44–64. [Google Scholar] [CrossRef]
  49. Zhang, Z.G.; Qiu, B. Evolution of submesoscale ageostrophic motions through the life cycle of oceanic mesoscale eddies. Geophys. Res. Lett. 2018, 45, 11847–11855. [Google Scholar] [CrossRef]
  50. McWilliams, J.C. Submesoscale currents in the ocean. Proc. R. Soc. A Math. Phys. 2016, 472, 20160117. [Google Scholar] [CrossRef]
  51. Jan, S.; Mensah, V.; Andres, M.; Chang, M.H.; Yang, Y.J. Eddy-Kuroshio interactions: Local and remote effects. J. Geophys. Res. Oceans 2017, 122, 9744–9764. [Google Scholar] [CrossRef]
  52. Xu, C.; Zhai, X.M.; Shang, X.D. Work done by atmospheric winds on mesoscale ocean eddies. Geophys. Res. Lett. 2016, 43, 12174–12180. [Google Scholar] [CrossRef]
  53. Rypina, I.I.; Fertitta, D.; Macdonald, A.; Yoshida, S.; Jayne, S. Multi-iteration approach to studying tracer spreading using drifter data. J. Phys. Oceanogr. 2017, 47, 339–351. [Google Scholar] [CrossRef]
  54. Chen, G.X.; Xue, H.J. Westward intensification in marginal seas. Ocean Dyn. 2014, 64, 337–345. [Google Scholar] [CrossRef]
  55. Quan, Q.; Xue, H.J.; Qin, H.L.; Zeng, X.Z.; Peng, S.Q. Features and variability of the South China Sea western boundary current from 1992 to 2011. Ocean Dyn. 2016, 66, 795–810. [Google Scholar] [CrossRef]
  56. Gan, J.P.; Qu, T.D. Coastal jet separation and associated flow variability in the southwest South China Sea. Deep Sea Res. Part I 2008, 55, 1–19. [Google Scholar] [CrossRef]
  57. Wang, G.H.; Wang, C.Z.; Huang, R.X. Interdecadal variability of the eastward current in the South China Sea associated with the summer Asian monsoon. J. Clim. 2010, 23, 6115–6123. [Google Scholar] [CrossRef]
  58. Zu, T.T.; Wang, D.X.; Wang, Q.; Li, M.T.; Wei, J.; Geng, B.X.; He, Y.K.; Chen, J. A revisit of the interannual variation of the South China Sea upper layer circulation in summer: Correlation between the eastward jet and northward branch. Clim. Dyn. 2020, 54, 457–471. [Google Scholar] [CrossRef]
  59. Yan, Y.W.; Wang, G.H.; Xue, H.J.; Chai, F. Buoyancy effect on the winter South China Sea western boundary current. J. Geophys. Res. Oceans 2019, 124, 6871–6885. [Google Scholar] [CrossRef]
Figure 1. Regional bathymetry of the South China Sea (SCS), illustrating the mean pathways of the South China Sea Western Boundary Current (SCSWBC) in red for winter and in green for summer. The orange line denotes the Kuroshio and its potential intrusion into the SCS through the Luzon Strait (LZS). TWS indicates the Taiwan Strait.
Oceans 06 00058 g001
Figure 2. Complete trajectory maps of drifters deployed in four seasons. Each panel displays the deployment time of the drifters: (a) eight drifters in December 2020, (b) ten drifters in March–April 2021, (c) ten drifters in June–July 2021, and (d) ten drifters in August–September 2021. Black dots mark deployment locations. The color coding for the trajectories, as indicated by the legend at the bottom of the figure, is as follows: purple for winter 2020–2021, green for spring 2021, red for summer 2021, blue for autumn 2021, light blue for winter 2021–2022, and dark green for spring 2022.
Oceans 06 00058 g002
Figure 3. Seasonal trajectories of drifters (colored lines) and CMEMS-reanalyzed current field distribution (vectors). (a) In winter 2020–2021, (b) in spring 2021, (c) in summer 2021, and (d) in autumn 2021. Only the trajectories of drifters deployed in the season are plotted, and the black dots are the starting points of the trajectories.
Oceans 06 00058 g003
Figure 4. Trajectories of drifters with longer seasonal spans (black triangles represent starting points). (a) Drifter 1485580, from 27 March 2021 to 6 April 2022, lasting for 376 days. (b) Drifter 1485616, from 2 April 2021 to 6 January 2022, lasting for 280 days. (c) Drifter 1485620, from 1 July 2021 to 6 January 2022, lasting for 190 days. (d) Drifter 1490024, from 27 June 2021 to 4 April 2022, lasting for 282 days. The legend at the bottom of the figure is the same as that in Figure 2.
Oceans 06 00058 g004
Figure 5. Distribution of average current speed of drifters in the first, middle, and last ten days of each month for four seasons. (a) In winter 2020–2021, (b) in spring 2021, (c) in summer 2021, and (d) in autumn 2021.
Oceans 06 00058 g005
Figure 6. (a) Drifter trajectories from 27 March to 8 July 2021; (b) ensemble of eddies identified by satellite altimetry, with contours of the maximum geostrophic current speed plotted every 2 days. In (a), trajectories of different drifters are represented by distinct colours.
Oceans 06 00058 g006
Figure 7. Drifter trajectories and eddies detected by satellite altimeter. The dark green lines in the figure represent the ensemble of the same eddy detected by the altimeter, plotted at 3-day intervals. The background filled map illustrates the SLA distribution during the corresponding period, while the arrows indicate the average geostrophic currents. Different colors in the figure correspond to the distinct trajectories of drifters. Panels (a) through (f) depict the following time periods: (a) 27 March to 20 April, (b) 20–29 April, (c) 27 April to 13 May, (d) 9 May to 3 June, (e) 28 May to 22 June, and (f) 18 June to 8 July.
Oceans 06 00058 g007
Figure 8. Trajectories of drifters in the summer of 2021 and the distribution of reanalyzed surface current field. Dots denote the starting points of the drifters. Trajectories of different drifters are represented by lines of distinct colors. Two black boxes mark Region 1 and Region 2, respectively.
Oceans 06 00058 g008
Figure 9. The corresponding trajectories of the drifters in summer (black dots are the starting points of the drifters) and the reanalyzed current field (the average current field of June and July 2021).
Oceans 06 00058 g009
Figure 10. The trajectories of drifters and the distribution of the reanalyzed surface current field in autumn 2021. Dots indicate the starting points of the drifters, with different colors corresponding to trajectories of individual drifters. The two black boxes denote Zone 1 and Zone 2, which represent the two source regions of the SCSWBC during the autumn season.
Oceans 06 00058 g010
Figure 11. The corresponding trajectories of the drifters in winter (black dots are the starting points of drifters) and the reanalyzed current field (the average current field of January and February 2021). The area enclosed by the blue dashed box denotes the domain for calculating the average wind field used in Figure 13.
Oceans 06 00058 g011
Figure 12. Power spectra of drifter speed. Solid red and blue lines show the estimated power spectral densities for summer and winter drifter trajectories, respectively, with shaded regions indicating the 95% confidence intervals. Two black dashed lines delineate the inertial frequency range corresponding to the drifter latitudes.
Oceans 06 00058 g012
Figure 14. Spatial distributions of wintertime average wind fields (averaged for January and February) in different years. (a) In 2005, (b) in 2012, (c) in 2013, and (d) in 2017. The area enclosed by the blue dashed box denotes the domain for calculating the average wind field used in Figure 13.
Oceans 06 00058 g014
Figure 15. Spatial distributions of wintertime average reanalyzed current fields (averaged for January and February) in different years. (a) In 2005, (b) in 2012, (c) in 2013, and (d) in 2017. The area enclosed by the blue dashed box denotes the domain for calculating the average wind field used in Figure 13.
Oceans 06 00058 g015
Table 1. Eddy amplitude from altimeter data and eddy’s AKE from drifter data.
PeriodEddy Amplitude (m)AKE (m2/s2)
27 March–20 April 20210.22
[0.198, 0.235]
0.11
[0.099, 0.115]
20–29 April 20210.16
[0.161, 0.168]
0.16
[0.142, 0.177]
27 April–13 May 20210.15
[0.138, 0.157]
0.18
[0.166, 0.197]
9 May–3 June 20210.11
[0.108, 0.122]
0.10
[0.092, 0.113]
28 May–22 June 20210.08
[0.075, 0.094]
0.09
[0.082, 0.107]
18 June–8 July 20210.07
[0.065, 0.080]
0.09
[0.063, 0.117]
Note: Values in [ ] denote the 95% confidence interval.
Disclaimer/Publisher’s Note: The statements, opinions and data contained in all publications are solely those of the individual author(s) and contributor(s) and not of MDPI and/or the editor(s). MDPI and/or the editor(s) disclaim responsibility for any injury to people or property resulting from any ideas, methods, instructions or products referred to in the content.