Article

Estimated Ocean Climate Velocity Using Satellite Sea Surface Temperature Products Since the Early 2000s in the East Sea

Ocean Climate Change and Ecology Research Division, National Institute of Fisheries Science, Busan 46083, Republic of Korea
*
Author to whom correspondence should be addressed.
Oceans 2025, 6(3), 56; https://doi.org/10.3390/oceans6030056
Submission received: 5 June 2025 / Revised: 12 August 2025 / Accepted: 26 August 2025 / Published: 1 September 2025

Abstract

To understand the impacts of climate change on local marine ecosystems, assessing ocean climate velocity in regional seas is essential. This study investigated changes in sea surface temperature (SST) and associated shifts in isotherm location and ocean climate velocity in the East Sea of Korea from 2000 to 2024, utilizing satellite-derived SST data. The results revealed a significant acceleration in the ocean climate velocity of SST, reaching 66.99 km/decade over the past 25 years. The velocity significantly increased during Phase 4, indicating rapid changes with potential ecosystem impacts. The 18 °C SST zone expanded by more than twofold from the early 2000s to the early 2020s. The annual average SST exhibited a steady, consistent decadal increase. These trends are associated with the northward shift of isotherms, which significantly influences the SST distribution patterns, particularly in the 16–18 °C range. Given the accelerating ocean climate velocity, urgent attention is needed to mitigate climate change impacts, particularly in vulnerable regions such as the East Sea. This study enhances the understanding of SST dynamics and underscores the importance of proactive conservation and management in climate-affected marine ecosystems.

1. Introduction

The global ocean has been continuously warming since at least 1970. The globally averaged ocean heat content (OHC) showed a steady increase of 0.28–0.55 × 1024 Joules between 1971 and 2018 [1]. Ocean warming accounts for 91% of the heat gained in the global climate system, while land warming, ice loss, and atmospheric warming contribute the remaining 9% [1]. According to the World Meteorological Organization (WMO), approximately 90% of the energy trapped in the climate system by greenhouse gases is absorbed by the ocean, making ocean warming the most significant factor in global climate warming. The rate of ocean warming has accelerated over the past two decades. The rate of warming at 0–2000 m depth was 1.2 ± 0.2 Wm−2 from 2006 to 2022, while it was 0.7 ± 0.1 Wm−2 from 1971 to 2022 [2]. In 2023, the global mean sea surface temperature (SST) and OHC reached record highs [3]. Studies demonstrate that ocean heat uptake nearly doubled from 1990–2000 to 2010–2020 [4]. Several studies have confirmed the significant acceleration of ocean warming on both global and basin scales [5,6]. By 2100, ocean warming at 0–2000 m depth is projected to be two to six times greater than that observed so far, reaching 1030 × 1021 Joules and 1874 × 1021 Joules under low- and high-emission scenarios, respectively. Such accelerated warming is expected to have extensive impacts, posing significant risks to marine ecosystems and human society [7]. Additionally, global ocean warming contributes to ocean acidification, deoxygenation, reduced nutrient availability, and reduced primary production in the upper ocean [8]. Climate velocity, defined as the rate and direction of isotherm migration over time [9,10], determines how quickly marine populations must migrate, adapt, or acclimate to changing sea temperatures [11]. Several studies have estimated ocean warming rates and patterns by analyzing isotherm shifts using in situ and satellite temperature data [12,13,14]. For example, ref. [10] calculated the rate of isotherm migration as the ratio of temporal SST changes to spatial temperature gradients over the 1960–2009 period. They found that although ocean warming was slower compared to land, the ocean climate velocity (27.5 km/decade) was comparable to land values (27.4 km/decade) across regions from 50° S to 80° N.
Climate velocity is a key factor in determining the magnitude and direction of marine species range shifts. Since the 1950s, range shifts have been estimated at 51.5 ± 33 km/decade for epipelagic species and 29.0 ± 15.5 km/decade for benthic species [15]. The majority of these shifts align with responses to ocean warming [16,17]. A review of the impacts of ocean warming on marine ecosystems found that 78.8% of studies reported negative effects, while 20.1% reported positive impacts [18]. As ocean temperatures rise, tropical species are expected to migrate poleward, while cold-water species may shift to deeper waters or higher latitudes to adapt to changing conditions. Ocean warming and the poleward shift of isotherms are projected to significantly affect marine ecosystems and fisheries at the global, basin, and regional scales [19,20,21,22,23]. For instance, ref. [24] observed that the distributions of both exploited and non-exploited fish species in the North Sea have shifted in response to rising sea temperatures, with profound implications for commercial fisheries. Similarly, ref. [25] found that the ranges of dinoflagellates and copepods closely follow ocean climate velocity, whereas diatoms respond more slowly. Ref. [26] further demonstrated that marine taxa, more than terrestrial ones, closely follow shifting isotherms based on a global database of 30,534 range shifts from 12,415 taxa.
In the waters surrounding the Korean Peninsula, SSTs have increased significantly, at rates approximately 2.6 times higher than the global average over the past 56 years [27]. Since the 2000s, seasonal SST trends have also shifted, with a dominant increase in summer SST compared to winter SST, which had shown stronger trends before 2000 [28]. Among these regional waters, the East Sea has experienced the highest rate of ocean warming [29]. Often referred to as a “miniature version” of the global ocean, the East Sea features well-developed surface fronts, such as the subpolar front (SPF), where cold northern and warm southern waters converge [30]. Using high-resolution satellite SST data from 1985 to 2020, ref. [6] analyzed SPF movements in three regions of the East Sea (eastern, central, and western), finding contrasting trends: the eastern SPF shifted poleward by 0.08°/decade, the central SPF shifted equatorward by −0.11°/decade, and the western SPF showed no significant displacement. Seasonal and interannual variations in the strength, location, and range of the SPF further reflect the dynamic nature of the East Sea [31]. Latitudinal shifts in isotherms due to ocean warming are linked to changes in biochemical conditions and fishery resources in the East Sea. Nutrient concentrations in the region have declined due to enhanced stratification caused by ocean warming [32]. Consequently, small phytoplankton have become dominant, and primary production has decreased significantly [33,34]. Long-term data also indicate a decline or disappearance of cold-water fish species in Korean fisheries, replaced by warm-water species [35]. By the 2030s, some fish species’ ranges are projected to shift poleward by 19–71 km in Korean waters [36].
In this study, the ocean climate velocity in the Korean East Sea was estimated by tracking the latitudinal shifts of annual mean isotherms using 1 km-resolution NOAA AVHRR satellite-derived SST data from 2000 onward. This approach allows us to assess how rapidly thermal habitats are shifting under ongoing ocean warming. Building on this, this study aims to better understand the potential impacts of climate-driven changes in the thermal environment on local marine ecosystems and fisheries, thereby providing valuable insights for the adaptive management of regional marine resources.

2. Materials and Methods

2.1. Study Domain and SST Data

In this study, SST was estimated using Advanced Very High-Resolution Radiometer (AVHRR) series satellite imagery, acquired directly by the National Institute of Fisheries Science (NIFS; https://www.nifs.go.kr/sois/, accessed on 2 January 2025) from the National Oceanic and Atmospheric Administration (NOAA). The AVHRR data are centered at 135° E and 35° N, covering a spatial domain from approximately 25 to 45° N latitude and from 120 to 142° E longitude, with a spatial resolution of 1.1 km on a 2000 × 2000 grid.
Figure 1 illustrates the spatial domain of the study, which encompasses the East Sea and extends approximately from 35° N to 43° N latitude and from 128° E to 140° E longitude.
SST was retrieved using the multi-channel sea surface temperature (MCSST) method, a split-window algorithm that utilizes AVHRR channels 4 and 5. This method is applicable for both daytime and nighttime retrievals, with different coefficients applied based on the satellite platform and observation time.
The MCSST was calculated using the following formula [37,38]:
MCSST = A × T4 + B × (T4T5) + C × (T4T5) × (sec(sza) − 1) + D × (sec(sza) − 1) + E
where T4 and T5 are the brightness temperatures from channels 4 and 5, respectively; sza is the satellite zenith angle; and sec denotes the secant function. Coefficients A, B, C, D, and E were determined based on calibration data from the National Environmental Satellite, Data, and Information Service (NESDIS).
Daily SST was generated by compositing the maximum SST value observed at each pixel from all snapshot images acquired on the same day. This maximum-value compositing approach was intended to minimize cold biases caused by cloud contamination and to represent the most reliable ocean surface temperature [39].
To further eliminate cloud-contaminated pixels, SST values that were significantly lower than the maximum values observed during the preceding and following six days (i.e., within a 7-day moving window) were identified as potential cloud artifacts and excluded from the daily composite. In addition, to eliminate land surface temperature (LST) contamination near coastal boundaries, SST pixels located within 5 km of the coastline were largely removed. Where such removal resulted in missing values near the coast, the nearest valid offshore SST values were used to fill the gaps, if available. Using these preprocessed snapshot images, daily composite SST data were constructed. Subsequently, monthly mean SSTs were calculated and used to derive annual averages for the period from 2000 to 2024.

2.2. Validation of NIFS SST Using In Situ Observation and OSTIA

To evaluate the reliability of the SST dataset produced by the NIFS, two complementary validation approaches were employed.
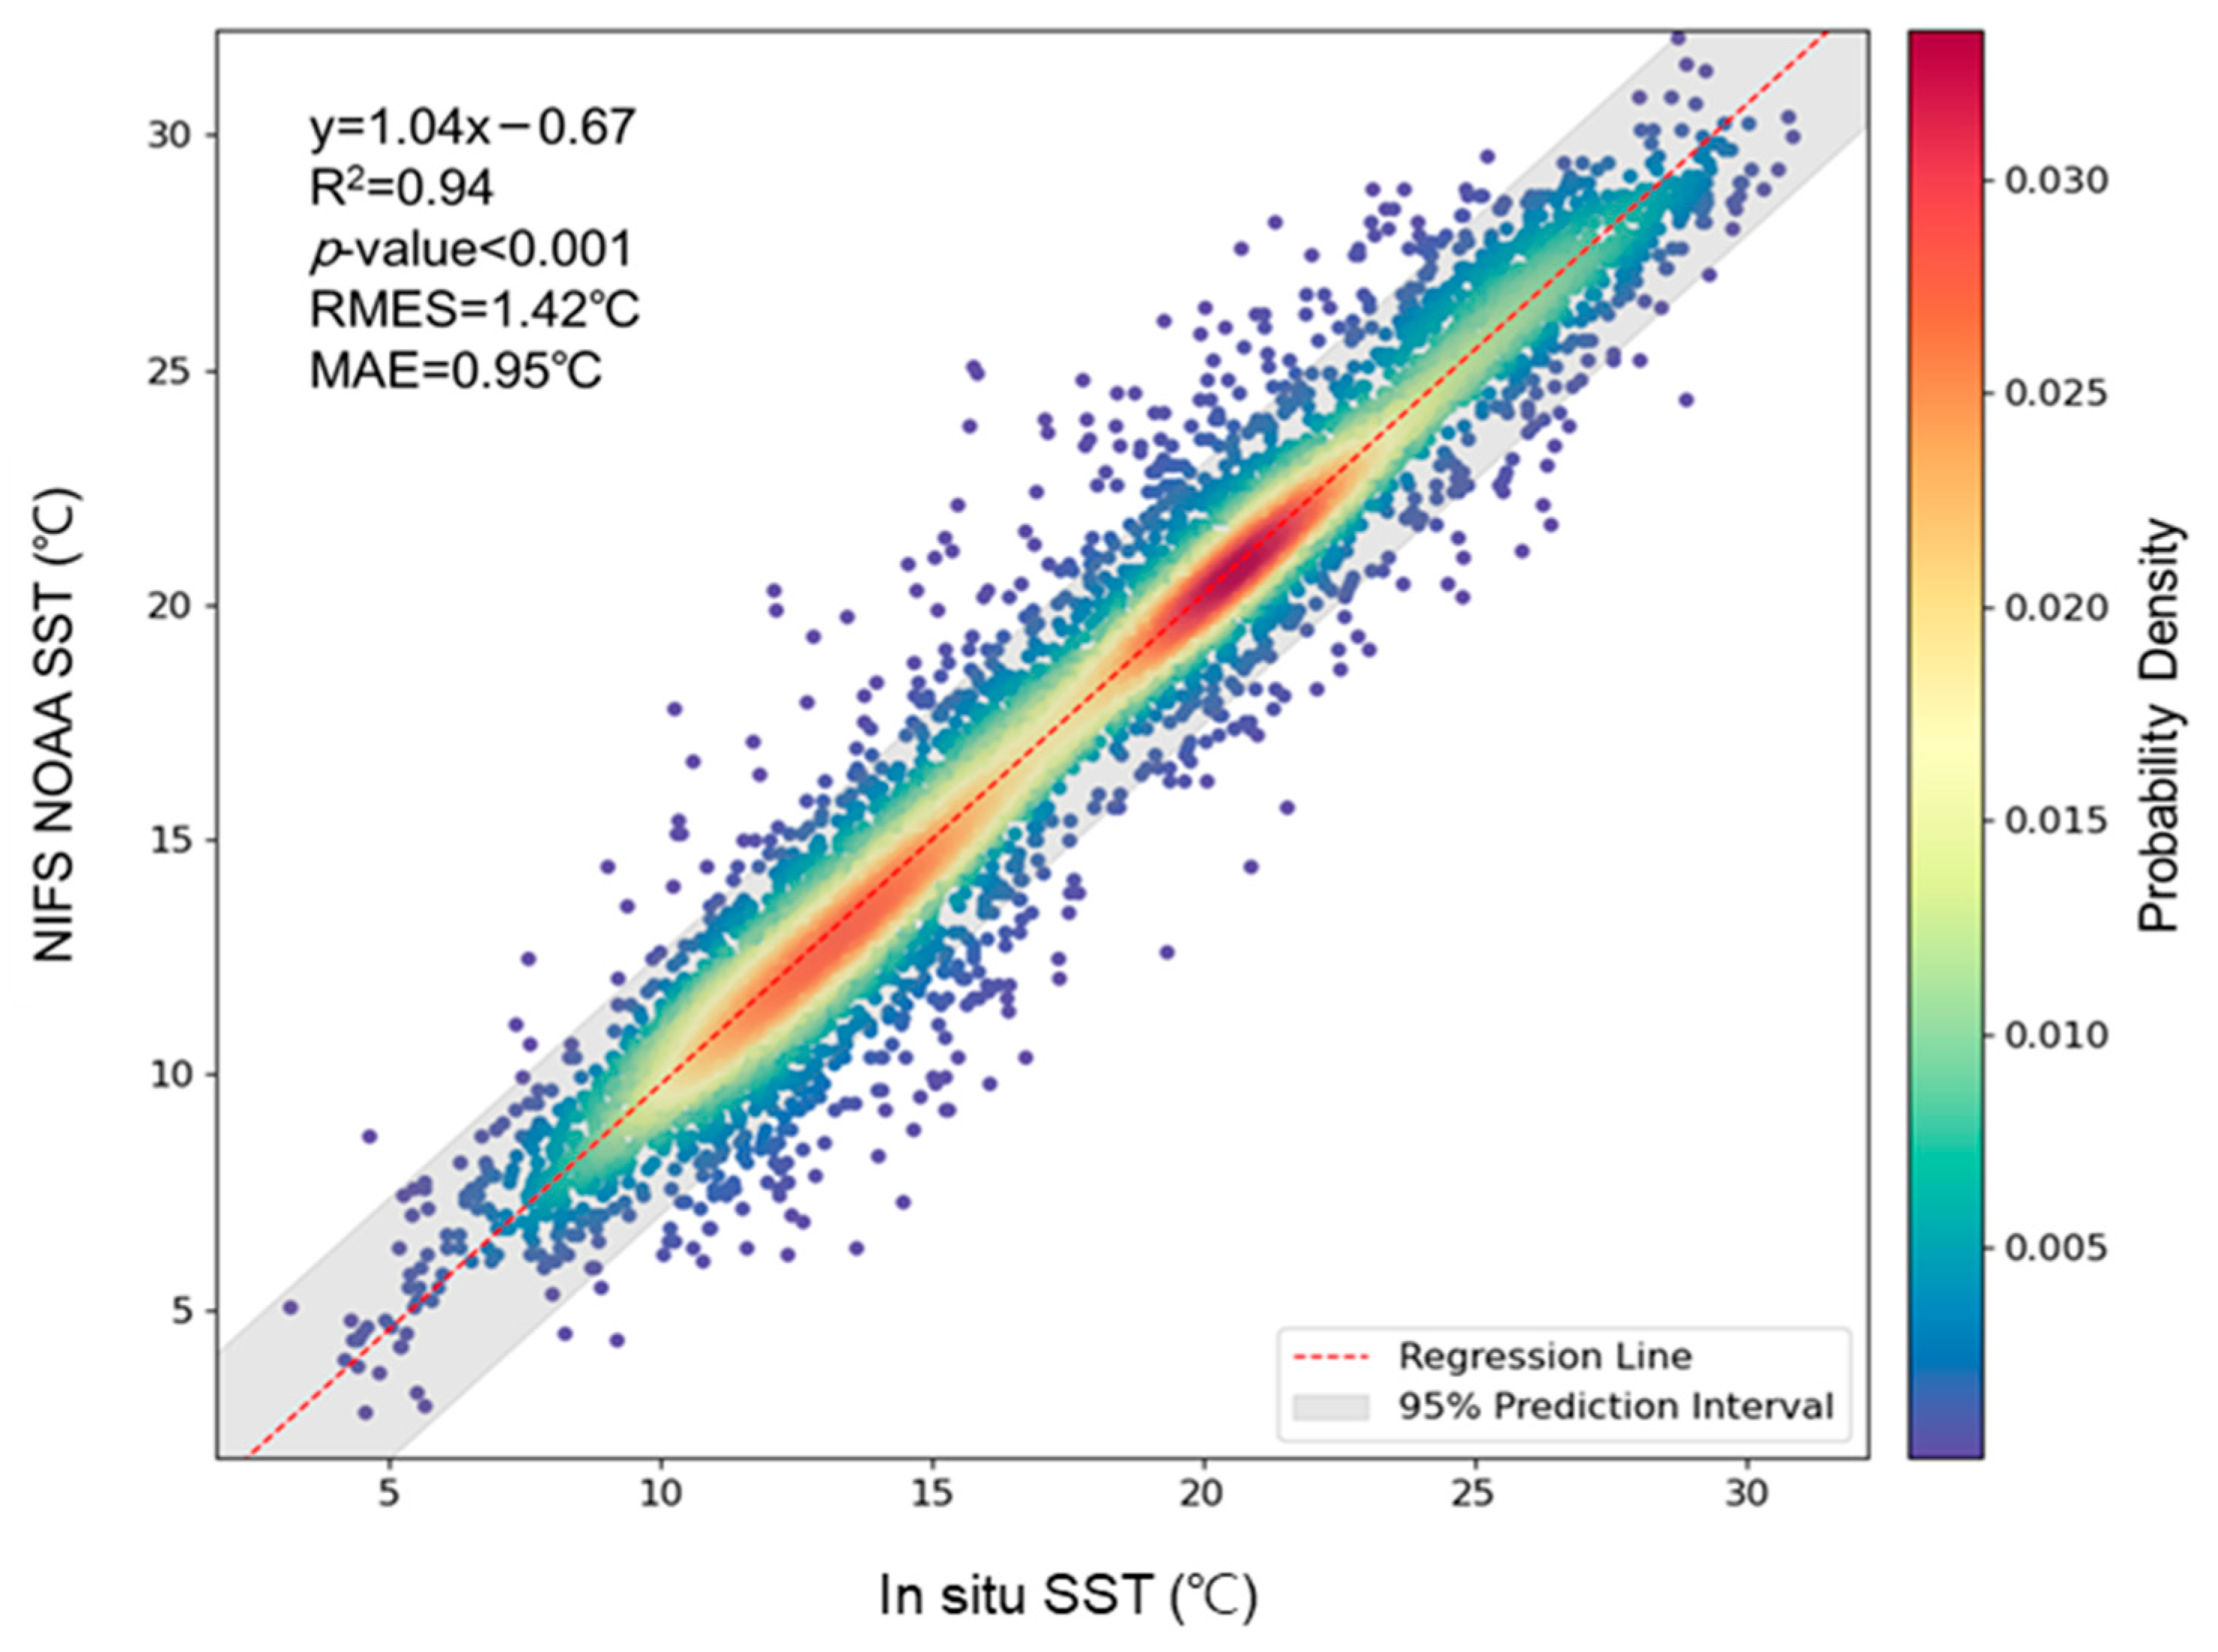
First, a point-based regression analysis was conducted using in situ SST observations from the NIFS Serial Oceanographic Observations (NSO) program, obtained from the Korea Oceanographic Data Center (KODC; https://www.nifs.go.kr/main.do, accessed on 31 July 2025) and covering the same period as this study. The observation sites used in this analysis are marked as black dots in Figure 1. The NSO in situ observations are conducted six times per year (February, April, June, August, October, and December), and NIFS NOAA SST values corresponding to these sampling dates were extracted for validation. Figure 2 represents a two-dimensional probability density-based scatterplot, where warmer (red) colors indicate higher densities of SST observation pairs and cooler (blue) colors indicate lower densities. The red dashed line denotes the regression line, and the gray shaded area represents the 95% prediction interval, reflecting the uncertainty in the regression estimate. The comparison between NIFS SST and collocated in situ SST observations yielded a strong linear relationship (y = 1.04x − 0.67, R2 = 0.94, RMSE = 1.42 °C, MAE = 0.95 °C), indicating high consistency between the two datasets.
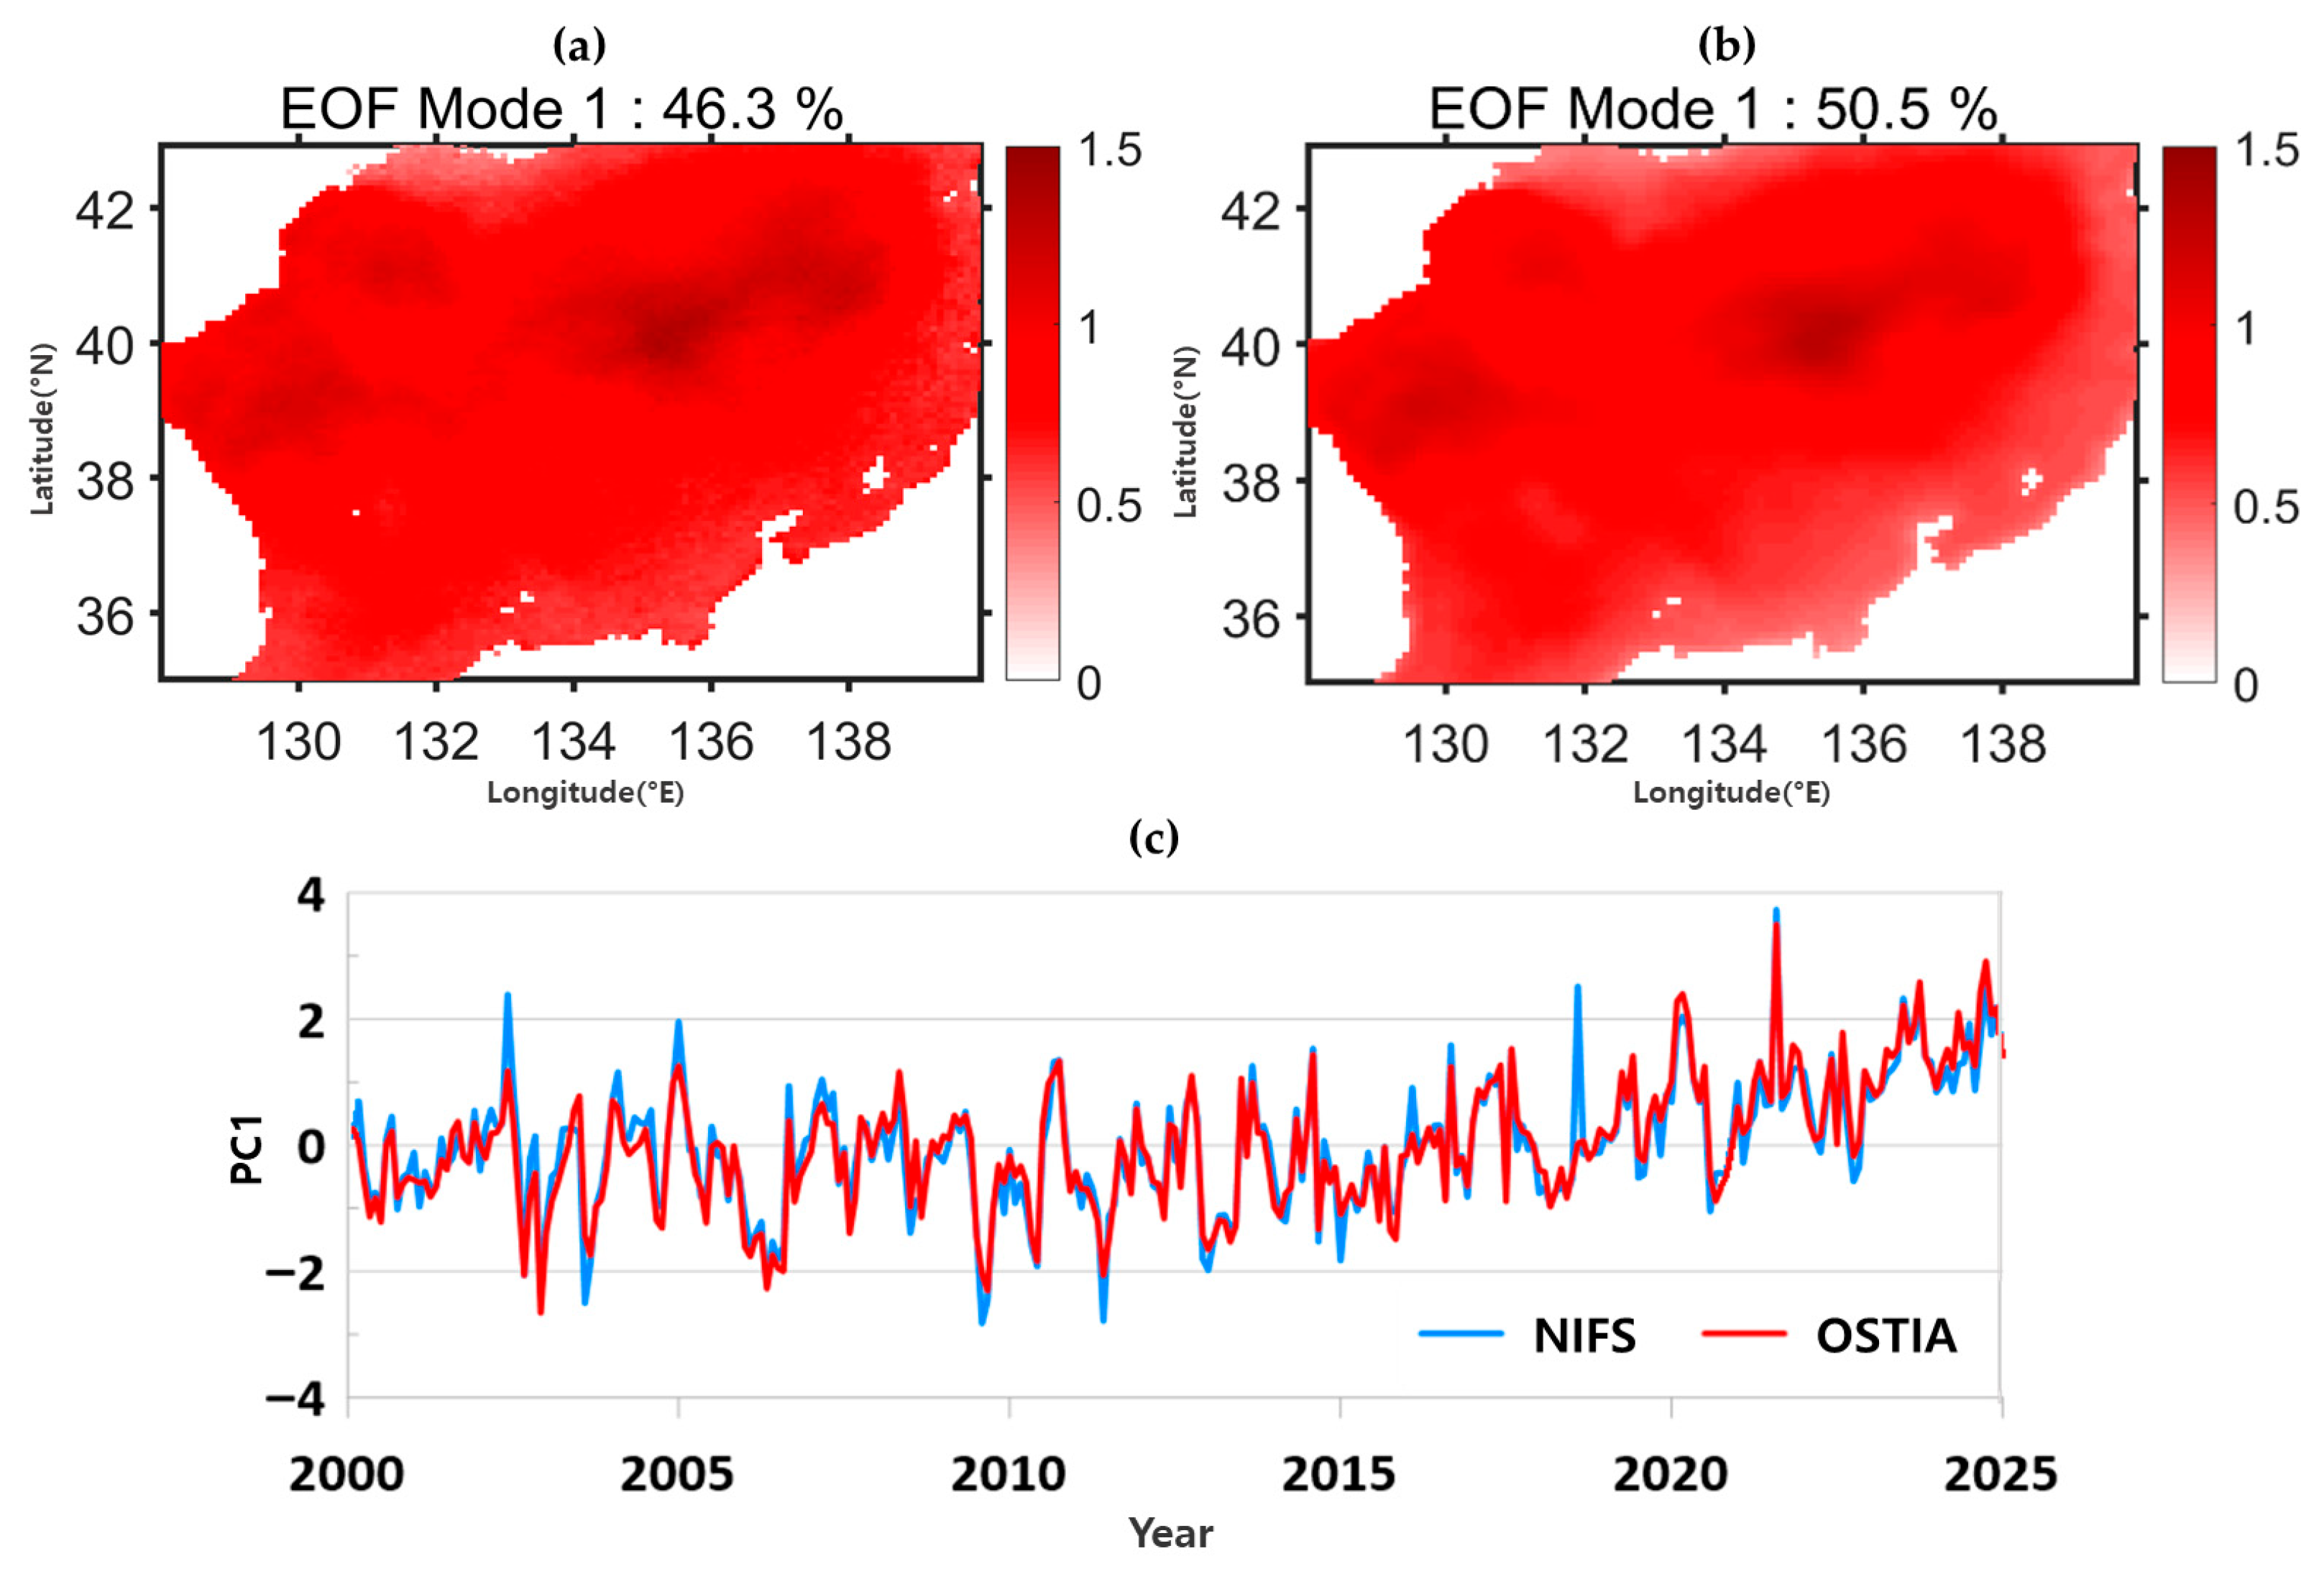
Second, to assess the spatiotemporal consistency of SST variability patterns, Empirical Orthogonal Function (EOF) analysis was applied to monthly SST anomalies from both the NIFS and Operational Sea Surface Temperature and Sea Ice Analysis (OSTIA) datasets. OSTIA, developed by the Copernicus Marine Environment Monitoring Service (CMEMS; https://marine.copernicus.eu, accessed on 10 January 2025), provides global SST fields at 0.05° spatial and daily temporal resolution. For consistency, OSTIA data were extracted over the same spatial domain and time period (2000–2024) as the NIFS dataset. Monthly means were computed from daily data, and anomalies were calculated by subtracting the long-term monthly climatology at each grid point. EOF analysis decomposes the total SST variance into orthogonal modes that represent dominant spatial patterns and their corresponding temporal evolutions. As shown in Figure 3a,b, the first mode (PC1) explained 46.3% and 50.5% of the total variance in the NIFS and OSTIA datasets, respectively. The spatial structures of PC1 were highly similar across the East Sea, and the PC1 time series from the two datasets exhibited strong temporal coherence throughout the study period (Figure 3c).
These results confirm the spatiotemporal reliability of the NIFS SST dataset relative to OSTIA and justify its use in subsequent analyses of SST isotherm shifts and ocean climate velocity in the East Sea over the 25-year study period.

2.3. Estimation of Ocean Climate Velocity

To estimate ocean climate velocity in the East Sea, spatial shifts in SST isotherms were analyzed using annual mean SST data from 2000 to 2024. The analysis focused on the predominant SST range of the region—12 °C to 18 °C—divided at 1 °C intervals. This temperature range was selected because it characterizes the dominant thermal structure of the East Sea and effectively captures the major spatial and temporal patterns of SST variability.
The study period was divided into five intervals based on segment trend analysis: Period A (2000–2004), Period B (2005–2009), Period C (2010–2014), Period D (2015–2019), and Period E (2020–2024). From the segmented trend analysis, we found the relative relationship with a trend of isotherm-located variation in 5 years from 2010 to 2025. Ocean climate velocity was quantified by calculating the latitudinal displacement of each isotherm between consecutive periods.
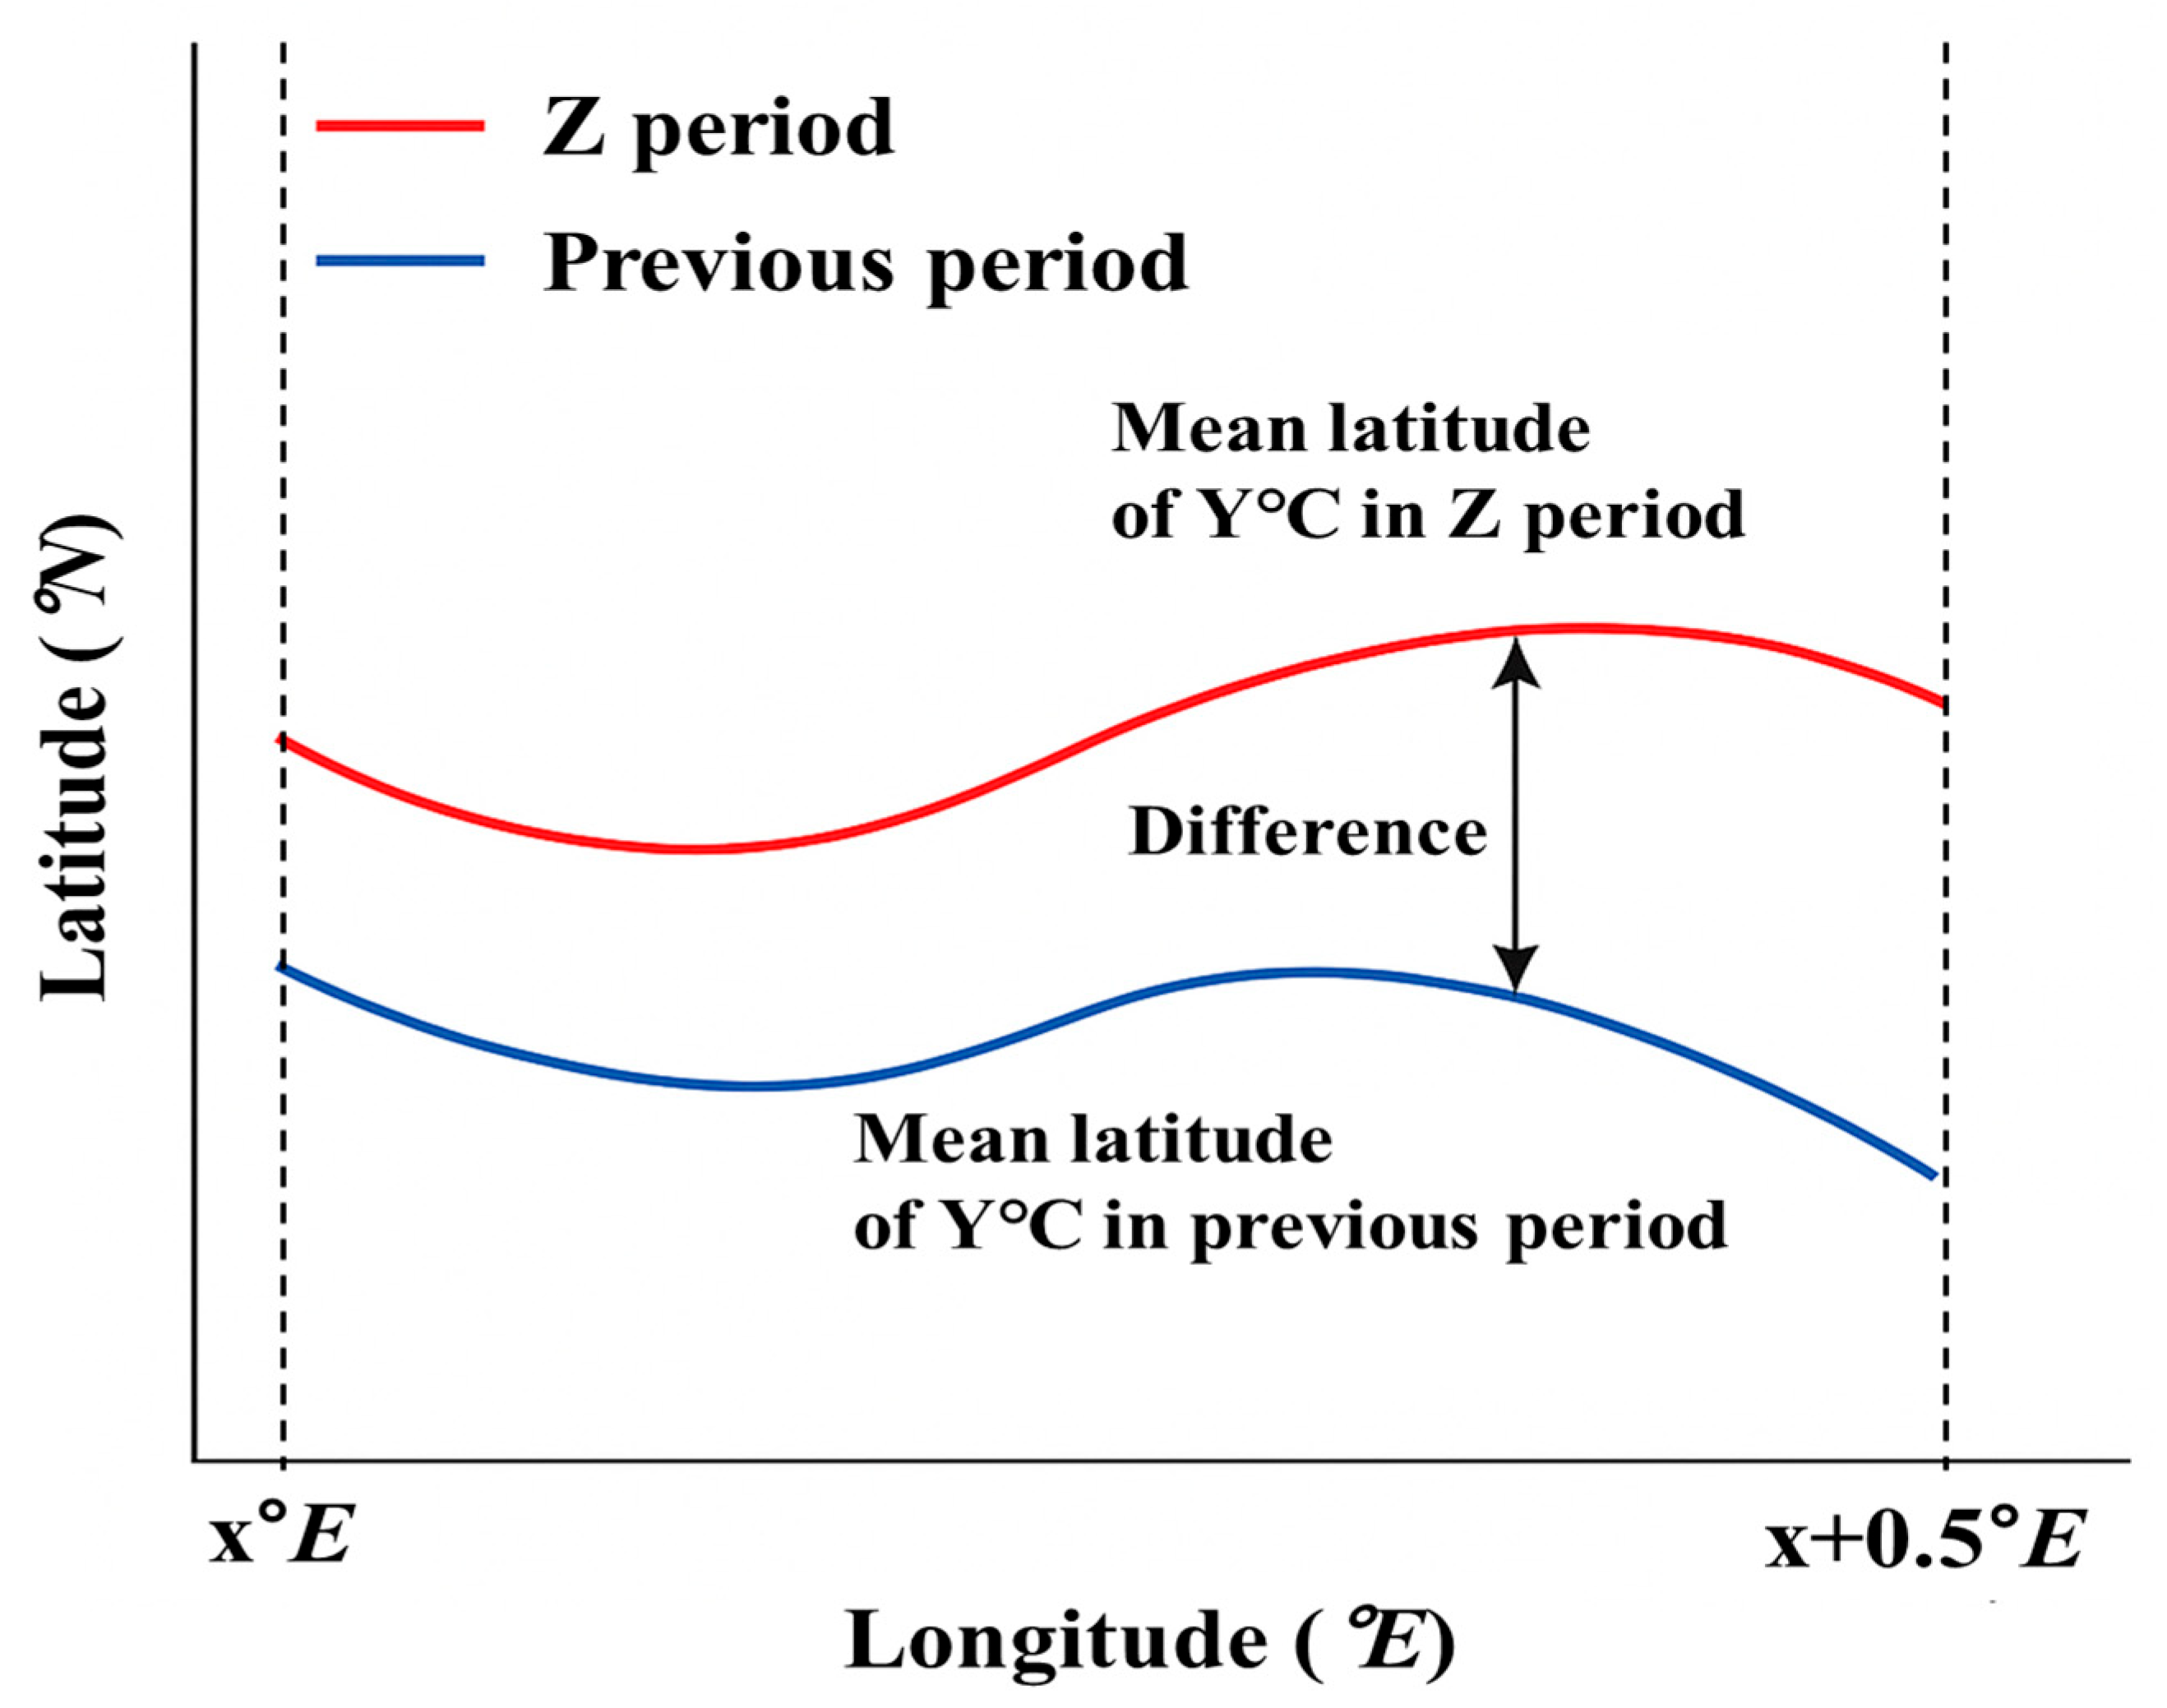
For each period, the average latitude of each isotherm was determined by averaging the latitude values at 0.5° longitudinal intervals along the isotherm line. The difference in average latitude between successive periods was then calculated. These differences were converted to linear distances by multiplying by 111 km, which corresponds to the average meridional length of 1° latitude between 35° N and 45° N. The resulting values represent the inter-period displacement of each isotherm and were standardized to decadal rates to derive estimates of ocean climate velocity.
A schematic representation of the methodology used to calculate isotherm displacement is shown in Figure 4. Based on the temporal framework, ocean climate velocity was categorized into four phases: Phase 1 (Period B—Period A), Phase 2 (Period C—Period B), Phase 3 (Period D—Period C), and Phase 4 (Period E—Period D).

2.4. Estimation of SST Zone Area

To assess changes in the spatial distribution of SST zones in the East Sea, the surface area of each SST zone was calculated using 5-year mean SST data from 2000 to 2024. For each period, the number of pixels falling within specific SST intervals was counted to estimate the area occupied by each temperature zone. SST values were binned into the following 1 °C intervals: 12.00–12.99 °C (12 °C), 13.00–13.99 °C (13 °C), 14.00–14.99 °C (14 °C), 15.00–15.99 °C (15 °C), 16.00–16.99 °C (16 °C), 17.00–17.99 °C (17 °C), and 18.00–18.99 °C (18 °C).
Since the length of 1° longitude decreases with increasing latitude, the area of each SST pixel was calculated using a spherical Earth model that accounts for this variation, as described in Equation (2):
A = R2 × Δϕ × Δλ × cos(ϕ),
where A is the pixel area (km2), R is Earth’s radius (~6371 km), Δϕ and Δλ are the latitudinal and longitudinal grid spacings in radians, and ϕ is the latitude at the center of the pixel. The cosine term corrects for meridional convergence toward the poles.
For the NIFS NOAA SST data, the grid resolution was set to 0.01° in both latitude and longitude. These values were converted to radians using Equation (3):
Δϕ = Δλ = (Δθ × π)/180
where Δθ is the angular resolution in degrees. The resulting pixel areas were then used to convert pixel counts into total area values for each SST zone and each time period.

2.5. Climate and Oceanographic Drivers of SST Variability

To investigate the environmental factors influencing SST variability in the East Sea, both atmospheric and oceanographic datasets were utilized. Atmospheric forcing was assessed using ERA5 reanalysis data provided by the European Center for Medium-Range Weather Forecasts (ECMWF; https://cds.climate.copernicus.eu, accessed on 21 January 2025). ERA5 offers hourly global data at a spatial resolution of 0.25° × 0.25° and is widely used in climate research.
For this study, monthly mean data for 2 m air temperature (T2M), 10 m zonal wind (u10), and meridional wind (v10) were extracted for the period 2000–2024. These variables were used to compute wind speed and dominant wind direction and characterize air–sea interactions affecting SST.
In addition to atmospheric conditions, oceanographic influences—particularly the modulation of the Kuroshio Current by the Pacific Decadal Oscillation (PDO) and the subsequent influx of the Tsushima Warm Current (TWC)—were also considered. PDO index data from the NOAA National Centers for Environmental Information (https://www.ncei.noaa.gov/access/monitoring/pdo/, accessed on 13 February 2025) and TWC transport data from the NIFS (https://www.nifs.go.kr/, accessed on 18 January 2025) were analyzed for the same period.
The TWC, a major branch of the Kuroshio Current, enters the East Sea through the Korea Strait via two main passages: the western channel, located between the Korean Peninsula and Tsushima Island, and the eastern channel, located between Tsushima Island and Kyushu, Japan (Figure 1). TWC transport estimates were derived from real-time sea level measurements collected at three coastal tide gauge stations (Busan, Izuhara, and Hakata) in Korea and Japan and converted into current transport values using a geostrophic approach. Specifically, sea level differences between the stations were used to calculate geostrophic velocities, which were then multiplied by the cross-sectional areas of the western and eastern channels of the Korea Strait to obtain total volume transport. This calculation method follows the approach proposed by ref. [40], which has been widely applied in previous studies of TWC dynamics. These climate and oceanographic indicators were analyzed alongside SST trends to identify the mechanisms driving long-term changes in thermal structure.

3. Results

3.1. Long-Term Latitudinal Shifts of SST Isotherms

Based on the validated NIFS SST dataset, a detailed analysis was conducted to examine the long-term variability in the spatial distribution of SST isotherms in the East Sea. Specifically, the latitudinal displacement of isotherms between 2000 and 2024 was quantified to estimate ocean climate velocity and assess spatial patterns of thermal structure change.
Figure 5 presents the linear trends in the average latitudinal positions of isotherms across different SST ranges. For relatively low SSTs, the regression results were as follows: 12 °C, y = 0.03x + 40.40 (R2 = 0.33); 13 °C, y = 0.02x + 40.27 (R2 = 0.18); 14 °C, y = 0.02x + 39.86 (R2 = 0.30); and 15 °C, y = 0.02x + 39.38 (R2 = 0.36). The average slope (γ) for these lower-temperature isotherms was approximately 0.02, indicating a northward latitudinal shift of about 0.02° per year.
In contrast, higher SST isotherms (16 °C and above) exhibited more pronounced northward displacement. The regression equations were 16 °C, y = 0.05x + 38.47 (R2 = 0.52); 17 °C, y = 0.06x + 37.22 (R2 = 0.48); and 18 °C, y = 0.06x + 35.84 (R2 = 0.46). The average slope for these higher-temperature isotherms was 0.056, reflecting a substantially accelerated northward migration of warmer SST zones. Although interannual fluctuations were observed, all isotherms exhibited a consistent northward trend throughout the study period.
This pattern suggests that surface warming is more strongly manifested in higher SST zones, likely due to enhanced surface heat flux and increased heat retention in warmer waters. The pronounced northward displacement of the 16–18 °C isotherms may indicate a shift in thermal habitat boundaries, potentially affecting the distribution of temperature-sensitive marine species. These findings underscore the potential for ecosystem-level impacts driven by the spatial reorganization of thermal structures, particularly in areas where the rate of isotherm shift is most pronounced.
To identify key environmental drivers influencing the northward migration of SST isotherms, we conducted a correlation analysis between the annual mean latitudinal position of isotherms and spatially averaged oceanographic and atmospheric variables over the entire East Sea. These variables include TWC transport, west and east channel flows, air temperature, PDO, and wind speed. The values of air temperature and wind speed represent spatial averages across the East Sea, as summarized in Table 1.
A correlation analysis revealed that the annual mean latitudinal positions of isotherms were significantly influenced by several environmental drivers (Table 1). Notably, air temperature exhibited the strongest positive correlation (r = 0.90, p < 0.01), indicating that increases in atmospheric warming were closely linked to northward shifts in thermal structure. TWC (r = 0.62) and west channel inflow (r = 0.64) also showed significant positive correlations (p < 0.01), whereas east channel inflow exhibited only a weak and statistically non-significant correlation. These results suggest that the northward advection of warm waters via the west channel plays a more substantial role in modulating isotherm migration compared to the east channel. The PDO, a key driver of TWC transport, showed a significant negative correlation (r = −0.48, p < 0.05) with the annual mean isotherm latitude, implying that negative-phase PDO conditions could indirectly facilitate northward isotherm migration. In particular, the persistent decline in the PDO index observed during the study period might have enhanced warm water transport through the TWC, thereby accelerating the poleward displacement of isotherms in recent years.
These findings underscore the potential for ecosystem-level impacts driven by the spatial reorganization of thermal structures, particularly in areas where the rate of isotherm shift is most pronounced.
While the linear trend analysis provided a quantitative estimate of the northward shift of SST isotherms over the entire study period, further insights can be gained by examining the spatial distribution patterns of SST during distinct multi-year periods. Therefore, we divided the 25-year dataset into five consecutive periods to identify temporal shifts in isotherm structures and regional thermal contrasts.

3.2. Period-Based Features of SST Distribution

The mean SST distribution for each period is shown in Figure 6. In Period A, SST ranged from 11 °C to 19 °C, with a regional mean of 14.69 °C. In Period B, the SST ranged from 9 °C to 19 °C, with a mean of 14.50 °C, which was 0.20 °C lower than that in Period A. Period C exhibited SSTs between 10 °C and 19 °C, with a mean of 14.58 °C, which was 0.08 °C higher than in Period B, indicating a similar overall distribution. In Period D, the SST ranged from 9 °C to 19 °C, with a mean of 14.90 °C, which was 0.32 °C higher than in Period C. Period E recorded the highest SST, ranging from 10 °C to 20 °C, with a mean of 15.64 °C. The lowest mean SST occurred in Period B, while the highest was in Period E. The distribution of surface isotherms generally showed a more northward position in the eastern region compared to the western region, with 134° E used as the central reference longitude. Consequently, SSTs in the eastern region were generally higher than those in the western region at the same latitude across most periods. A lower SST zone of 10 °C was observed during Periods B and D. Throughout most periods, the lowest (10 °C) and highest (19 °C) SST exhibited minimal latitudinal shifts. However, beginning in Period D, as SST increased, the 17 °C and 18 °C isotherms shifted noticeably northward, especially in the western region. In Period E, isotherms across all temperature ranges continued their northward displacement, indicating intensified regional warming.

3.3. Spatiotemporal Variability in SST Isotherm Locations

3.3.1. Latitudinal Shift Trends of SST Isotherms

The latitudinal distributions of SST isotherms (12–18 °C) exhibited clear temperature-dependent zonation, with cold isotherms located farther north and warmer isotherms farther south (Figure 7). The 12 °C isotherms consistently appeared at the northernmost latitudes, with median positions ranging from 40.4° N to 41.4° N and overall spans between 40.2° N and 41.9° N. Similarly, median positions of the 13–14 °C isotherms were centered around 40.0–40.9° N, showing narrower ranges and more stable spatial positioning. The 15 °C isotherm, located slightly farther south, exhibited median latitudes between 39.5° N and 40.2° N with a spatial range of approximately 1.3° (based on min–max latitude values), comparable to those of the 12–14 °C isotherms (1.2–1.6°), indicating similar spatial characteristics within this colder group. In contrast, the 16–18 °C isotherms displayed broader and more variable latitudinal distributions. The 16 °C isotherm ranged from 38.8° N to 39.7° N, with a median position that gradually shifted northward over time. The 17 °C and 18 °C isotherms exhibited even wider spatial spreads (37.7–38.6° N and 36.1–37.0° N for median latitude, respectively), often exceeding 2.4° in the latitudinal extent, reflecting greater spatial variability and a more dynamic response to oceanic warming.
Temporal trends further revealed distinct responses by temperature band (Figure 7). The 12 °C isotherm exhibited a southward shift until Period C, followed by a gradual northward trend through Periods D and E. The 13–15 °C isotherms maintained relatively stable positions until Period D, then showed an abrupt northward shift in Period E. Meanwhile, the 16–18 °C isotherms displayed a U-shaped trend, initially declining until Period B, then steadily increasing through Periods C to E. Notably, all isotherms exhibited a marked northward shift during Period E, with median positions increasing by 0.3–0.7° latitude compared to Period D. This synchronized latitudinal migration across temperature bands suggests a basin-wide warming acceleration in the most recent years.
To complement this trend-based analysis, the following section investigates the spatial distribution of SST across five distinct periods. By comparing the average SST ranges and associated spatial features during each phase, additional insights are provided into the evolution of thermal structure and regional warming patterns over time.

3.3.2. Longitudinal Displacement Distances Across Phases

In addition to regression-based trends analyzed earlier, this section extends the analysis by examining the actual spatial shift distances of each isotherm across four phases. To analyze the spatial variation trends in the shift distances of each isotherm, Figure 8 illustrates the shift distances by longitude for each phase.
In Phase 1, a pronounced northward displacement was observed along the western and eastern edges of the East Sea, whereas a southward shift occurred in the lower SST zones of the central region. The average displacement distances were −12.79 km at 12 °C, −16.48 km at 13 °C, −16.24 km at 14 °C, −20.05 km at 15 °C, −8.88 km at 16 °C, −24.13 km at 17 °C, and −15.63 km at 18 °C.
In Phase 2, isotherms from 12 °C to 16 °C shifted southward in the western East Sea, while all isotherms exhibited a northward trend in the central and eastern regions. The average displacement distances were −17.82 km at 12 °C, −14.97 km at 13 °C, 0.31 km at 14 °C, 2.50 km at 15 °C, 26.16 km at 16 °C, 40.74 km at 17 °C, and 25.68 km at 18 °C.
During Phase 3, all isotherms showed a consistent northward shift across the entire East Sea, with the strongest shift observed in the western region. The average displacement distances were 36.45 km at 12 °C, 24.52 km at 13 °C, 11.18 km at 14 °C, 18.89 km at 15 °C, 18.70 km at 16 °C, 34.15 km at 17 °C, and 31.49 km at 18 °C.
In Phase 4, most isotherms exhibited a marked northward displacement. However, some lower-temperature isotherms in the western region showed a slight southward shift. The average displacement distances were 72.36 km at 12 °C, 45.70 km at 13 °C, 43.30 km at 14 °C, 49.77 km at 15 °C, 72.35 km at 16 °C, 81.95 km at 17 °C, and 96.98 km at 18 °C.
To evaluate the cumulative changes, the displacement distances between Period A and Period E were compared (Figure 8e). Figure 8e shows the net displacement of SST isotherms, calculated as the difference in latitudinal position between Period A and Period E, without consideration of intermediate fluctuations. Overall, a clear northward displacement was observed, particularly for isotherms above 16 °C. The average displacement distances were 78.21 km at 12 °C, 38.77 km at 13 °C, 38.55 km at 14 °C, 51.11 km at 15 °C, 108.33 km at 16 °C, 132.71 km at 17 °C, and 138.52 km at 18 °C.
A phase-based comparison of net average displacements revealed the following values: −16.32 km in Phase 1, 8.94 km in Phase 2, 25.06 km in Phase 3, and 66.06 km in Phase 4. Among these, Phase 1 was the only period to exhibit a net southward displacement, while Phases 2 through 4 showed varying degrees of northward shift. Phase 4 recorded the greatest northward displacement, reflecting an intensification of regional warming in recent years.
To quantify the long-term trend, the net latitudinal displacement between Period E and Period A was also assessed. The mean displacement across all SST zones reached 83.74 km, indicating a substantial northward expansion of warm-water isotherms over the past two decades.

3.3.3. Comparison of SST Isotherm Distributions Between Period A and Period E

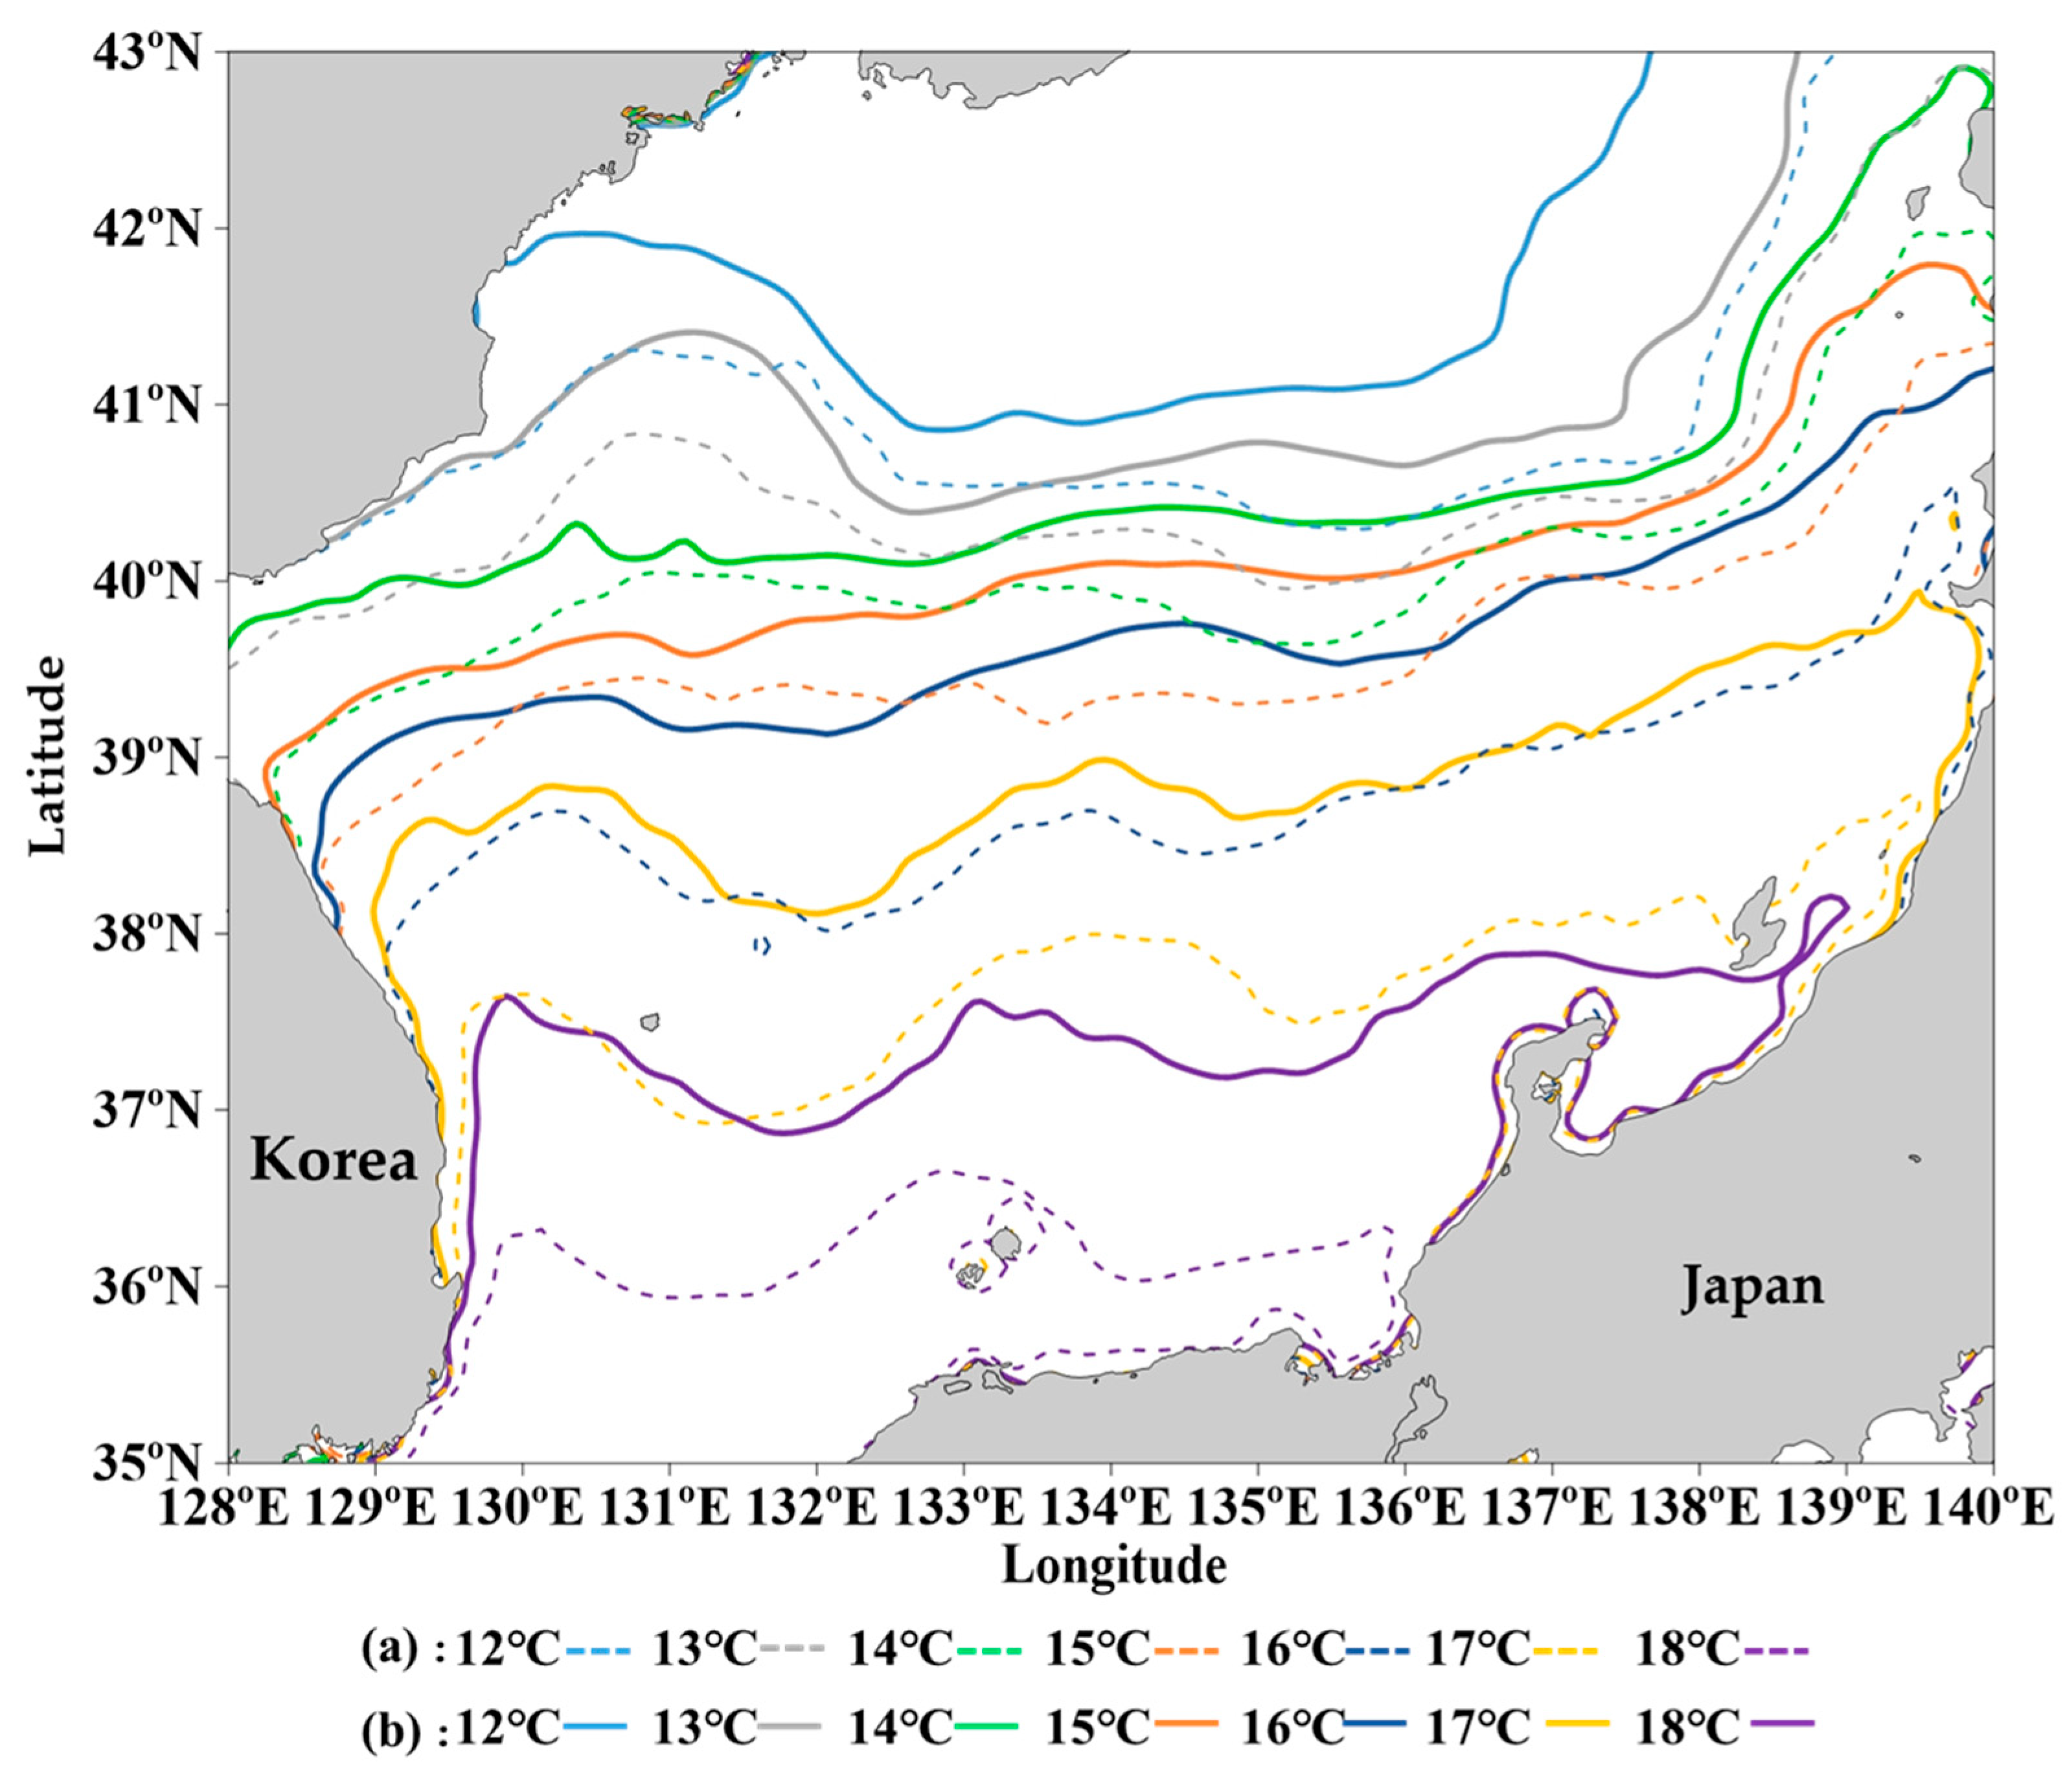
To visualize the cumulative shifts in SST isotherms over the 25-year study period, Figure 9 compares their latitudinal distributions between Period A (2000–2004) and Period E (2020–2024). In this figure, dashed lines represent the spatial positions of SST isotherms during Period A, while solid lines denote those during Period E, covering the 12–18 °C temperature range.
The comparison reveals a consistent northward shift of all isotherms in Period E relative to Period A, reflecting a broad-scale warming trend across the East Sea. For low-temperature isotherms (12–15 °C), a general northward shift was observed, although the magnitude of change was relatively modest. In some longitudinal regions, these isotherms remained at similar latitudes, suggesting regional variability in the warming pattern. In contrast, high-temperature isotherms (16–18 °C) exhibited a more substantial northward displacement, particularly in offshore areas. This pronounced latitudinal displacement aligns with previous results and provides clear visual evidence of intensified warming in the East Sea. The magnitude and pattern of these shifts suggest a poleward reorganization of the thermal structure, which may have ecological implications for temperature-sensitive marine species.

3.4. Variations in SST Zone Areas Associated with Isotherm Shift

While the preceding analysis focused on latitudinal shifts of SST isotherms, it is also critical to assess how the surface area associated with each temperature zone has changed over time. This section examines the expansion and contraction of SST zones to better understand the spatial impacts of long-term warming in the East Sea.
Table 2 presents the distribution areas of SST zones from 12 °C to 18 °C across five time periods, reflecting changes associated with the northward shift of isotherms. Although the total area of each zone fluctuated throughout the study period, distinct patterns emerged depending on the temperature range: mid-temperature zones (14–16 °C) generally contracted, while higher-temperature zones (17–18 °C) exhibited significant expansion.
Specifically, the 12 °C SST zone expanded from 43.01 × 10³ km2 in Period A to 58.33 × 10³ km2 in Period E, representing an increase of 15.32 × 10³ km2. The 13 °C SST zone slightly decreased in Period B compared to Period A, reached its lowest value in Period C, and then increased again during Periods D and E. By Period E, the 13 °C SST zone had expanded by 10.15 × 10³ km2 compared to Period A.
In contrast, the distribution areas of the 14–16 °C zones exhibited a general declining trend. The 14 °C SST zone showed relatively minor variation, ranging from 40.55 to 48.64 × 10³ km2 across the periods. Although a sharp decrease occurred in Period D, a modest recovery in Period E resulted in a net loss of 5.09 × 10³ km2 compared to Period A. The 15 °C zone experienced the most substantial contraction, declining from 80.16 × 10³ km2 in Period A to 42.12 × 10³ km2 in Period E—a decrease of 38.04 × 10³ km2, or approximately 47%. The 16 °C zone initially expanded to 100.43 × 10³ km2 in Period B but declined thereafter, resulting in a net loss of 13.70 × 10³ km2 by Period E.
These patterns indicate that mid-temperature SST zones have contracted, coinciding with the northward expansion of higher-temperature zones. The 17 °C and 18 °C zones exhibited temporary decreases during Period B, followed by sustained growth throughout the remainder of the study period. The area of the 17 °C zone increased from 88.02 × 10³ km2 in Period B to 122.49 × 10³ km2 in Period E. The 18 °C zone showed the most dramatic change, more than doubling in area over the study period. A sharp increase of 38.70 × 10³ km2 occurred between Periods D and E alone. Compared to Period A, the 18 °C zone expanded by 52.91 × 10³ km2, representing a 136% increase. These results underscore a substantial northward expansion of the warmest SST zones, reflecting the spatial reorganization of thermal structure in response to ongoing ocean warming.

3.5. Ocean Climate Velocity on SST Shifts in the East Sea

To quantify the dynamic characteristics of the isotherm change, ocean climate velocity was calculated based on the latitudinal displacement of each SST isotherm over time. Table 3 summarizes the mean ocean climate velocity (km/decade) for each isotherm, derived from latitudinal displacement observed across four phases and over the entire study period (Period E—Period A).
In Phase 1, the mean ocean climate velocity was −32.63 km/decade, indicating a net southward displacement of all SST isotherms from 12 °C to 18 °C and individual velocities ranging from −17.77 to −48.26 km/decade, with the 17 °C isotherm exhibiting the greatest southward shift at −48.26 km/decade.
In Phase 2, the mean velocity reversed direction, and ocean climate velocity increased to 17.89 km/decade. Although the 12 °C and 13 °C isotherms continued to shift southward at −35.64 km/decade and −29.94 km/decade, respectively, the 14–18 °C isotherms displayed northward shifts, with velocities ranging from 0.62 to 81.47 km/decade. Among these, the 16 °C, 17 °C, and 18 °C isotherms exhibited notable rapid northward movement at 52.33 km/decade, 81.47 km/decade, and 51.35 km/decade, respectively, clearly differentiating them from the lower-temperature zones.
In Phase 3, the mean ocean climate velocity increased further, to 50.11 km/decade, representing a 32.23 km/decade rise from Phase 2. The 12–15 °C isotherms shifted northward at a velocity ranging from 22.37 to 72.91 km/decade, with the 12 °C isotherm exhibiting the highest rate among them. The 16–18 °C isotherms also continued to move northward, with velocities between 37.41 and 68.30 km/decade. Notably, the 12 °C, 17 °C, and 18 °C isotherms recorded the most rapid displacement, indicating an increasingly heterogeneous pattern of thermal structure change.
In Phase 4, the mean ocean climate velocity rose substantially to 132.12 km/decade, the highest among all the phases. All isotherms from 12 °C to 15 °C exhibited accelerated northward shifts, with velocities ranging from 86.60 to 148.77 km/decade. The 16–18 °C isotherms shifted even more rapidly, reaching rates between 144.70 and 193.97 km/decade. Particularly, the 18 °C isotherm reached 193.97 km/decade—the fastest velocity recorded across all periods—highlighting a dramatic intensification of warming in the warmest SST zones.
Over the entire study period (Period E—Period A), all SST isotherms displayed a general northward displacement. The 12–15 °C isotherms exhibited relatively moderate northward velocities, ranging from 30.84 to 62.57 km/decade. In contrast, the 16–18 °C isotherms shifted more rapidly, with velocities ranging from 86.67 to 110.81 km/decade. Notably, the 17 °C and 18 °C isotherms recorded strong northward shifts at 106.17 km/decade and 110.81 km/decade, respectively, underscoring the intensified expansion of warmer SST zones.
Reflecting these patterns, the mean ocean climate velocity across all isotherms during the 21st century was 66.99 km/decade. These results provide clear evidence of a substantial increase in ocean climate velocity in the East Sea, particularly in higher-temperature zones, indicating accelerated ocean warming and the potential for significant ecological impacts.

4. Discussion

4.1. Analysis of SST Front Distribution Variability in the East Sea

This study examined changes in SST, isotherm positions, and the thermal structure of the East Sea (Korean East Sea) over the period 2000–2024 using satellite-derived SST data. During this period, SST isotherms exhibited a consistent northward displacement, particularly in higher-temperature zones above 16 °C. As a result, the surface area occupied by warm waters expanded, while low-temperature zones contracted—allowing for the estimation of ocean climate velocity across the East Sea.
A period-based analysis revealed a temporary southward shift of isotherms during Period B across all temperature bands, followed by a steadily intensifying northward migration from Period C through Period E (Figure 7). These trends indicate a long-term warming pattern modulated by interannual and seasonal variability [41,42,43,44,45].
Previous studies have identified East Asian monsoons, wind field changes, and ocean–atmosphere interactions as key SST drivers in the region [42]. In particular, ref. [44] noted the importance of the PDO, closely linked to Kuroshio Current dynamics, in shaping SST variability. The observed sustained SST increase appears to be driven by enhanced Kuroshio-origin warm-water intrusion into the East Sea, especially during summer when current velocities peak. Monthly SST contributions to the annual average showed that August alone accounted for 15.25%, reflecting peak seasonal warming.
The prolonged negative phase of the PDO, dominant over the past 25 years, may have amplified this effect by enhancing Kuroshio inflow into the East Sea [46]. This is supported by prior findings that negative PDO phases correlate with SST increases in summer and autumn, with stronger effects during autumn [47]. Warm Kuroshio inflows under such PDO conditions raise SST in the southern East Sea and promote high-temperature zone expansion [46]. Observations of long-term Kuroshio warming from 1950 to 2010 further support the poleward shift of isotherms [48,49].
Recent studies also report persistent SST elevation and intensified TWC transport in Korean coastal waters [50]. Since 1989, TWC volume transport through the Korea/Tsushima Strait has increased by 0.0148 Sv/year [40], a trend confirmed by this study (Figure 10). This increase is closely linked to both SST rise and the northward migration of isotherms.
Changes in TWC channel structure further illustrate spatial variability in isotherm shifts. From Periods A to C, east channel transport increased while west channel transport temporarily declined, leading to greater warming and northward shifts in the eastern East Sea and local southward shifts in the west during Phase 2 (Figure 8). In contrast, Periods C to D showed the reverse: west channel recovery and east channel weakening, aligning with Phase 3 trends where westward regions experienced more pronounced northward movement.
To better understand the physical mechanisms driving SST and isotherm variability in the East Sea, we examined the influence of both large-scale climatic and regional oceanographic factors. These included the PDO, the transport of the TWC, wind fields, and air temperature across the five study periods.
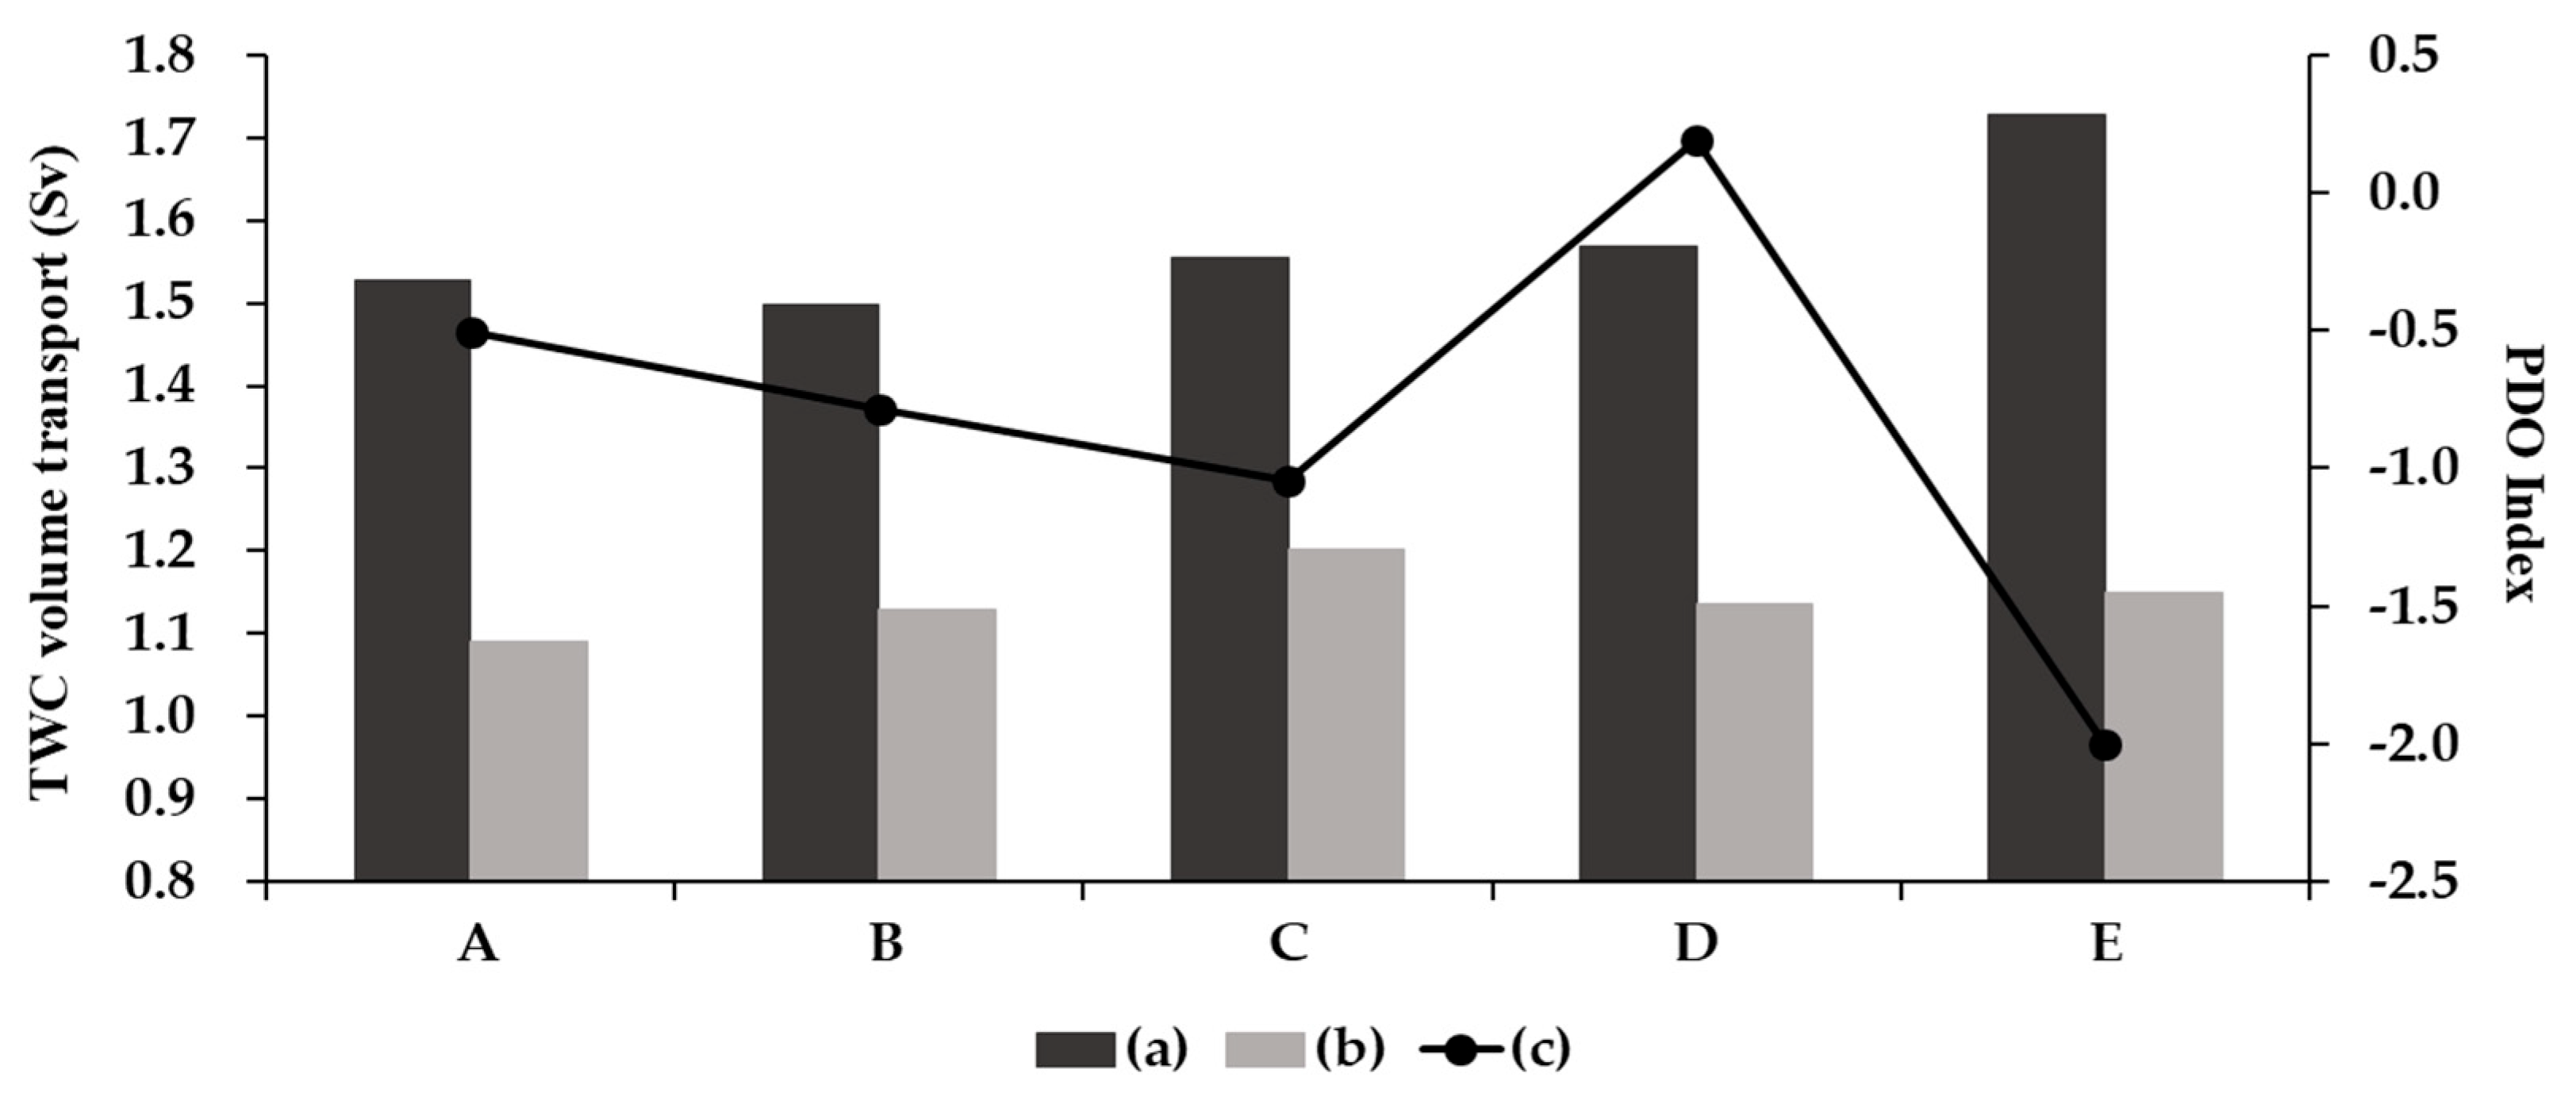
Figure 10 presents changes in TWC volume transport through the west channel (a) and east channel (b), along with variations in the PDO index (c) over time. The total TWC transport was calculated as the sum of the transports in both channels. The west channel showed a gradual increase, particularly from Period B to Period E, while the east channel exhibited relatively stable transport throughout the study period. The combined TWC transport averaged 2.70 Sv, increasing from 2.59 Sv in Period A to 2.71 Sv in Period C, followed by a slight decline in Period D (2.75 Sv) and a subsequent increase to 2.87 Sv in Period E.
The PDO index remained predominantly negative over the study period, except for a brief positive phase in Period D (0.19). The strongest negative phase was observed in Period E (−2.00). This trend appears to correspond inversely with the total TWC transport, which increased notably during the strongly negative PDO phases in Periods C and E. Conversely, the temporary decrease in TWC transport during Period D coincided with the positive PDO phase, suggesting a potential inverse relationship between PDO variability and TWC strength.
These findings indicate that negative PDO phases may enhance TWC volume transport, which in turn can affect SST and isotherm positions in the East Sea. The latitudinal displacement of warm SST isotherms observed during these periods may thus be partially attributed to increased oceanic heat transport associated with TWC intensification under negative PDO conditions.
In addition to oceanic drivers such as PDO and TWC, atmospheric forcing also plays a critical role in modulating SST variability. Based on monthly mean reanalysis data from the ERA5 dataset (ECMWF), changes in surface air temperature and wind patterns were analyzed. The results indicate a gradual increase in mean air temperature, rising from 11.50 °C in Period A to 12.60 °C in Period E. The most notable increase occurred in Period E, coinciding with the highest recorded SST during the same period. This parallel increase suggests a reinforcing effect of atmospheric warming on surface ocean conditions.
In contrast, the average wind speed remained relatively stable across all periods, fluctuating within a narrow range of 5.52 to 5.62 m/s. Despite minor variation in speed, the dominant wind direction consistently remained northwesterly throughout all study periods, indicating persistent large-scale atmospheric circulation. This directional stability, together with minimal changes in wind speed, suggests that thermal forcing—rather than wind-driven mixing or directional changes—was the primary atmospheric factor influencing SST variability and isotherm shifts in the East Sea.
These findings align with previous studies. For example, ref. [51] reported that rising sea levels during interglacial periods enhanced TWC inflow, increasing SST across the East Sea. Stronger anticyclonic recirculation and a northward subpolar front (SPF) shift were major warming contributors to both eastern and western margins. Modeling efforts further suggest that changes in ocean current structure exert a stronger influence on SST than atmospheric factors.
Satellite altimetry data support this, revealing variability in the surface current structure [52]. While the eastern polar front remained relatively stable, the western front displayed greater north–south shifts, affecting upper-layer SST. EOF analysis showed that SST variability from 1993 to 2000 reflected EKWC meandering, whereas post-2001 changes were more closely tied to intensity fluctuations of the EKWC in the southwestern Yamato Basin.
Additionally, ref. [53] emphasized positive feedback loops involving SST, sea-level pressure, cloud cover, and longwave radiation, which may have amplified SST anomalies in the subtropical North Pacific.
In summary, the northward displacement of SST isotherms and the acceleration of ocean climate velocity in the East Sea are primarily influenced by both atmospheric and oceanic drivers. Among these, air temperature exhibited the strongest positive correlation with isotherm position (r = 0.90, p < 0.01), highlighting the dominant role of atmospheric warming. TWC transport and west channel inflow also showed significant positive correlations (r = 0.62 and 0.64, respectively), underscoring their importance in advecting warm water northward. In contrast, east channel inflow and wind speed showed weak or insignificant correlations, suggesting a lesser or negligible role in modulating thermal structure. Therefore, while oceanic processes remain crucial, atmospheric warming has emerged as a primary driver of isotherm migration during the study period.

4.2. Variability in Ocean Climate Velocity in the East Sea

This study estimated the ocean climate velocity in the East Sea over the past 25 years (2000–2024) to be 66.99 km/decade. This rate is approximately 2.5 times higher than the historical estimate of 27 km/decade for the same latitude between 1960 and 2010 [10], indicating a significant acceleration in the northward displacement of SST isotherms. Such rapid displacement suggests that thermal boundaries in the East Sea are shifting more quickly than in other regions, with important implications for regional marine ecosystems. The observed expansion of higher-temperature zones and contraction of lower-temperature zones reflect major alterations in thermal habitat distribution, potentially affecting ecologically and commercially important species.
These trends are particularly concerning given the East Sea’s well-documented sensitivity to climate change. Often referred to as a “small ocean”, the East Sea has shown amplified warming signals relative to other marginal seas [43,50,54,55,56]. Between 1982 and 2006, SST in the East Sea increased by 1.1 °C—more than double the global average for continental margin seas (0.4 °C) [57]. Rising SST has been linked to modifications in deep-sea circulation and vertical stratification [58,59], which in turn have disrupted the vertical distribution of chemical properties [50,60] and reduced nutrient availability in areas such as the Ulleung Basin [32,61]. These physical changes have cascading ecological consequences, particularly at the base of the food web. For example, ref. [62] reported significant changes in the timing and intensity of spring phytoplankton blooms between 1998–2001 and 2008–2011. In the southwestern East Sea, the contribution of small-sized phytoplankton (<2 μm) to total chlorophyll-a has increased by approximately 0.5% annually over the past two decades [63], while overall phytoplankton primary productivity has steadily declined [64]. Such shifts indicate a restructuring of primary production dynamics, with potential impacts on species composition, trophic interactions, and fishery productivity [65,66].
These changes reflect not only environmental pressures but also the ecological significance of ocean climate velocity. According to ref. [16], biological climate velocity—the rate at which marine species must shift to maintain their thermal niche—averages around 51.5 km/decade globally. However, in the East Sea, the physical climate velocity already exceeds this threshold, suggesting that thermal habitat shifts may be outpacing the adaptive capacity of many organisms. As SST isotherms migrate northward, temperature-sensitive species are likely to follow, leading to substantial changes in species distributions, community structure, and local biodiversity.
Observed biological responses already reflect these dynamics. For instance, ref. [47], using the Integrated Fisheries Risk Management Evaluation framework, found that rising SST has facilitated the northward migration of mackerel in Korean waters. Similarly, ref. [67] reported that surface and subsurface warming (100 m depth) has expanded the fishing grounds of squid (Todarodes pacificus) since the 1990s. In contrast, ref. [68] observed that spawning habitats and suitable environmental ranges for pollock (Gadus chalcogrammus) have contracted since the 1980s, contributing to stock declines.
Together, these findings highlight the vulnerability of marine ecosystems to accelerated ocean climate velocity. As thermal boundaries continue to shift rapidly, cascading biological responses are likely to intensify. Understanding ocean climate velocity not only as a physical measure but also as an ecological indicator is therefore essential. Adaptive, ecosystem-based management strategies will be critical to mitigate the impacts of ongoing climate change on fisheries, biodiversity, and the broader marine environment.

5. Conclusions

This study revealed a significant poleward shift in SST isotherms in the East Sea from 2000 to 2024, with an average ocean climate velocity of 66.99 km per decade—more than double the global biological climate velocity threshold of 51.5 km per decade. Consistent with previous reports that the East Sea has experienced the highest rate of ocean warming among Korean waters, our findings confirm that warming in this region is accelerating, accompanied by a substantial reorganization of the thermal structure. High-temperature isotherms (16–18 °C) migrated consistently northward, and the SST area exceeding 18 °C more than doubled compared to the early 2000s.
Among the key environmental drivers, atmospheric warming showed the strongest correlation with isotherm position, followed by TWC transport and west channel inflow. This confirms that atmospheric forcing plays a dominant role, while oceanic advection, particularly through the TWC’s west channel, provides a significant complementary influence. These thermal shifts have important ecological implications, including the expansion of warm-water habitats, contraction of cold-water zones, and increased risk to temperature-sensitive marine species, potentially disrupting biodiversity and ecosystem functioning. Given the East Sea’s high sensitivity to climate variability, proactive, ecosystem-based management strategies should be prioritized, including climate-informed marine spatial planning and dynamic fishery regulation. Continued investment in long-term monitoring and multidisciplinary research will be essential to enhance the resilience of marine ecosystems in the face of ongoing climate change.

Author Contributions

Conceptualization, I.H.; Formal analysis, C.K.; Funding acquisition, I.H.; Investigation, J.A.; Methodology, J.A., I.H., and H.J.; Project administration, H.J.; Supervision, H.J.; Validation, C.K.; Visualization, J.A., C.K., and H.J.; Writing—original draft, J.A., I.H., and H.J.; Writing—review and editing, C.K., I.H., and H.J. All authors have read and agreed to the published version of the manuscript.

Funding

This research was supported by a grant (R2025014) from the National Institute of Fisheries Science (NIFS), funded by the Ministry of Oceans and Fisheries, Republic of Korea.

Institutional Review Board Statement

Not applicable.

Informed Consent Statement

Not applicable.

Data Availability Statement

The original contributions presented in this study are included in the article material. Further inquiries can be directed at the corresponding authors.

Acknowledgments

The authors would like to thank the Copernicus Marine Service for making the OISST data available, and the European Center for Medium-Range Weather Forecasts (ECMWF) for supplying the ERA5 reanalysis data. The Pacific Decadal Oscillation (PDO) index was obtained from the NOAA Physical Sciences Laboratory. We also appreciate the constructive feedback provided by colleagues during the development of this study. Special thanks are extended to HyoKeun Jang, HwaEun Jeong and DoHyeon Kwon (all from NIFS) for their valuable assistance with data processing and analysis.

Conflicts of Interest

The authors declare no conflicts of interest.

Abbreviations

SSTSea Surface Temperature
OHCOcean Heat Content
NOAANational Oceanic and Atmospheric Administration
MCSSTMulti-Channel Sea Surface Temperature
EOFEmpirical Orthogonal Function
PDOPacific Decadal Oscillation
TWCTsushima Warm Current

References

  1. IPCC. Climate Change 2021, The Physical Science Basis. Contribution of Working Group I to the Sixth Assessment Report of the Intergovernmental Panel on Climate Change; Cambridge University Press: Cambridge, UK; New York, NY, USA, 2021; p. 2391. [Google Scholar]
  2. WMO (World Meteorological Organization). State of the Global Climate 2022; WMO No. 1316; WMO: Geneva, Switzerland, 2023; p. 55. Available online: https://library.wmo.int/records/item/66214-state-of-the-global-climate-2022 (accessed on 21 April 2023).
  3. Cheng, L.; Abraham, J.; Trenberth, K.E.; Boyer, T.; Mann, M.E.; Zhu, J.; Wang, F.; Yu, F.; Locarnini, R.; Fasullo, J.; et al. New Record Ocean Temperatures and Related Climate Indicators in 2023. Adv. Atmos. Sci. 2024, 41, 1375–1381. [Google Scholar] [CrossRef]
  4. Li, Z.; England, M.H.; Groeskamp, S. Recent Acceleration in Global Ocean Heat Accumulation by Mode and Intermediate Water. Nat. Commun. 2023, 14, 6888. [Google Scholar] [CrossRef] [PubMed]
  5. Storto, A.; Balmaseda, M.A.; De Boisseson, E.; Giese, B.S.; Masina, S.; Yang, C. The 20th Century Global Warming Signature on the Ocean at Global and Basin Scales as Depicted from Historical Reanalyses. Int. J. Climatol. 2021, 41, 5977–5997. [Google Scholar] [CrossRef]
  6. Cheng, L.; Foster, G.; Hausfather, Z.; Trenberth, K.E.; Abraham, J. Improved Quantification of the Rate of Ocean Warming. J. Clim. 2022, 35, 4827–4840. [Google Scholar] [CrossRef]
  7. Cheng, L.; von Schuckmann, K.; Abraham, J.P.; Trenberth, K.E.; Mann, M.E.; Zanna, L.; England, M.H.; Zika, J.D.; Fasullo, J.T.; Yu, Y.; et al. Past and Future Ocean Warming. Nat. Rev. Earth Environ. 2022, 3, 288–303. [Google Scholar] [CrossRef]
  8. Kwiatkowski, L.; Torres, O.; Bopp, L.; Aumont, O.; Chamberlain, M.; Christian, J.R.; Dunne, J.P.; Gehlen, M.; Ilyina, T.; John, J.G.; et al. Twenty-First Century Ocean Warming, Acidification, Deoxygenation, and Upper-Ocean Nutrient and Primary Production Decline from CMIP6 Model Projections. Biogeosciences 2020, 17, 3439–3470. [Google Scholar] [CrossRef]
  9. Kleisner, K.M.; Fogarty, M.J.; McGee, S.; Barnett, A.; Fratantoni, P.; Greene, J.; Hare, J.A.; Lucey, S.M.; McGuire, C.; Odell, J.; et al. The Effects of Sub-Regional Climate Velocity on the Distribution and Spatial Extent of Marine Species Assemblages. PLoS ONE 2016, 11, e0149220. [Google Scholar] [CrossRef]
  10. Burrows, M.T.; Schoeman, D.S.; Buckley, L.B.; Moore, P.; Poloczanska, E.S.; Brander, K.M.; Brown, C.; Bruno, J.F.; Duarte, C.M.; Halpern, B.S.; et al. The Pace of Shifting Climate in Marine and Terrestrial Ecosystems. Science 2011, 334, 652–655. [Google Scholar] [CrossRef]
  11. Hoegh-Guldberg, O.; Cai, R.; Poloczanska, E.S.; Brewer, P.G.; Sundby, S.; Hilmi, K.; Fabry, V.J.; Jung, S. The Ocean. In Climate Change 2014: Impacts, Adaptation, and Vulnerability. Part B: Regional Aspects. Contribution of Working Group II to the Fifth Assessment Report of the Intergovernmental Panel on Climate Change; Barros, V.R., Field, C.B., Dokken, D.J., Mastrandrea, M.D., Mach, K.J., Bilir, T.E., Chatterjee, M., Ebi, K.L., Estrada, Y.O., Genova, R.C., et al., Eds.; Cambridge University Press: Cambridge, UK; New York, NY, USA, 2014; pp. 1655–1731. [Google Scholar]
  12. Taboada, F.G.; Anadón, R. Patterns of Change in Sea Surface Temperature in the North Atlantic during the Last Three Decades: Beyond Mean Trends. Clim. Change 2012, 115, 419–431. [Google Scholar] [CrossRef]
  13. Tavartkiladze, K.; Bolashvili, N. Impact of Global Warming on Zero Degree Isotherm of Near Surface Temperature. Georgian Geogr. J. 2022, 2, 34–40. [Google Scholar] [CrossRef]
  14. Palmer, M.D.; Haines, K. Estimating Oceanic Heat Content Change Using Isotherms. J. Clim. 2009, 22, 4953–4969. [Google Scholar] [CrossRef]
  15. IPCC. The Ocean and Cryosphere in a Changing Climate: A Special Report of the IPCC; Cambridge University Press: Cambridge, UK, 2019; p. 738. [Google Scholar]
  16. Pinsky, M.L.; Worm, B.; Fogarty, M.J.; Sarmiento, J.L.; Levin, S.A. Marine Taxa Track Local Climate Velocities. Science 2013, 341, 1239–1242. [Google Scholar] [CrossRef]
  17. Sunday, J.M.; Pecl, G.T.; Frusher, S.; Hobday, A.J.; Hill, N.; Holbrook, N.J.; Edgar, G.J.; Stuart-Smith, R.; Barrett, N.; Wernberg, T.; et al. Species Traits and Climate Velocity Explain Geographic Range Shifts in an Ocean-Warming Hotspot. Ecol. Lett. 2015, 18, 944–953. [Google Scholar] [CrossRef]
  18. Venegas, R.M.; Acevedo, J.; Treml, E.A. Three Decades of Ocean Warming Impacts on Marine Ecosystems: A Review and Perspective. Deep Sea Res. Part II Top. Stud. Oceanogr. 2023, 212, 105318. [Google Scholar] [CrossRef]
  19. Poloczanska, E.S.; Burrows, M.T.; Brown, C.J.; Molinos, J.G.; Halpern, B.S.; Hoegh-Guldberg, O.; Kappel, C.V.; Moore, P.J.; Richardson, A.J.; Schoeman, D.S.; et al. Responses of Marine Organisms to Climate Change across Oceans. Front. Mar. Sci. 2016, 3, 62. [Google Scholar] [CrossRef]
  20. Genner, M.J.; Sims, D.W.; Wearmouth, V.J.; Southall, E.J.; Southward, A.J.; Henderson, P.A.; Hawkins, S.J. Regional Climatic Warming Drives Long-Term Community Changes of British Marine Fish. Proc. Biol. Sci. 2004, 271, 655–661. [Google Scholar] [CrossRef] [PubMed]
  21. Campana, S.E.; Stefánsdóttir, R.B.; Jakobsdóttir, K.; Sólmundsson, J. Shifting Fish Distributions in Warming Sub-Arctic Oceans. Sci. Rep. 2020, 10, 16448. [Google Scholar] [CrossRef] [PubMed]
  22. Cheung, W.W.L.; Lam, V.W.Y.; Sarmiento, J.L.; Kearney, K.; Watson, R.; Pauly, D. Projecting Global Marine Biodiversity Impacts under Climate Change Scenarios. Fish Fish. 2009, 10, 235–251. [Google Scholar] [CrossRef]
  23. Dulvy, N.K.; Rogers, S.I.; Jennings, S.; Stelzenmüller, V.; Dye, S.R.; Skjoldal, H.R. Climate Change and Deepening of the North Sea Fish Assemblage: A Biotic Indicator of Warming Seas. J. Appl. Ecol. 2008, 45, 1029–1039. [Google Scholar] [CrossRef]
  24. Perry, A.L.; Low, P.J.; Ellis, J.R.; Reynolds, J.D. Climate Change and Distribution Shifts in Marine Fishes. Science 2005, 308, 1912–1915. [Google Scholar] [CrossRef]
  25. Chivers, W.J.; Walne, A.W.; Hays, G.C. Mismatch between Marine Plankton Range Movements and the Velocity of Climate Change. Nat. Commun. 2017, 8, 14434. [Google Scholar] [CrossRef]
  26. Lenoir, J.; Bertrand, R.; Comte, L.; Bourgeaud, L.; Hattab, T.; Murienne, J.; Grenouillet, G. Species Better Track Climate Warming in the Oceans than on Land. Nat. Ecol. Evol. 2020, 4, 1044–1059. [Google Scholar] [CrossRef] [PubMed]
  27. Han, I.S.; Lee, J.S.; Jung, H.K. Long-Term Pattern Changes of Sea Surface Temperature during Summer and Winter Due to Climate Change in the Korea Waters. Fish. Aquat. Sci. 2023, 26, 639–648. [Google Scholar] [CrossRef]
  28. Han, I.S.; Lee, J.S. Change in the Annual Amplitude of Sea Surface Temperature due to Climate Change in a Recent Decade around the Korean Peninsula. J. Korean Soc. Mar. Environ. Saf. 2020, 26, 233–241. [Google Scholar] [CrossRef]
  29. NIFS (National Institute of Fisheries Science). Annual Report for Climate Change Trends in Fisheries, 2022; NIFS: Busan, Republic of Korea, 2023; p. 87.
  30. Chang, K.I.; Zhang, C.I.; Park, C.; Kang, D.J.; Ju, S.J.; Lee, S.H.; Wimbush, M. Oceanography of the East Sea (Japan Sea); Springer International Publishing: Cham, Switzerland, 2016. [Google Scholar] [CrossRef]
  31. Park, K.A.; Ullman, D.S.; Kim, K.; Chung, J.Y.; Kim, K.R. Spatial and Temporal Variability of Satellite-Observed Subpolar Front in the East/Japan Sea. Deep Sea Res. Part I Oceanogr. Res. Pap. 2007, 54, 453–470. [Google Scholar] [CrossRef]
  32. Park, K.W.; Chung, M.H.; Yoo, M.H.; O, K.S.; Kim, K.Y.; Park, T.G.; Yoon, S.H. Impact of Phytoplankton Community Structure Changes in the South Sea of Korea on Marine Ecosystems Due to Climate Change. Water 2023, 15, 4043. [Google Scholar] [CrossRef]
  33. Bhavya, P.S.; Kang, J.J.; Jang, H.K.; Joo, H.T.; Lee, J.H.; Lee, J.H.; Park, J.W.; Kim, K.W.; Kim, H.C.; Lee, S.H. The Contribution of Small Phytoplankton Communities to the Total Dissolved Inorganic Nitrogen Assimilation Rates in the East/Japan Sea: An Experimental Evaluation. J. Mar. Sci. Eng. 2020, 8, 854. [Google Scholar] [CrossRef]
  34. Kang, J.J.; Jang, H.K.; Lim, J.H.; Lee, D.; Lee, J.H.; Bae, H.; Lee, C.H.; Kang, C.K.; Lee, S.H. Characteristics of Different Size Phytoplankton for Primary Production and Biochemical Compositions in the Western East/Japan Sea. Front. Microbiol. 2020, 11, 560102. [Google Scholar] [CrossRef]
  35. Kim, J.C.; Kim, J.G. Changes in Climate Factors and Catches of Fisheries in the Republic of Korea over the Three Decades. Water 2023, 15, 1952. [Google Scholar] [CrossRef]
  36. Jung, S.; Pang, I.C.; Lee, J.H.; Choi, I.; Cha, H.K. Latitudinal Shifts in the Distribution of Exploited Fishes in Korean Waters during the Last 30 Years: A Consequence of Climate Change. Rev. Fish Biol. Fish. 2014, 24, 443–462. [Google Scholar] [CrossRef]
  37. McClain, E.P.; Pichel, W.G.; Walton, C.C. Comparative Performance of AVHRR-Based Multichannel Sea Surface Temperatures. J. Geophys. Res. 1985, 90, 11609–11618. [Google Scholar] [CrossRef]
  38. Bernstein, R.L. Sea Surface Temperature Estimation Using the NOAA-6 Satellite Advanced Very High Resolution Radiometer. J. Geophys. Res. 1982, 87, 9455–9465. [Google Scholar] [CrossRef]
  39. Kim, S.W.; Kang, Y.Q.; Ahn, J.S. Study on the Retreatment Techniques for NOAA Sea Surface Temperature Imagery. J. Korean Soc. Mar. Environ. Saf. 2011, 17, 331–337. [Google Scholar] [CrossRef]
  40. Shin, H.R.; Lee, J.H.; Kim, C.H.; Yoon, J.H.; Hirose, N.; Takikawa, T.; Cho, K.W. Long-Term Variation in Volume Transport of the Tsushima Warm Current Estimated from ADCP Current Measurement and Sea Level Differences in the Korea/Tsushima Strait. J. Mar. Syst. 2022, 232, 103682. [Google Scholar] [CrossRef]
  41. Park, W.S.; Oh, I.S. Interannual and Interdecadal Variations of Sea Surface Temperature in the East Asian Marginal Seas. Prog. Oceanogr. 2000, 47, 191–204. [Google Scholar] [CrossRef]
  42. Minobe, S.; Nakamura, M. Interannual to Decadal Variability in the Southern Okhotsk Sea Based on a New Gridded Upper Water Temperature Data Set. J. Geophys. Res. 2004, 109, C09S05. [Google Scholar] [CrossRef]
  43. Kim, K.; Kim, K.R.; Min, D.H.; Volkov, Y.; Yoon, J.H.; Takematsu, M. Warming and Structural Changes in the East (Japan) Sea: A Clue to Future Changes in Global Oceans? Geophys. Res. Lett. 2001, 28, 3293–3296. [Google Scholar] [CrossRef]
  44. Kim, K.; Kim, K.R.; Kim, Y.G.; Cho, Y.K.; Kang, D.J.; Takematsu, M.; Volkov, Y. Water Masses and Decadal Variability in the East Sea (Sea of Japan). Prog. Oceanogr. 2004, 61, 157–174. [Google Scholar] [CrossRef]
  45. Park, Y.G. The Effect of Tsushima Warm Current on the Interdecadal Variability of the East/Japan Sea Thermohaline Circulation. Geophys. Res. Lett. 2007, 34, L06609. [Google Scholar] [CrossRef]
  46. Kim, S.J.; Woo, S.H.; Kim, S.M.; Hur, S.D. Trends in Sea Surface Temperature (SST) Change Near the Korean Peninsula for the Past 130 Years. Ocean Polar Res. 2011, 33, 281–290. [Google Scholar] [CrossRef]
  47. Pak, G. Correlation between the Pacific Decadal Oscillation and East/Japan Sea SST in the Autumn. J. Korean Soc. Oceanogr. 2019, 24, 509–518. [Google Scholar] [CrossRef]
  48. Toda, M.; Watanabe, M. Mechanisms of Enhanced Ocean Surface Warming in the Kuroshio Region for 1951–2010. Clim. Dyn. 2020, 54, 4129–4145. [Google Scholar] [CrossRef]
  49. Qiao, Y.X.; Nakamura, H.; Tomita, T. Warming of the Kuroshio Current over the Last Four Decades Has Intensified the Meiyu–Baiu Rainband. Geophys. Res. Lett. 2024, 51, e2023GL107021. [Google Scholar] [CrossRef]
  50. Kang, D.J.; Park, S.; Kim, Y.G.; Kim, K.; Kim, K.R. A Moving-Boundary Box Model (MBBM) for Oceans in Change: An Application to the East/Japan Sea. Geophys. Res. Lett. 2003, 30, 1274. [Google Scholar] [CrossRef]
  51. Choi, J.S.; Lee, K.E.; Lee, H.J. Spatial and Temporal Changes in Sea Surface Temperature Circulation and Subpolar Front of the East Sea (Japan Sea) during the Last 130,000 Years. Palaeogeogr. Palaeoclimatol. Palaeoecol. 2012, 313–314, 225–233. [Google Scholar] [CrossRef]
  52. Choi, B.S.; Byun, D.S.; Lee, K.H. Satellite-Altimeter-Derived East Sea Surface Currents: Estimation, Description and Variability Pattern. Sea J. Korean Soc. Oceanogr. 2012, 17, 225–242. [Google Scholar] [CrossRef]
  53. Sun, C.; Kucharski, F.; Li, J.; Kang, I.S.; Ding, R. Western Tropical Pacific Multidecadal Variability Forced by the Atlantic Multidecadal Oscillation. Nat. Commun. 2017, 8, 15998. [Google Scholar] [CrossRef]
  54. Chang, P.H.; Cho, C.H.; Ryoo, S.B. Recent changes of mixed layer depth in the East/Japan Sea: 1994-2007. Asia-Pac. J. Atmos. Sci. 2011, 47, 497–510. [Google Scholar] [CrossRef]
  55. Kim, J.Y.; Kang, D.J.; Lee, T.; Kim, K.R. Long-Term Trend of CO2 and Ocean Acidification in the Surface Water of the Ulleung Basin, the East/Japan Sea Inferred from the Underway Observational Data. Biogeosciences 2014, 11, 2443–2454. [Google Scholar] [CrossRef]
  56. Lee, E.Y.; Park, K.A. Change in the Recent Warming Trend of Sea Surface Temperature in the East Sea (Sea of Japan) over Decades (1982–2018). Remote Sens. 2019, 11, 2613. [Google Scholar] [CrossRef]
  57. Belkin, I.M. Rapid Warming of Large Marine Ecosystems. Prog. Oceanogr. 2009, 81, 207–213. [Google Scholar] [CrossRef]
  58. Tanaka, K. Formation of Bottom Water and Its Variability in the Northwestern Part of the Sea of Japan. J. Geophys. Res. Oceans 2014, 119, 2081–2094. [Google Scholar] [CrossRef]
  59. Yoon, S.T.; Chang, K.I.; Nam, S.; Rho, T.; Kang, D.J.; Lee, T.; Park, K.A.; Lobanov, V.; Kaplunenko, D.; Tishchenko, P.; et al. Re-Initiation of Bottom Water Formation in the East Sea (Japan Sea) in a Warming World. Sci. Rep. 2018, 8, 1576. [Google Scholar] [CrossRef]
  60. Chiba, S.; Aita, M.N.; Tadokoro, K.; Saino, T.; Sugisaki, H.; Nakata, K. From Climate Regime Shifts to Lower Trophic Level Phenology: Synthesis of Recent Progress in Retrospective Studies of the Western North Pacific. Prog. Oceanogr. 2008, 77, 112–126. [Google Scholar] [CrossRef]
  61. Joo, H.T.; Park, J.W.; Son, S.; Noh, J.H.; Jeong, J.Y.; Kwak, J.H.; Saux-Picart, S.; Choi, J.H.; Kang, C.-K.; Lee, S.H. Long-Term Annual Primary Production in the Ulleung Basin as a Biological Hot Spot in the East/Japan Sea. J. Geophys. Res. Oceans 2014, 119, 3002–3011. [Google Scholar] [CrossRef]
  62. Lee, S.H.; Son, S.; Dahms, H.U.; Park, J.W.; Lim, J.H.; Noh, J.H.; Kwon, J.I.; Joo, H.T.; Jeong, J.Y.; Kang, C.K. Decadal Changes of Phytoplankton Chlorophyll-a in the East Sea/Sea of Japan. Oceanology 2014, 54, 771–779. [Google Scholar] [CrossRef]
  63. Jang, H.K.; Lee, D.; Lee, S.H. Long-Term Trend of Picophytoplankton Contribution to the Phytoplankton Community in the East Sea. J. Korean Soc. Mar. Environ. Saf. 2023, 29, 525–535. [Google Scholar] [CrossRef]
  64. Joo, H.T.; Son, S.H.; Park, J.W.; Kang, J.J.; Jeong, J.Y.; Lee, C.I.; Kang, C.K.; Lee, S.H. Long-Term Pattern of Primary Productivity in the East/Japan Sea Based on Ocean Color Data Derived from MODIS-Aqua. Remote Sens. 2016, 8, 25. [Google Scholar] [CrossRef]
  65. Zhang, C.I.; Lee, J.B.; Seo, Y.I.; Yoon, S.C.; Kim, S. Variations in the Abundance of Fisheries Resources and Ecosystem Structure in the Japan/East Sea. Prog. Oceanogr. 2004, 61, 245–264. [Google Scholar] [CrossRef]
  66. Chiba, S.; Batten, S.; Sasaoka, K.; Sasai, Y.; Sugisaki, H. Influence of the Pacific Decadal Oscillation on Phytoplankton Phenology and Community Structure in the Western North Pacific. Geophys. Res. Lett. 2012, 39, L15603. [Google Scholar] [CrossRef]
  67. Jo, M.J.; Kim, J.J.; Yang, J.H.; Kim, C.S.; Kang, S.K. Changes in the Ecological Characteristics of Todarodes pacificus Associated with Long-Term Catch Variations in the Jigging Fishery. Korean J. Fish. Aquat. Sci. 2019, 52, 685–695. [Google Scholar] [CrossRef]
  68. Seol, K.S.; Lee, C.I.; Jung, H.K. Long-Term Changes in Sea Surface Temperature Around Habitat Ground of Walleye Pollock (Gadus chalcogrammus) in the East Sea. J. Korean Soc. Mar. Environ. Saf. 2020, 26, 195–205. [Google Scholar] [CrossRef]
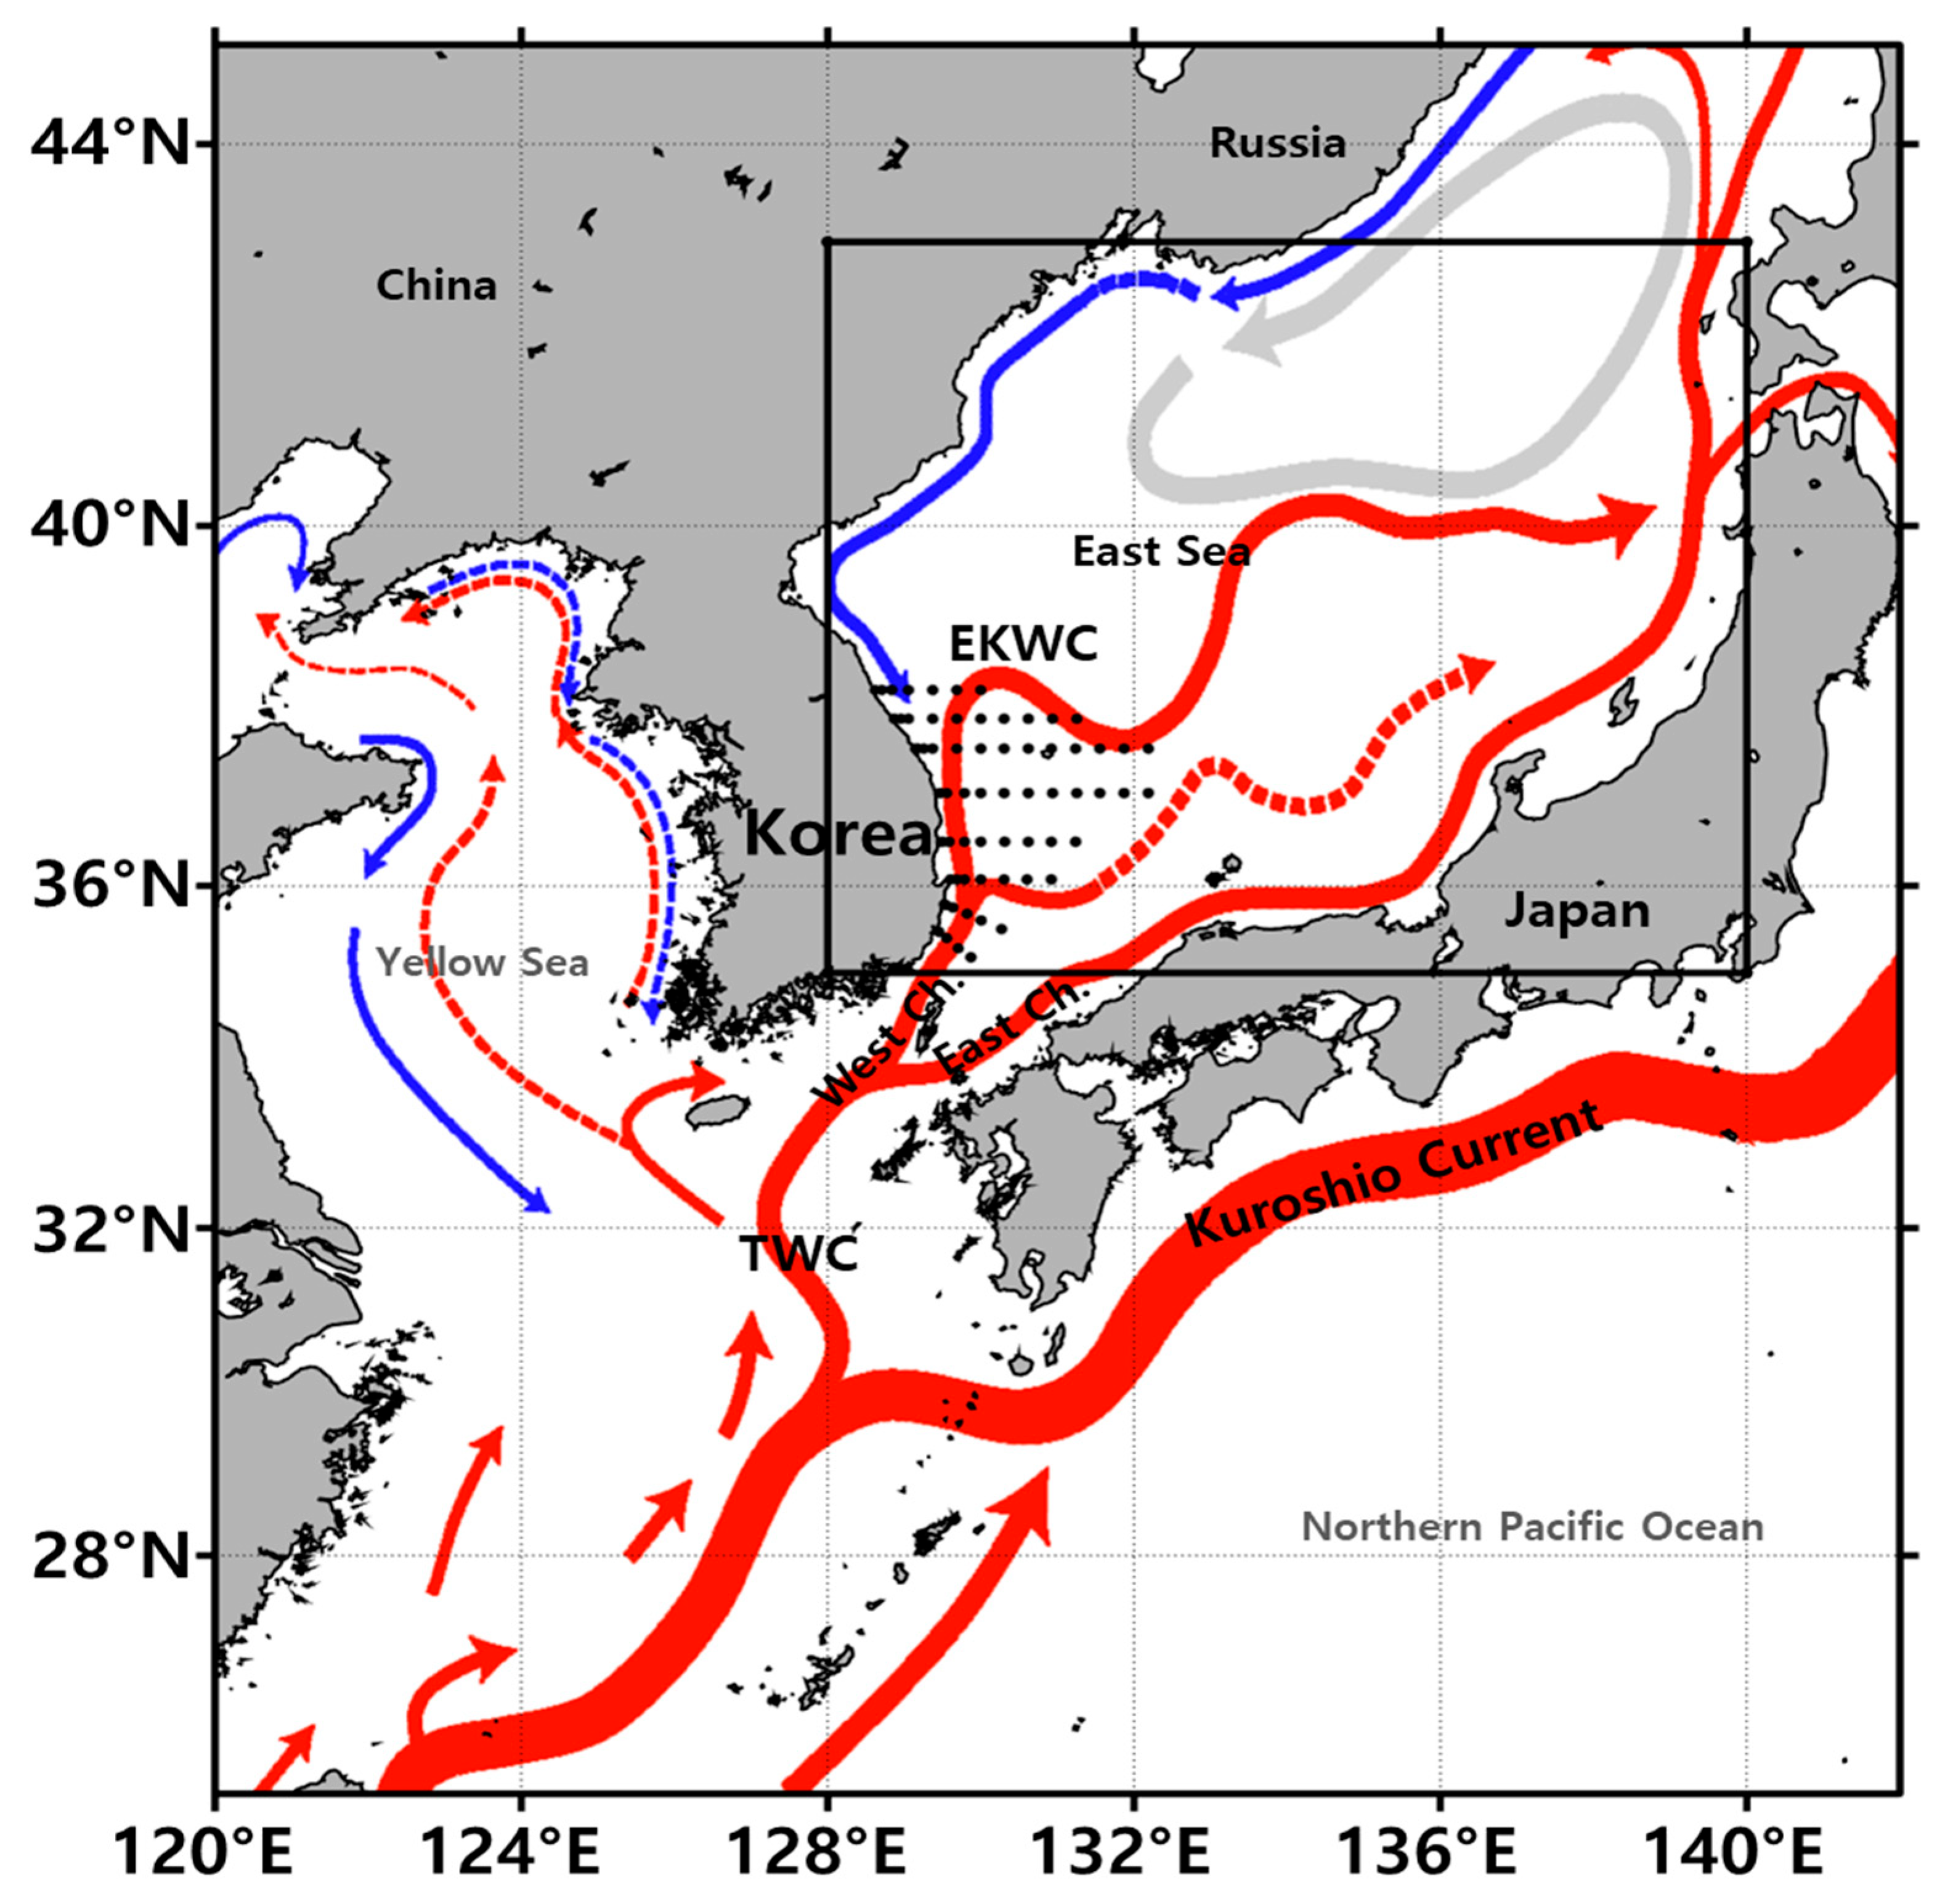
Figure 1. Study area and observation coverage of NOAA AVHRR SST imagery. The rectangular box outlines the East Sea (35–43° N, 128–140° E), where 1.1 km-resolution SST data from the AVHRR series received by NIFS were analyzed. Solid red arrows show the Kuroshio Current and its branch, the Tsushima Warm Current (TWC), entering the East Sea via the west channel (between the Korean Peninsula and Tsushima Island) and the east channel (between Tsushima Island and Kyushu, Japan). Black dots indicate in situ observation stations from the NIFS Serial Oceanographic Observations (NSO) program, obtained from the Korea Oceanographic Data Center (KODC; https://www.nifs.go.kr/main.do, accessed on 31 July 2025), used for satellite SST validation. Blue solid arrows indicate cold currents, blue and red dotted arrows represent weaker or variable branches and counter currents, and the black box marks the spatial domain of the study.
Oceans 06 00056 g001
Figure 2. Scatterplot of NIFS NOAA SST versus in situ SST observations from the NIFS Serial Oceanographic Observations (NSO) program, obtained from the Korea Oceanographic Data Center (KODC), covering the same period as this study. The red dashed line shows the regression line (y = 1.04x − 0.67), and the gray shaded area represents the 95% prediction interval. The analysis yielded R2 = 0.94, RMSE = 1.42 °C, and MAE = 0.95 °C.
Oceans 06 00056 g002
Figure 3. Spatial patterns of the first EOF mode derived from SST anomalies of (a) NIFS SST and (b) OSTIA SST datasets in the East Sea during 2000–2024. (c) Comparison of the first principal component (PC1) time series from NIFS SST (blue) and OSTIA SST (red). The first mode explains 46.3% and 50.5% of the total variance in the NIFS and OSTIA datasets, respectively, with high spatial similarity and strong temporal coherence between the two datasets.
Oceans 06 00056 g003
Figure 4. Schematic illustration of the method used to estimate ocean climate velocity based on differences in the mean latitude of a specific isotherm between two time periods.
Oceans 06 00056 g004
Figure 5. Linear trends in the annual average latitudinal positions of SST isotherms derived from the NIFS dataset: (a) 12 °C; (b) 13 °C; (c) 14 °C; (d) 15 °C; (e) 16 °C; (f) 17 °C; (g) 18 °C. Each panel displays the annual average latitude of the corresponding isotherm from 2000 to 2024. The slope (γ) represents the northward shift rate (°/year), and the coefficient of determination (R2) indicates the strength of the linear trend.
Oceans 06 00056 g005
Figure 6. SST distributions in the East Sea during 5-year periods: (a) Period A (2000–2004); (b) Period B (2005–2009); (c) Period C (2010–2014); (d) Period D (2015–2019); (e) Period E (2020–2044). Contour lines indicate isotherms at 1 °C intervals.
Oceans 06 00056 g006
Figure 7. Temporal changes in the latitudinal distribution of SST isotherms (12–18 °C) across five study periods (A: 2000–2004; B: 2005–2009; C: 2010–2014; D: 2015–2019; E: 2020–2024).
Oceans 06 00056 g007
Figure 8. Longitudinal displacement of SST isotherms across phases: (a) Phase 1 (Period B—Period A); (b) Phase 2 (Period C—Period B); (c) Phase 3 (Period D—Period C); (d) Phase 4 (Period E—Period D). (e) Net displacement from Period A to Period E. Red indicates a northward shift, and blue indicates a southward shift.
Oceans 06 00056 g008
Figure 9. Latitudinal distribution of SST isotherms (12–18 °C) in the East Sea during Period A (2000–2004; dashed lines) and Period E (2020–2024; solid lines). The figure illustrates the northward displacement of all isotherms over the 25-year period, highlighting the expansion of warm-water zones.
Oceans 06 00056 g009
Figure 10. Changes in TWC volume transport through (a) the west channel and (b) the east channel (Sv). (c) Variations in the PDO index during the five study periods (A–E). Bars represent TWC transport (left axis), and the line indicates the PDO index (right axis).
Oceans 06 00056 g010
Table 1. Pearson correlation coefficients between the annual mean latitudinal position of SST isotherms and spatially averaged oceanographic and atmospheric variables over the East Sea (2000–2024).
TWCWest ChannelEast ChannelAir
Temperature
PDOWind Speed
Mean isotherm
latitude
r0.620.640.150.90−0.480.19
p-value<0.01<0.010.46<0.01<0.050.36
Table 2. Temporal changes in the distribution area (×103 km2) from 12 °C to 18 °C across five periods (A–E), indicating northward isotherm shifts.
SST Zone12 °C13 °C14 °C15 °C16 °C17 °C18 °C
Area
(103 km2)
Period A43.0143.4146.3280.1689.0996.7439.04
Period B47.7941.7348.6470.73100.4388.0232.13
Period C44.9639.2247.6451.0292.31105.7142.82
Period D49.9744.9940.5554.7382.89112.9253.25
Period E58.3353.5641.2542.1275.39122.4991.95
Table 3. Mean ocean climate velocity (km/decade) of SST isotherms (12 °C to 18 °C) during four phases and the entire study period (Period E—Period A). Positive values indicate northward displacement; negative values indicate southward displacement.
Isotherm (°C)12131415161718Mean
Shift
velocity (km/decade)
Period E–Period A62.5731.0130.8440.8886.67106.17110.8166.99
Phase 1−25.57−32.97−32.48−40.11−17.77−48.26−31.27−32.63
Phase 2−35.64−29.940.625.0052.3381.4751.3517.89
Phase 372.9149.0322.3737.7837.4168.3062.9950.11
Phase 4144.7391.4086.6099.54144.70163.90193.97132.12
Disclaimer/Publisher’s Note: The statements, opinions and data contained in all publications are solely those of the individual author(s) and contributor(s) and not of MDPI and/or the editor(s). MDPI and/or the editor(s) disclaim responsibility for any injury to people or property resulting from any ideas, methods, instructions or products referred to in the content.