Article

Detection, Tracking, and Statistical Analysis of Mesoscale Eddies in the Bay of Bengal

by
Hafez Ahmad
1,
Felix Jose
2,*,
Padmanava Dash
1 and
Shakila Islam Jhara
3
1
Department of Geosciences, Mississippi State University, Mississippi, MS 39762, USA
2
Department of Marine & Earth Sciences, Florida Gulf Coast University, Fort Myers, FL 33965, USA
3
Department of Oceanography, University of Chittagong, Chattogram 4331, Bangladesh
*
Author to whom correspondence should be addressed.
Oceans 2025, 6(3), 52; https://doi.org/10.3390/oceans6030052
Submission received: 6 June 2025 / Revised: 23 July 2025 / Accepted: 12 August 2025 / Published: 20 August 2025

Abstract

Mesoscale eddies have a significant influence on primary productivity and upper-ocean variability, particularly in stratified and monsoon-driven basins like the Bay of Bengal (BoB). This study analyzes mesoscale eddies in the BoB from January 2010 to March 2020 using post-processed and gridded daily sea surface height anomaly (SLA) data from the Copernicus Marine Environment Monitoring Service. We used a hybrid detection method combining the Okubo–Weiss parameter and SLA contour analysis to identify 1880 anticyclonic and 1972 cyclonic eddies. Cyclonic eddies were mainly found in the western BoB along the east Indian coast, while anticyclonic eddies were less frequent in this area. Analysis of eddy lifespans revealed that short-lived (1-week) eddies were nearly equally distributed between anticyclonic (48.81%) and cyclonic (51.19%) types. However, for longer-lived eddies, cyclonic eddies became more prevalent, comprising 83.33% of 30-week eddies. A notable, consistent eddy presence was observed east of Sri Lanka, influencing the East India Coastal Current. Most eddies (91%) propagated west/southwestward along the western slope of the Andaman Archipelago, likely influenced by ocean currents and coastal topography, with concentrations in the Andaman Sea and central BoB. These patterns suggest significant interactions between eddies, coastal upwelling zones, and boundary currents, impacting nutrient transport and marine ecosystem productivity. This study contributes valuable insights into the dynamics of ocean circulation and the impacts of eddies, which can inform fisheries management strategies, advance climate resilience measures, expand scientific knowledge, and guide policies related to conservation and sustainable resource utilization.

1. Introduction

Mesoscale eddies are energetic, rotational features of the ocean, typically ranging from 10 to 300 km in diameter, and lasting from days to several months [1]. These eddies, which arise due to baroclinic and barotropic instabilities, wind stress curl, or current meanders, play a critical role in regulating the horizontal and vertical transport of heat, salinity, nutrients, and other tracers in the upper ocean [1,2]. Eddies are often classified into cyclonic (cold-core) and anticyclonic (warm-core) types, depending on their rotational direction and thermal structure [3]. Globally, their dynamics have been shown to influence not only physical oceanography but also marine biology and climate systems [4,5]. With the increasing availability of satellite altimetry, long-term tracking of mesoscale eddies has become possible, enabling major advances in our understanding of their formation, propagation, and decay. These observational capabilities have catalyzed a surge in regional studies of eddy dynamics across the world’s oceans, including the Indian Ocean and, more recently, the Bay of Bengal (BoB), where eddy-driven processes significantly influence upper-ocean structure and variability [6,7,8].
In the BoB, a semi-enclosed basin in the northeastern Indian Ocean, mesoscale eddies are especially important due to the region’s strong surface stratification, monsoonal wind reversals, and massive freshwater inflow from rivers such as the Ganges, Brahmaputra, and Irrawaddy [9,10]. The BoB receives approximately 1.625 × 10¹² m3 of river runoff annually, contributing to a shallow low-salinity layer that limits vertical mixing [11,12]. This stratification enhances the role of eddies in nutrient transport, especially during monsoonal transitions. The semi-annual reversal of the East India Coastal Current (EICC), modulated by the southwest (summer) and northeast (winter) monsoons, also contributes to enhanced eddy activity along the coast of India [13,14]. Additionally, large-scale climate models such as the El Niño Southern Oscillation (ENSO) and Indian Ocean Dipole (IOD) play a critical role in modulating monsoonal winds, current strength, and eddy formation. Positive IOD and El Niño–Southern Oscillation (ENSO) warm phase events (El Niño) have been linked to enhanced anticyclonic eddy activity in the eastern BoB, while ENSO cool phase events (La Niña) and negative IOD phases favor increased cyclonic occurrences through their influence on equatorial wave dynamics and coastal current reversals [6,7].
The spatial distribution of eddies in the BoB exhibits marked regional differences, driven by varying forcing mechanisms. In the western BoB, eddies are frequently generated by the baroclinic instability of the EICC [14,15], with several studies documenting cold-core cyclonic eddies resulting from coastal current meanders and shear instabilities [16,17]. This region is also characterized by higher eddy kinetic energy (EKE) due to persistent eddy activity throughout the monsoon seasons [18,19]. In the central and eastern BoB, eddies are primarily remotely forced by equatorial Kelvin waves that travel along the eastern boundary before radiating westward as nonlinear Rossby waves [11,13]. These waves are particularly active during monsoon transitions and can initiate both anticyclonic and cyclonic eddies depending on their phase. The eastern BoB and the Andaman Sea exhibit smaller-scale eddies generated by the interaction of coastal Kelvin waves with topography and wind forcing [17,20]. However, the presence of the Andaman and Nicobar Islands significantly affects eddy propagation in this region, acting as a barrier to westward-moving features and reducing the number of eddies that reach the central basin [20].
Several long-term studies have cataloged the occurrence and characteristics of eddies in the BoB. For example, Gulakaram et al. [21] reported a total of 3936 anticyclonic and 3840 cyclonic eddies between 1993 and 2016. Their findings indicate a relatively balanced polarity distribution overall, but with temporal and spatial fluctuations modulated by monsoonal wind forcing and boundary current instability. Similarly, Dandapat and Chakraborty [19] emphasized the dominance of cyclonic eddies in the western and northwestern BoB, aligned with strong shear zones and coastal current reversals. High eddy birth frequencies in the eastern BoB have been attributed to coastal upwelling and wind stress curl during the pre- and post-monsoon periods [11,22].
The mechanisms of eddy generation vary across the basin. In the western BoB, cyclonic eddies often emerge due to baroclinic instability of the EICC and its seasonal meanders [14,17]. The convergence of opposing boundary currents also contributes to subsurface eddy formation [23]. In contrast, the central and eastern BoB sees eddies primarily generated by remotely forced equatorial Kelvin waves and Rossby wave propagation, especially during inter-monsoon periods [11,18]. Studies have also linked wind stress curl and topographic effects, including the interaction of shelf breaks and slope currents, as key drivers of eddy generation in the northern and northeastern BoB [13,22].
The typical lifespan of BoB eddies ranges from 30 to 120 days, with a high frequency of short-lived events [11,21]. Cyclonic eddies have been observed to persist longer and exhibit greater energy levels than their anticyclonic counterparts in several studies [17,19]. Cheng et al. [11] and Kumar et al. [15] found that cyclonic eddies dominate the longer lifespan category due to sustained upwelling processes and interactions with background current shear. Lifespan variability is also influenced by river-induced salinity stratification, especially in the northern BoB, where freshwater plumes from the Ganges-Brahmaputra-Meghna system create a shallow, strongly stratified layer that modulates eddy strength and stability [12].
In terms of eddy propagation, the majority of eddies in the BoB drift westward or southwestward, consistent with first-mode baroclinic Rossby wave dynamics and influenced by background current structures and coastal topography [11,18]. This has been supported by satellite altimetry and numerical modeling studies [17,21]. The Andaman slope acts as a corridor for southwestward-propagating eddies generated in the Andaman Sea and eastern BoB, guiding them into the central basin [20]. Longer-lived eddies travel farther, often exceeding 1000 km in displacement [24]. Cyclonic eddies have been shown to propagate more coherently over longer distances, possibly due to their deeper vertical penetration and coupling with the thermocline [25]. Their influence extends to surface temperature modulation, with cyclones cooling SST and anticyclones causing localized warming [24]. To study these dynamic features, various eddy detection methods have been employed. Among them, the Okubo–Weiss (OW) parameter and geometric sea level anomaly (SLA) contour tracking have gained prominence. The OW parameter evaluates the balance between vorticity and strain in the flow field and is widely used to detect rotationally dominated regions [26,27]. The PyEddyTracker Python package offers an integrated framework for detecting and tracking eddies using both OW-based core identification and SLA-based boundary delineation [28]. It has been validated in multiple basins, including the Tasman Sea and Mediterranean Sea. The hybrid approach allows for robust tracking of eddy properties such as amplitude, radius, and propagation path across temporal sequences of gridded SLA data, ensuring consistent and reproducible analysis [29,30].
Despite substantial progress made in prior studies, gaps remain in our understanding of eddy distribution and behavior across under-explored regions such as the northern coastal zones of Bangladesh and Myanmar, the Andaman Sea, and the central deep basin. Additionally, past studies have used different data sources, detection thresholds, and timeframes, making cross-study comparisons difficult. Furthermore, gaps remain in our understanding of spatiotemporal variability across underexplored subregions, such as the northeastern BoB and deeper central waters. To address these limitations, this study uses a consistent methodology combining the OW parameter and geometric SLA contour analysis (as implemented in the PyEddyTracker package). By analyzing ten years (2010–2020) of gridded altimeter-derived sea level anomaly and geostrophic velocity data from the Copernicus Marine Environment Monitoring Service, we aim to provide a detailed statistical assessment of eddy frequency, lifespan, propagation, polarity, and spatial distribution across the BoB. In doing so, we seek to improve the baseline understanding of BoB eddy dynamics, support regional model validation, and inform ocean monitoring and management efforts.

2. Materials and Methods

2.1. Study Area

The study area covers the BoB and most of the Andaman Sea (see Figure 1). The BoB is the northern extension of the Indian Ocean and is surrounded by land except in the southern region, where it is open to the influence of the Indian Ocean. The geographic location of the study domain is between 0° N and 23° N and between 80° E and 100° E, and the area covers approximately 4.087 × 10⁶ km2, with a maximum depth of approximately 4500 m [31]. It is surrounded by India and Sri Lanka in the west, Bangladesh in the north, Myanmar, and the northern Malay Peninsula in the east. The regional climate is heavily influenced by monsoons, with the southwest monsoon prevailing from June to September and the northeast monsoon prevailing from November to April. Additionally, the BoB is known for its tropical cyclones, with approximately 5 to 6 cyclones originating annually, some of which can be severe and cause landfall in India, Bangladesh, and Myanmar. Several major rivers drain into the BoB, viz., Ganges, Brahmaputra, Mahanadi, Godavari, Krishna, Irrawaddy, Meghna, Karnaphuli, etc.

2.2. Data Sources

Mesoscale eddies in the BoB were identified from the analysis of post-processed and gridded daily sea surface height anomaly data from January 2010 to March 2020. This dataset was obtained from the Copernicus Marine Environment Monitoring Service (CMEMS) and is available at (https://cds.climate.copernicus.eu/cdsapp#!/dataset/satellite-sea-level-global?tab=overview) (accessed on 14 August 2025), with a spatial resolution of 0.25° × 0.25°. To visualize seasonal surface currents, the method involved iterating through three distinct seasons: premonsoon (March to May), southwest monsoon (June to September), and winter (October to December). For each season, the u and v components of velocity were extracted from the dataset, and the velocity magnitude was computed. A longitude-latitude grid was created, and streamlines representing flow direction were plotted using the streamplot function. Additionally, the velocity magnitude was depicted as a color mesh using the pcolormesh function of Python’s plotting package, Matplotlib (v3.9.0), developed by Hunter [32].

2.3. Eddy Identification

Eddy tracking, detection, and associated property identification were conducted using the Python package ‘PyEddyTracker’ (version 3.6.1. Available at https://github.com/AntSimi/py-eddy-tracker (accessed on 22 July 2025); DOI: 10.5281/zenodo.6333988) [28]. This package uses daily 0.25° × 0.25° resolution gridded sea level anomaly (SLA) data [28] and also geostrophic velocity components as inputs. Recent advancements in oceanographic research have led to the widespread utilization of three primary algorithms for mesoscale eddy tracking. These methodologies encompass the geometric approach [29,33,34], which relies on the characterization of closed contours in SLA data based on their shape and size; the Okubo–Weiss (OW) method [35], which leverages vorticity and strain derived from the flow field as computed from SLA; and the wavelet method [36], which is rooted in spectral analysis through wavelet transformation of SLA data. For our research, the emphasis was placed on the OW and geometric methods, with the procedures following the framework established by [29,35,37]. This method has already been reported in several studies focusing on the detection of mesoscale eddies in the Tasman Sea [38], Mediterranean Sea [39], and global ocean [35]. Therefore, an automated eddy detection algorithm based on the OW parameter that has been tested for diverse oceanic and regional seas was implemented in this study. The OW parameter is defined as
O W = S n 2 + S s 2 ω 2
where S n , S s , and ω are the normal strain, shear strain (normal component and shear component of the strain tensor), and vorticity (vertical component of the relative vorticity), respectively.
S n = u x v y , S s = v x + u y , ω = v x u y
where u and v are the zonal and meridional geostrophic velocity components, as follows:
u = g f R η ϕ , v = g f R cos ϕ η λ
where f = 2ωesinϕ is the Coriolis force coefficient, ωe is the angular velocity of the Earth, R is the mean radius of the Earth, ϕ is the latitude, λ is the longitude, and g is the acceleration due to gravity [40].
Daily absolute geostrophic velocity meridian and zonal components (v and u) were extracted from the Copernicus Climate Data Store. Available online https://cds.climate.copernicus.eu/cdsapp#!/dataset/satellite-sea-level-global?tab=overview (accessed on 14 August 2025). Sea level anomalies are computed with respect to a 20-year reference period (1993–2012). Generally, a threshold of W = 0 is set such that OW < 0 represents vorticity and eddy-dominated regions. The negative values of OW are in good agreement with the eddy cores detected. The choice of the threshold for the OW parameter defines the precision and ability to identify an eddy. Therefore, we adopted a threshold of OW < −0.2 σ (OW) to delineate eddy cores, where σ (OW) represents the spatial standard deviation of the Okubo–Weiss parameter consistent with established practices in eddy detection across various ocean basins, including the global ocean and the Agulhas system, where such thresholds effectively balance detection accuracy and noise reduction [41,42].
In this study, the birth frequency of eddies was determined by identifying the first appearance of each eddy tracked over time using the PyEddyTracker tool. For each eddy, its initial location (birth point) was recorded and mapped onto a spatial grid. The number of eddy births per grid cell was then calculated over the study period to quantify spatial patterns of eddy generation. Separate birth frequency maps were produced for cyclonic and anticyclonic eddies.
Based on SLA data, we derived three key parameters to characterize mesoscale eddies: eddy kinetic energy (EKE), vorticity, and strain rate, as defined in Equations (4) to (6). EKE was computed from the squared geostrophic velocity anomalies and represents the energy associated with eddy motions, highlighting regions of high mesoscale activity. Vorticity, derived from the spatial derivatives of the velocity components, indicates the rotational behavior of eddies, helping to distinguish between cyclonic and anticyclonic structures. Strain rate quantifies the deformation within the flow field, capturing stretching and shearing processes that influence eddy evolution and mixing. Together, these parameters provide a comprehensive understanding of the dynamics, distribution, and intensity of mesoscale eddies in the ocean. EKE was computed at each time step and grid cell, then averaged spatially and temporally to derive mean maps and time series.
E K E = 1 2 ( u 2 + v 2 )
where u′ is the geostrophic zonal velocity anomaly (ugosa), and v′ is the geostrophic meridional velocity anomaly (vgosa).
V o r t i c i t y   ζ = v x u y
where v x is the zonal gradient of meridional velocity, and u y is the meridional gradient of zonal velocity.
S t r a i n   R a t e   ( S r ) = u x v y 2 + v x + u y 2

3. Results

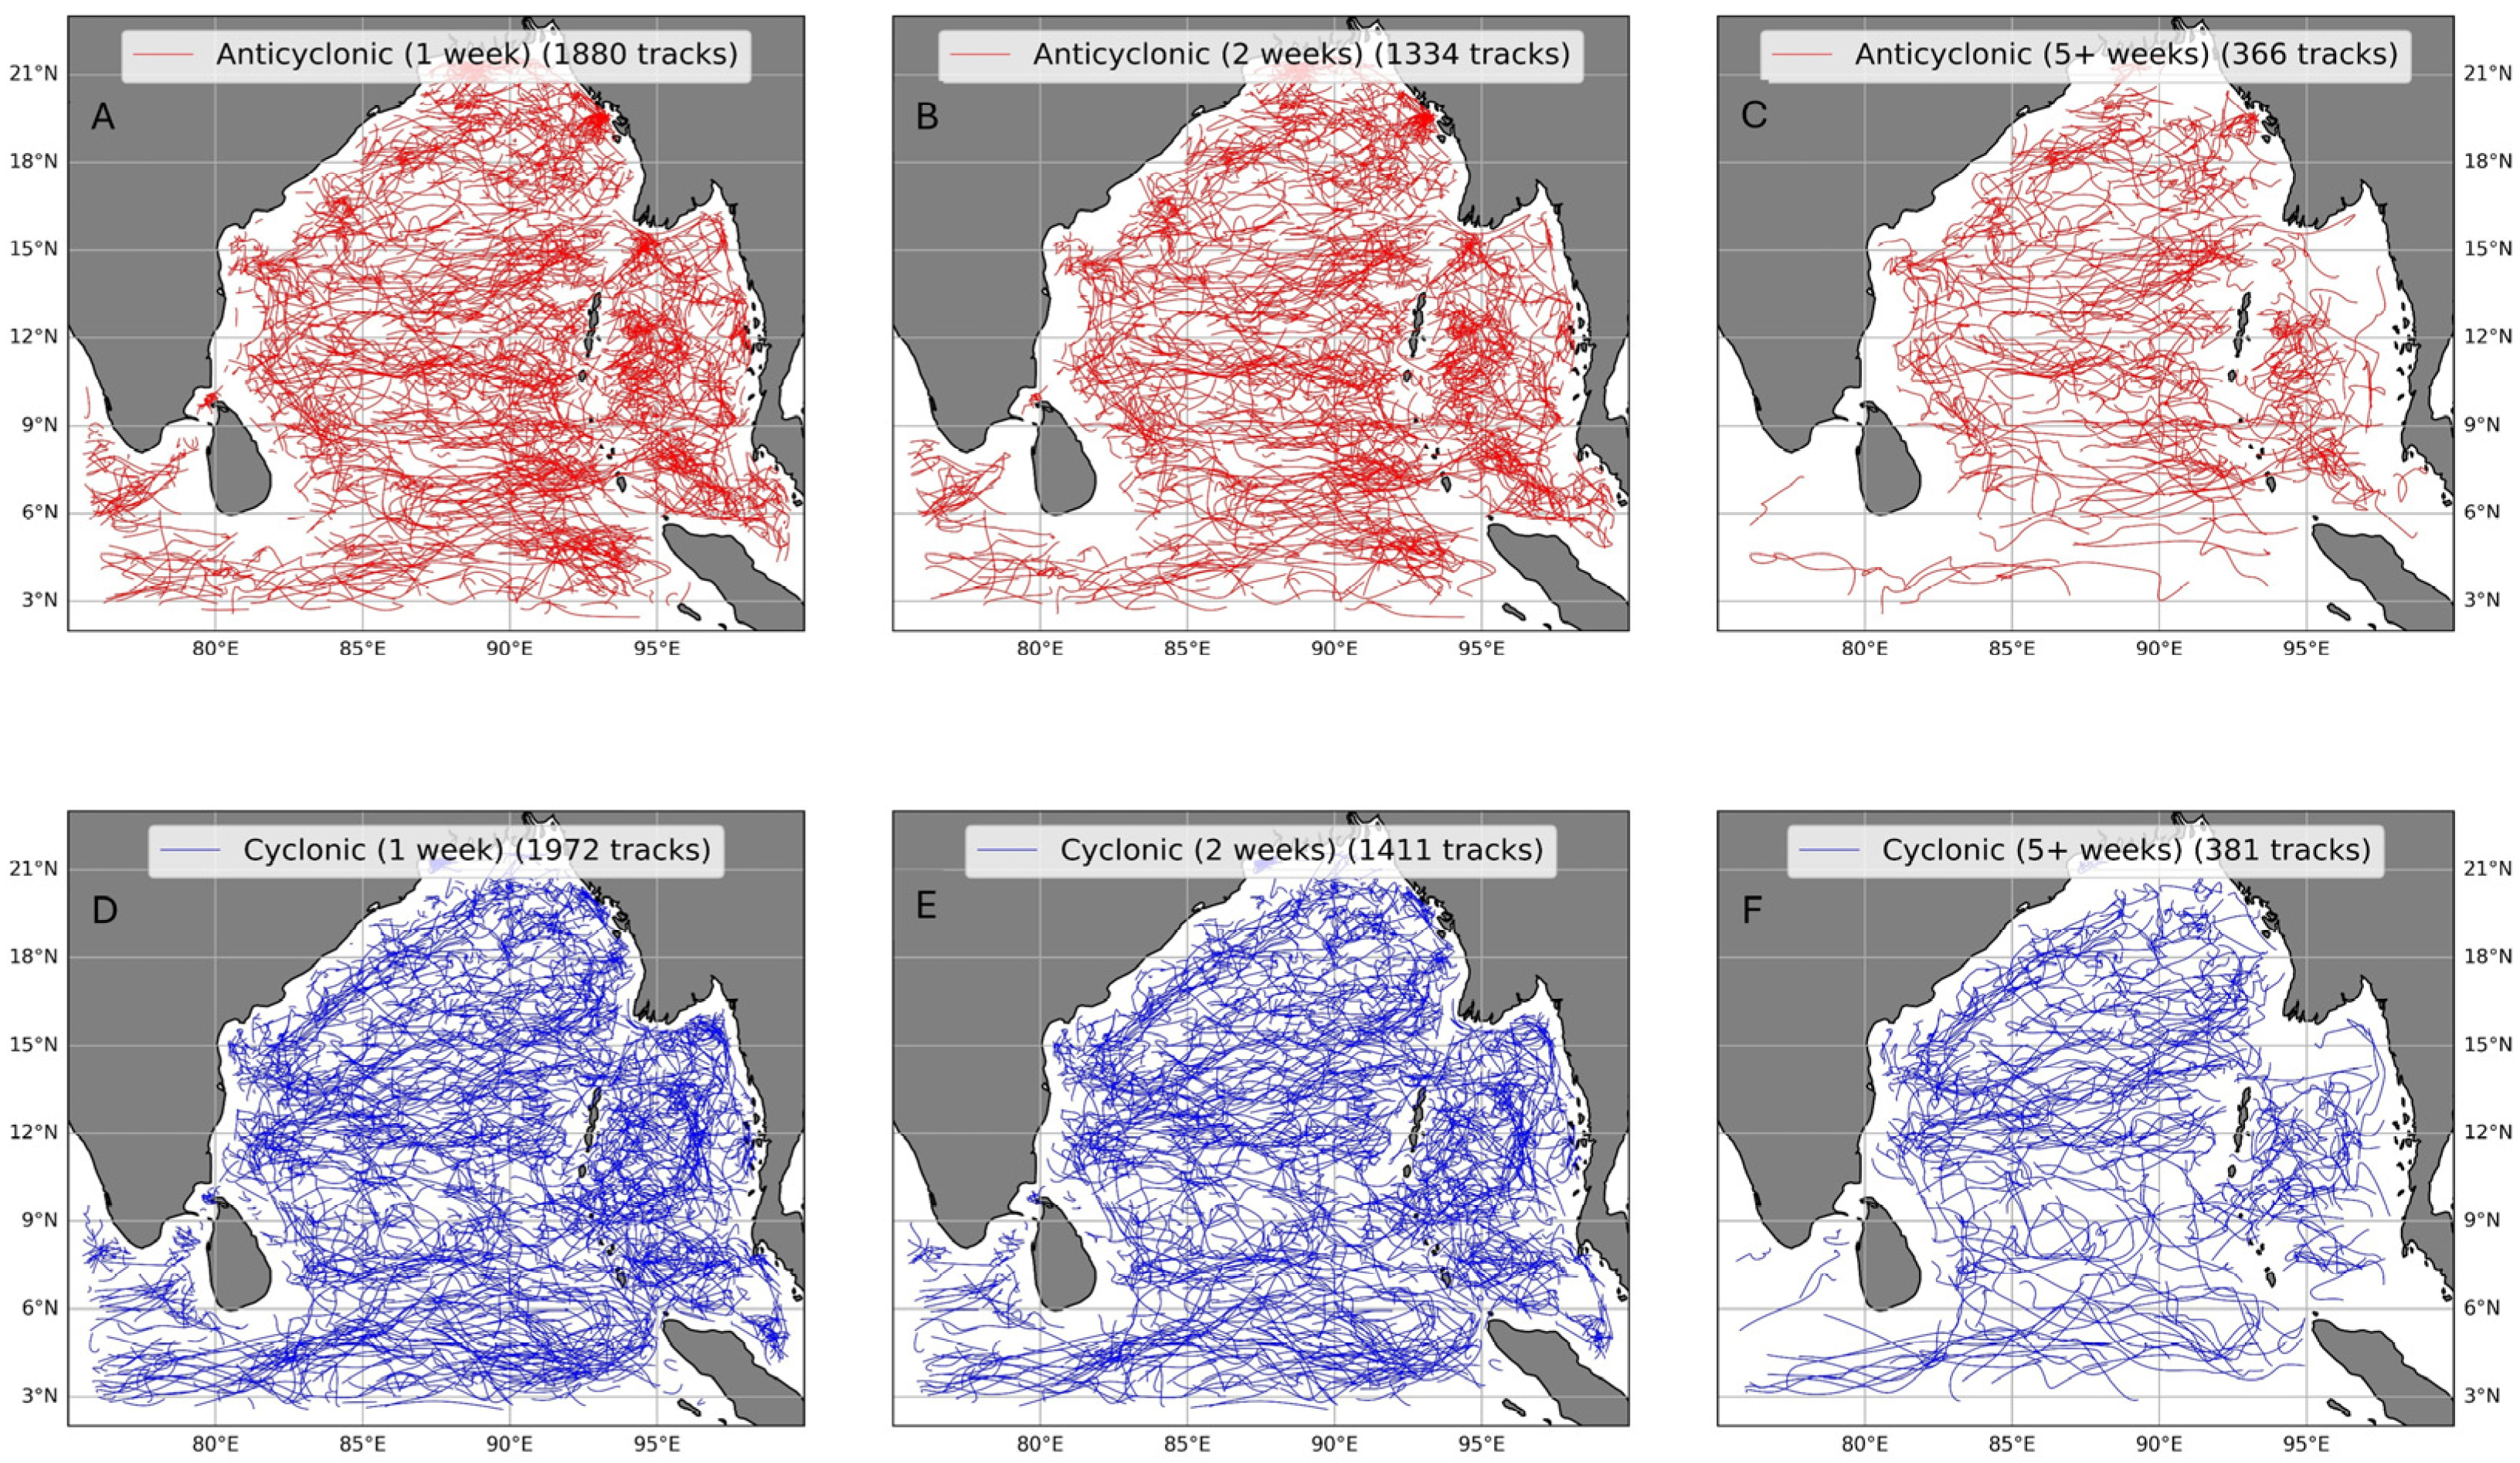
Spatial distribution analysis revealed notable differences between the two eddy types. Cyclonic eddies were primarily concentrated along the western BoB, especially off the east coast of India, while anticyclonic eddies were also present in this region but in comparatively lower numbers (Figure 2 and Figure 3). A particularly high frequency of eddy activity was observed to the east of Sri Lanka, near the western boundary of the BoB, highlighting this area as a significant eddy formation and propagation hotspot. The persistent occurrence of eddies in this region may be linked to its dynamic current systems and bathymetric features, which appear to influence eddy generation and movement.
Our analysis of satellite altimetry data from January 2010 to March 2020 identified a total of 1972 cyclonic eddies and 1880 anticyclonic eddies across the BoB, with both eddy types comprising nearly equal proportions of the total eddy population (Figure 3). These counts include short-lived eddies with lifespans of one week or more, contributing to a more comprehensive inventory than earlier studies.

3.1. Mesoscale Eddy Life Span, Frequency, and Track Analysis

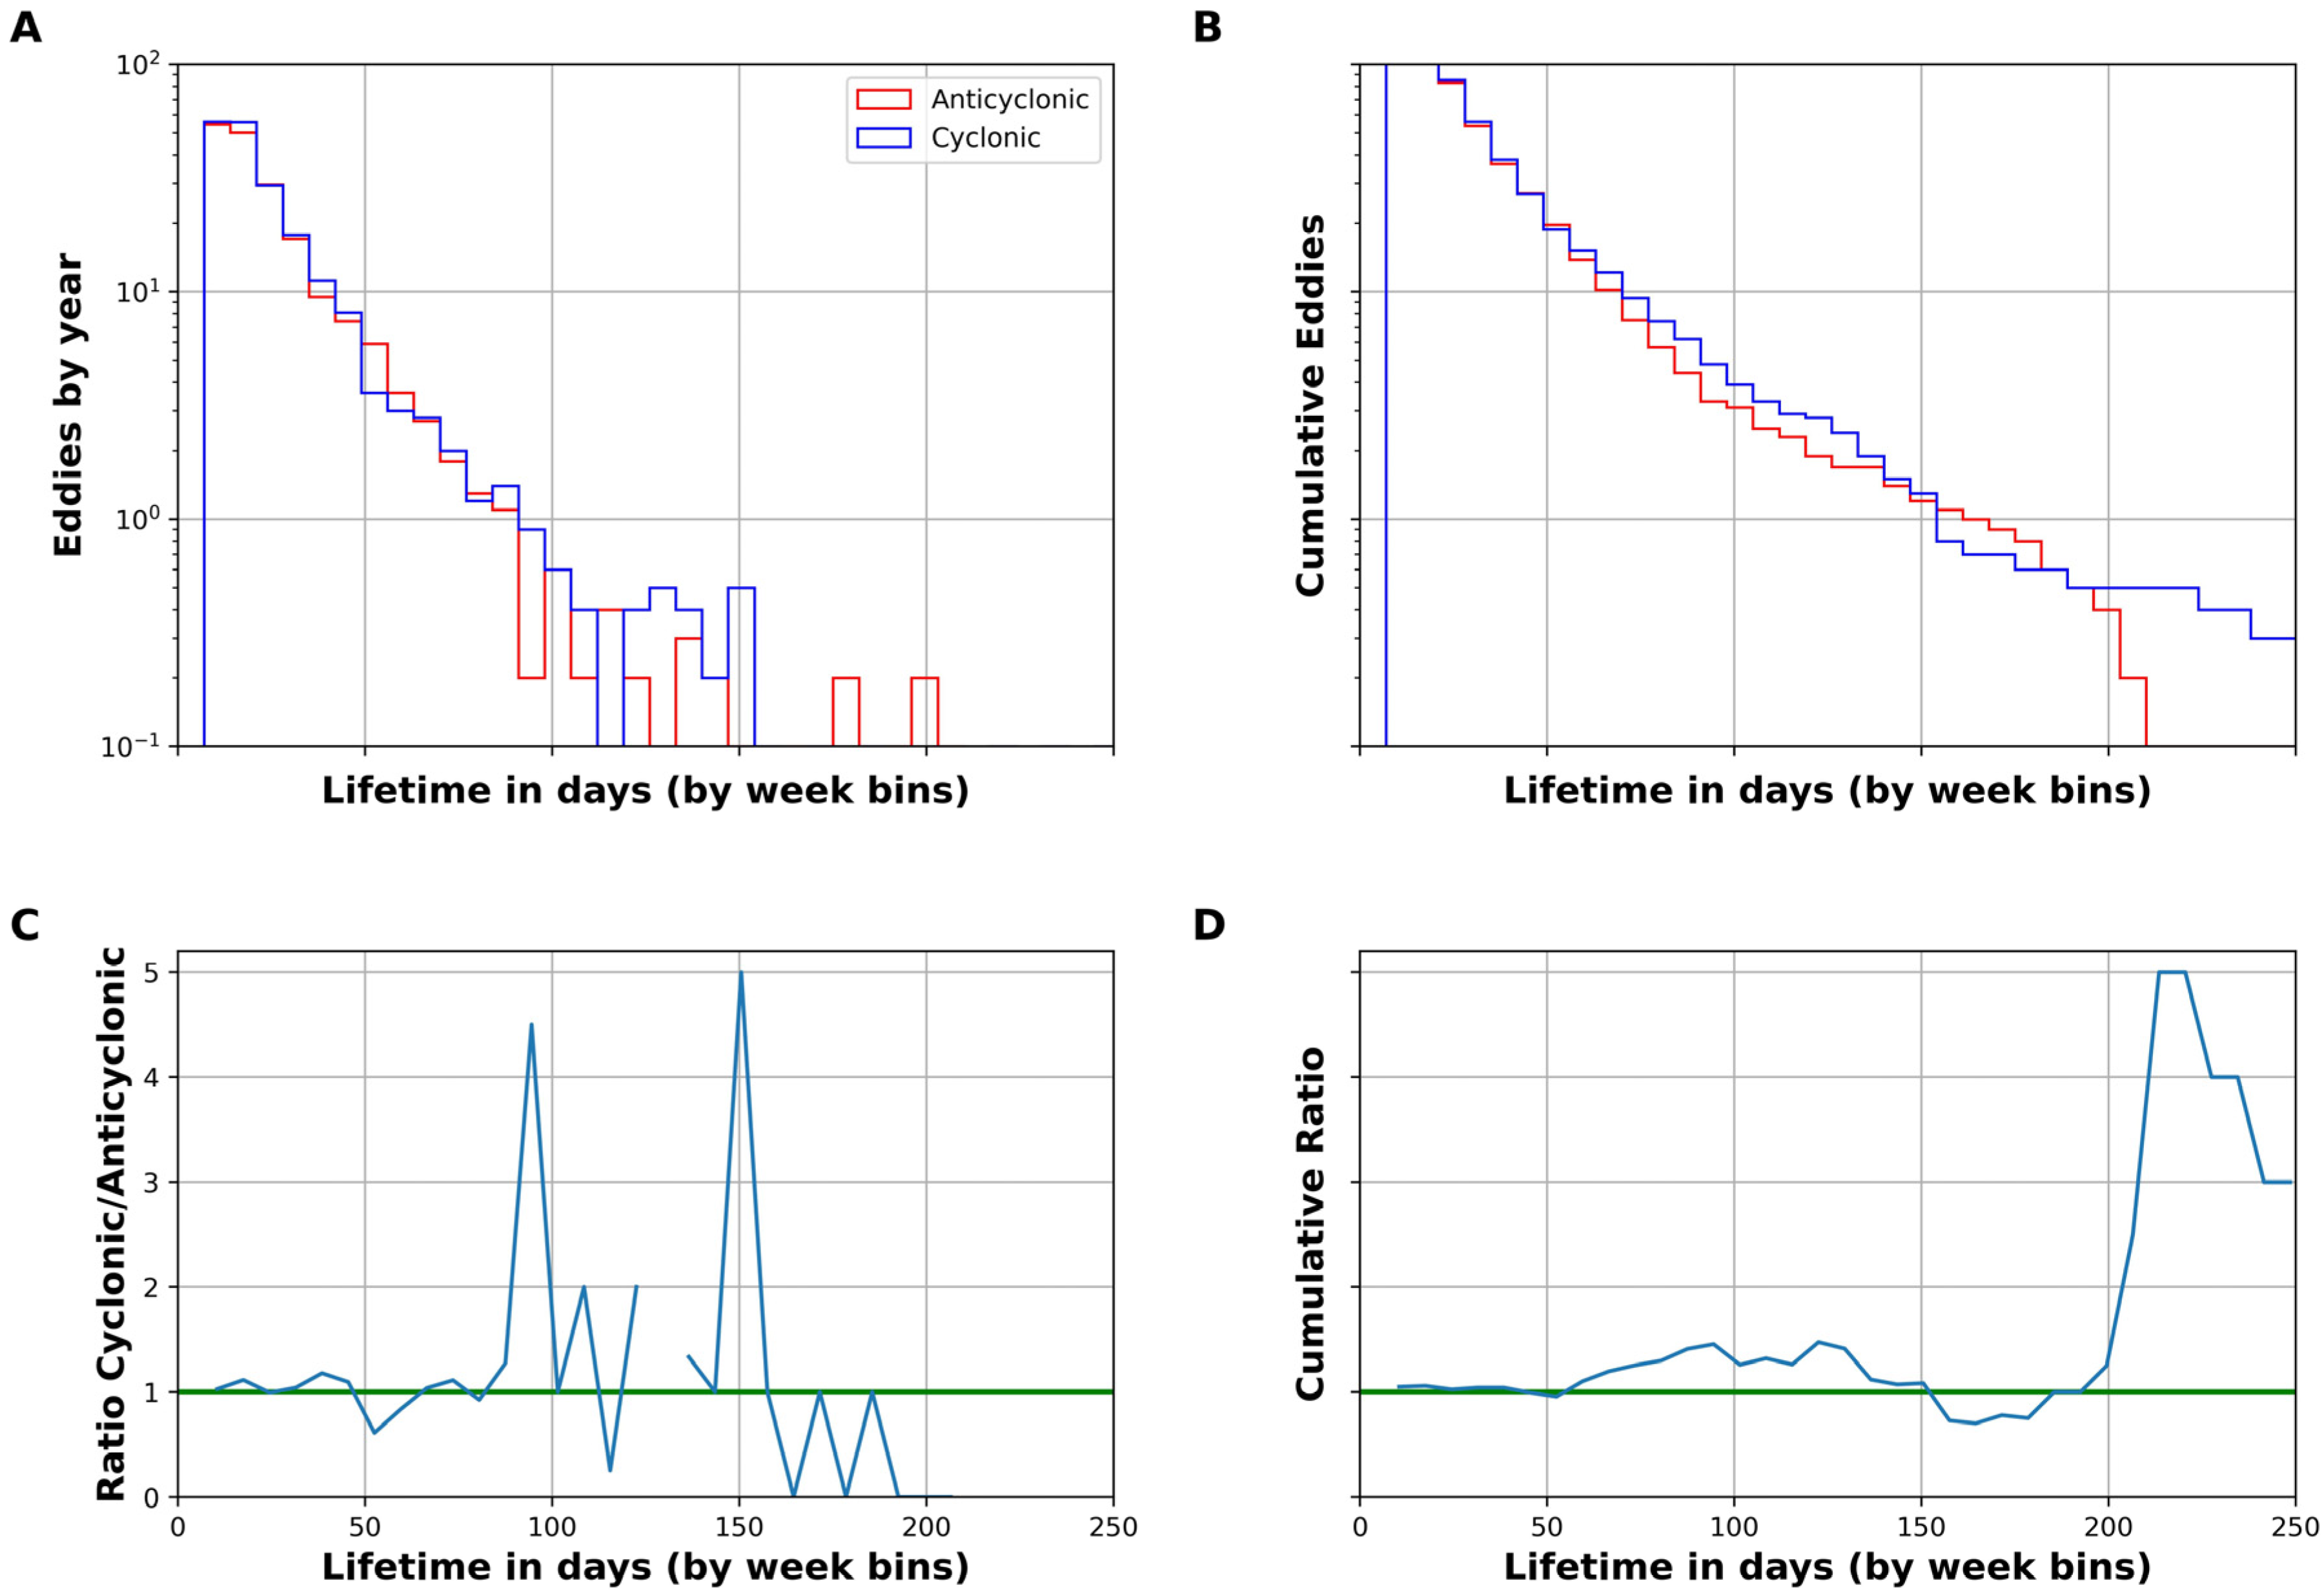
Analysis of eddy lifespans revealed notable trends in the distribution of anticyclonic and cyclonic eddies across different time scales. For eddies lasting at least 1 week, the percentage of anticyclonic eddies is approximately 49%, while cyclonic eddies constitute approximately 51% of the total. Similarly, for eddies with a lifespan of 4 weeks, the proportions of anticyclonic and cyclonic eddies remain close, with percentages of approximately 49% and 51%, respectively. However, as the lifespan of eddies increases, their distribution shifts. For instance, for 12-week-long eddies, the percentage of anticyclonic eddies decreases to approximately 42%, while that of cyclonic eddies increases to approximately 59%. This trend continues with 16-week-long eddies, where anticyclonic eddies constitute approximately 44%, and cyclonic eddies increase to approximately 55.77%. For 24-week-long eddies, the ratio shifts significantly, with that of anticyclonic eddies comprising 56% and that of cyclonic eddies decreasing to 44%. The most pronounced shift is observed for 30-week-long eddies, where the percentage of anticyclonic eddies decreases to 17%, while that of cyclonic eddies increases dramatically to 83% of the total.
Furthermore, our investigation revealed distinct patterns in the spatial distribution and propagation direction of these eddies. Specifically, we observed that the majority (91%) of all eddies propagated west/southwestward (Figure 3) along the western slope of the Andaman Archipelago, with concentrations primarily observed in the Andaman Sea and the western and central zones of the BoB (86–93° E, 13–16° N).
The frequencies of mesoscale anticyclonic and cyclonic eddy births (origins) in the BoB exhibit distinct spatial patterns (Figure 4), influenced by a multitude of factors, including local oceanic currents, atmospheric circulation patterns, seasonally varying air–sea interaction dynamics, and local bathymetry [29]. Newly formed cyclonic eddies tend to have a scattered distribution across the BoB, while anticyclonic eddies are more commonly found along the shelf and are concentrated in the western boundary and the southeastern region (around the Andaman Sea) (Figure 4).
Analysis of the histogram on the lifespan of mesoscale eddies revealed a relative dominance of short-lived eddies (both cyclonic eddies, represented by blue bars, and anticyclonic eddies, represented by red bars, as shown in Figure 5) across all years of observation (top left plot). This dominance is evident from the decreasing frequency of eddies with increasing lifespan. Despite both types exhibiting an increasing trend in cumulative occurrence (top right plot), the blue line in the bottom left plot, representing the ratio of cyclonic to anticyclonic eddies within each lifetime bin, consistently surpassed the green line, indicating equal distribution. This preference for short-lived cyclonic eddies is further reflected in the bottom right plot, where the steadily rising blue line illustrates a cumulative ratio that suggests a potential shift in Bay of Bengal eddy dynamics toward more frequent short-lived cyclonic events [17].

3.2. Mesoscale Eddy Propagation Analysis

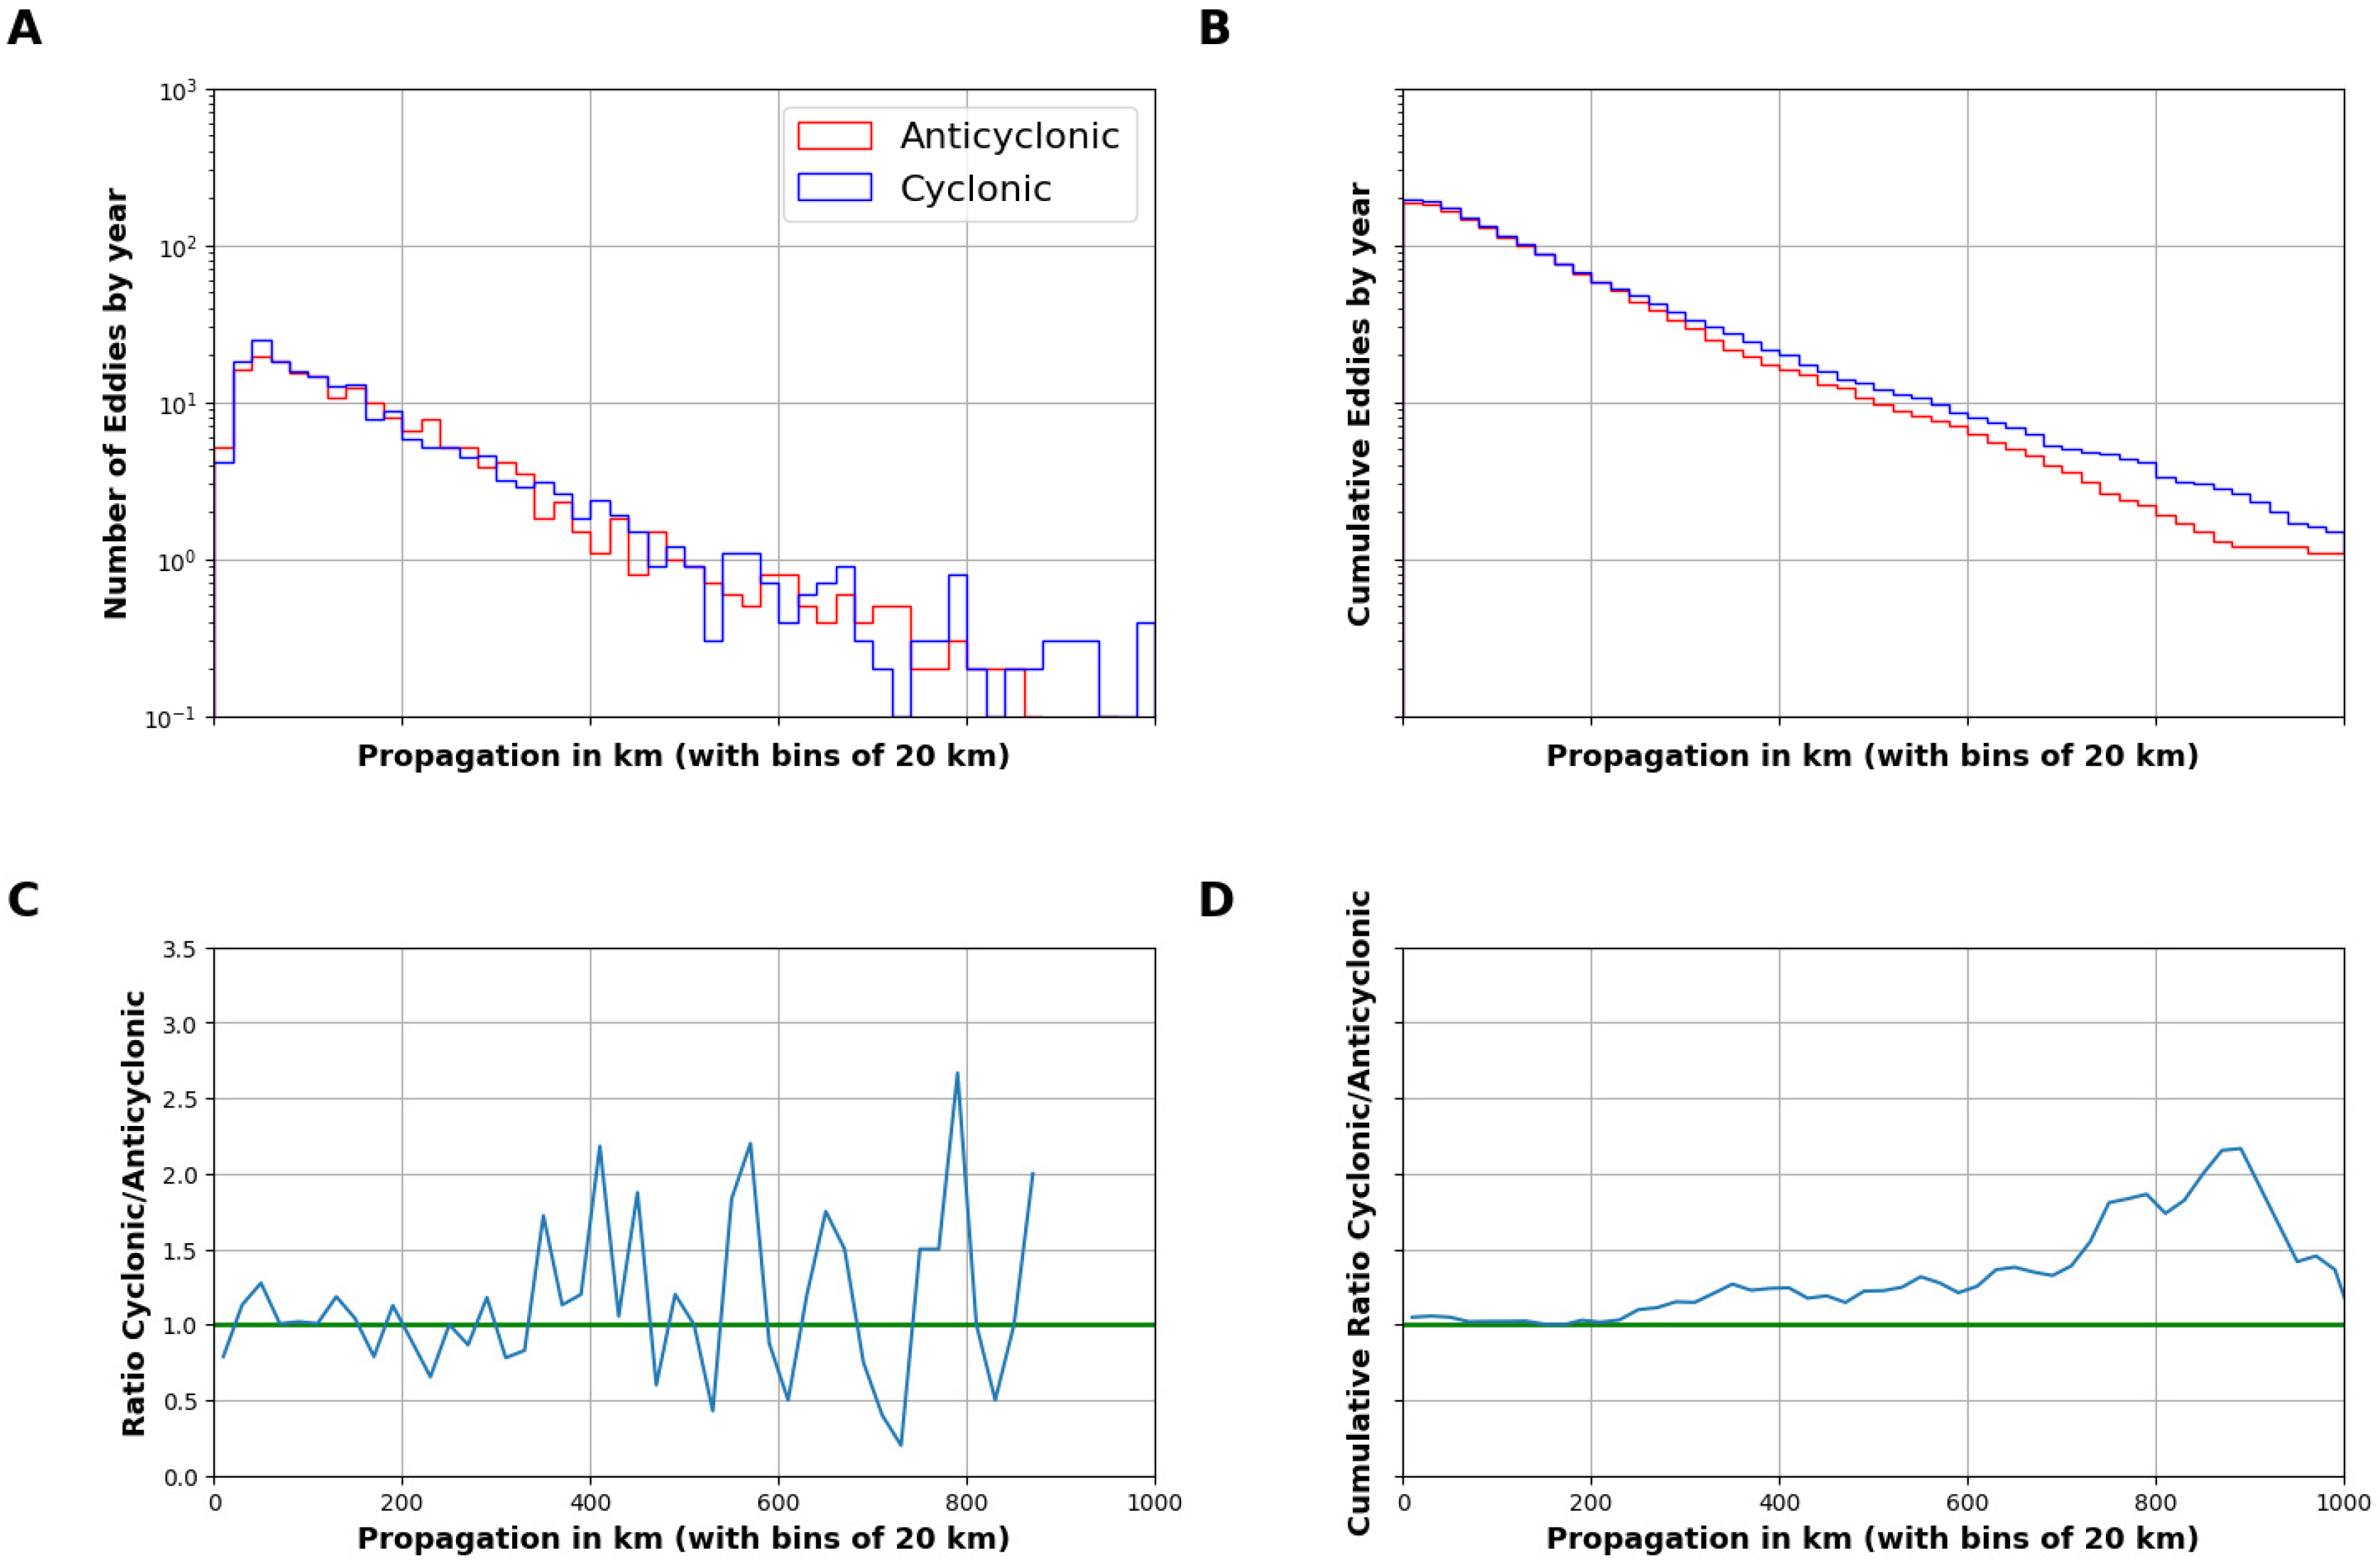
The propagation behavior of mesoscale eddies in the BoB reveals distinct patterns linked to eddy lifespan and polarity. As shown in Figure 6, eddies that persist longer tend to travel farther, indicating a strong positive correlation between eddy duration and displacement. For example, short-lived eddies lasting about 1 week have a mean propagation distance of ~72 km, while those persisting for 24 weeks exhibit mean distances exceeding 1180 km. This progressive increase in displacement highlights the ability of long-lived eddies to impact larger spatial regions, potentially influencing broader-scale ocean dynamics.
Panel A in Figure 6 presents the number of eddies by year and polarity on a log scale, illustrating that short-distance propagating eddies dominate in both cyclonic and anticyclonic categories, with a higher number of cyclonic eddies recorded across most bins. Panel B shows the cumulative distribution of eddy propagation, where cyclonic eddies maintain a consistently higher cumulative count compared to anticyclonic ones, particularly beyond 500 km. Panels C and D provide insights into the relative dominance of cyclonic eddies. The instantaneous ratio of cyclonic to anticyclonic eddies (Panel C) fluctuates considerably at intermediate distances (300–700 km), occasionally exceeding 2.5, indicating that cyclonic eddies are significantly more prevalent in that range. The cumulative ratio (Panel D) reinforces this observation, with a steady increase in cyclonic dominance beginning around 400 km and peaking near 900 km.
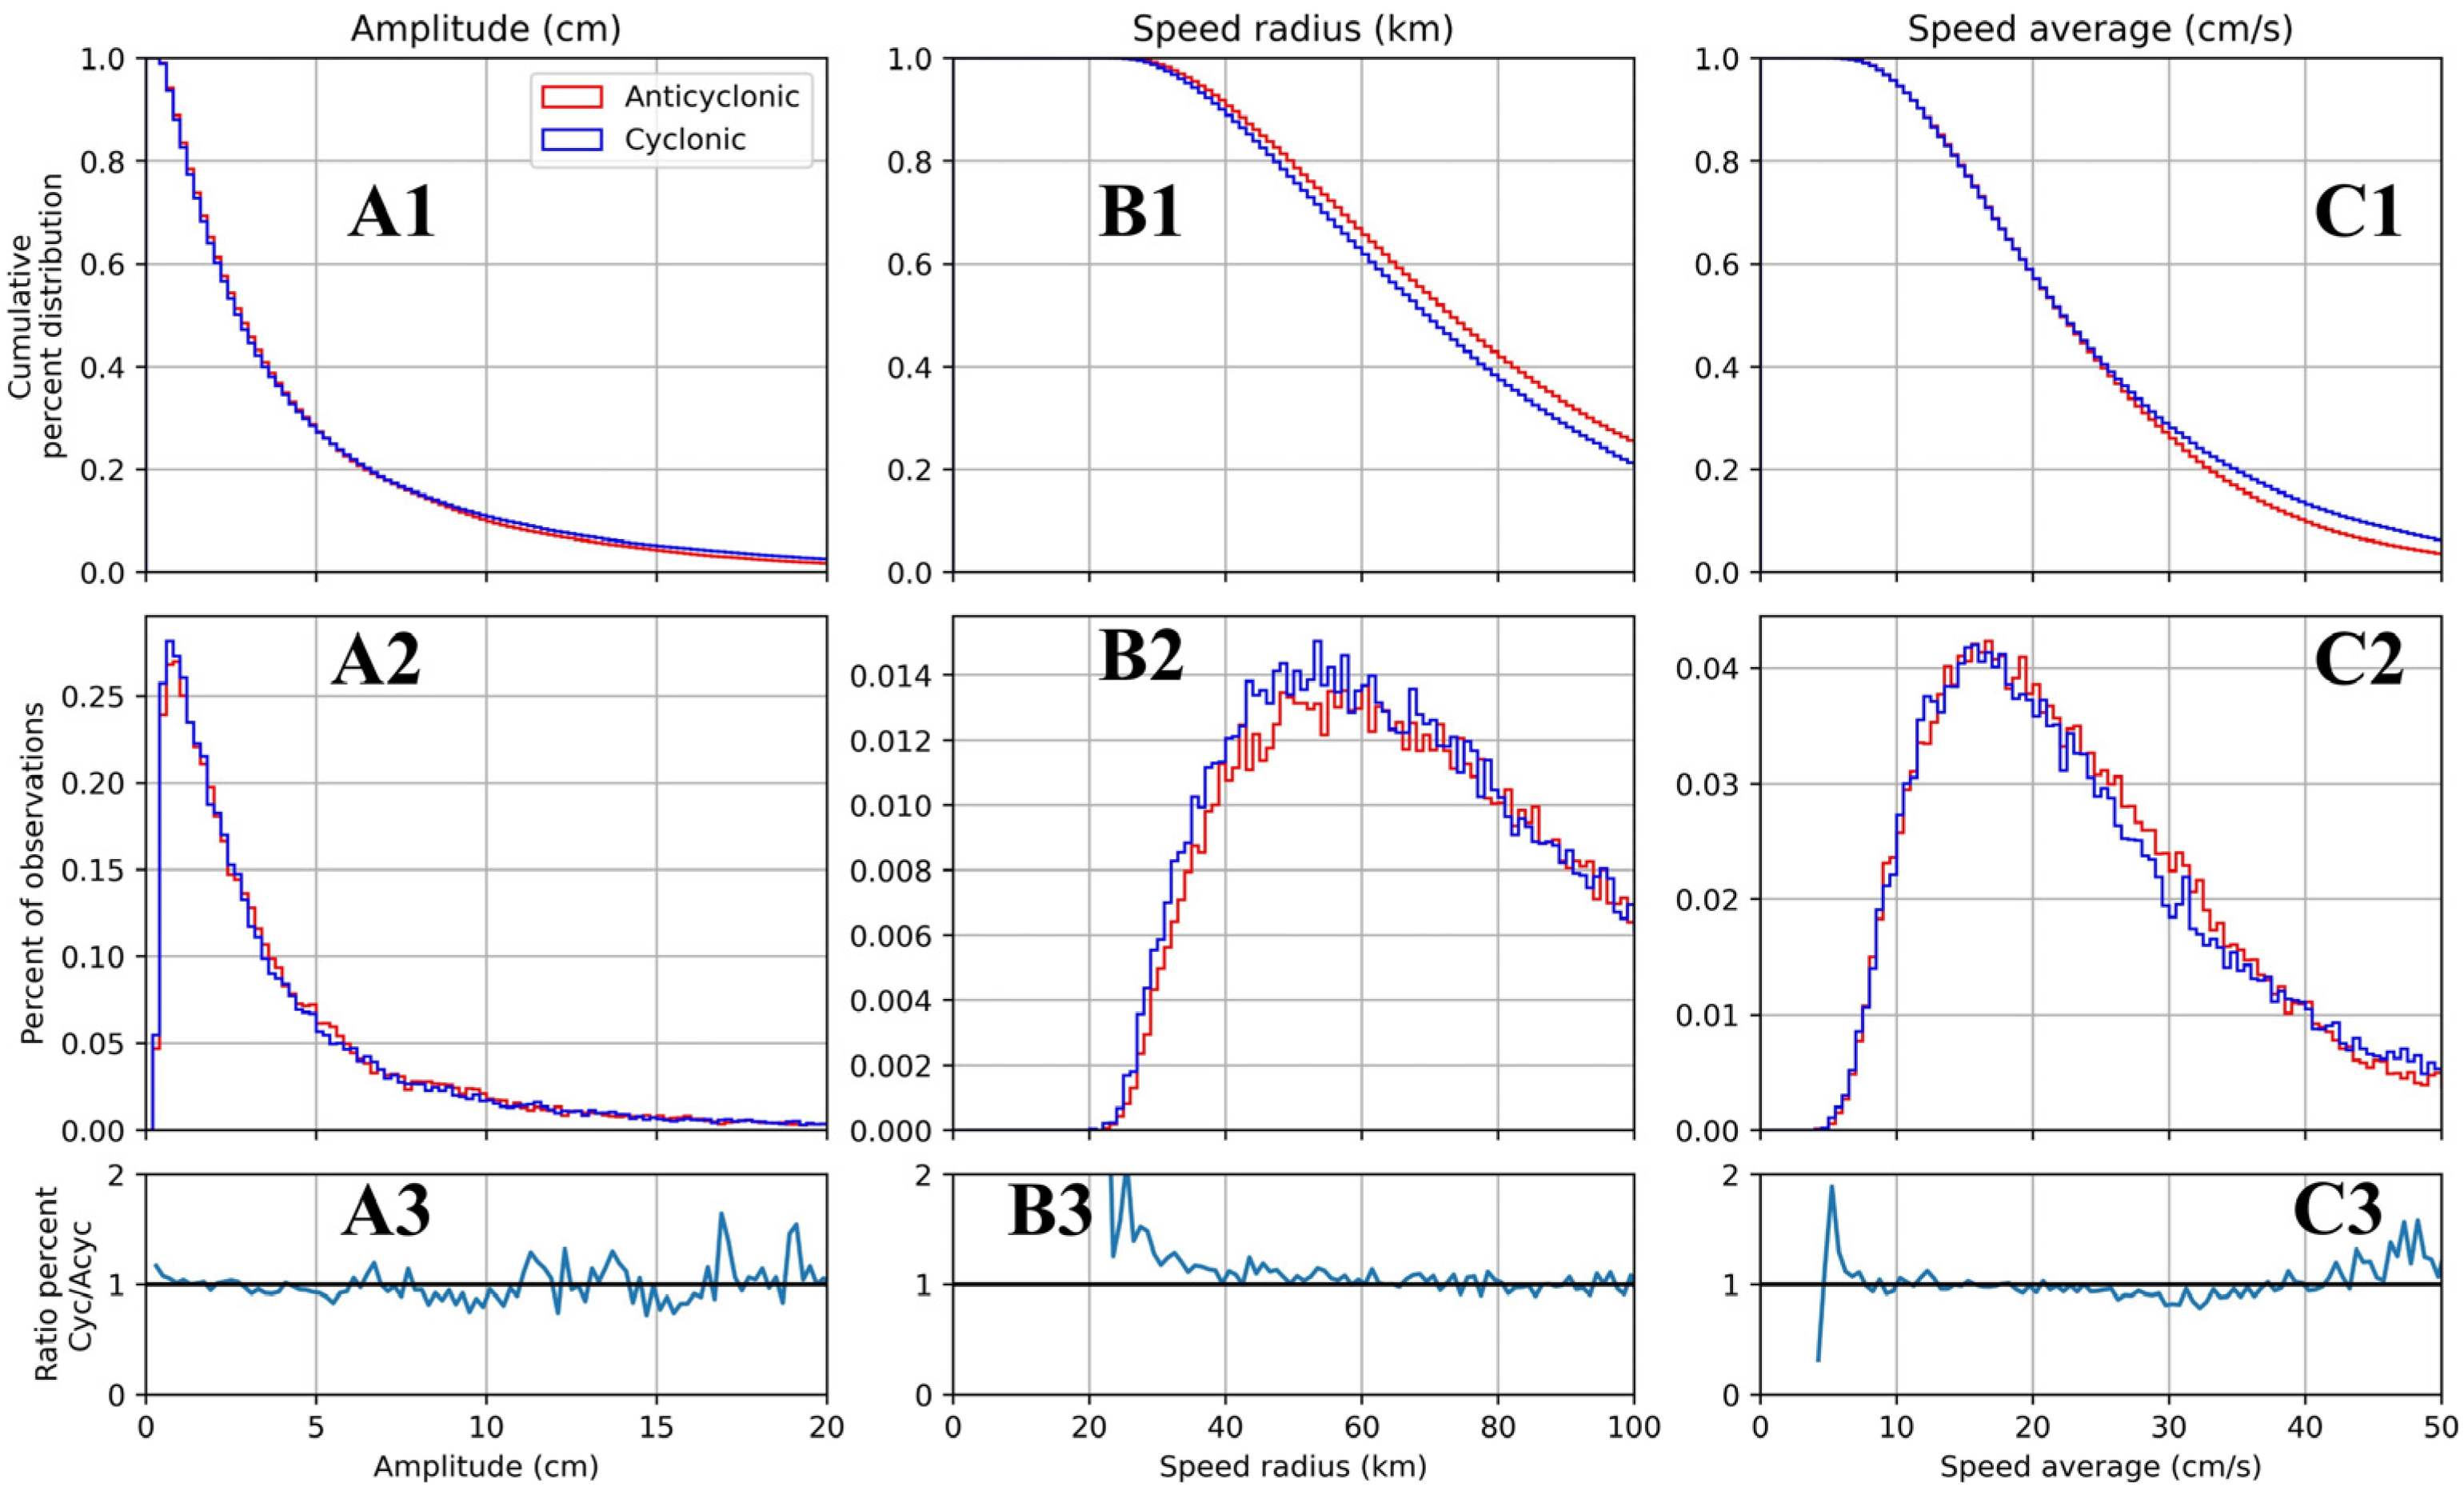
The statistical diagnostics of eddy characteristics, such as amplitude, speed, radius, and average speed, reveal distinct distribution patterns between cyclonic and anticyclonic eddies. Figure 7 provides a comparative analysis of amplitude, speed, radius, and average speed for cyclonic (blue) and anticyclonic (red) mesoscale eddies. In the amplitude column (Figure 7A1–A3), both eddy types exhibit a steep cumulative distribution, with most amplitudes under 10 cm, and the histogram shows cyclonic eddies are slightly more common at certain low amplitude bins. The ratio plot (A3) indicates that the frequency of cyclonic to anticyclonic eddies remains close to 1 across amplitudes, suggesting similar occurrence rates. In contrast, the speed radius column (Figure 7B1–B3) shows that cyclonic eddies generally have slightly larger radii, with the histogram (B2) peaking between 40 and 80 km, and the cumulative curve (B1) reflecting a broader spread. The ratio (B3) confirms cyclonic dominance across much of the radius range. For average speed (Figure 7C1–C3), both eddy types peak around 20 cm/s, though cyclonic eddies are marginally more frequent at higher speeds. The cumulative distribution (C1) is nearly identical for both types, but the ratio (C3) shows localized peaks favoring cyclonic eddies. Overall, cyclonic eddies tend to exhibit slightly larger radii and higher speeds, while both types are similarly distributed in amplitude.
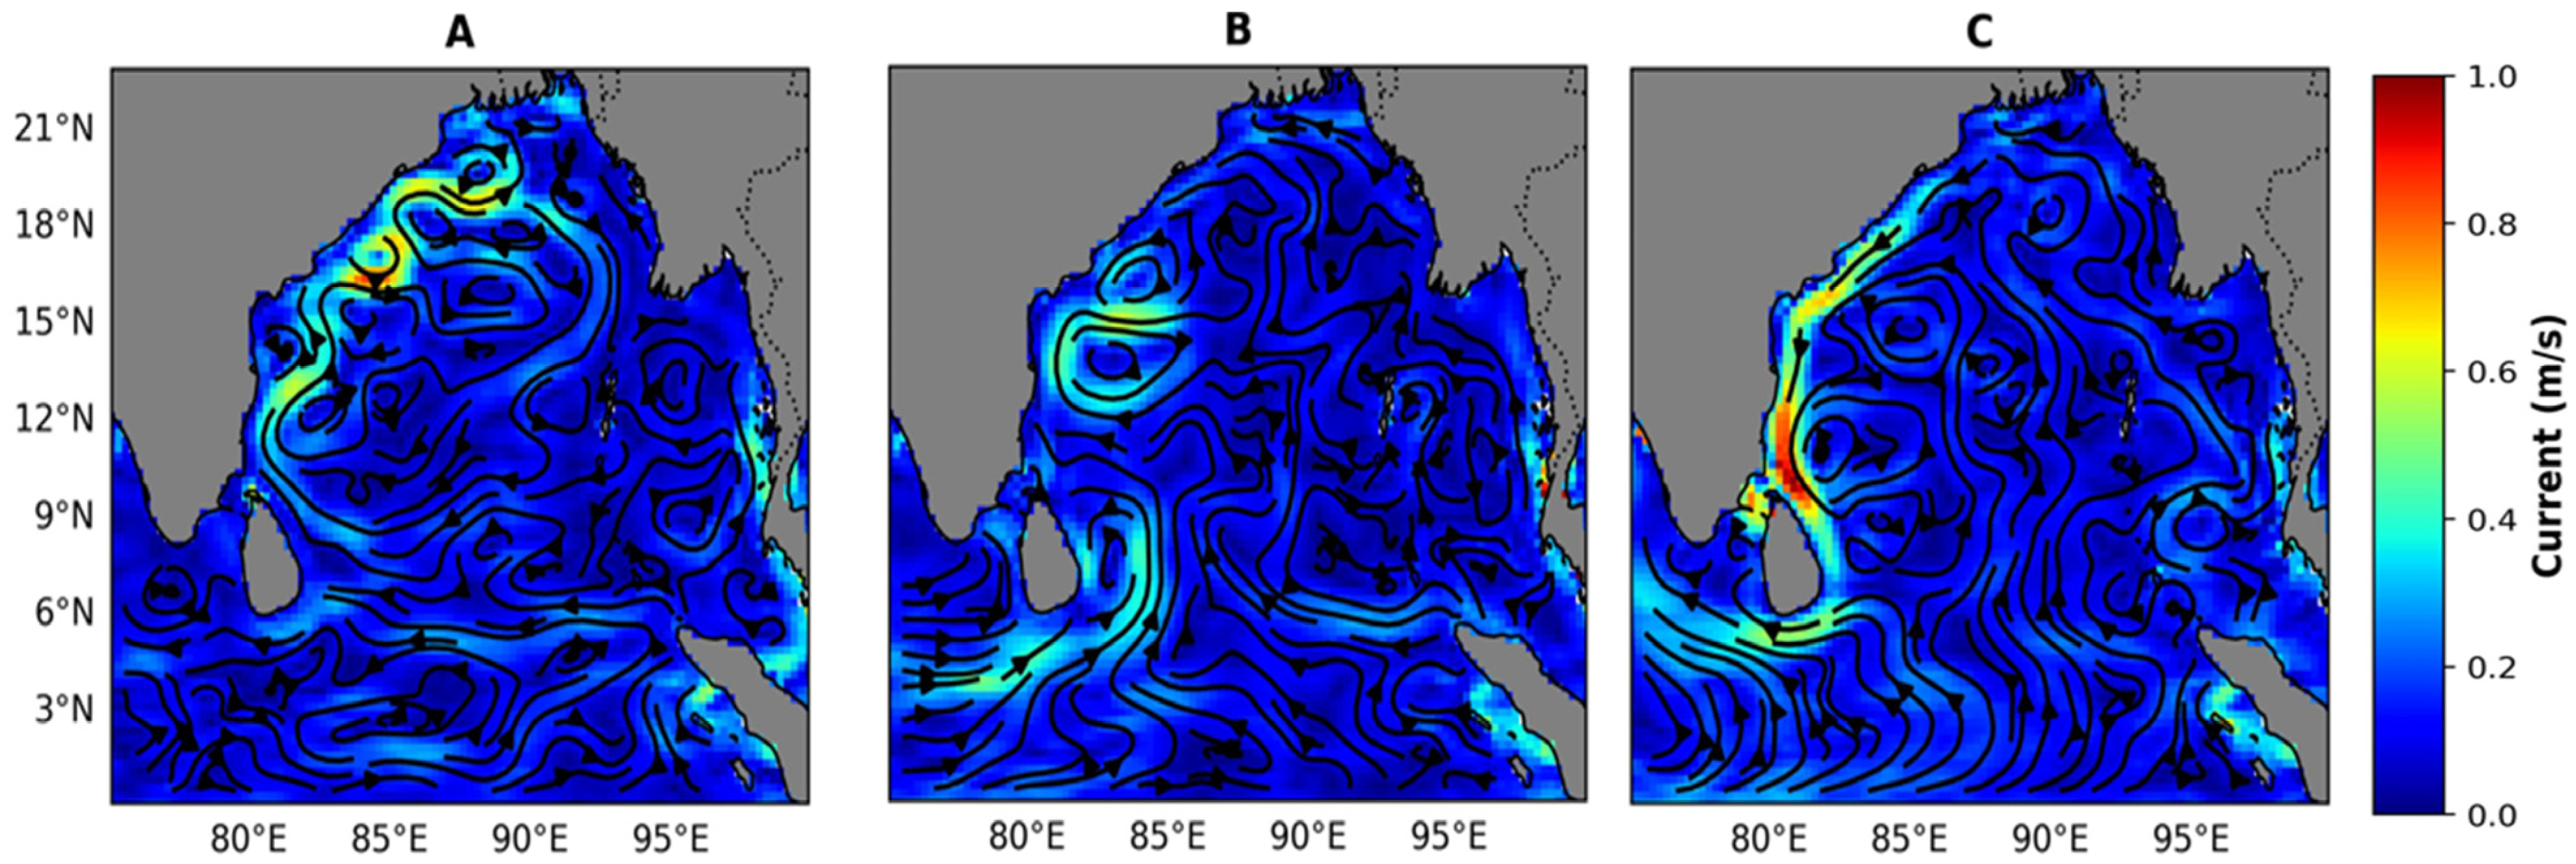
Ocean-scale circulation (Figure 8) in the BoB is unique and more complex than other regional bays and seas in the world because it is dominated by the seasonally reversing monsoon wind system; southwesterly winds during summer months (June–September) and northeasterly winds during fall (October–December). The EICC flows northward during the inter-monsoon season, beginning in February, and becomes extremely strong in March and April because of anticyclonic eddies forming and spreading westward (see Figure 8A). As the southwest monsoon arrives, the EICC continues to flow north along the southern portion of the Indian Peninsula, but the current becomes erratic as it approaches the head Bay region (Figure 8B). Fall arrives (October to December), and EICC begins to flow southward with current speed reaching 1 m s−1 in the upper 70–80 m. Low-salinity water from the head bay area is transported south by the EICC, and high-salinity water is brought into the bay by the subsurface northward flow during this season. In contrast, the eastern coast experiences moderate currents, typically ranging between 0.2 and 0.6 m/s.
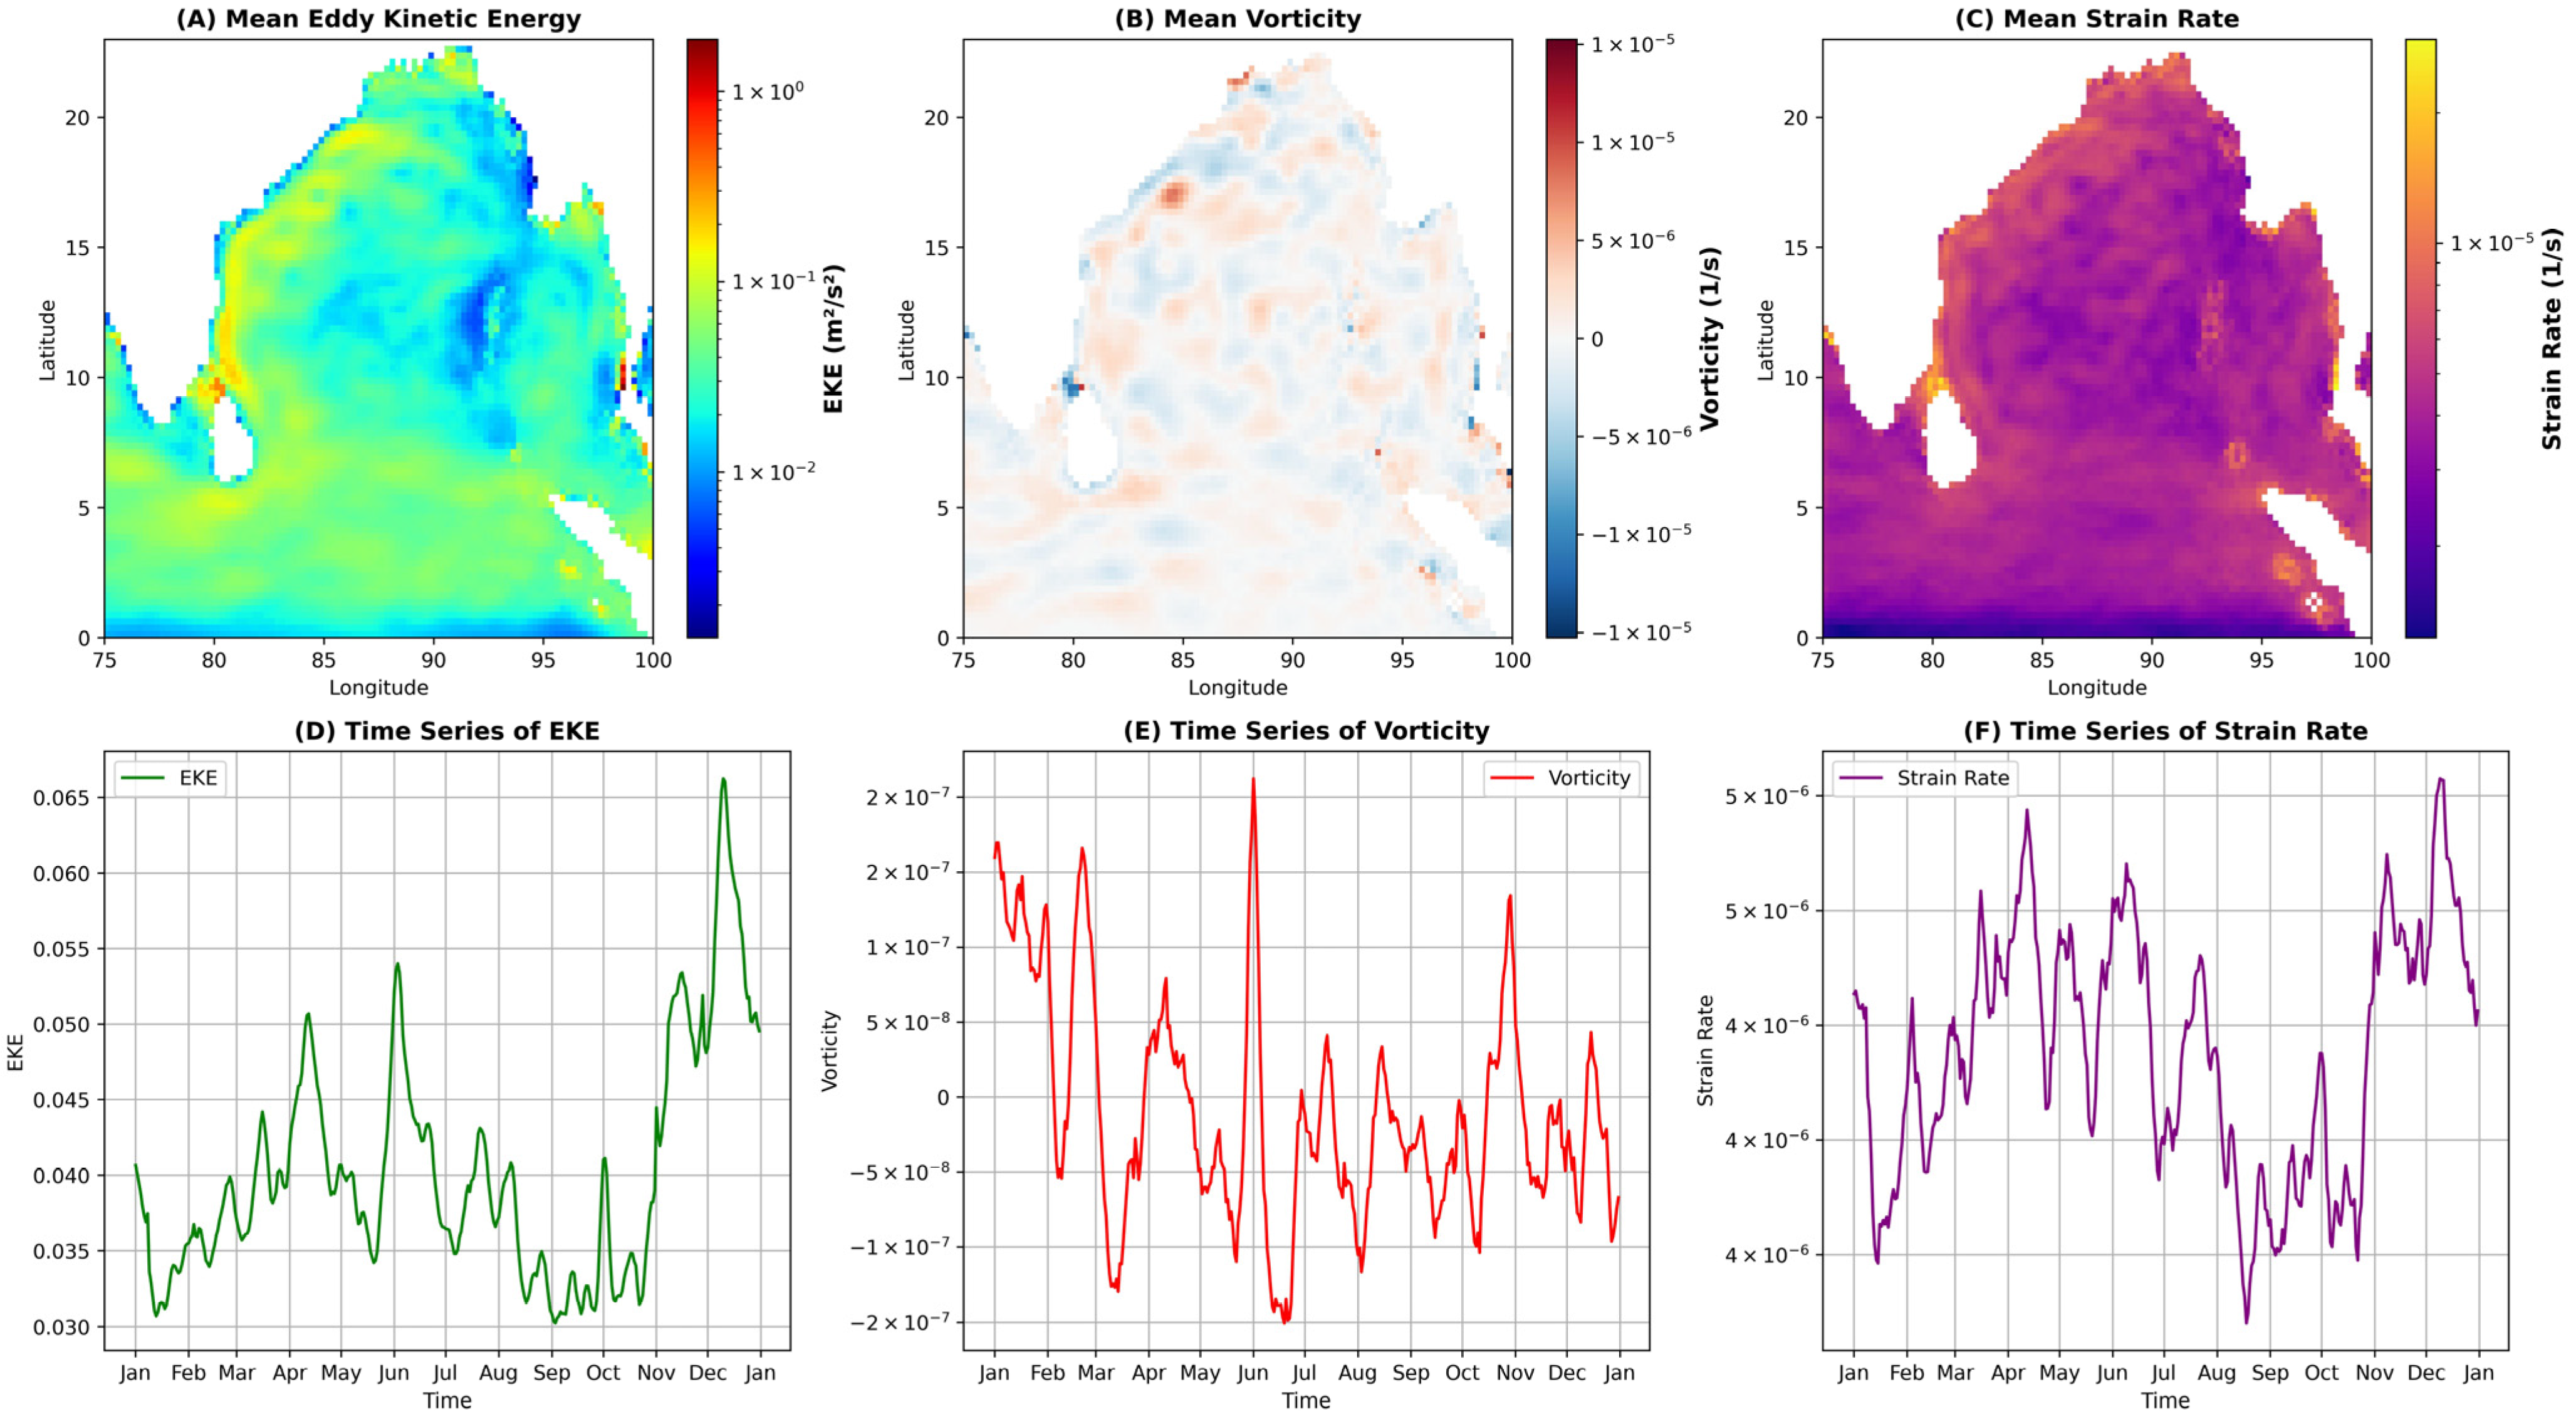
Figure 9 provides a comprehensive depiction of mesoscale dynamics in the BoB through the spatial and temporal distribution of three key parameters: EKE, vorticity, and strain rate. The spatial maps (top row) highlight regions of persistent mesoscale activity, while the time series (bottom row) captures the seasonal evolution of these features. The spatial distribution of mean EKE (Figure 9A) reveals intensified eddy activity along the western boundary and northern reaches of the BoB, particularly off the eastern coast of India and near the head of the bay. Similarly, vorticity maps (Figure 9B) display alternating positive (cyclonic) and negative (anticyclonic) patches concentrated in the same regions. The mean strain rate (Figure 9C) is elevated in the western and northeastern parts of the basin, indicating enhanced deformation zones where flow shears are more pronounced.
The temporal analysis (Figure 9D–F) provides further insights into the seasonal modulation of mesoscale features. The EKE time series exhibits clear seasonal peaks during May–June and November–December, aligning with the pre-monsoon and post-monsoon periods. The vorticity time series fluctuates around zero with episodic bursts of positive and negative values, indicating alternating dominance of cyclonic and anticyclonic eddies. Strain rate variations (Figure 9F) peak during the monsoon transition periods (March–April and August–September), suggesting enhanced lateral shears and eddy–eddy interactions during changes in current regimes.

4. Discussion

This study provides a decade-long statistical assessment of mesoscale eddy characteristics in the BoB, revealing insights into their distribution, polarity, propagation, lifespan, and seasonal variability. The discussion integrates these results with known physical mechanisms, prior studies, and regional oceanographic dynamics to better interpret the observed patterns and their implications.
The comparable overall frequency of cyclonic and anticyclonic eddies in 1972 and 1880, respectively, corroborates findings from Cui et al. [43] and Trott and Subrahmanyam [44], who reported similar polarity distributions in the BoB. However, the spatial asymmetry observed—with cyclonic eddies concentrated along the western boundary and anticyclonic eddies more dispersed, particularly around the Andaman Sea reflects regional dynamics shaped by baroclinic instability from EICC–slope interactions. Recent analyses using satellite altimetry from 1993 to 2021 reaffirm that anticyclonic eddies are more variable under IOD and ENSO forcing [6] and that cyclonic eddy kinetic energy peaks during monsoon months, especially in the western bay [44]. Additionally, cycle-eddy structures and seasonally alternating eddy pairs in the western bay have been attributed to barotropic and baroclinic instabilities tied to the monsoon-driven EICC reversal [45]. These recent findings support and extend earlier interpretations of the BoB eddy field [14,18]. The persistent eddy activity observed east of Sri Lanka can be attributed to the convergence of monsoon-driven surface currents and bathymetric steering, establishing this region as a recurring hotspot of eddy formation. In particular, summer observations have consistently recorded an annually recurring anticyclonic eddy roughly 500 km southeast of Sri Lanka formed in early summer as the Southwest Monsoon Current (SMC) encounters Sri Lanka’s southern coastline and bathymetric features, and dissipates by September [46]. This anticyclonic eddy (sometimes referred to as the Sri Lanka Dome, SLD) is generated through the interaction of the SMC and adjacent Rossby waves, demonstrating how current convergence and bathymetric barriers drive steady eddy production in this region [47,48].
Previous studies have demonstrated that eddy polarity is closely linked to distinct generation mechanisms and contrasting effects on upper-ocean structure and dynamics [49,50,51,52]. Although our study emphasizes the spatial and temporal characteristics of eddies in the BoB, these polarity-driven differences provide valuable context for interpreting the observed patterns. Cyclonic eddies, typically associated with current convergence, topographic interactions, or baroclinic instability of boundary currents, have been recorded in key regions such as the northwestern BoB. For instance, a notable cold-core subsurface eddy observed in July 1984 centered around 17°40′ N and 85°19′ E was attributed to baroclinic instability at the interface of opposing shelf currents, displaying a substantial temperature anomaly of 4–5°C below the mixed layer [53]. These cold-core features promote SST cooling, latent heat flux reduction, and enhanced vertical mixing, which can influence air–sea heat exchange and potentially modulate tropical cyclone development or suppression [25]. In contrast, anticyclonic eddies, often generated by current divergence or atmospheric disturbances such as monsoonal wind bursts and cyclonic storms [18,54], contribute to deepening of isopycnals and increased ocean heat content, reinforcing upper-ocean stratification and altering vertical thermal gradients [55]. These mechanistic differences between eddy types are crucial for understanding their roles in shaping thermohaline structure, regional circulation, and air–sea interactions in the BoB.
The westward propagation of over 91% of eddies consistent with first-mode baroclinic Rossby wave dynamics strongly aligns with prior studies in the BoB (e.g., Chen et al. [18]; Cheng et al. [11]), reinforcing the understanding that these mesoscale features are largely steered by basin-scale baroclinic Rossby wave activity radiating from the Myanmar coast [44]. Eddies that persisted for longer, up to 30 weeks, traveled farther, with propagation distances exceeding 1100 km, underscoring their potential role in long-range lateral transport. The dominance of cyclonic eddies at longer distances and lifespans suggests that these features are more structurally resilient and dynamically coupled to deeper ocean layers. This is consistent with previous findings that linked such behavior to enhanced vertical coherence, especially under the influence of background vorticity and monsoonal wind stress curl [44,56]. The birth locations of eddies also displayed clear polarity-linked spatial trends. Cyclonic eddies had a scattered distribution across the basin, while anticyclonic eddies were more shelf-bound and clustered near the southeastern BoB, particularly the Andaman Sea. This pattern reflects the contrast between local baroclinic instability of the EICC (which contributes 30–50% of sea level variability in the western BoB; Mandal et al. [57]) and remote wave forcing mechanisms like coastal Kelvin and Rossby waves, which dominate in the east [11,22]. These dual mechanisms produce regional differences in eddy size, polarity, and longevity. Seasonal monsoon variability further modulates eddy activity, with anticyclonic eddies favored during the southwest monsoon and cyclonic eddies during the northeast monsoon, as supported by Chen et al. [18] and Chang et al. [11].
Analysis of eddy lifespan distribution revealed that cyclonic eddies dominate at longer timescales, comprising approximately 83% of eddies persisting for 30 weeks, while shorter-lived eddies maintain near parity between cyclonic and anticyclonic types. This shift from a nearly balanced distribution at shorter lifespans to strong cyclonic dominance at longer durations suggests that cyclonic eddies are inherently more stable under the prevailing hydrographic and wind conditions of the BoB. These observations are consistent with Gulakaram et al. [21], who reported enhanced vertical structure and persistence of cyclonic eddies in the region, and are supported more broadly by recent studies highlighting polarity-dependent eddy coherence and longevity [51]. The relative scarcity of anticyclonic eddies at extended lifespans implies they are more susceptible to dissipation, likely due to interactions with shelf slopes or enhanced stratification, which limits their stability over time. The radius characteristics are also consistent with Boopathi and Mohanty [58], who reported similar patterns across contrasting IOD phases.
Seasonal circulation patterns, as visualized in Figure 8, reinforce the role of the EICC in modulating mesoscale activity. The bifurcation of the EICC east of Sri Lanka, where one branch flows north and the other turns eastward, is driven annually by anticyclonic eddy impingement, as noted in Cheng et al. [11]. This bifurcation is suppressed during IOD years, confirming the influence of remote climatic drivers such as ENSO and IOD on BoB circulation and eddy variability [13,54]. The observed seasonal reversal of the EICC, paired with freshwater inflows from major rivers like the Ganges–Brahmaputra–Meghna system, promotes alternating patterns of stratification and baroclinicity that are conducive to eddy formation during inter-monsoonal phases.
Spatial and temporal distributions of EKE, vorticity, and strain rate (Figure 9) further validate these findings. High EKE and strain were concentrated along the western boundary and northern BoB, areas previously recognized for energetic currents and river-induced stratification [12,18]. The seasonal peaks in EKE during May–June and November–December correspond to monsoonal transition periods, a time when circulation restructuring is known to intensify mesoscale variability [59]. The vorticity and strain maps revealed balanced alternating patches of cyclonic and anticyclonic signals, indicating a quasi-equilibrium of eddy generation. High strain zones were especially pronounced near frontogenesis and filamentation regions, favorable for submesoscale processes and vertical nutrient transport [60,61,62].
In addition to their physical and statistical characteristics, mesoscale eddies in the BoB are widely recognized for their influence on marine ecosystems, climate variability, and fisheries [15,63]. While this study focuses on the spatial and temporal distribution of eddies, prior research has shown that cyclonic eddies uplift nutrient-rich waters into the euphotic zone, triggering phytoplankton blooms and supporting higher trophic levels such as zooplankton and pelagic fish [64,65]. These eddies also retain larvae and plankton within their cores or along their peripheries, enhancing recruitment and biodiversity [3,66]. Conversely, anticyclonic eddies, though often less productive in their centers, can concentrate on buoyant organisms and microplastics at their convergence zones [35]. Eddies also shape habitat conditions by modulating salinity and stratification, with implications for species distribution and carbon cycling. For instance, eddy-induced mixing can raise surface salinity and homogenize stratified layers [67], while cyclonic eddies have been linked to enhanced carbon export and oxygen variability, contributing significantly to the biological pump, though potentially exacerbating oxygen depletion at depth [68].
Beyond ecological implications, mesoscale eddies are increasingly recognized as critical components of climate modeling, weather prediction, and resource management. Their role in heat redistribution, cooling the surface through upwelling in cyclonic eddies or storing heat in anticyclonic eddies directly influences SST, monsoonal convection, and cyclone intensification [24,25]. High-resolution models that resolve eddies improve simulations of SST and upper-ocean heat content and better capture atmosphere-ocean coupling during monsoon depressions and cyclone events [17,54]. In fisheries, satellite-derived Potential Fishing Zones that incorporate eddy data have been shown to enhance pelagic fish catch predictions in the western BoB [69]. As climate change may alter eddy frequency, intensity, and nutrient dynamics, integrating real-time eddy tracking into adaptive fisheries management is increasingly essential. Moreover, eddies impact pollutant dispersion and conservation planning, trapping plastics in anticyclonic cores or dispersing contaminants in cyclonic flows. Understanding eddy corridors also supports the design of marine protected areas that maintain larval connectivity and ecosystem resilience. Altogether, these broader implications reinforce the value of regional eddy statistics in informing ecological models, operational forecasts, and sustainable marine management in the BoB.

5. Conclusions

Mesoscale eddies in the BoB were studied in terms of their lifespan and frequency using satellite altimetry data spanning from 2010 to 2020. Employing a hybrid algorithm that incorporates both physical and geometrical properties, we have detected and tracked eddies in the study area. This study thoroughly examines the statistical characteristics, variability, and properties of both anticyclonic eddies and cyclonic eddies over 10 years. The results revealed a distinct relationship between the level of eddy activity and a myriad of regional forcings that caused it, including the role of Rossby waves and Kelvin waves propagating across the BoB. Cyclonic eddies, prevalent in the western and head Bay region of BoB, enhance primary productivity by promoting nutrient upwelling and mixing. Conversely, anticyclonic eddies, which are more common in mid to eastern regions, tend to suppress nutrient availability, which may result in lower productivity. Our findings underscore the significant role played by mesoscale eddies in redistributing nutrients and mixing of water masses within the BoB, with a particular emphasis on the impact of cyclonic eddies on ocean productivity. Understanding the dynamics of these eddies is crucial for effective management and conservation efforts aimed at sustaining marine resources and livelihoods in this region. Further research and monitoring efforts are warranted to deepen our understanding of complex interactions between eddies and productivity, thereby informing more targeted and sustainable management strategies for the BoB ecosystem.

Author Contributions

Conceptualization, H.A. and F.J.; methodology, H.A.; software, H.A.; validation, H.A. and F.J.; formal analysis, H.A. and F.J.; investigation, H.A. and F.J.; data curation, H.A. and S.I.J.; writing—original draft preparation, H.A.; review and editing, F.J., P.D. and S.I.J.; visualization, H.A.; supervision, F.J. and P.D. All authors have read and agreed to the published version of the manuscript.

Funding

This research received no external funding.

Institutional Review Board Statement

Not applicable.

Informed Consent Statement

Not applicable.

Data Availability Statement

Data will be available upon reasonable request from H.A. and J.F.

Conflicts of Interest

The authors declare no conflicts of interest.

References

  1. Dong, C.; You, Z.; Dong, J.; Ji, J.; Sun, W.; Xu, G.; Lu, X.; Xie, H.; Teng, F.; Liu, Y.; et al. Oceanic Mesoscale Eddies. Ocean-Land-Atmos. Res. 2025, 4, 0081. [Google Scholar] [CrossRef]
  2. Xu, F.; Wen, Z.; Wang, H.; Li, T.; Song, X.; Peng, H. Trends and Innovations in Ocean Mesoscale Eddy Studies via Satellite Observation: A Bibliometric Review. Front. Mar. Sci. 2025, 12, 1577339. [Google Scholar] [CrossRef]
  3. Robinson, I.S. Mesoscale Ocean Features: Eddies. In Discovering the Ocean from Space; Springer: Berlin/Heidelberg, Germany, 2010; pp. 69–114. ISBN 978-3-540-24430-1. [Google Scholar]
  4. McWhorter, J.K.; Roman-Stork, H.L.; Le Hénaff, M.; Frenzel, H.; Johnston, M.A.; Cornec, M.; Osborne, E. Mesoscale Eddies Influence Coral Reef Environments in the Northwest Gulf of Mexico. JGR Ocean. 2024, 129, e2023JC020821. [Google Scholar] [CrossRef]
  5. Zhang, Z.; Wang, G.; Wang, H.; Liu, H. Three-Dimensional Structure of Oceanic Mesoscale Eddies. Ocean-Land-Atmos. Res. 2024, 3, 0051. [Google Scholar] [CrossRef]
  6. Mimi, M.S.; Ahmed, M.K.; Chowdhury, K.M.A.; Chowdhury, M.N.S.; Moontahab, A. The Influence of Climate Variability Events on the Mesoscale Eddies in the Bay of Bengal. J. Sea Res. 2024, 201, 102532. [Google Scholar] [CrossRef]
  7. Zhang, Z.; Chen, X.; Chi, L.; Yuan, C.; Zhang, J.; Zhang, S. Large-Scale Climate Patterns Modulate Intraseasonal Mesoscale Activities in the Bay of Bengal. Geophys. Res. Lett. 2025, 52, e2024GL111578. [Google Scholar] [CrossRef]
  8. Zhong, W.; Chen, G.; Chu, X. An Eddy Pair in the Northwestern Bay of Bengal: Characteristics, Dynamics and Interannual Variability. JGR Ocean. 2024, 129, e2023JC020383. [Google Scholar] [CrossRef]
  9. Subramanian, V. Sediment Load of Indian Rivers. Curr. Sci. 1993, 64, 928–930. [Google Scholar]
  10. Ahmad, H.; Jose, F.; Bhuyan, M.S.; Islam, M.N.; Dash, P. Seasonal Influence of Freshwater Discharge on Spatio-Temporal Variations in Primary Productivity, Sea Surface Temperature, and Euphotic Zone Depth in the Northern Bay of Bengal. Acta Oceanol. Sin. 2024, 43, 1–14. [Google Scholar] [CrossRef]
  11. Cheng, X.; McCreary, J.P.; Qiu, B.; Qi, Y.; Du, Y.; Chen, X. Dynamics of Eddy Generation in the Central Bay of Bengal. J. Geophys. Res. Ocean. 2018, 123, 6861–6875. [Google Scholar] [CrossRef]
  12. Sarma, V.; Jagadeesan, L.; Dalabehera, H.B.; Rao, D.N.; Kumar, G.S.; Durgadevi, D.S.; Yadav, K.; Behera, S.; Priya, M.M.R. Role of Eddies on Intensity of Oxygen Minimum Zone in the Bay of Bengal. Cont. Shelf Res. 2018, 168, 48–53. [Google Scholar] [CrossRef]
  13. Vinayachandran, P.N.; Shetye, S.R.; Sengupta, D.; Gadgil, S. Forcing Mechanisms of the Bay of Bengal. Curr. Sci. 1996, 70, 753–763. [Google Scholar]
  14. Kumar, S.P.; Nuncio, M.; Narvekar, J.; Kumar, A.; Sardesai, S.; Souza, S.N.D.; Gauns, M.; Ramaiah, N.; Madhupratap, M. Are Eddies Nature’s Trigger to Enhance Biological Productivity in the Bay of Bengal? Geophys. Res. Lett. 2004, 31, L07309. [Google Scholar] [CrossRef]
  15. Kumar, S.P.; Nuncio, M.; Ramaiah, N.; Sardesai, S.; Narvekar, J.; Fernandes, V.; Paul, J.T. Eddy-Mediated Biological Productivity in the Bay of Bengal during Fall and Spring Intermonsoons. Deep-Sea Res. Part I Oceanogr. Res. Pap. 2007, 54, 1619–1640. [Google Scholar] [CrossRef]
  16. Kumar, S.P.; Narvekar, J.; Nuncio, M.; Kumar, A.; Ramaiah, N.; Sardesai, S.; Gauns, M.; Fernandes, V.; Paul, J. Is the Biological Productivity in the Bay of Bengal Light Limited? Curr. Sci. 2010, 98, 1331–1339. [Google Scholar]
  17. Roman-Stork, H.L.; Subrahmanyam, B.; Trott, C.B. Mesoscale Eddy Variability and Its Linkage to Deep Convection over the Bay of Bengal Using Satellite Altimetric Observations. Adv. Space Res. 2021, 68, 378–400. [Google Scholar] [CrossRef]
  18. Chen, G.; Wang, D.; Hou, Y. The Features and Interannual Variability Mechanism of Mesoscale Eddies in the Bay of Bengal. Cont. Shelf Res. 2012, 47, 178–185. [Google Scholar] [CrossRef]
  19. Dandapat, S.; Chakraborty, A. Mesoscale Eddies in the Western Bay of Bengal as Observed from Satellite Altimetry in 1993–2014: Statistical Characteristics, Variability and Three-Dimensional Properties. IEEE J. Sel. Top. Appl. Earth Obs. Remote Sens. 2016, 9, 5044–5054. [Google Scholar] [CrossRef]
  20. Mukherjee, A.; Chatterjee, A.; Francis, P.A. Role of Andaman and Nicobar Islands in Eddy Formation along Western Boundary of the Bay of Bengal. Sci. Rep. 2019, 9, 10152. [Google Scholar] [CrossRef] [PubMed]
  21. Gulakaram, V.S.; Vissa, N.K.; Bhaskaran, P.K. Characteristics and Vertical Structure of Oceanic Mesoscale Eddies in the Bay of Bengal. Dyn. Atmos. Ocean. 2020, 89, 101131. [Google Scholar] [CrossRef]
  22. Gonaduwage, L.P.; Chen, G.; McPhaden, M.J.; Priyadarshana, T.; Huang, K.; Wang, D. Meridional and Zonal Eddy-Induced Heat and Salt Transport in the Bay of Bengal and Their Seasonal Modulation. JGR Ocean. 2019, 124, 8079–8101. [Google Scholar] [CrossRef]
  23. Muraleedharan, K.R.; Jasmine, P.; Achuthankutty, C.T.; Revichandran, C.; Kumar, P.K.D.; Anand, P.; Rejomon, G. Influence of Basin-Scale and Mesoscale Physical Processes on Biological Productivity in the Bay of Bengal during the Summer Monsoon. Prog. Oceanogr. 2007, 72, 364–383. [Google Scholar] [CrossRef]
  24. Nuncio, M.; Kumar, S.P. Life Cycle of Eddies along the Western Boundary of the Bay of Bengal and Their Implications. J. Mar. Syst. 2012, 94, 9–17. [Google Scholar] [CrossRef]
  25. He, Q.; Zhan, H.; Cai, S. Anticyclonic Eddies Enhance the Winter Barrier Layer and Surface Cooling in the Bay of Bengal. JGR Ocean. 2020, 125, e2020JC016524. [Google Scholar] [CrossRef]
  26. Pascual, A.; Faugère, Y.; Larnicol, G.; Le Traon, P. Improved Description of the Ocean Mesoscale Variability by Combining Four Satellite Altimeters. Geophys. Res. Lett. 2006, 33, L02611. [Google Scholar] [CrossRef]
  27. Okubo, A. Horizontal Dispersion of Floatable Particles in the Vicinity of Velocity Singularities Such as Convergences. Deep. Sea Res. Oceanogr. Abstr. 1970, 17, 445–454. [Google Scholar] [CrossRef]
  28. Mason, E.; Pascual, A.; McWilliams, J.C. A New Sea Surface Height–Based Code for Oceanic Mesoscale Eddy Tracking. J. Atmos. Ocean. Technol. 2014, 31, 1181–1188. [Google Scholar] [CrossRef]
  29. Kurian, J.; Colas, F.; Capet, X.; McWilliams, J.C.; Chelton, D.B. Eddy Properties in the California Current System. J. Geophys. Res. Ocean. 2011, 116, C08027. [Google Scholar] [CrossRef]
  30. Morrow, R.; Le Traon, P.-Y. Recent Advances in Observing Mesoscale Ocean Dynamics with Satellite Altimetry. Adv. Space Res. 2012, 50, 1062–1076. [Google Scholar] [CrossRef]
  31. Madhu, N.V.; Jyothibabu, R.; Maheswaran, P.A.; Gerson, V.J.; Gopalakrishnan, T.C.; Nair, K.K.C. Lack of Seasonality in Phytoplankton Standing Stock (Chlorophyll a) and Production in the Western Bay of Bengal. Cont. Shelf Res. 2006, 26, 1868–1883. [Google Scholar] [CrossRef]
  32. Hunter, J.D. Matplotlib: A 2D Graphics Environment. Comput. Sci. Eng. 2007, 9, 90–95. [Google Scholar] [CrossRef]
  33. Chaigneau, A.; Gizolme, A.; Grados, C. Mesoscale Eddies off Peru in Altimeter Records: Identification Algorithms and Eddy Spatio-Temporal Patterns. Prog. Oceanogr. 2008, 79, 106–119. [Google Scholar] [CrossRef]
  34. Nencioli, F.; Dong, C.; Dickey, T.; Washburn, L.; McWilliams, J.C. A Vector Geometry–Based Eddy Detection Algorithm and Its Application to a High-Resolution Numerical Model Product and High-Frequency Radar Surface Velocities in the Southern California Bight. J. Atmos. Ocean. Technol. 2010, 27, 564–579. [Google Scholar] [CrossRef]
  35. Chelton, D.B.; Schlax, M.G.; Samelson, R.M. Global Observations of Nonlinear Mesoscale Eddies. Prog. Oceanogr. 2011, 91, 167–216. [Google Scholar] [CrossRef]
  36. Doglioli, A.M.; Blanke, B.; Speich, S.; Lapeyre, G. Tracking Coherent Structures in a Regional Ocean Model with Wavelet Analysis: Application to Cape Basin Eddies. J. Geophys. Res. Ocean. 2007, 112, C05043. [Google Scholar] [CrossRef]
  37. Penven, P.; Echevin, V.; Pasapera, J.; Colas, F.; Tam, J. Average Circulation, Seasonal Cycle, and Mesoscale Dynamics of the Peru Current System: A Modeling Approach. J. Geophys. Res. Ocean. 2005, 110, C10021. [Google Scholar] [CrossRef]
  38. Waugh, D.W.; Abraham, E.R.; Bowen, M.M. Spatial Variations of Stirring in the Surface Ocean: A Case Study of the Tasman Sea. J. Phys. Oceanogr. 2006, 36, 526–542. [Google Scholar] [CrossRef]
  39. Isern-Fontanet, J.; García-Ladona, E.; Font, J. Identification of Marine Eddies from Altimetric Maps. J. Atmos. Ocean. Technol. 2003, 20, 772–778. [Google Scholar] [CrossRef]
  40. Knudsen, P.; Andersen, O.; Maximenko, N. A New Ocean Mean Dynamic Topography Model, Derived from a Combination of Gravity, Altimetry and Drifter Velocity Data. Adv. Space Res. 2021, 68, 1090–1102. [Google Scholar] [CrossRef]
  41. De Vos, M.; Backeberg, B.; Counillon, F. Using an Eddy-Tracking Algorithm to Understand the Impact of Assimilating Altimetry Data on the Eddy Characteristics of the Agulhas System. Ocean Dyn. 2018, 68, 1071–1091. [Google Scholar] [CrossRef]
  42. D’Addezio, J.M.; Jacobs, G.A.; Yaremchuk, M.; Souopgui, I. Submesoscale Eddy Vertical Covariances and Dynamical Constraints from High-Resolution Numerical Simulations. J. Phys. Oceanogr. 2020, 50, 1087–1115. [Google Scholar] [CrossRef]
  43. Cui, W.; Zhou, C.; Zhang, J.; Yang, J. Statistical Characteristics and Thermohaline Properties of Mesoscale Eddies in the Bay of Bengal. Acta Oceanol. Sin. 2021, 40, 10–22. [Google Scholar] [CrossRef]
  44. Trott, C.B.; Subrahmanyam, B. Eddy Characteristics and Vertical Structure in the Bay of Bengal during Different Monsoon Regimes. Remote Sens. 2023, 15, 1079. [Google Scholar] [CrossRef]
  45. Liu, S.; Xu, J.; Qiao, L.; Li, G.; Shi, J.; Ding, D.; Yu, D.; Yang, X.; Pan, Y.; Liu, S.; et al. Spatial-Temporal Variations of Short-Lived Mesoscale Eddies and Their Environmental Effects. Front. Mar. Sci. 2023, 10, 1069897. [Google Scholar] [CrossRef]
  46. Pirro, A.; Fernando, H.J.S.; Wijesekera, H.W.; Jensen, T.G.; Centurioni, L.R.; Jinadasa, S.U.P. Eddies and Currents in the Bay of Bengal during Summer Monsoons. Deep Sea Res. II Top. Stud. Oceanogr. 2020, 172, 104728. [Google Scholar] [CrossRef]
  47. Ma, W.; Wang, Y.; Bai, Y.; Ma, X.; Yu, Y.; Zhang, Z.; Xi, J. Seasonal Variability in Chlorophyll and Air-Sea CO2 Flux in the Sri Lanka Dome: Hydrodynamic Implications. Remote Sens. 2022, 14, 3239. [Google Scholar] [CrossRef]
  48. Le, Z.; Subrahmanyam, M.V.; Raju, P.V.S.; Pathirana, G.; Wang, D.; Song, W. A Revisit of the Semi-Geostrophic Eddy East of the Sri Lanka Dome with Anisotropy Insight. Front. Mar. Sci. 2025, 11, 1504821. [Google Scholar] [CrossRef]
  49. Yang, X.; Xu, G.; Liu, Y.; Sun, W.; Xia, C.; Dong, C. Multi-Source Data Analysis of Mesoscale Eddies and Their Effects on Surface Chlorophyll in the Bay of Bengal. Remote Sens. 2020, 12, 3485. [Google Scholar] [CrossRef]
  50. Cui, W.; Yang, J.; Ma, Y. A Statistical Analysis of Mesoscale Eddies in the Bay of Bengal from 22–Year Altimetry Data. Acta Oceanol. Sin. 2016, 35, 16–27. [Google Scholar] [CrossRef]
  51. Wang, X.; Zhang, S.; Lin, X.; Qiu, B.; Gao, Y. Transformations between Normal and Abnormal Mesoscale Eddies in the Bay of Bengal. J. Phys. Oceanogr. 2025, 55, 257–275. [Google Scholar] [CrossRef]
  52. Shi, Y. Three-Dimensional Structures of Mesoscale Eddies in the Subtropical Countercurrent and Kuroshio Extension Regions and Their Vertical Normal Modes Analysis. J. Mar. Syst. 2025, 250, 104080. [Google Scholar] [CrossRef]
  53. Babu, M.T.; Kumar, P.S.; Rao, D.P. A Subsurface Cyclonic Eddy in the Bay of Bengal. J. Mar. Res. 1991, 49, 403–410. [Google Scholar] [CrossRef]
  54. Greaser, S.R.; Subrahmanyam, B.; Trott, C.B.; Roman-Stork, H.L. Interactions Between Mesoscale Eddies and Synoptic Oscillations in the Bay of Bengal During the Strong Monsoon of 2019. JGR Ocean. 2020, 125, e2020JC016772. [Google Scholar] [CrossRef]
  55. Liu, X. The Impact of Mesoscale and Submesoscale Physical Processes on Phytoplankton Biomass, Community Composition, and Carbon Dynamics in the Oligotrophic Ocean. Ph.D. Thesis, University of Southern California, Los Angeles, CA, USA, 2017. [Google Scholar]
  56. Gopalakrishna, V.V.; Murty, V.S.N.; Sengupta, D.; Shenoy, S.; Araligidad, N. Upper Ocean Stratification and Circulation in the Northern Bay of Bengal during Southwest Monsoon of 1991. Cont. Shelf Res. 2002, 22, 791–802. [Google Scholar] [CrossRef]
  57. Mandal, S.; Sil, S.; Pramanik, S.; Arunraj, K.S.; Jena, B.K. Characteristics and Evolution of a Coastal Mesoscale Eddy in the Western Bay of Bengal Monitored by High-Frequency Radars. Dyn. Atmos. Ocean. 2019, 88, 101107. [Google Scholar] [CrossRef]
  58. Boopathi, V.; Mohanty, S. Mesoscale Eddy Variability over the Bay of Bengal in Response to the Contrasting Phases of Extreme Indian Ocean Dipole Events. Reg. Stud. Mar. Sci. 2024, 77, 103604. [Google Scholar] [CrossRef]
  59. Ye, R.; Zhou, F.; Ma, X.; Shou, L.; Meng, Q.; Zeng, D.; Liu, C.; Tian, D.; Zhou, B.; Lin, F.; et al. An Energetic Mesoscale Anticyclonic Eddy in the Southern Bay of Bengal in June 2020: A Case Study. JGR Ocean. 2023, 128, e2022JC019188. [Google Scholar] [CrossRef]
  60. Mahadevan, A. The Impact of Submesoscale Physics on Primary Productivity of Plankton. Annu. Rev. Mar. Sci. 2016, 8, 161–184. [Google Scholar] [CrossRef]
  61. Callies, J.; Ferrari, R. Interpreting Energy and Tracer Spectra of Upper-Ocean Turbulence in the Submesoscale Range (1–200 km). J. Phys. Oceanogr. 2013, 43, 2456–2474. [Google Scholar] [CrossRef]
  62. Mahadevan, A.; Jaeger, G.S.; Freilich, M.; Omand, M.M.; Shroyer, E.L.; Sengupta, D. Freshwater in the Bay of Bengal: Its Fate and Role in Air-Sea Heat Exchange. Oceanography 2016, 29, 72–81. [Google Scholar] [CrossRef]
  63. Dong, C.; Liu, L.; Nencioli, F.; Bethel, B.J.; Liu, Y.; Xu, G.; Ma, J.; Ji, J.; Sun, W.; Shan, H.; et al. The Near-Global Ocean Mesoscale Eddy Atmospheric-Oceanic-Biological Interaction Observational Dataset. Sci. Data 2022, 9, 436. [Google Scholar] [CrossRef]
  64. Godø, O.R.; Samuelsen, A.; Macaulay, G.J.; Patel, R.; Hjøllo, S.S.; Horne, J.; Kaartvedt, S.; Johannessen, J.A. Mesoscale Eddies Are Oases for Higher Trophic Marine Life. PLoS ONE 2012, 7, e30161. [Google Scholar] [CrossRef]
  65. Falkowski, P.G.; Ziemann, D.; Kolber, Z.; Bienfang, P.K. Role of Eddy Pumping in Enhancing Primary Production in the Ocean. Nature 1991, 352, 55–58. [Google Scholar] [CrossRef]
  66. Singh, A.; Gandhi, N.; Ramesh, R.; Prakash, S. Role of Cyclonic Eddy in Enhancing Primary and New Production in the Bay of Bengal. J. Sea Res. 2015, 97, 5–13. [Google Scholar] [CrossRef]
  67. Paul, N.; Sukhatme, J.; Sengupta, D.; Gayen, B. Eddy Induced Trapping and Homogenization of Freshwater in the Bay of Bengal. JGR Ocean. 2021, 126, e2021JC017180. [Google Scholar] [CrossRef]
  68. Vidya, P.J.; Kumar, S.P. Role of Mesoscale Eddies on the Variability of Biogenic Flux in the Northern and Central Bay of Bengal: Eddy Biogenic Flux in the Bay of Bengal. J. Geophys. Res. Ocean. 2013, 118, 5760–5771. [Google Scholar] [CrossRef]
  69. Sarangi, R.K. Impact of Cyclones on the Bay of Bengal Chlorophyll Variability Using Remote Sensing Satellites. Indian J. Mar. Sci. 2011, 40, 794. [Google Scholar]
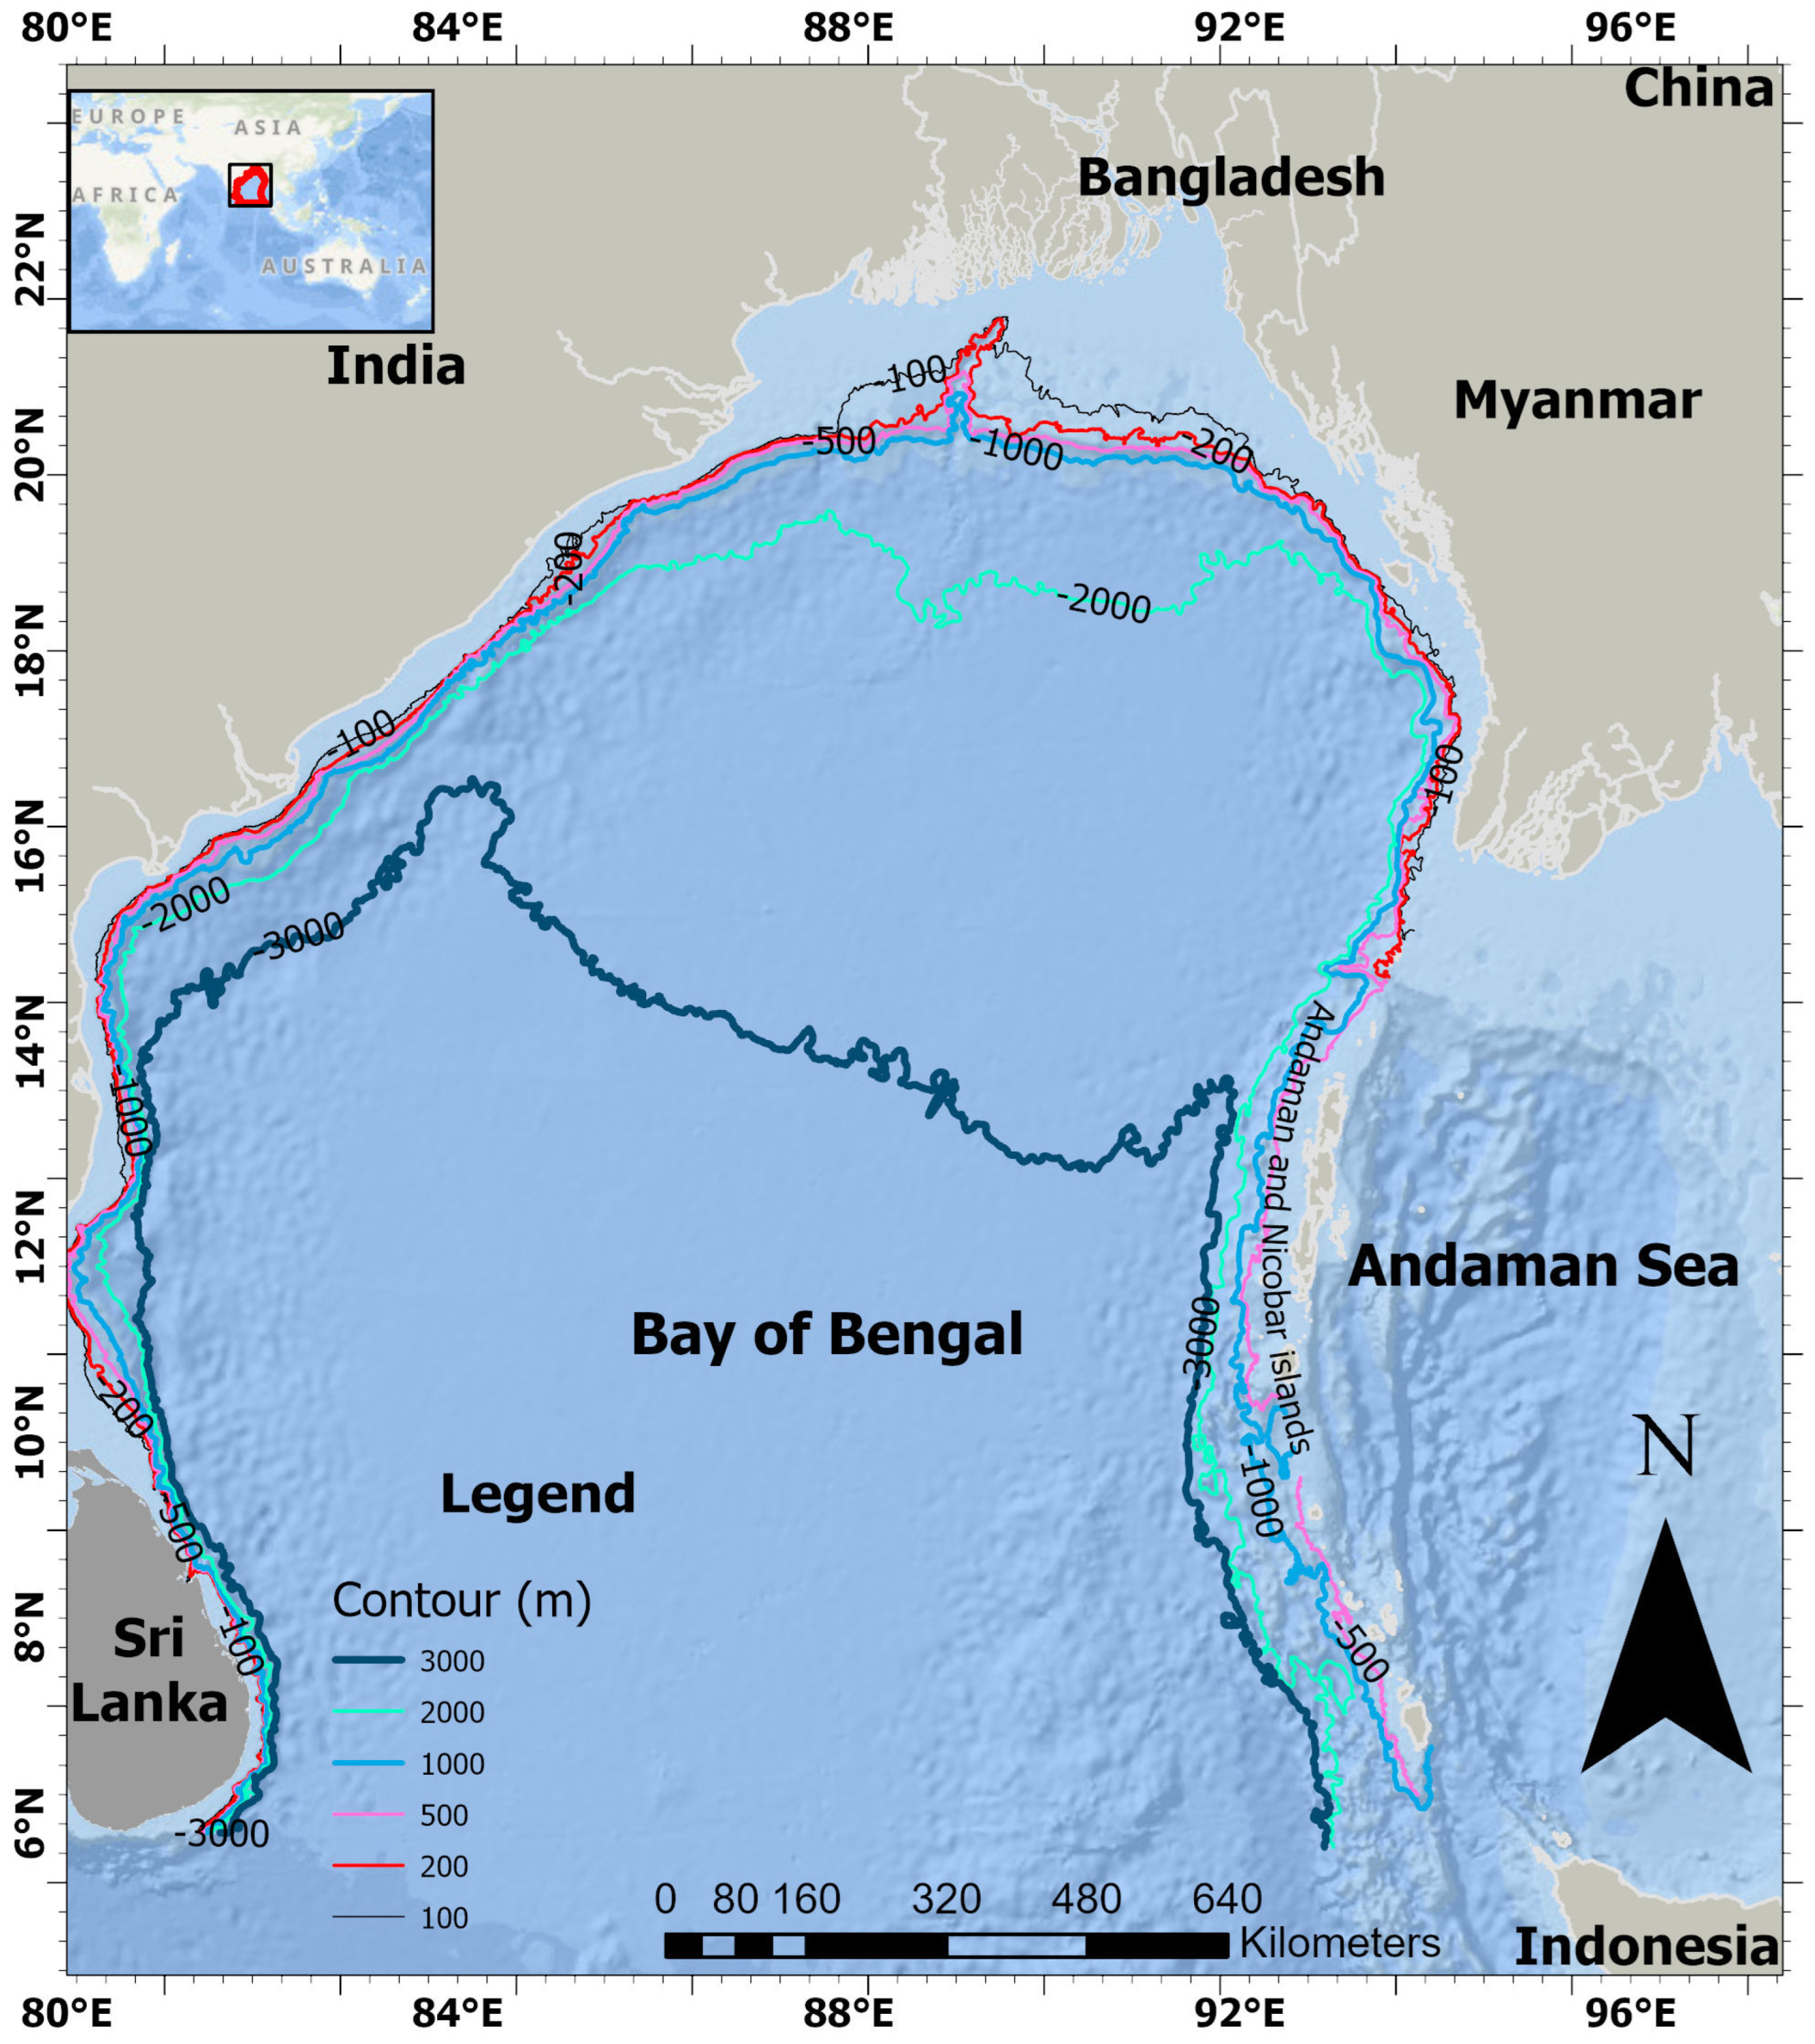
Figure 1. Study area: Map of the study area in the Bay of Bengal, including the surrounding countries: India and Sri Lanka (west), Bangladesh (north), Myanmar, and the northern Malay Peninsula (east). The study domain spans from 0° N to 23° N latitude and 80° E to 100° E longitude. The red line in the inset map indicates the spatial boundary of the study area used in this analysis. Bathymetric contours at 100 m, 200 m, 500 m, 1000 m, 2000 m, and 3000 m are shown to represent regional bottom topography.
Oceans 06 00052 g001
Figure 2. Distribution of mesoscale eddies in the Bay of Bengal: (A) frequency of anticyclonic eddies, (B) frequency of cyclonic eddies, (C) compilation of all eddies, and (D) ratio of cyclonic to anticyclonic eddies. Panels (AC) share the same color bar.
Oceans 06 00052 g002
Figure 3. Tracks of mesoscale eddies with varying lifespans. Subplots (AF) correspond to eddies lasting from 1 week to 2 weeks and 5 or more weeks, encompassing both cyclonic and anticyclonic types.
Oceans 06 00052 g003
Figure 4. Birth frequencies of cyclonic (A) and anticyclonic eddies (B). The color bar is on a log scale.
Oceans 06 00052 g004
Figure 5. Eddy characteristics observed from the BoB, including (A) lifetime histogram of anticyclonic and cyclonic eddies, (B) cumulative number of eddies by year, (C) ratio of cyclonic to anticyclonic eddies by eddy lifetime, and (D) cumulative ratio of cyclonic to anticyclonic eddies by eddy lifetime. “Number of eddies by year” shows the yearly count, while the “Cumulative number of eddies by year” shows the total count from the starting year up to each subsequent year.
Oceans 06 00052 g005
Figure 6. Results from eddy propagation analysis: (A) number of eddies by year, (B) cumulative number of eddies by year, (C) ratio of cyclonic to anticyclonic eddies, and (D) cumulative ratio of cyclonic to anticyclonic eddies.
Oceans 06 00052 g006
Figure 7. Mesoscale eddy characteristics: parameter histograms. The first column (A1A3) focuses on the amplitude of eddies in centimeters. The top plot (A1) presents the cumulative percent distribution of the amplitude values. The middle plot (A2) displays the histogram showing the percentage of observations for different amplitude values. Anticyclonic eddies are represented in red, and cyclonic eddies are represented in blue. Bottom plot (A3) shows the ratio of the percentage of cyclonic to anticyclonic observations across different amplitude values. This ratio plot highlights the relative frequency of cyclonic versus anticyclonic eddies at each amplitude level. The second column (B1B3) indicates the speed radius in km. The speed radius, also known as the eddies’ radius Rmax, is the radius of the best-fit circle that matches the contour of the maximum circum-average geostrophic speed of the eddy. The top plot (B1) displays the percentage of observations for different speed radius values. The middle plot (B2) shows the cumulative percent distribution of the speed radius. Bottom plot (B3) presents the ratio of cyclonic to anticyclonic observations for different speed radius values. The third column (C1C3) shows the average speed in centimeters per second. The top plot (C1) displays the percentage of observations for different average speed values. The middle plot (C2) shows the cumulative percent distribution of the average speed. Bottom plot (C3) presents the ratio of cyclonic to anticyclonic observations for different average speed values.
Oceans 06 00052 g007
Figure 8. Monsoon-dominated seasonal surface geostrophic current (ms−1) distribution in the BoB: (A) pre-monsoon season (March to May), (B) southwest monsoon season (June to September), and (C) northeast monsoon season (October to December).
Oceans 06 00052 g008
Figure 9. Spatial and temporal variability of mesoscale dynamics in the Bay of Bengal. (AC) Spatial distribution of (A) mean eddy kinetic energy (EKE; m2/s2), (B) mean vorticity (1/s), and (C) mean strain rate (1/s), derived from sea level anomaly (SLA) data. High EKE and strain rates are observed along the western boundary and northern bay, indicating regions of intense eddy activity and horizontal shear. (DF) Corresponding time series for (D) EKE, (E) vorticity, and (F) strain rate reveal strong seasonal variability, with peaks in EKE and strain during pre-monsoon (May–June) and post-monsoon (November–December) periods, highlighting the role of monsoonal forcing in modulating mesoscale processes.
Oceans 06 00052 g009
Disclaimer/Publisher’s Note: The statements, opinions and data contained in all publications are solely those of the individual author(s) and contributor(s) and not of MDPI and/or the editor(s). MDPI and/or the editor(s) disclaim responsibility for any injury to people or property resulting from any ideas, methods, instructions or products referred to in the content.