Article

Using Colour as a Marker for Coral ‘Health’: A Study on Hyperspectral Reflectance and Fluorescence Imaging of Thermally Induced Coral Bleaching

1
Interface Analysis Centre (IAC), HH Wills Physics Laboratory, Bristol University, Bristol BS8 1TL, UK
2
Sealife London Aquarium, London SE1 7PB, UK
3
College of Life and Environmental Sciences, University of Exeter, Exeter EX4 4QD, UK
*
Author to whom correspondence should be addressed.
Oceans 2022, 3(4), 547-556; https://doi.org/10.3390/oceans3040036
Submission received: 27 September 2022 / Accepted: 15 November 2022 / Published: 29 November 2022

Abstract

:
Rising oceanic temperatures create more frequent coral bleaching events worldwide and as such there exists a need for rapid, non-destructive survey techniques to gather greater and higher definition information than that offered by traditional spectral based monitoring systems. Here, we examine thermally induced laboratory bleaching of Montipora capricornis and Montipora confusa samples, utilising hyperspectral data to gain an understanding of coral bleaching from a spectral standpoint. The data revealed several characteristic spectral peaks that can be used to make health determinations. The fluorescence peaks are attributed to fluorescent proteins (FPs) and Chlorophyll-a fluorescence. The reflectance peaks can be attributed to Chlorophyll absorption and accessory pigments such as Peridinin and Diadinoxanthin. Each characteristic spectral peak or ‘marker’ allows for observation of each aspect of coral health and hence, simultaneous monitoring of these markers using hyperspectral imaging techniques provides an opportunity to better understand the processes occurring during bleaching and the rates at which they occur relative to one another.

1. Introduction

One major effect of anthropogenic climate change is increasing sea surface temperatures, which are causing coral bleaching to become more prevalent [1] as corals are unable to adapt to these new elevated temperatures. Due to the limited sensitivity and spectral range of simple optics (human eye, RGB imagers), the use of coral colour in traditional observational survey methods is limited [2]. The effects of coral bleaching are only obviously observed at a stage where it is almost complete: typically corresponding to a >70% reduction in symbiont density [3] and therefore too late to attempt any mitigative responses [2]. Detecting the onset of bleaching earlier therefore requires a more advanced analytical approach such as hyperspectral imaging. An imaging technique which breaks the captured incident light into its component wavelengths, providing a measure of photon intensity across a span of discrete wavelength bands. The benefits of detecting early are that (i) coral samples can be collected for later re-seeding of the colony, (ii) mitigative responses could be implemented to reduce coral decline and (iii) warnings can be disseminated to local fisheries of a potential decline in fish stocks caused by an impending bleaching event.
In the phylum Cnidaria to which coral belong, the Symbiodiniaceae cells are endosymbiotic (intracellular); in both hard and soft corals they are contained within the endoderm bound by membranes which form a vacuolar compartment, the symbiosome [4]. The distribution of the different genus of Symbiodiniaceae within corals are often host specific and mutualistic [5]. However, host cnidarians can choose to expel any number of symbiont cells and take up new ones from the surrounding environment. The trigger for this ‘switch’ or ‘shuffle’ of Symbiodiniaceae and concentrations, is often linked to a response or acclimatization to new environmental conditions [6]. These shuffles of Symbiodiniaceae communities are mostly recorded in studies looking at clade composition before and after bleaching or disease episodes [5,6]. The Symbiodiniaceae clade compositions within coral communities, which play a hugely important role in the bleaching process, are complex with only genetic studies being able to distinguish the subtle differences in clade [7,8]. Each clade presents with apparent differing properties, for example Durusdinium (formerly Clade D) is reported to have a higher thermal tolerance than that of the typically dominant Cladocopium (formerly Clade C) [9].
Bleaching refers to the loss of colour in symbioses between Symbiodiniaceae and marine benthic animals, this is not restricted to corals but displayed by all organisms with similar symbioses. Symbiodiniaceae not only provide corals with energy but also their colour, as they contain Chlorophyll (Chl-a and Chl-c) as well as accessory pigments such as Peridinin and Diadinoxanthin which give the cells their brownish colouration and by association, provide their translucent host with colour too [4]. Studies previously conducted on Chl-a fluorescence in marine organisms [10], described the emission at 685 nm (under 440 nm excitation) as a typical photosystem II (Chl-a) fluorescence signature. Using this emission allows us to directly observe the relative number of symbiotic Symbiodiniaceae partner cells living within a coral body, and thus provides an insight into the corals current photosynthetic capability [11].
Corals contain fluorescent proteins (FPs) which are bountiful within shallow reef building corals and are major determinants of the colour diversity accounting for nearly every visible coral colour, other than the brown of the photosynthetic pigments of algal symbionts [12]. While the biological function of FP’s is not certain or universally accepted, theories suggest they act in a protective role from providing a sun screening effect [13] or acting as antioxidants as part of a host stress response action [14]. However, within the literature [11,15,16] it is generally agreed that FP’s are highly responsive to changes in heat and as they exhibit distinct spectra they are an ideal marker when present. It should be noted however, that spectrally visible FPs do not occur in all corals and as such they are not a universal marker but when present they can be exploited. With such broad functional activity, the presence of FPs can potentially be exploited as a proxy for measuring coral health [17]. Therefore, fluorescence could provide a method for indexing coral spectra against health, natural variance and diseased vs. non diseased states [17]. Barott et al. [18] highlights previous work that suggests that corals undergoing bleaching have variable pigment profiles directly linked to the loss of symbiotic Symbiodiniaceae [19], furthermore this can provide an indication of the chances of coral mortality/survivability [20]. Coupled with Chlorophyll fluorescence, markers such as green fluorescent protein (GFP) could help to provide a snapshot of the relative health of the relationship between corals and their symbiotic partners.
In order to image and monitor corals undergoing the bleaching process, thermally induced bleaching under controlled laboratory conditions was used to stress a suite of coral samples. Bleaching was monitored by plotting the changes in the spectral profile of the coral, which changes as the Symbiodiniaceae is progressively expelled, exposing the bright white calcium carbonate exoskeleton of the coral once expulsion is complete. In a previous study [17] fluorescence signals of corals were recorded and quantified using hyperspectral imaging, demonstrating that characteristic fluorescence of Chlorophyll contained within the Symbiodiniaceae could be excited by deep blue (440 nm) and near UV (405 nm) light sources. Here, we take this work further to relate the bleaching process and the associated changes in reflectance and fluorescence signals at specific wavelength markers associated with key coral processes.
Among the numerous studies into coral ‘health’ and how to monitor/assess it, a single definition of ‘health’ is not universally accepted. Here, we define health as the amount of reflectance present at the following markers: 454 nm, 607 nm (Peridinin, Diadinoxanthin), 676 nm (Chlorophyll-a absorption) and fluorescence present at the following markers: 511–585 nm (GFPs) and 685 nm (Chlorophyll). Using a combination of these fingerprint markers we can gain a non-invasive understanding of the health of a coral system.

2. Materials and Methods

Coral samples were obtained from Sealife London Aquarium, where they were cultured and fragmented from larger colonies and mounted on plugs. Coral species were selected based on the availability by the aquarium. In experiment one, 18 fragments (C1–18) of Montipora capricornis (MCAP) were used and in experiment two 12 fragments (C1–12) of Montipora confusa (MCON) were used.
The coral fragments were split into 3 equal groups: the 1st group underwent a bleaching treatment (experimental group), the 2nd group remained in a control tank and the 3rd group was the pretreatment group, where cells were counted prior to treatment. All the experiments followed the same temperature regime and was as follows, with day 0 corresponding to 24 °C, days 1–7 to 26 °C, days 8–14 to 28 °C and finally days 15–22 to 30 °C. In experiment 1, hyperspectral data was gathered at the start and end of the first 2 weeks as well as an additional collection in the middle of week 2. Imaging was conducted every day in the final week, until the samples bleached after a total of 17 days, at which point the experiment was concluded. To better capture the initiation point of the bleaching process, the rate of imaging was increased to daily rather than incrementally through the week in experiment 2.
The laboratory system was designed to provide reproducible temperature treatments under recirculating conditions for a variety of scleractinian corals. The system consisted of two tanks (Aqua One NanoReef 35 L Aquarium L33 × W33 × H33 cm) fitted with integrated life systems, (Mariglow 15 W LED light unit, NanoSkin 40 skimmer, a 55 W glass heater and 200 L/h pump, filter medial; sintered glass and sponge). The temperature was maintained by the 55 W glass heater and was monitored by 2 independent digital thermometers (RisePRO) with a resolution of 0.1 °C, placed at the top and bottom of the tank. The system was filled with artificial seawater mixed from treated tap water and Aqua One Reef Synthetic Salt (Ratio 1 kg to 25 L), salinity was maintained at 30 ppt. Corals in both the experiment tank and control tank were fed once a week with Coral Fusion plankton powder (Aqua core). One tank acted as the ‘control’ with optimal temperature conditions maintained at a constant 24 °C, while the second tank experienced temperatures that were increased incrementally in 1-week intervals (at 2 °C increments) to allow time for the coral to acclimatize without inducing death. This also allowed for a better understanding to be built of the gradual changes occurring during bleaching events. The coral was imaged using a hyperspectral camera, outlined below, three times per week for control samples whilst held at 24–28 °C; the typical temperature range of coral. For samples held at 30 °C, the ‘typical’ bleaching temperature, imaging was undertaken on a daily basis.
Corals samples were imaged using a typical push-broom type hyperspectral camera (Nano, Headwall, Boston, MA, USA) which collected and processed information from 270 spectral bands across a broad region of the electromagnetic spectrum centered on the visible (400–1000 nm). The Headwall imager is a line scanner, where data is gathered in 2 dimensions (Y,λ)) and so requires translation to capture the third dimension (X)), this was achieved using a motorised rotational stage (360° stepper motor). The experimental setup is depicted graphically in Figure 1. Coral samples were imaged in two light conditions (from 40 cm away), under white and blue light (spectra outlined in [17]). Under white light illumination, the coral’s colour pigments could be monitored and under blue lighting other accessory pigments (FP’s and Chlorophyll fluorescence) could be observed. The hyperspectral data collected by the headwall camera was compiled into a 3 dimensional dataset (X,Y,λ) or ‘hypercube’ and loaded in to ENVI (ENVI 5.5, Harris Geospatial), where areas of interest could be pinpointed. This enabled the emission of the coral reflectance and fluorescence to be observed and quantified by averaging multiple data points on the hypercube and associating a spectra with it.
Statistical comparisons made between wavelength intensity, were conducted using a repeated measures ANOVA test (rANOVA). This is an extension of the ANOVA test; which is the qualitative independent variable or repeated measure factor is a within-subjects factor and the variable by which sample are measured is the dependent variable. The within-subjects factor in this instance is the treatment the samples are exposed to, for example the temperature and control treatment groups and the dependent variable in these experiments is time. The rANOVA assumes the following conditions: normality of residuals or error by time point and data sphericity and the variances of the differences between all combinations of the related conditions or time points are equal. The wavelength data was found to violate the assumption of sphericity and therefore, a Greenhouse–Geisser correction was used to adjust the degrees of freedom (df) and F value accordingly. The results of both types of ANOVA are displayed as (F (1.665, 6.658) = 7.075, p = 0.025). Where the F (1.665, 6.658) signifies the degrees of freedom (df) of the variable group followed by the df of its error. The F value (7.075) is a ratio between the two square means of the comparison datasets. The p value represents the significance of the F value and is considered significant if the value is below the 0.05 threshold used to give 95% confidence.

3. Results

3.1. Reflectance Spectra

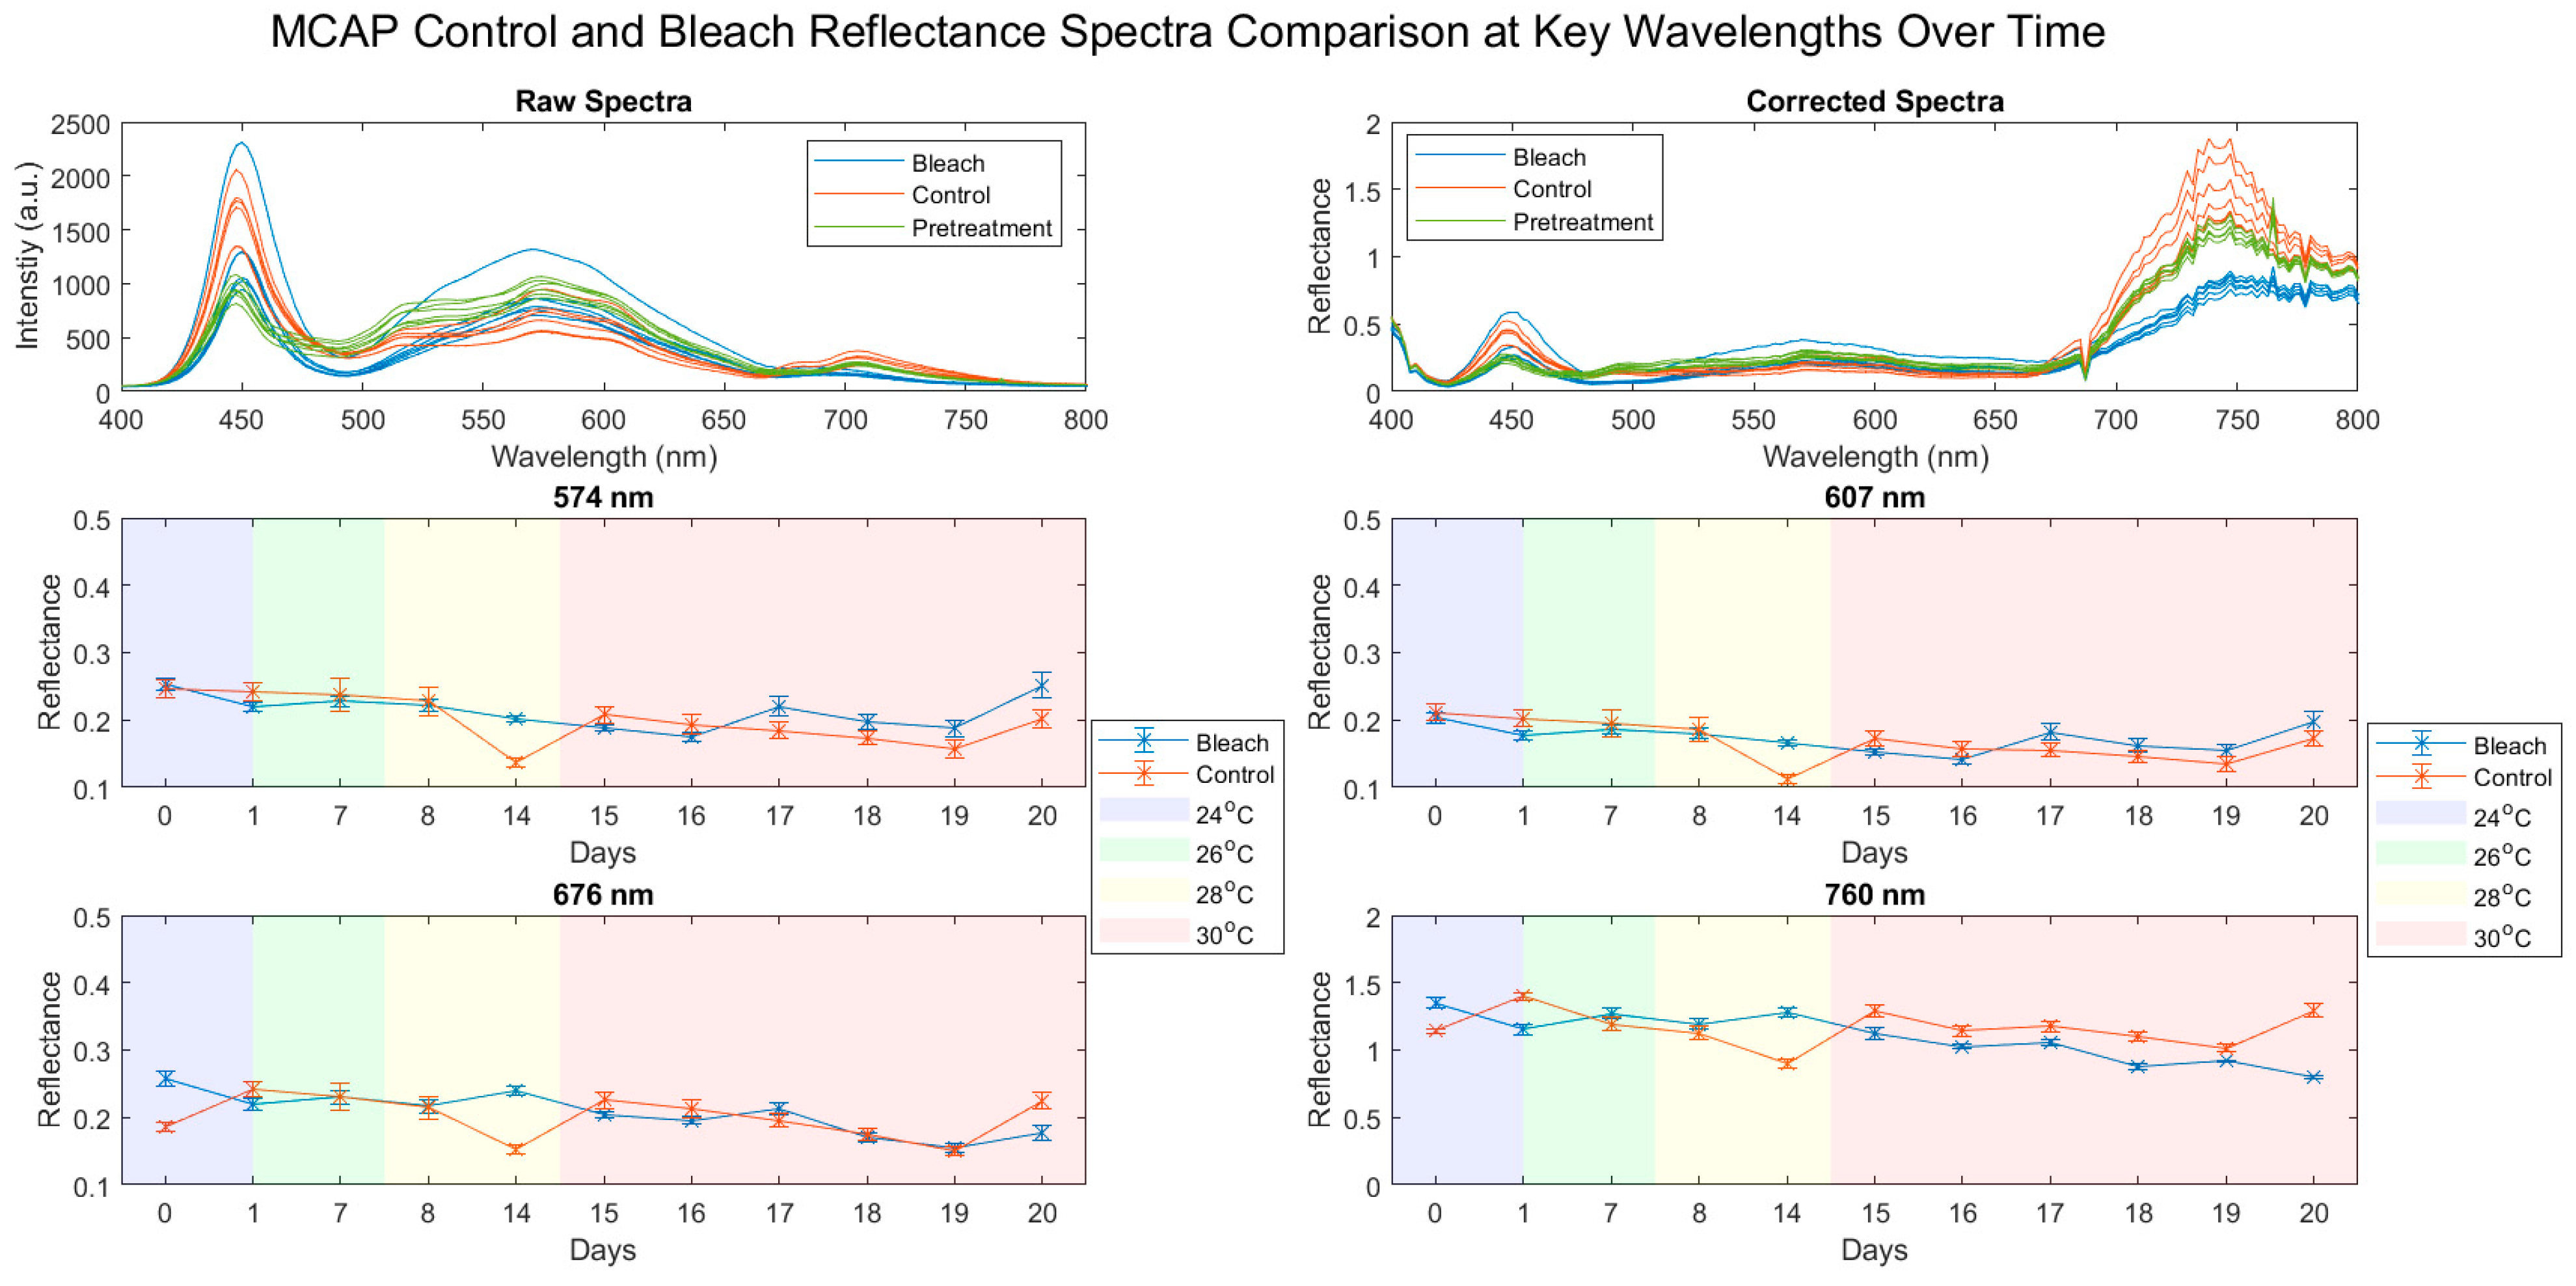
The raw and corrected reflectance spectra of the final data collections of each sample arranged by treatment group (Figure 2 and Figure 3) show the differences observed in the profile of the coral spectral signal at each stage in the treatment process. As shown in the data (Figure 2 and Figure 3), the peaks at 450 nm & 500–600 nm are removed from the raw to corrected spectra, these peaks represent the emission peaks of the light source used.
Reflectance measurements of wavelengths associated with the key pigments Peridinin and Diadinoxanthin (574 nm and 607 nm) (Figure 2 and Figure 3), were compared statistically using a rANOVA test. The interaction between time and treatment was found to be significant in the Peridinin measurements in all experiments (F(3.422, 34.225) = 4.666, p = 0.006) and (F(1.467,8.802) = 6.173, p = 0.027). This same trend was also observed in the Diadinoxanthin data (p= < 0.008).
The Chl-a absorption (676 nm) (Figure 2 and Figure 3) response, was similar to that of Peridinin and Diadinoxanthin signals with a significant effect observed in the interaction between time and treatment across all experiments (p= < 0.001). The same interaction was found to be significant in the Cyanobacteria and Chl oxygen absorption band signal (760 nm) in all experiments (p= < 0.001). The factor of time was found to be significant across all experiments and wavelengths.

3.2. Fluorescence Spectra

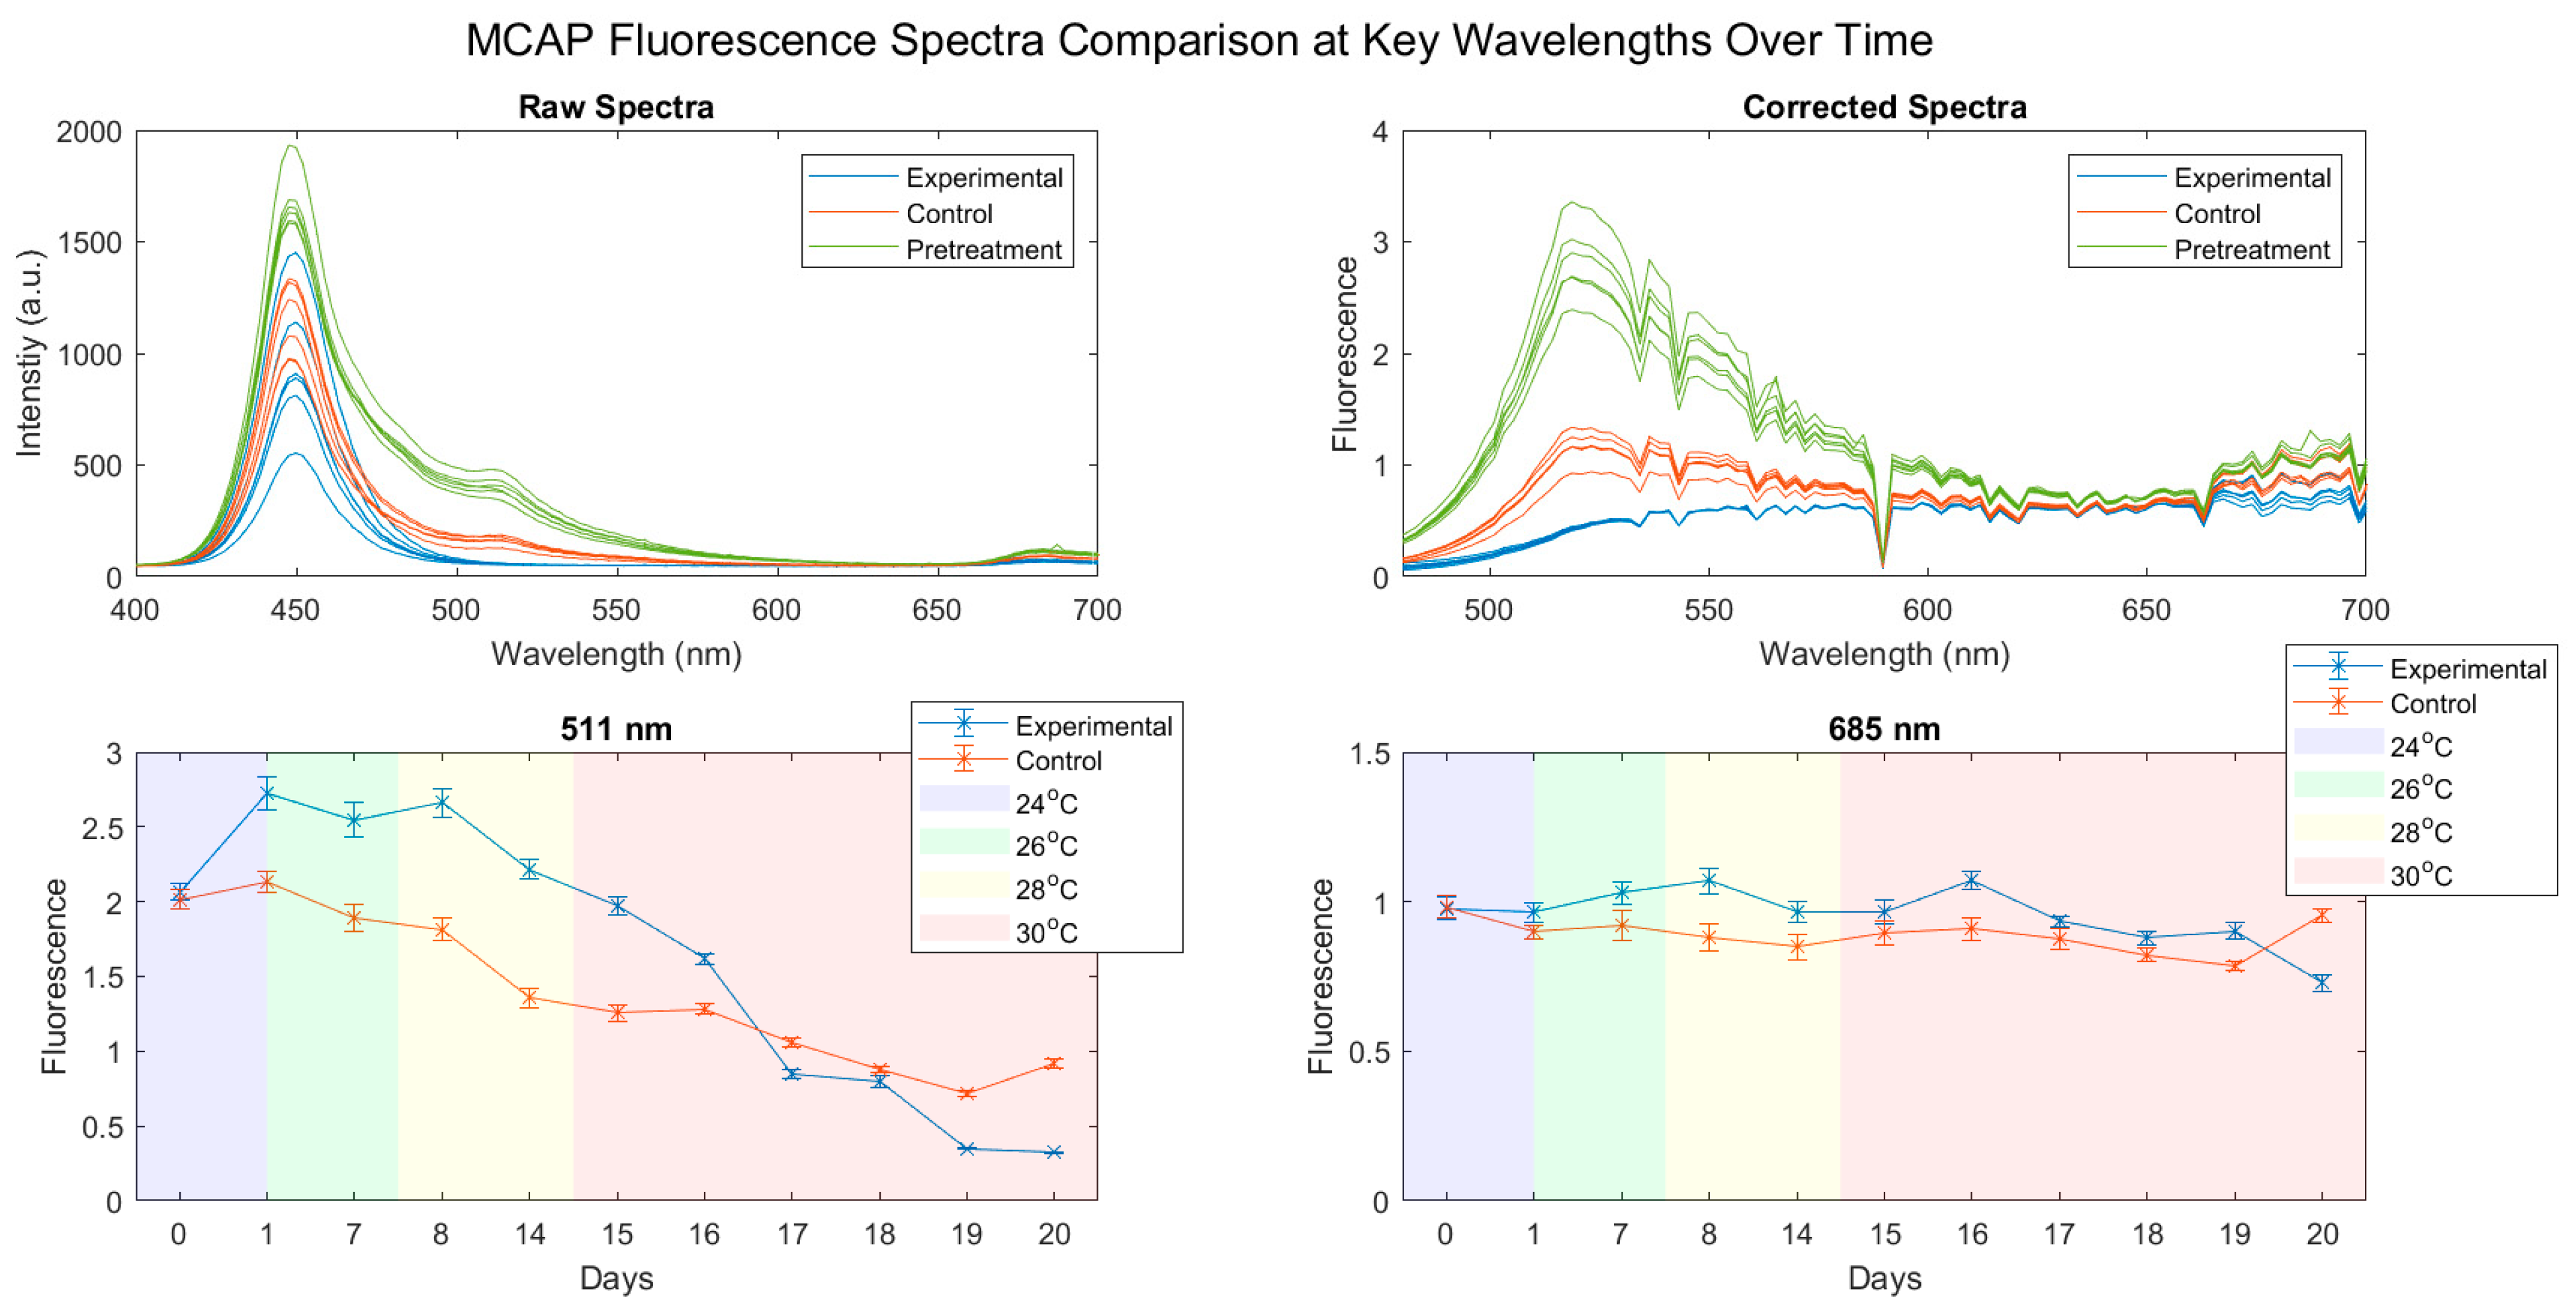
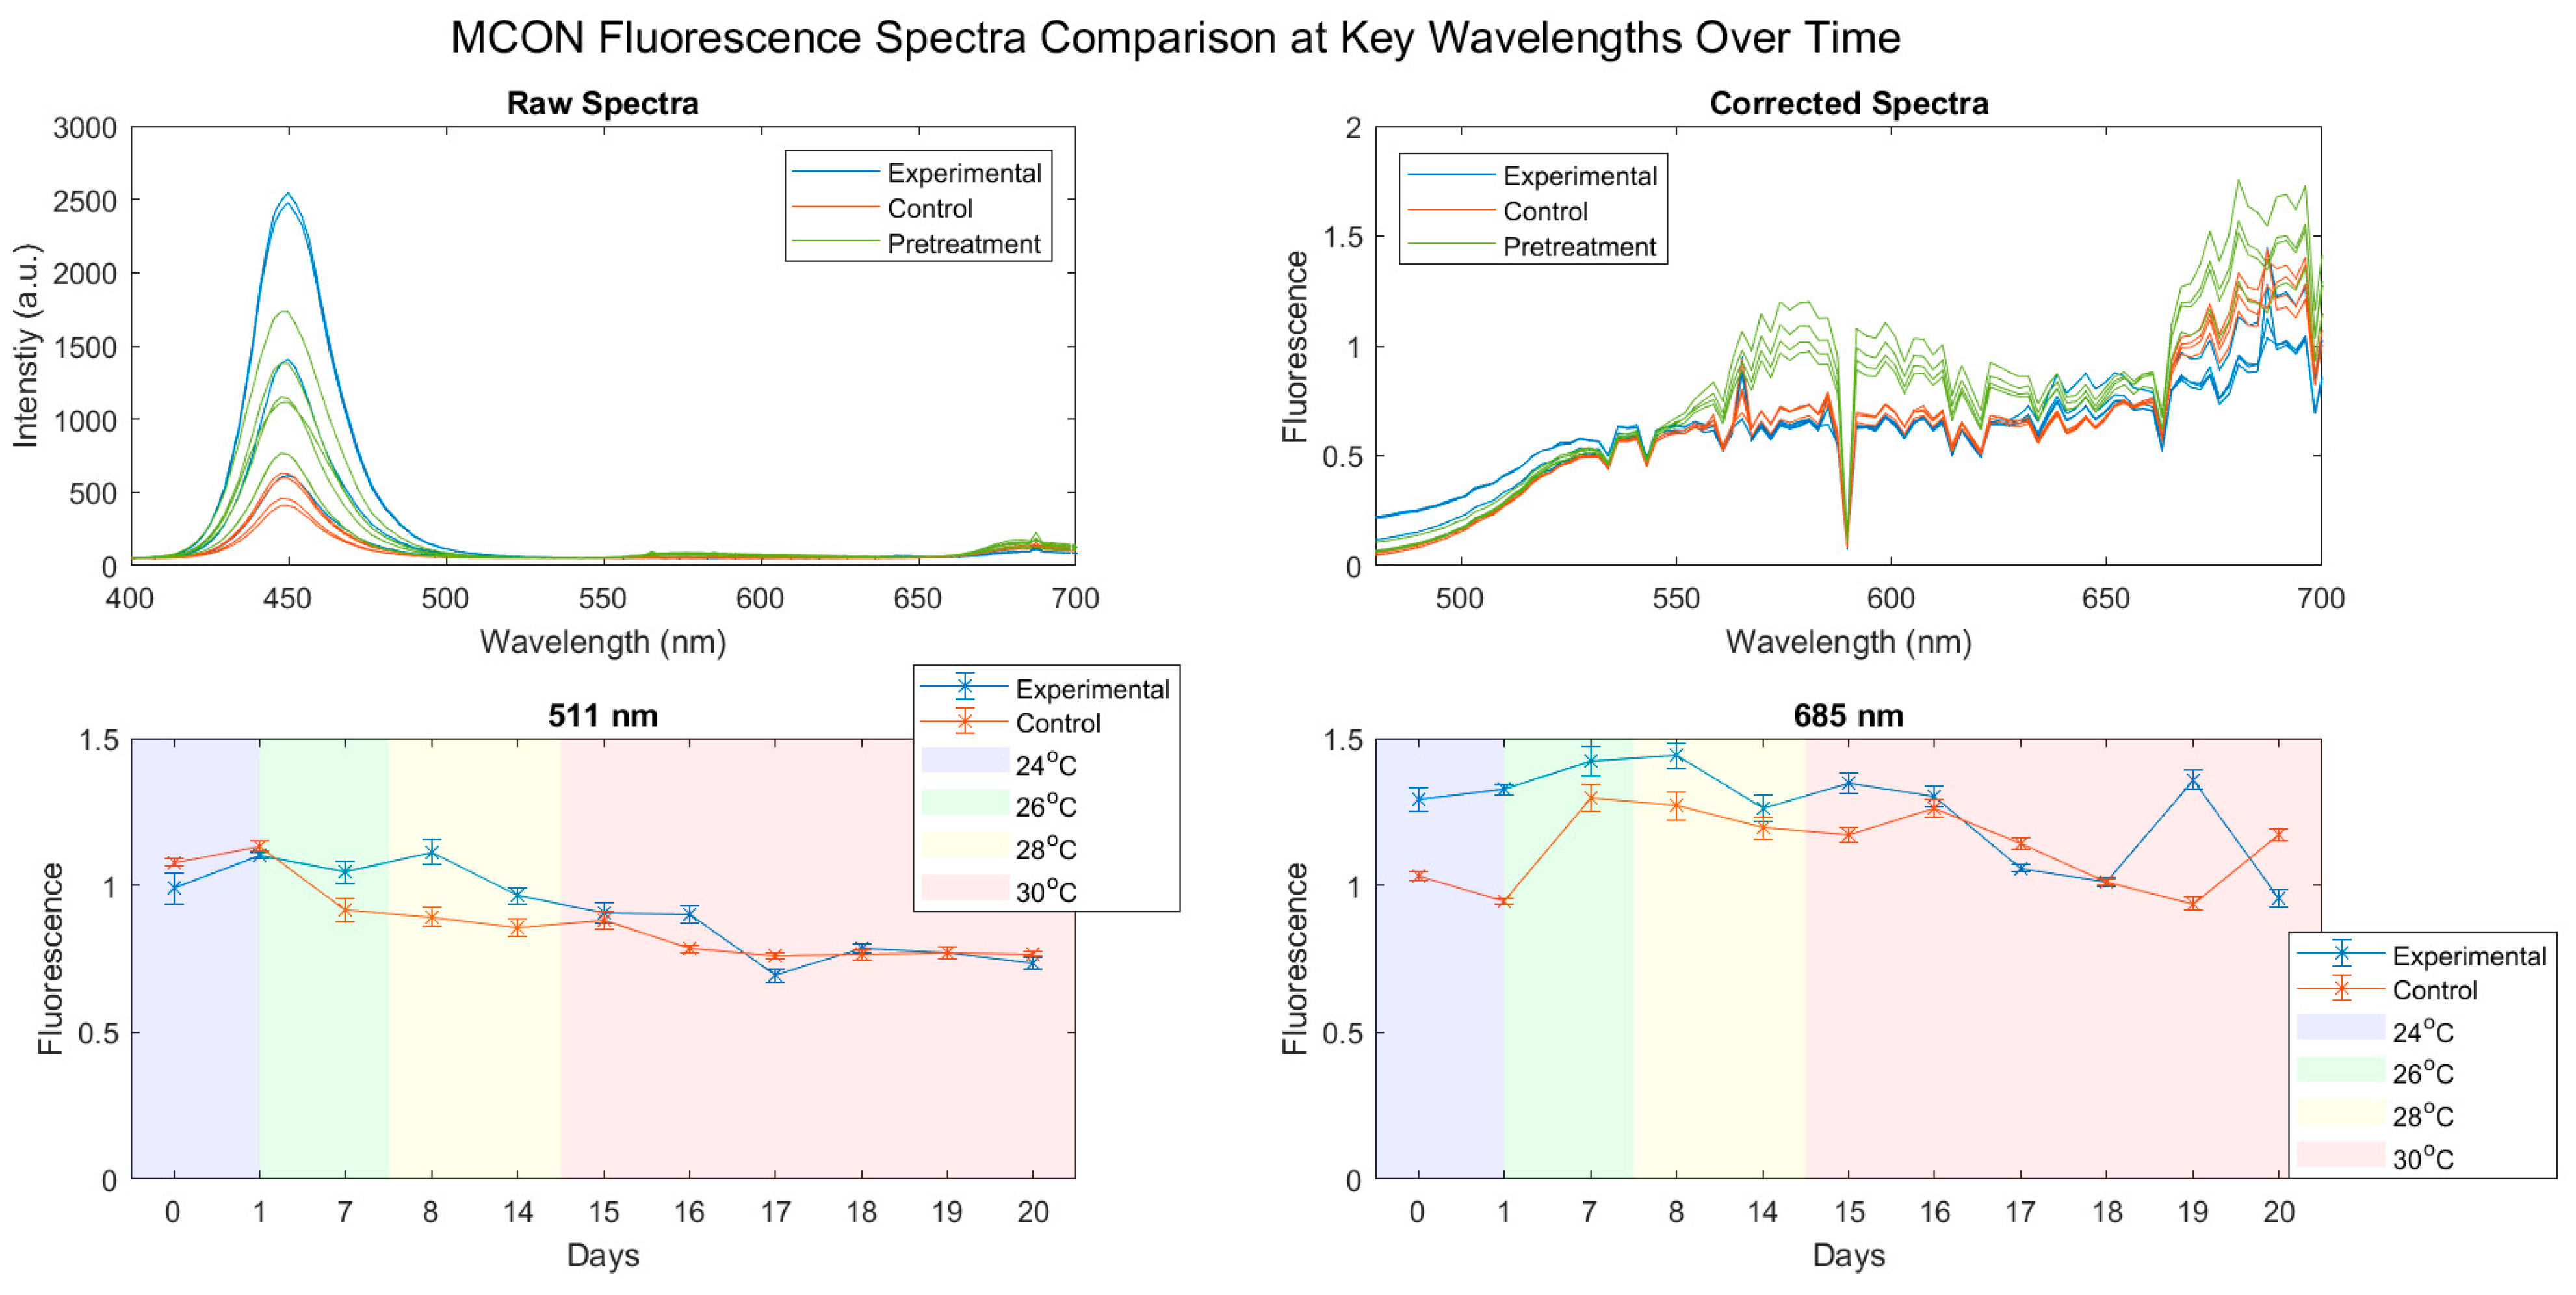
The raw and corrected fluorescence spectra of the coral samples arranged by treatment group (Figure 4 and Figure 5), show the differences observed in the profile of the coral spectral signal at each stage in the treatment process. As shown in the data (Figure 4 and Figure 5) the peak at 450 nm was removed, which corresponds to the emission peak of the UV light source used.
In the GFP and Chl fluorescence signals (Figure 4 and Figure 5), a reduction in signal across both groups over the course of the experiment was observed. The effect of the interaction between treatment and time was found to not be significant in GFP signal across all experiments except in experiment 1, where the effect was significant (F(2.749, 27.486) = 30.28, p = 0.0001). The response of Chl fluorescence was found to be significant in all experiment (p = 0.001). The factor of time was found to be significant across all experiments and wavelengths.

4. Discussion

These experiments showed that bleaching via thermal stress had differing effects on the intensity of the marker wavelengths associated with key pigments. In this study, reflectance measurements found that there was a significant difference in signal at 574 nm, 607 nm and 676 nm between the treatment groups, indicating the potential of these pigments to be used as coral health indicators. The presented data also helps to validate previous studies that indicate that reflectance spectra of ‘healthy’ corals vs. bleaching or bleached corals are spectrally distinct [21].
In fluorescence measurements, GFP signal declined in all experiments, this is in line with previously reported echinoderm studies where GFPs have been stated to be highly reactive in response to stressors [11,20,22,23]. One such study observed rapid reductions, thought to be as a result of GFPs acting in an antioxidant role leading to its depletion in times of stress [11]. However, in this study the effects of thermal stress on GFPs were only found to be significant in experiment 2. This indicates the corals were stressed to an extent, where the expulsion of GFPs occurred irrespective of temperature treatment.

5. Conclusions

This study showed that the use of hyperspectral imaging is a viable technique for assessing coral health using marker wavelengths associated with key pigments found within corals and their symbionts. This builds on established research [21] that the spectra of corals differ based on their bleaching state and these states can be distinguished using spectroscopic techniques.
The wavelength markers chosen represent key processes or parts of the coral, as shown in this study they respond to thermal stress in varying ways. The responses of the wavelengths associated with pigments found within coral symbionts, Peridinin, Diadinoxanthin and Chlorophyll [24,25], were found to be strongly linked in all experiments. The signal at 676 nm is particularly important as it corresponds to the photosynthetic efficiency of the symbionts [26]. Previous studies [27,28,29] have used this signal and the use of colour to inform tools for looking at corals in situ. The limitations of this previous work is that comparing colours by eye or indeed RGB imaging is a subjective measurement [28], which is improved by spectroscopic techniques which remove the subjectivity. A number of further studies [19,30,31] used spectral reflectance signals to infer Chlorophyll pigment content and as such, this work builds on the idea outlined from these studies that spectral signals are able to be correlated to pigment density.
As highlighted by the literature [11,13,14,32,33], FPs play a crucial role in the bleaching response within coral tissues from the ‘sun screening’ effect, to wavelength conversion and total absorption of wavelengths. As corals are subject to high levels of background solar radiation they have developed various defensive mechanisms to combat potentially damaging incidences of solar radiation [34], the so called ‘sunscreen’ effect. FPs have been found to be photoprotective by scattering and reflecting light [13]. It is thought that this process works by dissipating energy at wavelengths of low photosynthetic activity (500–600 nm), as well as reflecting visible and infrared light by chromatophores within the FP’s [13]. As corals undergo bleaching, these natural defences begin to breakdown as the symbiont’s photoprotective FPs are expelled.
Symbiodiniaceae clade compositions within coral communities also play a hugely important role in the bleaching process, as illustrated in the experiments with wavelengths associated with pigments contained within the symbionts (Chl, Peridinin, Diadinoxanthin). The measurement of wavelengths associated with these pigments gave a direct insight into the presence and condition of the Symbiodiniaceae, which in turn indicated the status of the bleaching process. When considering the use of spectral measurements in the field, the data presented herein highlights the use of reflectance markers as the more appropriate bleaching indicator over fluorescent ones. This is because reflectance imaging can reveal physiological information required to make assessments without the need for fluorescence measurements as well. However, as shown in the fluorescence data, GFP specifically is a highly reactive marker to understanding physiological condition [14] but imaging within the marine environment on live reefs adds substantial further complications to the imaging process.
The demonstrated technique of using spectral markers as indicators of health is not strictly limited to coral assessments, it could be used to make assessments for any marine organism that features shifts in colour as a factor of stress. Additional research would need to be conducted on establishing how colour loss is affected by stressors but the principle of the technique remains near identical. It is hoped this technique will be more widely implemented as an analytical tool for underpinning non-invasive assessments of marine organisms using hyperspectral imagery.

Supplementary Materials

The following supporting information can be downloaded at: https://www.mdpi.com/article/10.3390/oceans3040036/s1.

Author Contributions

Conceptualization, J.T.; Methodology, J.T.; Hyperspectral equipment, J.C.C.D.; Data/analysis, J.T; Coral samples, J.W.; Review and editing, D.A.M.-S., T.B.S., M.J.A., J.C.C.D.; Supervision, T.B.S. and J.C.C.D.; Funding acquisition, T.B.S. All authors have read and agreed to the published version of the manuscript.

Funding

We would like to acknowledge the University of Bristol Cabot institute, the Roddenberry Foundation and the Perivoli Foundation for funding this project.

Institutional Review Board Statement

The animal study protocol was approved by the Institutional Review Board (or Ethics Committee) of University of Bristol (UB/18/007—2018).

Informed Consent Statement

Not applicable.

Data Availability Statement

The data presented in this study is available in the Supplementary Material.

Acknowledgments

We would like to acknowledge the London aquarium for allowing use of corals and facilities. We would also like to thank the reviewers for their time and expertise.

Conflicts of Interest

The authors declare no conflict of interest.

References

  1. Hughes, T.P.; Kerry, J.T.; Álvarez-Noriega, M.; Álvarez-Romero, J.G.; Anderson, K.D.; Baird, A.H.; Babcock, R.C.; Beger, M.; Bellwood, D.R.; Berkelmans, R.; et al. Global warming and recurrent mass bleaching of corals. Nature 2017, 543, 373–377. [Google Scholar] [CrossRef] [PubMed]
  2. Teague, J.; Megson-Smith, D.A.; Allen, M.J.; Day, J.C.; Scott, T.B. A Review of Current and New Optical Techniques for Coral Monitoring. Oceans 2022, 3, 30–45. [Google Scholar] [CrossRef]
  3. Fitt, W.K.; McFarland, F.K.; Warner, M.E.; Chilcoat, G.C. Seasonal patterns of tissue biomass and densities of symbiotic dinoflagellates in reef corals and relation to coral bleaching. Limnol. Oceanogr. 2000, 45, 677–685. [Google Scholar] [CrossRef] [Green Version]
  4. Sheppard, C.; Davy, S.; Pilling, G.; Graham, N. The Biology of Coral Reefs; Oxford University Press: Oxford, UK, 2017. [Google Scholar]
  5. LaJeunesse, T. Diversity and community structure of symbiotic dinoflagellates from Caribbean coral reefs. Mar. Biol. 2002, 141, 387–400. [Google Scholar] [CrossRef]
  6. Rouzé, H.; Lecellier, G.; Saulnier, D.; Berteaux-Lecellier, V. Symbiodinium clades A and D differentially predispose Acropora cytherea to disease and Vibrio spp. colonization. Ecol. Evol. 2016, 6, 560–572. [Google Scholar] [CrossRef]
  7. Stat, M.; Morris, E.; Gates, R.D. Functional diversity in coral–dinoflagellate symbiosis. Proc. Natl. Acad. Sci. USA 2008, 105, 9256–9261. [Google Scholar] [CrossRef] [Green Version]
  8. Putnam, H.M.; Stat, M.; Pochon, X.; Gates, R.D. Endosymbiotic flexibility associates with environmental sensitivity in scleractinian corals. Proc. R. Soc. B Boil. Sci. 2012, 279, 4352–4361. [Google Scholar] [CrossRef] [Green Version]
  9. Stat, M.; Gates, R.D. Clade D Symbiodinium in Scleractinian Corals: A ‘Nugget’ of Hope, a Selfish Opportunist, an Ominous Sign, or All of the Above? J. Mar. Biol. 2011, 2011, 730715. [Google Scholar] [CrossRef] [Green Version]
  10. Satoh, S.; Ikeuchi, M.; Mimuro, M.; Tanaka, A. Chlorophyll b Expressed in Cyanobacteria Functions as a Light-harvesting Antenna in Photosystem I through Flexibility of the Proteins. J. Biol. Chem. 2001, 276, 4293–4297. [Google Scholar] [CrossRef] [Green Version]
  11. Roth, M.S.; Deheyn, D.D. Effects of cold stress and heat stress on coral fluorescence in reef-building corals. Sci. Rep. 2013, 3, 1421. [Google Scholar] [CrossRef]
  12. Field, S.F.; Bulina, M.Y.; Kelmanson, I.V.; Bielawski, J.P.; Matz, M.V. Adaptive Evolution of Multicolored Fluorescent Proteins in Reef-Building Corals. J. Mol. Evol. 2006, 62, 332–339. [Google Scholar] [CrossRef] [PubMed]
  13. Salih, A.; Larkum, A.; Cox, G.; Kühl, M.; Hoegh-Guldberg, O. Fluorescent pigments in corals are photoprotective. Nature 2000, 408, 850–853. [Google Scholar] [CrossRef] [PubMed]
  14. Palmer, C.V.; Modi, C.; Mydlarz, L.D. Coral Fluorescent Proteins as Antioxidants. PLoS ONE 2009, 4, e7298. [Google Scholar] [CrossRef] [Green Version]
  15. Rodriguez-Lanetty, M.; Harii, S.; Hoegh-Guldberg, O. Early molecular responses of coral larvae to hyperthermal stress. Mol. Ecol. 2009, 18, 5101–5114. [Google Scholar] [CrossRef] [PubMed]
  16. Desalvo, M.K.; Voolstra, C.R.; Sunagawa, S.; Schwarz, J.A.; Stillman, J.H.; Coffroth, M.A.; Szmant, A.M.; Medina, M. Differential gene expression during thermal stress and bleaching in the Caribbean coral Montastraea faveolata. Mol. Ecol. 2008, 17, 3952–3971. [Google Scholar] [CrossRef]
  17. Teague, J.; Willans, J.; Allen, M.J.; Scott, T.B.; Day, J.C. Hyperspectral imaging as a tool for assessing coral health utilising natural fluorescence. J. Spectr. Imaging 2019, 8, a7. [Google Scholar] [CrossRef] [Green Version]
  18. Barott, K.; Smith, J.; Dinsdale, E.; Hatay, M.; Sandin, S.; Rohwer, F. Hyperspectral and Physiological Analyses of Coral-Algal Interactions. PLoS ONE 2009, 4, e8043. [Google Scholar] [CrossRef]
  19. Myers, M.R.; Hardy, J.T.; Mazel, C.H.; Dustan, P. Optical spectra and pigmentation of Caribbean reef corals and macroalgae. Coral Reefs 1999, 18, 179–186. [Google Scholar] [CrossRef]
  20. Zawada, D.G.; Jaffe, J.S. Changes in the fluorescence of the Caribbean coral Montastraea faveolata during heat-induced bleaching. Limnol. Oceanogr. 2010, 48, 412–425. [Google Scholar] [CrossRef] [Green Version]
  21. Holden, H.; LeDrew, E. Spectral Discrimination of Healthy and Non-Healthy Corals Based on Cluster Analysis, Principal Components Analysis, and Derivative Spectroscopy. Remote Sens. Environ. 1998, 65, 217–224. [Google Scholar] [CrossRef]
  22. Dove, S.; Ortiz, J.C.; Enríquez, S.; Fine, M.; Fisher, P.; Iglesias-Prieto, R.; Thornhill, D.; Hoegh-Guldberg, O. Response of holosymbiont pigments from the scleractinian coral Montipora monasteriata to short-term heat stress. Limnol. Oceanogr. 2006, 51, 1149–1158. [Google Scholar] [CrossRef] [Green Version]
  23. Fitt, W.K.; Brown, B.E.; Warner, M.E.; Dunne, R.P. Coral bleaching: Interpretation of thermal tolerance limits and thermal thresholds in tropical corals. Coral Reefs 2001, 20, 51–65. [Google Scholar] [CrossRef]
  24. Falkowski, P.; Knoll, A.H. (Eds.) . Evolution of Primary Producers in the Sea; Academic Press: Cambridge, MA, USA, 2007. [Google Scholar]
  25. Brown, J.S. Absorption and fluorescence spectra of chlorophyll-proteins isolated from Euglena gracilis. BBA Bioenergy 1980, 591, 9–21. [Google Scholar] [CrossRef] [PubMed]
  26. Winters, G.; Holzman, R.; Blekhman, A.; Beer, S.; Loya, Y. Photographic assessment of coral chlorophyll contents: Implications for ecophysiological studies and coral monitoring. J. Exp. Mar. Biol. Ecol. 2009, 380, 25–35. [Google Scholar] [CrossRef]
  27. Thieberger, Y.; Kizner, Z.; Achituv, Y.; Dubinsky, Z. A novel, nondestructive bioassay for assessing areal chlorophyll a in hermatypic cnidarians. Limnol. Oceanogr. 1995, 40, 1166–1173. [Google Scholar] [CrossRef]
  28. Siebeck, U.E.; Marshall, N.J.; Klüter, A.; Hoegh-Guldberg, O. Monitoring coral bleaching using a colour reference card. Coral Reefs 2006, 25, 453–460. [Google Scholar] [CrossRef]
  29. Siebeck, U.E.; Logan, D.; Marshall, N.J. CoralWatch—A flexible coral bleaching monitoring tool for you and your group. In Proceedings of the 11th International Coral Reef Symposium, Ft. Lauderdale, FL, USA, 7–11 July 2008. [Google Scholar]
  30. Joyce, K.; Phinn, S. Hyperspectral analysis of chlorophyll content and photosynthetic capacity of coral reef substrates. Limnol. Oceanogr. 2003, 48, 489–496. [Google Scholar] [CrossRef] [Green Version]
  31. Hochberg, E.J.; Apprill, A.M.; Atkinson, M.J.; Bidigare, R.R. Bio-optical modeling of photosynthetic pigments in corals. Coral Reefs 2006, 25, 99–109. [Google Scholar] [CrossRef]
  32. Dove, S.; Hoegh-Guldberg, O.; Ranganathan, S. Major colour patterns of reef-building corals are due to a family of GFP-like proteins. Coral Reefs 2001, 19, 197–204. [Google Scholar] [CrossRef]
  33. Haddock, S.H.D.; Dunn, C.W. Fluorescent proteins function as a prey attractant: Experimental evidence from the hydromedusa Olindias formosus and other marine organisms. Biol. Open 2015, 4, 1094–1104. [Google Scholar] [CrossRef]
  34. Dunlap, W.; Chalker, B.; Bandaranayake, W.; Won, J.W. Nature’s sunscreen from the Great Barrier Reef, Australia. Int. J. Cosmet. Sci. 1998, 20, 41–51. [Google Scholar] [CrossRef] [PubMed]
Figure 1. Experimental setup for hyperspectral imaging, where the imager is rotated on a 360° stage scanning the full width of the tank (as shown by scanning path). Imaging was conducted twice per tank; reflectance imaging under white light and fluorescence under royal blue (440 nm) light, this is then repeated for both the experimental and control tanks.
Oceans 03 00036 g001
Figure 2. Raw & corrected reflectance spectra and reflectance of key wavelengths of Montipora capricornis (MCAP) over time imaged under white light in experiment 1. The average intensity at each wavelength per day of treatment is presented, where the temperature regime is represented as the blue section corresponding to 24 °C (the control stayed at this temperature throughout), green to 26 °C, yellow to 28 °C and red to 30 °C.
Oceans 03 00036 g002
Figure 3. Raw & corrected reflectance spectra and reflectance of key wavelengths of Montipora confusa (MCON) over time imaged under white light in experiment 2. The average intensity at each wavelength per day of treatment is presented, where the temperature regime is represented as the blue section corresponding to 24 °C (the control stayed at this temperature throughout), green to 26 °C, yellow to 28 °C and red to 30 °C.
Oceans 03 00036 g003
Figure 4. Raw & corrected fluorescence spectra and reflectance of key wavelengths of Montipora capricornis (MCAP) over time imaged under royal blue (440 nm) light in experiment 1. The average intensity at each wavelength per day of treatment is presented, where the temperature regime is represented as the blue section corresponding to 24 °C (the control stayed at this temperature throughout), green to 26 °C, yellow to 28 °C and red to 30 °C.
Oceans 03 00036 g004
Figure 5. Raw & corrected fluorescence spectra and reflectance of key wavelengths of Montipora confusa (MCON) over time imaged under royal blue (440 nm) light in experiment 2. The average intensity at each wavelength per day of treatment is presented, where the temperature regime is represented as the blue section corresponding to 24 °C (the control stayed at this temperature throughout), green to 26 °C, yellow to 28 °C and red to 30 °C.
Oceans 03 00036 g005
Publisher’s Note: MDPI stays neutral with regard to jurisdictional claims in published maps and institutional affiliations.