Article

Correlation between Coral Reef Condition and the Diversity and Abundance of Fishes and Sea Urchins on an East African Coral Reef

1
Department of Animal Ecology and Tropical Biology, Biocenter, University of Würzburg, Am Hubland, 97074 Würzburg, Germany
2
Department of Biological Sciences, Pwani University, Kilifi 80108, Kenya
3
CORDIO East Africa, Mombasa 80101, Kenya
*
Author to whom correspondence should be addressed.
Oceans 2022, 3(1), 1-14; https://doi.org/10.3390/oceans3010001
Submission received: 27 April 2021 / Revised: 6 December 2021 / Accepted: 14 December 2021 / Published: 4 January 2022

Abstract

:
Coral reefs are one of the most diverse marine ecosystems, providing numerous ecosystem services. This present study investigated the relationship between coral reef condition and the diversity and abundance of fishes, on a heavily fished East African coral reef at Gazi Bay, Kenya. Underwater visual censuses were conducted on thirty 50 × 5 m belt transects to assess the abundance and diversity of fishes. In parallel, a 25-m length of each of the same transects was recorded with photo-quadrats to assess coral community structure and benthic characteristics. For statistical analyses, multi-model inference based on the Akaike Information Criterion was used to evaluate the support for potential predictor variables of coral reef and fish diversity. We found that coral genus richness was negatively correlated with the abundance of macroalgae, whereas coral cover was positively correlated with both the abundance of herbivorous invertebrates (sea urchins) and with fish family richness. Similarly, fish family richness appeared mainly correlated with coral cover and invertebrate abundance, although no correlates of fish abundance could be identified. Coral and fish diversity were very low, but it appears that, contrary to some locations on the same coast, sea urchin abundance was not high enough to be having a negative influence on coral and fish assemblages. Due to increasing threats to coral reefs, it is important to understand the relationship among the components of the coral reef ecosystem on overfished reefs such as that at Gazi Bay.

Graphical Abstract

1. Introduction

Coral reefs are one of the most diverse marine ecosystems, providing numerous ecosystem services to millions of inhabitants of tropical countries. More than 500 million people depend on coral reefs [1,2,3,4]. Together with functionally and ecologically linked mangrove habitats and seagrass meadows, coral reefs likely support the highest marine biodiversity in the world [5,6,7]. The complex reef system is mainly built by scleractinian corals which can only survive a narrow range of environmental variation, and hence are vulnerable to many kinds of disturbance [8]. Most of the world’s reefs are threatened by human activities [4,9,10,11], which have exacerbated a background of otherwise natural impacts, such as those caused by diseases, outbreaks of invasive species, storms, or sedimentation [10,12,13,14,15]. In addition, coral bleaching now represents a major threat to coral reefs, whereby corals expel their zooxanthellae and associated pigments, due to high sea temperatures, slow water movement, or extreme UV exposure [2,16,17,18,19].
A fundamental goal of ecology is to understand how organisms interact with other species of organisms and their physical environment, providing among other things an explanation of variation in species richness [20]. The present study aimed to explore the relationship between the condition of coral reefs and the abundance and the diversity of reef fishes and sea urchins in an area known to be subject to heavy fishing pressure, but where herbivorous invertebrates, such as sea urchins, are not subject to these fishing practices [21]. In studying coral reefs, the abundances of key organisms have frequently been used as indicators of reef health. For example, a low abundance of corals or fishes, or a high abundance of algae, seagrass, or other soft-bodied organisms, have been taken to indicate the degradation of a reef area [10,15,22,23]. Because herbivores (both fish and invertebrates, such as sea urchins) play an important role in maintaining the coral–algae balance on a reef and in creating an appropriate substrate for coral recruitment [3,24,25,26,27,28,29,30,31], overfishing of herbivores can lead to a decline in their grazing capacity and cause a phase shift resulting in algal rather than coral dominance [7,26,29,32]. Corallivores have also often been used as indicators of reef health because of their usually positive relationship with live coral cover and negative correlation with macroalgae cover [33,34,35,36]. The abundance of corallivores is presumed to be a good indicator of a healthy reef, although, in cases of extreme corallivory, an abundance of predators may result in loss of corals or make the corals more susceptible to other stressors, such as thermal stress or the spread of diseases, as the coral is already debilitated [37,38,39]. In addition, physical or chemical variables, such as salinity or turbidity, may affect the status of a reef and are often monitored [40].
In summary, many variables can have an impact on the condition of a coral reef, but the effects may vary at different locations [40,41,42,43,44]. The present study was conducted both to evaluate the condition of coral reefs in Gazi Bay, Kenya, and to investigate the relationships between coral diversity, fish diversity, and other reef variables (e.g., seagrass abundance, macroalgae abundance, or sea urchin abundance) at this particular location. Additionally, we gathered information about local fishing practices.

2. Materials and Methods

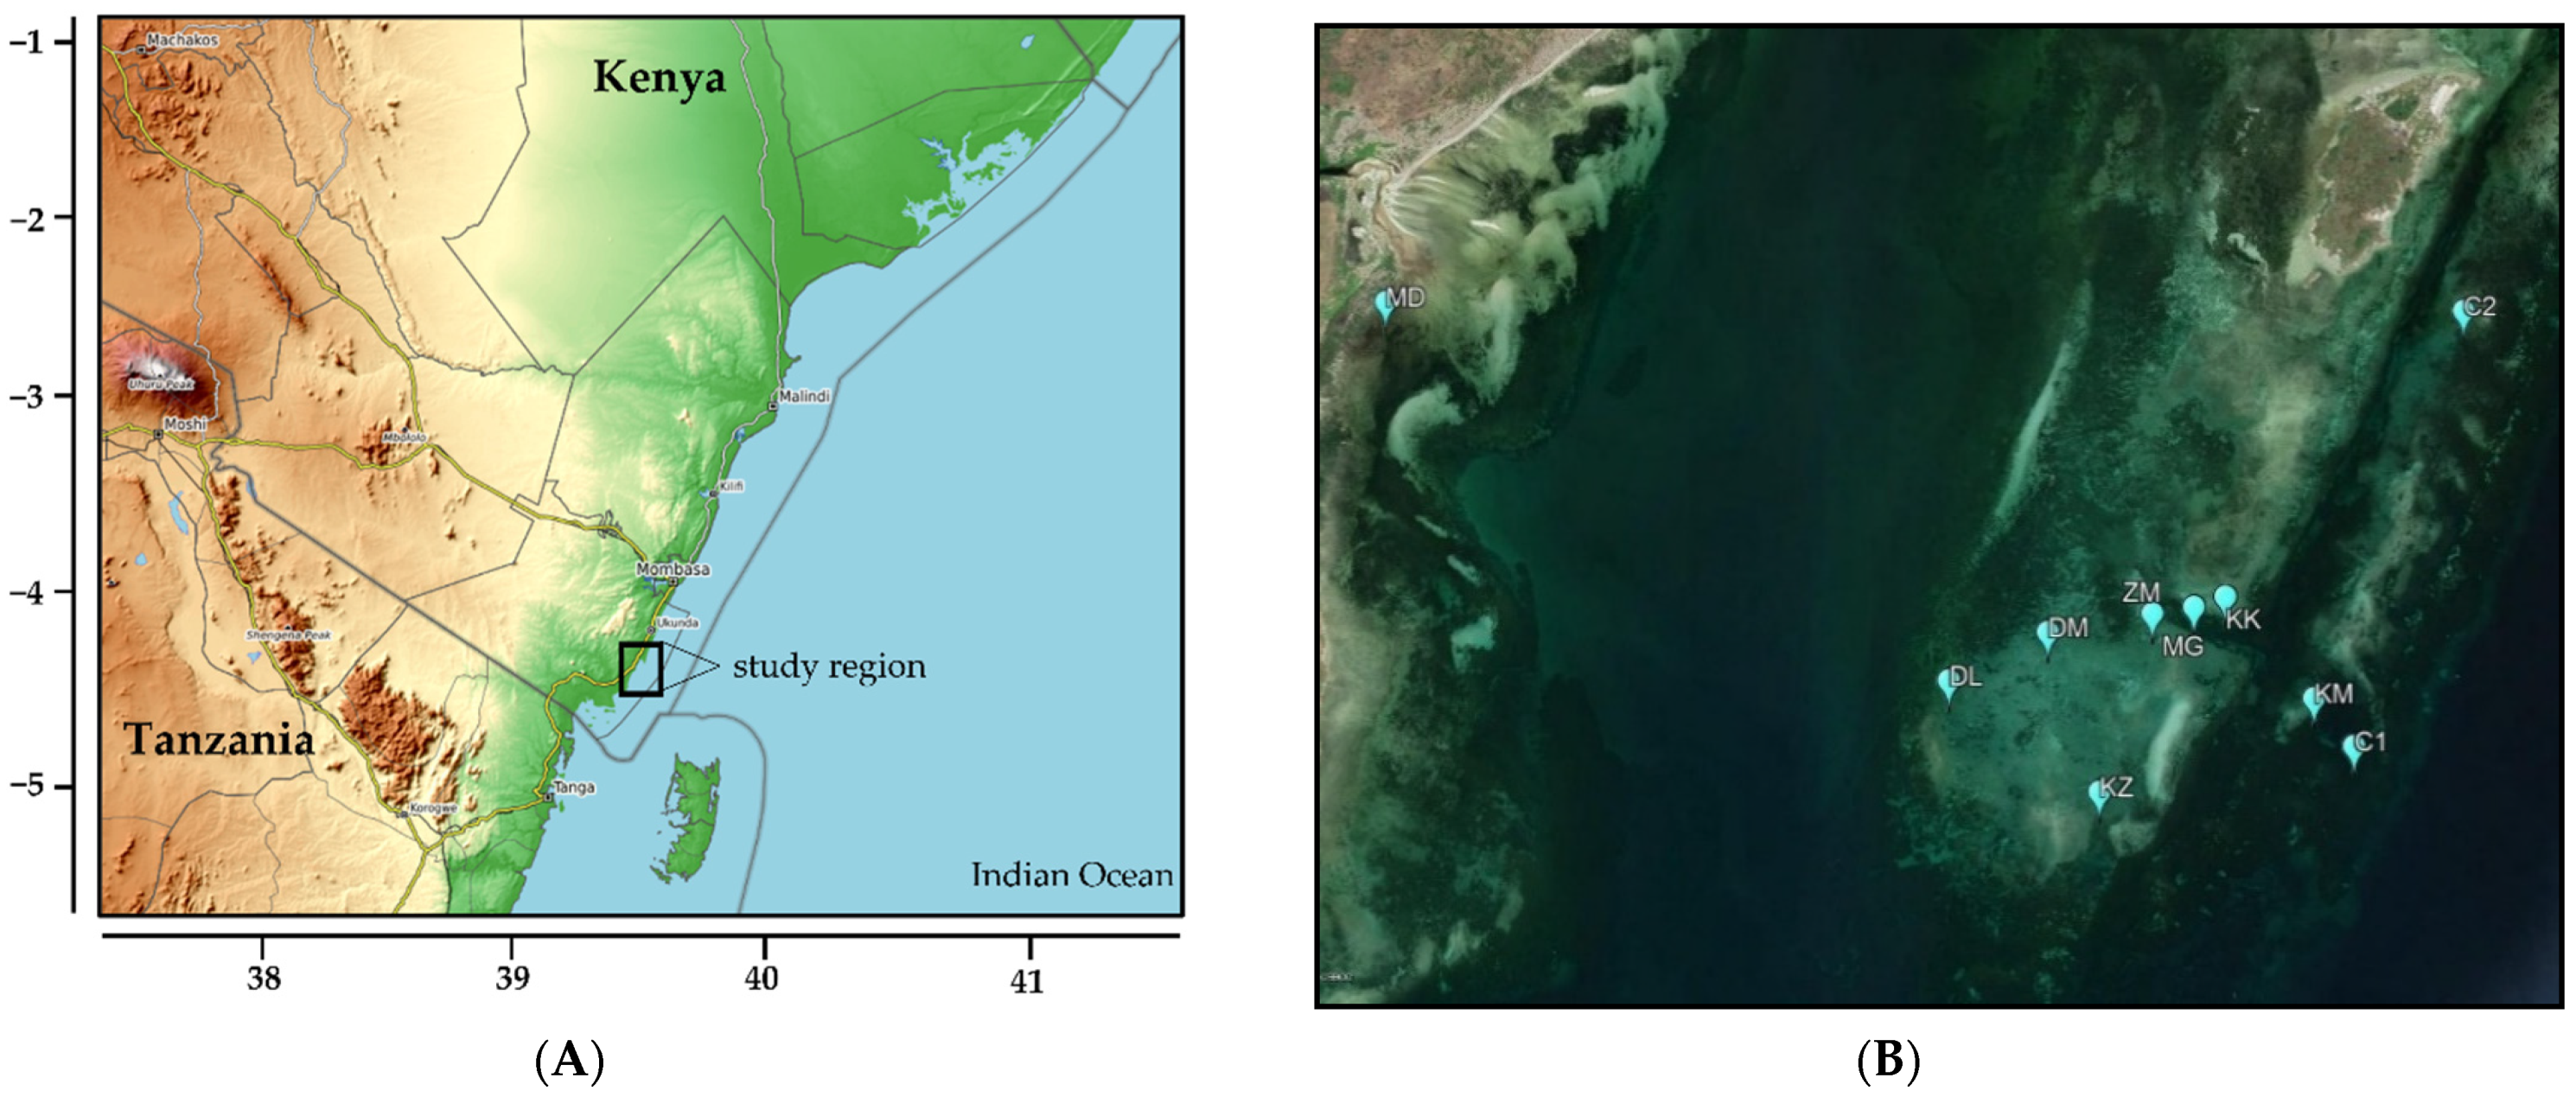
2.1. Study Region and Sites

The study was conducted on coral reefs at Gazi Bay, adjacent to Gazi Village (4°26′ S, 39°30′ E), a small fisher village located on the south coast of Kenya, about 45 km south of Mombasa [45] (Figure 1). The inner (northern) part of the bay is fringed by mangroves and seagrass meadows. The open sea lies to the south, while to the south-east, extending south from Chale Island, a submarine promontory known as Chale Reef supports the coral reef community that was the subject of this study. The reefs inside this lagoon are all relatively shallow, not exceeding 5 m in depth. The area is open to fishing and no form of protected area exists in the vicinity, so there has been increasing concern that fishing pressure is affecting the reefs. Although reef fish are known to be heavily exploited by local fishers, so far as it is known, reef invertebrates such as sea urchins are not exploited locally. Mean ambient air temperature and water temperature were both approximately 28 °C in October and November 2018 when the work was undertaken.

2.2. Monitoring of Coral Reef Fishes and Corals

Corals and fishes were surveyed at ten different reef sites on Chale Reef, with some transects on the seaward side of the reef and some on the landward side to provide a range of different reef conditions. Within each site, three belt transects of 5 × 50 m were placed haphazardly, but mostly parallel to the shore. Transects were located at least 150 m apart so as to achieve reasonable independence of the samples. Sampling was conducted around low tide (<70 cm) to provide standardized assessment conditions, while time of day and weather conditions varied through the study. During each survey, one person snorkeled in front, counting fishes using established underwater visual survey methodology [46], while a second person swimming behind laid out a 50 m tape along a track following the first snorkeler (this sequence was followed to avoid the fish being disturbed before they could be counted). For this study, eight fish families, which are known indicators of coral reef biodiversity, were preselected for the census: Scaridae, Acanthuridae, Siganidae, Ephippidae, Pomacanthidae, Chaetodontidae, Lutjanidae, and Serranidae, all of which are moderately speciose on Kenya’s southern coast [47]. Additionally, on the first half of the transect (25-m length) the hard corals were identified to genus level and the colonies counted.

2.3. Benthic Analyses

After counting fish, the first half (25 m length) of each transect was investigated to assess the substrate cover of corals, turf, and macroalgae and seagrass, and of other benthic organisms such as sea urchins. Photos of the substrate were taken from 1 m above the sea floor surface, with five photos being taken at intervals of 5 m per transect (camera: Canon Powershot G7 X Mark II with the Fantasea underwater housing). Because of limitations of time and resources, only a limited number of replicate quadrats could be sampled in this way. The photos of the benthos were analyzed with the assistance of the Coral Point Count (CPC) software [48]. The program was set to generate 25 random points on each image, the substrates below each of which were then classified by the observer into 16 major benthic categories. From these values the percentage substrate covers of the following benthic categories were then calculated: “hard coral” (HC), “soft coral” (SC), “rubble” (RUB), “seagrass” (SGR), “sand” (SND), “macroalgae” (AMAC), “turf algae” (ATRF), “Halimeda algae” (AHAL), “dead coral” (DC), “recently dead coral” (RDC), “bare substrate” (BS), “unidentified/others” (UNID/OT), and “obstacles/tape/shadows” (OBS/TWS), in addition to the abundance of “herbivorous invertebrates” (INV), specifically of echinoids (sea urchins).

2.4. Statistical Analysis
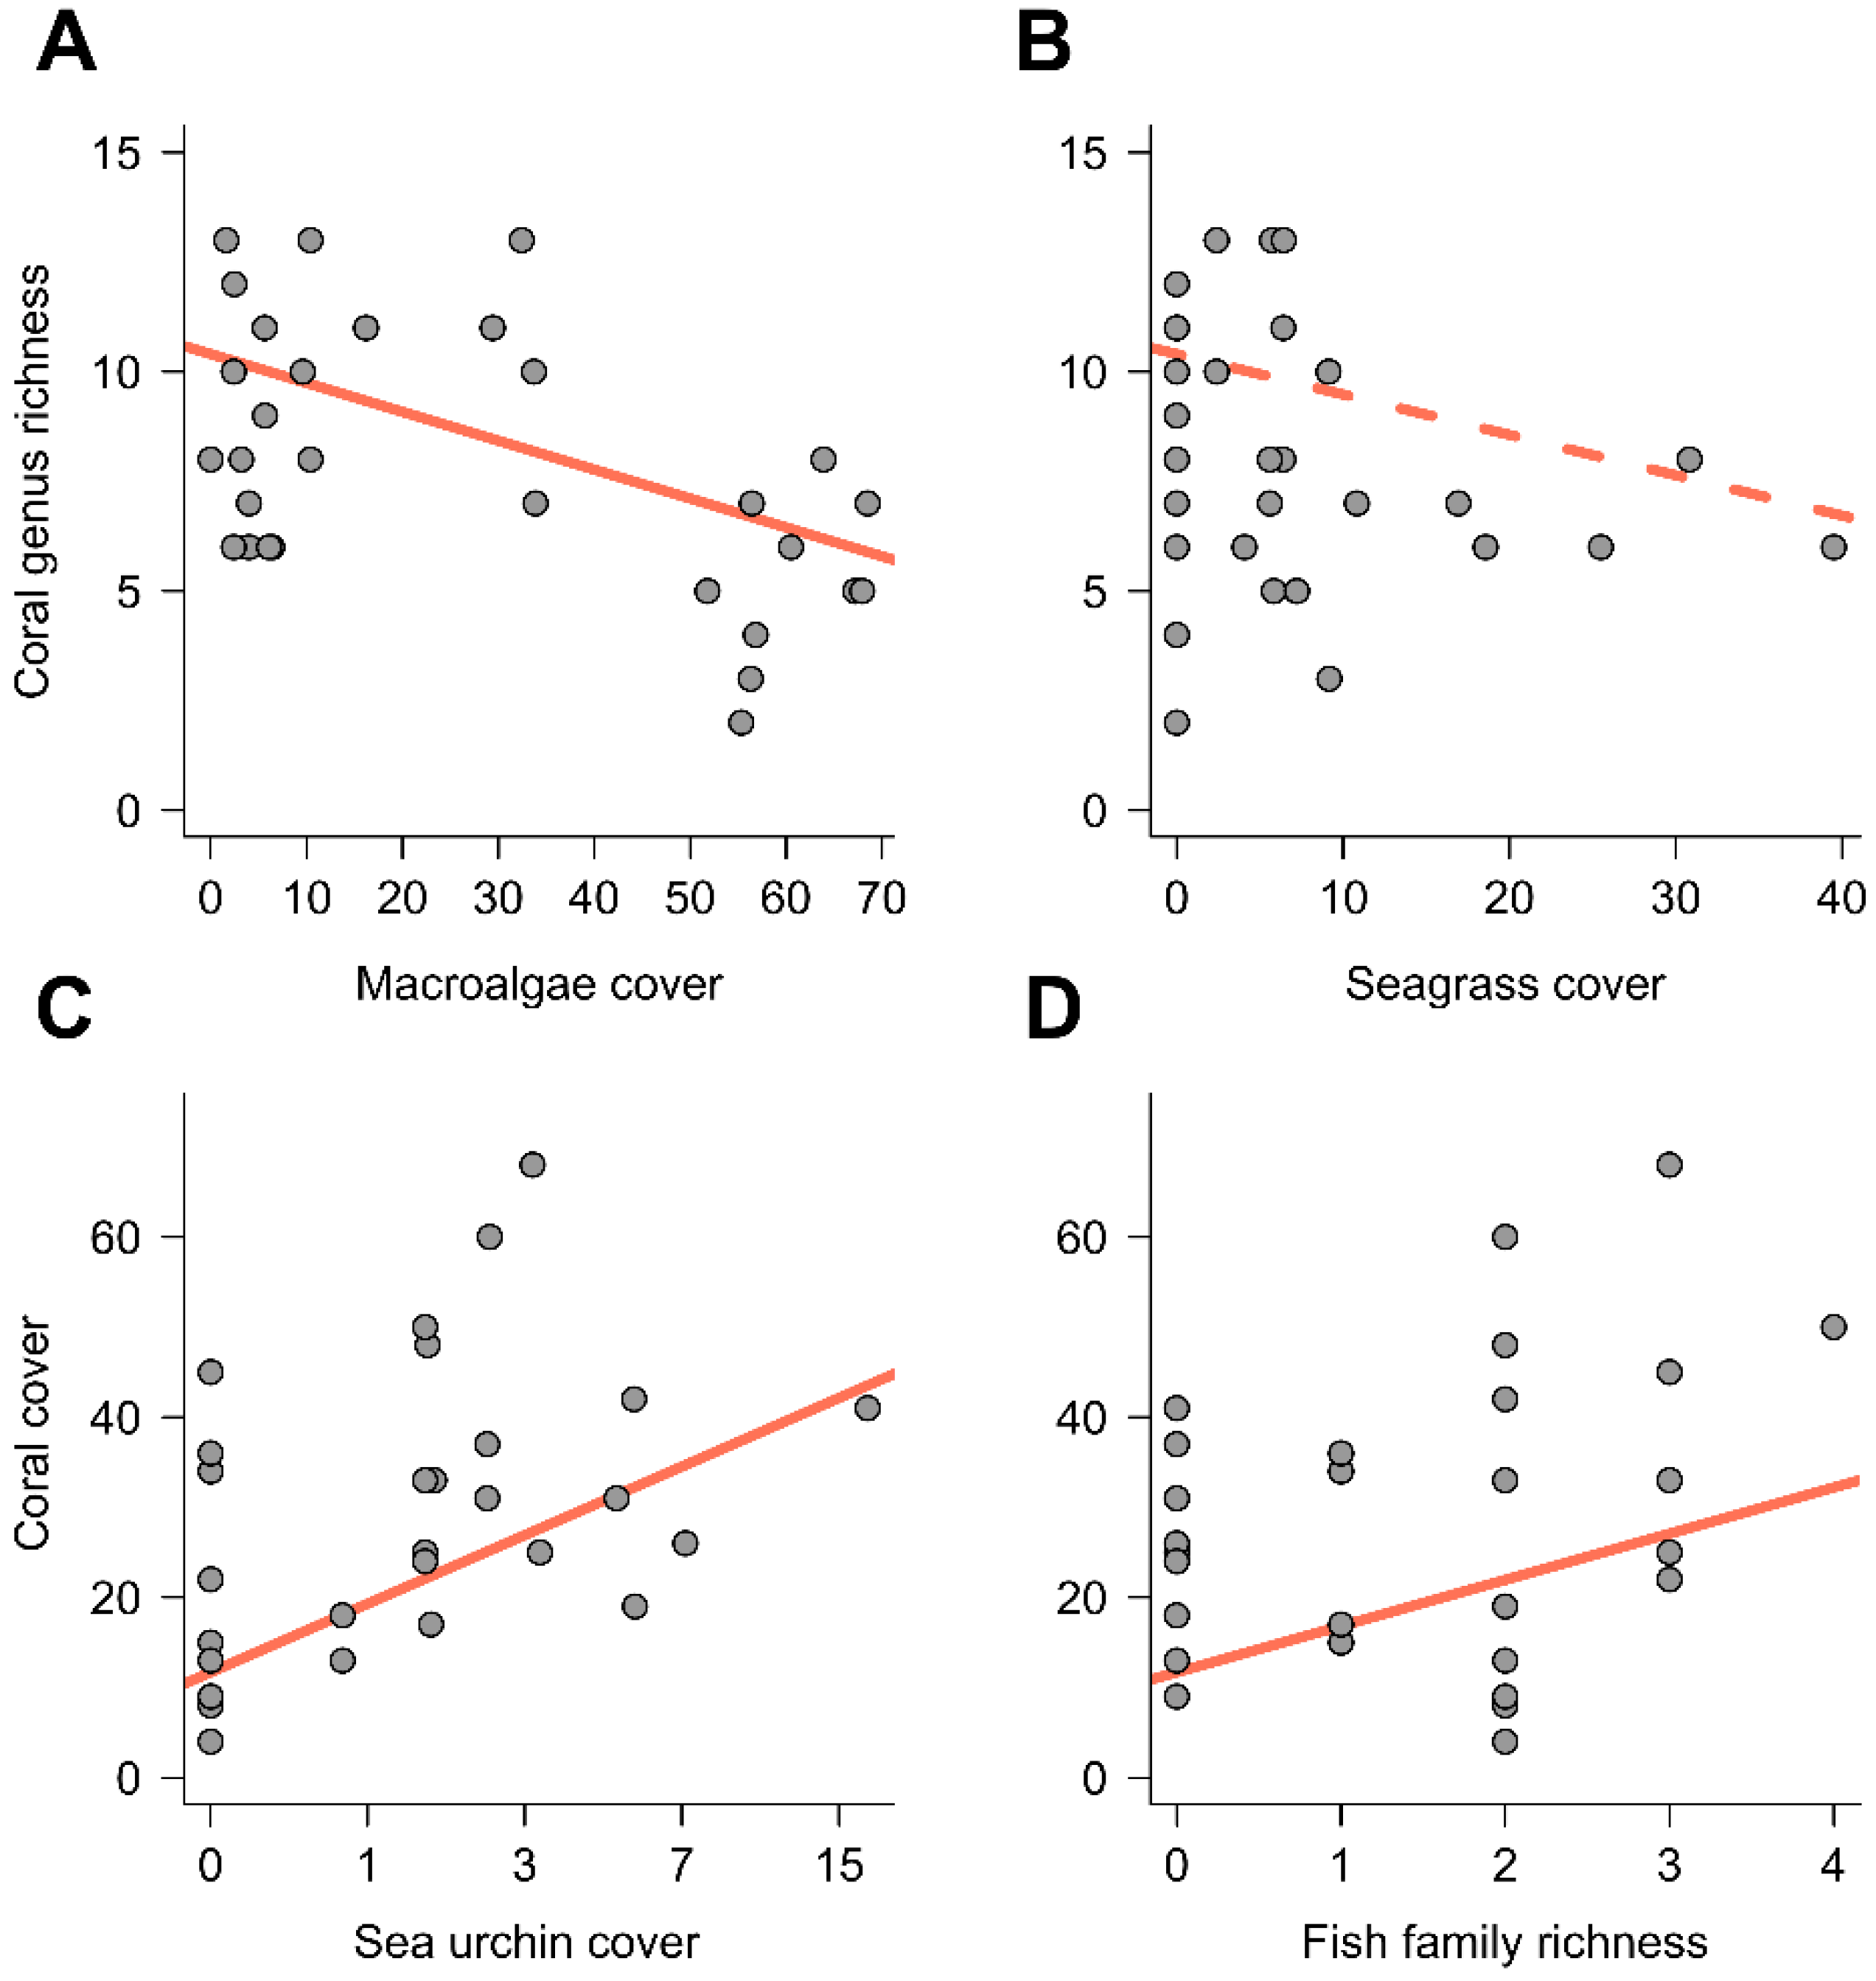
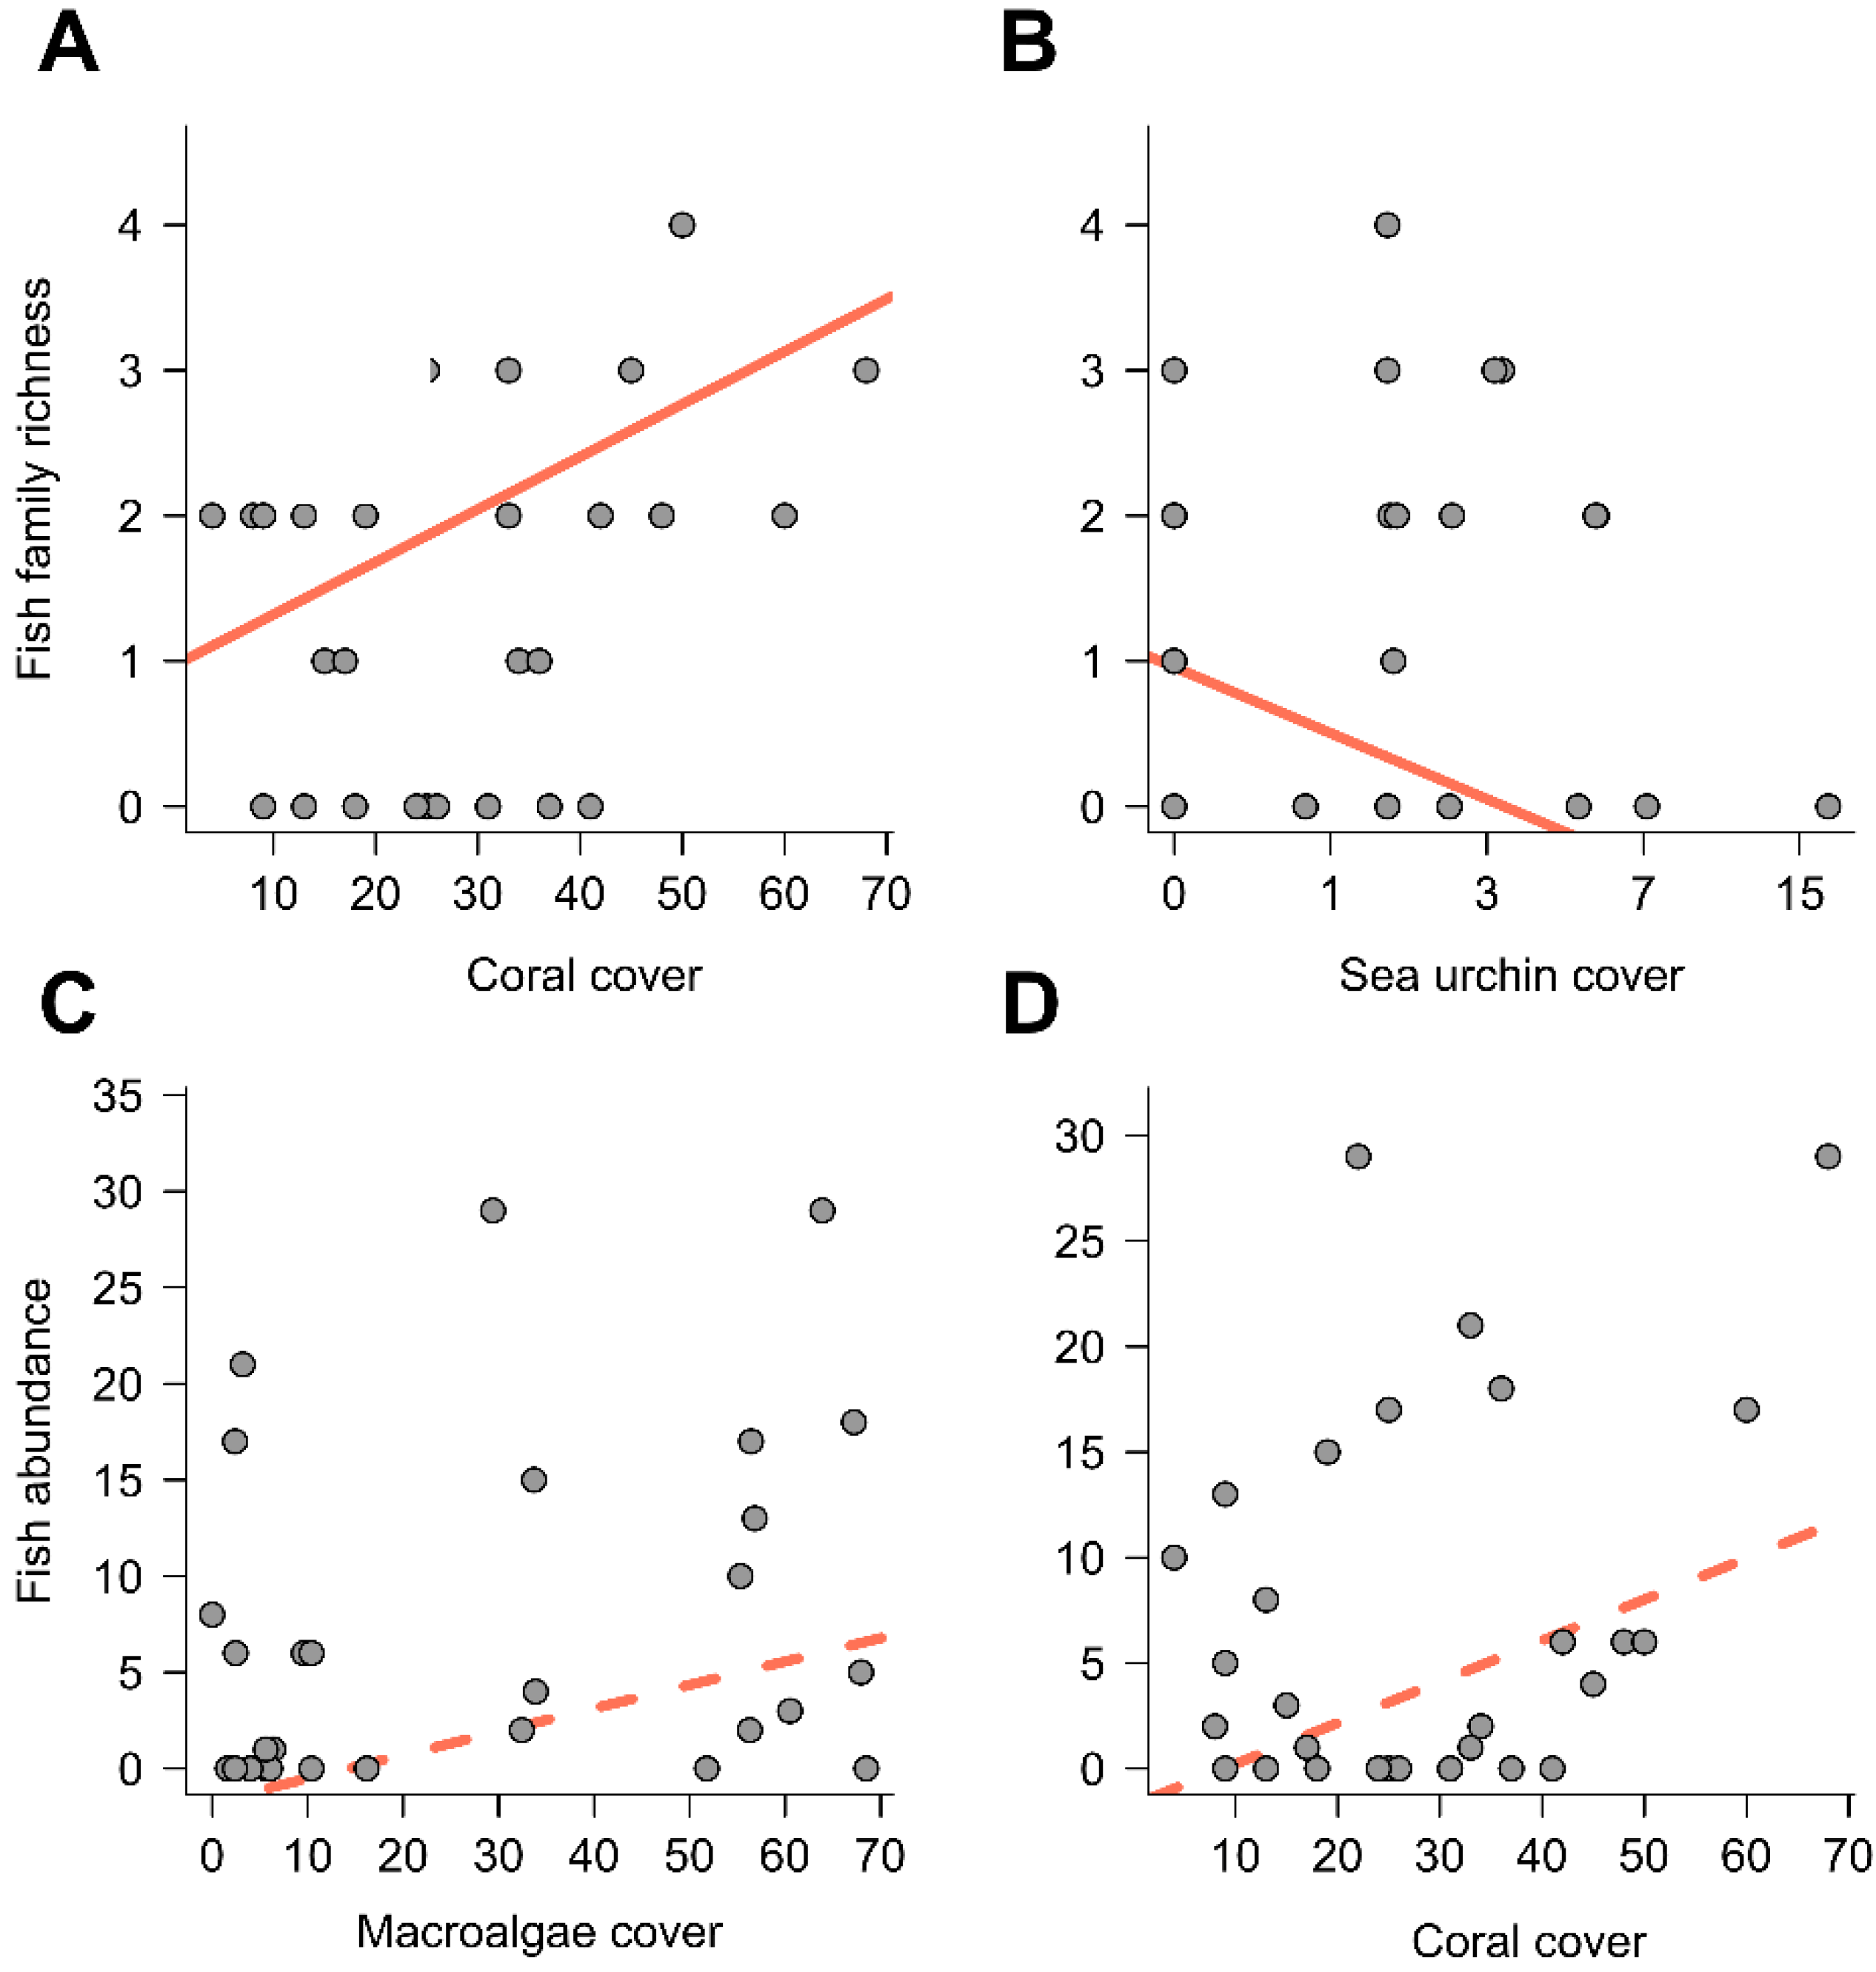
Statistical analyses were performed in the R software 3.4.4 (R Core Team, Vienna, Austria) [49] using the R packages “readxl”, “gdata”, “MuMIn”, “mgcv”, “reshape2”, “tiff”, and “nlme”. Linear models (lm) were used to identify the key predictors of fish abundance and fish family richness and of coral cover and coral genus richness. For overall fish abundance and fish family richness (i.e., the number of fish families recorded), we tested the proportional cover of the main substrate variables, “macroalgae”, “turf algae”, “herbivorous invertebrates”, “seagrass” and “coral”, as predictor variables. For coral cover and coral genus richness (i.e., the number of coral genera recorded) we used the same substrate variables, “macroalgae”, “turf algae”, “herbivorous invertebrates”, and “seagrass”, and also “fish abundance”, and “fish family richness” were tested as predictor variables. The herbivorous invertebrate data was l o g n + 1   transformed (as is often done with zero biased data) in order to increase linearity between predictor and response variables and to increase normality of model residuals. To evaluate the support for different combinations of predictor variables, the dredge-function of the “MuMIn” R package was used. For each model, the Akaike Information Criterion ( AIC ) was derived, which evaluates models based on model fit and model complexity [50]. As the sample size was relatively low compared to the number of estimated parameters, the AIC with a second-order bias correction ( AIC C ) was used. Using AIC C -based model selection, the best linear models were selected for explaining fish abundance, fish species richness, coral cover, and coral genus richness. The best model was considered to be the one with the lowest AIC C ranking [50].

3. Results

In total, 213 fishes from seven of the eight indicator families and 845 hard coral colonies from 22 genera were recorded. Across all sites, the Acanthuridae (surgeon fishes) were the dominant family in terms of individuals, followed by the Chaetodontidae (butterflyfishes). From the other families, relatively few individuals were recorded (Table 1).
For corals, the most abundant genera were massive Porites followed by Acropora (Table 2). The benthic analyses showed a dominance of macroalgae and turf algae at all sites (Table 2). Hard corals, sand, seagrass, and rubble also formed a large part of the benthos, whereas herbivorous invertebrates (mainly sea urchins), Halimeda algae and soft corals were less abundant (Table 3).
Based on the Akaike Information Criterion ( AIC C ), the best supported model for coral genus richness was one in which seagrass and macroalgae both had negative effects (Table 4). Coral genus richness doubled as macroalgae cover dropped from 69 to 2% (Figure 2A). The data indicated, on average, a loss of one coral genus for every additional 20% increase in the cover of macroalgae. Coral genus richness was similarly negatively related to seagrass substrate cover (Figure 2B). In the second- and third-best models, the presence of turf algae had an additional negative effect on coral genus richness (Table 4). In the best supported model of the factors influencing coral cover, (log-transformed) herbivorous invertebrate abundance and fish family richness both showed significant positive effects (Table 4). On average, there were twice as many corals on the transects where invertebrate numbers were the highest compared to those where it was lowest (Figure 2C). Similarly, we observed a significant increase in coral cover with increasing fish species richness (Figure 2D). However, in the second-best model, it was fish abundance instead of the fish family richness that showed a positive relationship. In the third model, turf algae cover had an additional negative impact (Table 4).
Fish family richness was best explained by a model in which coral cover had a positive impact, whereas herbivorous invertebrate abundance had a negative impact (Table 5). Fish family richness tripled along a gradient of coral cover from 2 to 69 percent (Figure 3A), whereas there were approximately twice as many fish species on sites with low invertebrate abundance as on those with high abundance (Figure 3B). In the second-best supported model, seagrass cover appeared to have an additional negative impact, whereas in the third-best model coral cover alone influenced the family richness of fish. In the best model for fish abundance (Table 5, Model B), macroalgae and coral cover both had positive effects on fish abundance. There were more than twice as many fish on the most coral rich site as on the least coral rich site (Figure 3C), while fish abundance also doubled along a gradient of macroalgae cover from 1 to 69% (Figure 3D). The second-best supported model explaining fish abundance showed a negative impact of turf algae and seagrass, whereas the third-best model contained only the positive impact of macroalgae abundance.

4. Discussion

We found that on the reefs at Gazi Bay coral genus richness was negatively correlated with the abundance of macroalgae, whereas coral cover was positively correlated with the abundance of herbivorous invertebrates (effectively sea urchins) and with fish family richness. Fish family richness was mainly correlated with coral cover and invertebrate abundance, but no determinants of fish abundance could be convincingly identified. However, caution is required before assuming these trends apply more widely, because, for example, the abundance of fishes and the extent of live coral cover observed in Gazi Bay appeared noticeably low compared to protected reef sites on the Kenyan coast visited by the authors in the same year (e.g., in the Kisite-Mpunguti Marine National Park and the Malindi National Park).
Acanthuridae (surgeon fishes) were the most abundant family across the sites, followed by the Chaetodontidae (butterflyfishes). As specific butterflyfishes are facultative or obligate corallivores they are generally associated with high live coral cover [47,51,52,53], even though in some cases this correlation was found to be quite low [54,55]. We found that there are enough living corals for at least some butterflyfish species to inhabit the reefs of Gazi Bay. Nevertheless, the benthic composition was dominated by macroalgae and turf algae. This may be because of the near absence of some other herbivorous fishes, notably species of parrotfish [10,25]. Their intensive feeding promotes the settlement, growth, and survivorship of corals due to the removal of competitive macroalgae. In this way herbivores are considered important for coral reef resilience, because they keep macroalgae at low levels after any disturbance affecting corals, thus allowing the corals to recover [3,56,57]. The fact that during the study we observed no groupers and only a few parrotfishes, rabbitfishes, and snappers, is likely a consequence of overfishing, because all three families are important food-fish on the Kenyan coast.
In addition to fish, we found sea urchin abundance to be positively related to coral cover. This relationship is likely explained by the negative impact of sea urchins on algae, which otherwise compete with corals for space and light. Various field and computer studies have shown that urchin domination can help maintain coral cover by reducing competitive algae cover [32,58,59,60,61,62]. The study by Nozawa et al. (2020) showed that diadematid sea urchins enhance coral recruitment on Taiwanese reefs [32]. Another study in Kenya found that areas that were inaccessible to urchin grazing retained a high cover of algal turf and so were not suitable for coral recruitment, whereas in stable reef systems grazing fishes graze down the turf algae, facilitating coral recruitment [58]. The areas that were less accessible to echinoids were, in the absence of grazing fishes, dominated by large, fleshy algae which smothered corals [58]. However, the effects of sea urchins on the dynamics of phase shifts on coral reefs are density dependent, because they can play two different roles. In low abundances, reef echinoids promote coral reef resilience by controlling algal cover [56,63,64,65]. In high abundances, echinoids may erode large parts of both living corals and the dead coral framework (in addition to the algae growing on the latter), resulting in loss in live coral cover, reduced coral recruitment, reduced calcium carbonate accretion, and reduced associated faunal diversity [9,10,56,63,64,65]. Our results, however, showed a positive effect of herbivorous invertebrate/sea urchin abundances on corals, indicating that at Gazi Bay sea urchin population density is not (yet?) harmful to the coral community.
Our results also showed that, in our study area, coral genus richness was negatively related to macroalgae abundance. This is likely also because of the negative effect (just discussed) of macroalgae on hard coral cover, as overgrowth of corals by macroalgae can suppress the coral fecundity, hinder coral growth, and smother coral recruits [7,58,66,67]. Algal turfs, by comparison with macroalgae, are less successful competitors of corals [66,68]. Hopkins (2009) also found this correlation between coral and macroalgae cover, with the hard-coral cover being low when algae cover is high (and vice versa). Coral-macroalgae phase shifts have been reported from many countries, including, notably, Jamaica [69], and also East Africa [44], a phenomenon generally believed to be triggered by various impacts, such as the loss of herbivores (either urchins or fish), increased nutrient input, hurricane damage, or crown-of-thorns-starfish outbreak [63].
In our study, seagrass abundance was negatively related to coral genus richness, although this relationship was only marginally significant in the best supported model. A negative relationship between seagrass cover and coral genus richness may be largely explained by corals and seagrasses colonizing different types of substrates, but there may also be a degree of competition for space on some substrates. A previous study described seagrass colonizing the reef substratum after it was eroded by sea urchins [44]. However, other studies have shown that seagrass meadows may enhance coral reef resilience against ocean acidification by modifying the pH of the water column [68,70].
We found the cover of corals to be positively related to both fish abundance and fish family richness. However, this could be the result either of fish activity, such as grazing on algae, favoring the health of corals, or of corals providing a better habitat for fish [10,71,72]. Herbivorous fishes, which made up a large proportion in the counted fish, may clear space for coral settlement [73] by ingesting seagrass, macroalgae, or algal turfs. In particular, by reducing the amount of competitively superior macroalgae, herbivorous fishes allow corals and cementing coralline algae to survive [3,72]. Exclusion experiments such as those described by Hughes et al. [61] have repeatedly found that after excluding herbivores from parts of a reef, the coverage of macroalgae will quickly increase but will decline rapidly again when the area is made newly accessible to grazers. With increasing biomass of grazers/detritivores, macroalgal cover decreases, thereby increasing the cover of live coral [7,25,66].
Although in our study the fact that herbivorous surgeonfishes (Acanthuridae) were the most abundant family makes it plausible that in our location it is reef fish diversity and abundance that are influencing coral cover, a positive relationship between coral cover and fish density and diversity has also been interpreted in many studies as inferring that it is coral cover which influences fish abundance [41,42]. In particular, increasing topographic or architectural complexity, substratum diversity, and live coral cover has been associated with increasing fish abundance and diversity [25,42,56,74,75]. Because of the difficulties in coral identification, the relationship between species richness of the fish assemblage and the diversity or cover of coral is less apparent in the literature than the effects of habitat complexity [42,76]. Coral reefs can provide fish with physical refuges from predators, in addition to breeding, nursery, and feeding sites, and thus enhance fish diversity. In contrast, coral mortality has been predicted to reduce reef fish abundance and diversity and so have long-term consequences on the community [19,56]. In fact, a recent study by Darling et al. suggests that reefs without corals will no longer support diverse fish faunas but be numerically dominated by a small subset of species that prefer algal or rubble substrata [77].
In our study, the abundance of sea urchins, besides being positively related to coral cover, was negatively related to fish species diversity. As we have said, echinoids are important grazers in shallow reef ecosystems and compete for resources with herbivorous fish and other benthic organisms [58,78]. Other studies have also revealed a negative impact of sea urchin abundance on the number of fish species and their abundance [58,78,79]. McClanahan et al. (1994) found that in heavily fished Kenyan reef lagoons, sea urchins are the most abundant grazers with herbivorous fishes showing a contrasting pattern of distribution. It appears that, as the fish density is reduced by fishing, echinoid populations expand to use the newly available resources [79]. Once an urchin-dominated community is established, it can be hard for herbivorous fishes to re-establish themselves [73]; high sea urchin abundances may even suppress fish growth and recruitment and hence recovery of the fish populations [58].
Due to the correlative nature of our study, it is not possible to determine the true causal relationship between fishes and corals or fishes and sea urchins, e.g., whether low abundances of fishes cause an increase in sea urchins or if high abundances of sea urchins cause a decline in fish species populations. Nevertheless, for the persistence of herbivorous fishes, it may be important to protect sea urchin predators, such as triggerfish (Balistidae) [21,28,80], which prevent sea urchins from becoming dominant, because otherwise these effects are not expected to be reversible [73,81,82].

5. Conclusions

As the shallow reef areas in Gazi Bay had low coral cover and low fish abundance, combined with high algae cover, we consider the condition of the reef there to be far from natural [44,83]. Without a longer-term monitoring program, we cannot be certain about the causes of the poor reef condition. Nevertheless, our study demonstrates, for an East African coral reef subject to high fishing pressure, clear relationships between algae growth, live coral cover, and the abundance and diversity of the reef fish assemblages. Increased human impact on the coral reefs (e.g., by increases in fishing pressure, destruction of corals, or discharge of nutrients, the lack of which otherwise helps limit algae growth) will inevitably lead to further changes in reef condition.

Author Contributions

Conceptualization, P.D., P.M. and M.K.P.; methodology, P.D. and P.M.; formal analysis, P.D., S.K., M.K.P.; investigation, P.D.; resources, P.D., P.M.; writing—original draft preparation, P.D.; writing—review and editing, M.K.P., P.M., S.K.; visualization, P.D., S.K., M.K.P.; supervision, M.K.P. All authors have read and agreed to the published version of the manuscript.

Funding

This research received no external funding.

Institutional Review Board Statement

Not applicable.

Data Availability Statement

The data presented in this study are available in an excel table format on request from the corresponding author.

Acknowledgments

Thanks go to the Kenyan Marine and Fisheries Research Institute (KMFRI) for providing the first author with accommodation and their facilities. Thanks are also due to Rupert Ormond for his most helpful comments and editing as well as to the anonymous reviewers.

Conflicts of Interest

The authors declare no conflict of interest.

References

  1. Roberts, C.M.; McClean, C.J.; Veron, J.E.N.; Hawkins, J.P.; Allen, G.R.; McAllister, D.E.; Mittermeier, C.G.; Schueler, F.W.; Spalding, M.; Wells, F.; et al. Marine biodiversity hotspots and conservation priorities for tropical reefs. Science 2002, 295, 1280–1284. [Google Scholar] [CrossRef] [Green Version]
  2. Veron, J.E.N. Corals of the World; Australian Institute of Marine Science: Townsville, Australia, 2000; Volume 1. [Google Scholar]
  3. Ogden, J.C.; Lobel, P.S. The role of herbivorous fishes and urchins in coral reefs communities. Environ. Biol. Fishes 1978, 3, 49–63. [Google Scholar] [CrossRef]
  4. Hughes, T.P.; Baird, A.H.; Bellwood, D.R.; Card, M.; Connolly, S.R.; Folke, C.; Grosberg, R.; Hoegh-Guldberg, O.; Jackson, J.B.C.; Kleypas, J.; et al. Climate change, human impacts, and the resilience of coral reefs. Science 2003, 301, 929–933. [Google Scholar] [CrossRef] [Green Version]
  5. Obura, D.O.; Grimsditch, G. Resilience Assessment of Coral Reefs—Assessment Protocol for Coral Reefs, Focusing on Coral Bleaching and Thermal Stress; IUCN: Gland, Switzerland, 2009; p. 70. [Google Scholar]
  6. Moberg, F.; Folke, C. Ecological goods and services of coral reef ecosystems. Ecol. Econ. 1999, 29, 215–233. [Google Scholar] [CrossRef]
  7. Knowlton, N.; Jackson, J.B.C. Shifting baselines, local impacts, and global change on coral reefs. PLoS Biol. 2008, 6, e54. [Google Scholar] [CrossRef] [Green Version]
  8. Maynard, J.A.; Marshall, P.A.; Parker, B.; Mcleod, E.; Ahmadia, G.; Van Hooidonk, R.; Planes, S.; Williams, G.J.; Raymundo, L.; Beeden, R.; et al. A Guide to Assessing Coral Reef Resilience for Decision Support; UN Environment: Nairobi, Kenya, 2017. [Google Scholar]
  9. Tebbett, S.B.; Bellwood, D.R. Functional links on coral reefs: Urchins and triggerfishes, a cautionary tale. Mar. Environ. Res. 2018, 141, 255–263. [Google Scholar] [CrossRef] [PubMed]
  10. Bellwood, D.R.; Hughes, T.P.; Folke, C.; Nyström, M. Confronting the coral reef crisis. Nature 2004, 429, 827–833. [Google Scholar] [CrossRef] [PubMed]
  11. Ferrigno, F.; Bianchi, C.N.; Lasagna, R.; Morri, C.; Russo, G.F.; Sandulli, R. Corals in high diversity reefs resist human impact. Ecol. Indic. 2016, 70, 106–113. [Google Scholar] [CrossRef]
  12. Wilkinson, C.R. Global change and coral reefs: Impacts on reefs, economies and human cultures. Glob. Chang. Biol. 1996, 2, 547–558. [Google Scholar] [CrossRef]
  13. Magris, R.A.; Grech, A.; Pressey, R.L. Cumulative human impacts on coral reefs: Assessing risk and management implications for Brazilian reefs. Diversity 2018, 10, 26. [Google Scholar] [CrossRef] [Green Version]
  14. Nepote, E.; Bianchi, C.N.; Chiantore, M.; Morri, C.; Montefalcone, M. Pattern and intensity of human impact on coral reefs depend on depth along the reef profile and on the descriptor adopted. Estuar. Coast. Shelf Sci. 2016, 178, 86–91. [Google Scholar] [CrossRef]
  15. Goatley, C.H.R.; Bonaldo, R.M.; Fox, R.J.; Bellwood, D.R. Sediments and herbivory as sensitive indicators of coral reef degradation. Ecol. Soc. 2016, 21, 21. [Google Scholar] [CrossRef] [Green Version]
  16. McClanahan, T.R.; Muthiga, N.; Mangi, S. Coral and algal changes after the 1998 coral bleaching: Interaction with reef management and herbivores on Kenyan reefs. Coral Reefs 2001, 19, 380–391. [Google Scholar] [CrossRef]
  17. Safaie, A.; Silbiger, N.J.; McClanahan, T.R.; Pawlak, G.; Barshis, D.J.; Hench, J.L.; Rogers, J.S.; Williams, G.J.; Davis, K.A. High-frequency temperature variability reduces the risk of coral bleaching. Nat. Commun. 2018, 9, 1671. [Google Scholar] [CrossRef] [PubMed]
  18. Douglas, A.E. Coral bleaching—How and why? Mar. Pollut. Bull. 2003, 46, 385–392. [Google Scholar] [CrossRef]
  19. Rudi, E.; Iskandar, T.; Fadli, N.; Hidayati. Effects of coral bleaching on reef fish fisheries at Sabang. In Proceedings of the 12th International Coral Reef Symposium, Cairns, Australia, 9–13 July 2012. [Google Scholar]
  20. Bellwood, D.R.; Hughes, T.P.; Connolly, S.R.; Tanner, J. Environmental and geometric constraints on Indo-Pacific coral reef biodiversity. Ecol. Lett. 2005, 8, 643–651. [Google Scholar] [CrossRef]
  21. McClanahan, T.R.; Shafir, S.H. Causes and consequences of sea urchin abundance and diversity in Kenyan coral reef lagoons. Oecologia 1990, 83, 362–370. [Google Scholar] [CrossRef]
  22. Bahartan, K.; Zibdah, M.; Ahmed, Y.; Israel, A.; Brickner, I.; Abelson, A. Macroalgae in the coral reefs of Eilat (Gulf of Aqaba, Red Sea) as possible indicator of reef degradation. Mar. Pollut. Bull. 2010, 60, 759–764. [Google Scholar] [CrossRef]
  23. McClanahan, T.R.; Uku, J.N.; Machano, H. Effect of macroalgal reduction on coral-reef fish in the Watamu Marine National Park, Kenya. Mar. Freshw. Res. 2002, 53, 223–231. [Google Scholar] [CrossRef]
  24. Hill, J.; Wilkinson, C. Methods for Ecological Monitoring of Coral Reefs—A Resource for Managers; Australian Institute of Marine Science: Townsville, Australia, 2004; p. 117. [Google Scholar]
  25. Green, A.L.; Bellwood, D.R. Monitoring Functional Groups of Herbivorous Reef Fishes as Indicators of Coral Reef Resilience—A Practical Guide for Reef Managers in the Asia Pacific Region; IUCN working group on Climate Change and Coral Reefs: Gland, Switzerland, 2009; p. 70. [Google Scholar]
  26. Humphries, A.T.; McClanahan, T.R.; McQuaid, C.D. Algal turf consumption by sea urchins and fishes is mediated by fisheries management on coral reefs in Kenya. Coral Reefs 2020, 39, 1137–1146. [Google Scholar] [CrossRef]
  27. McManus, J.W.; Polsenberg, J.F. Coral-algal phase shifts on coral reefs: Ecological and environmental aspects. Prog. Oceanogr. 2004, 60, 263–279. [Google Scholar] [CrossRef]
  28. Cheal, A.J.; MacNeil, M.A.; Cripps, E.; Emslie, M.J.; Jonker, M.; Schaffelke, B.; Sweatman, H. Coral-macroalgal phase shifts or reef resilience: Links with diversity and functional roles of herbivorous fishes on the Great Barrier Reef. Coral Reefs 2010, 29, 1005–1015. [Google Scholar] [CrossRef]
  29. Reverter, M.; Jackson, M.; Daraghmeh, N.; von Mach, C.; Milton, N. 11-yr of coral community dynamics in reefs around Dahab (Gulf of Aqaba, ed Sea): The collapse of urchins and rise of macroalgae and cyanobacterial mats. Coal Reefs 2020, 39, 1605–1618. [Google Scholar] [CrossRef]
  30. Rempel, H.S.; Bodwin, K.N.; Ruttenberg, B.I. Impacts of parrotfish predation on a major reef-building coral: Quantifying healing rates and thresholds of coral recovery. Coral Reefs 2020, 39, 1441–1452. [Google Scholar] [CrossRef]
  31. Roach, N.F.; Little, M.; Arts, M.G.I.; Huckeba, J.; Haas, A.F.; George, E.E.Q.R.A.; Cobián-Güemes, A.; Naliboff, D.S.; Silveira, C.; Vermeij, M.J.A.; et al. A multiomic analysis of in situ coral-turf algal interactions. Proc. Natl. Acad. Sci. USA 2020, 117, 13588–13595. [Google Scholar] [CrossRef]
  32. Nozawa, Y.; Lin, C.; Meng, P. Sea urchins (diadematids) promote coral recover via recruitment on Taiwanese reefs. Coral Reefs 2020, 39, 1199–1207. [Google Scholar] [CrossRef]
  33. Leahy, S.M.; Russ, G.R.; Abesamis, R.A. Primacy of bottom-up effects on a butterflyfish assemblage. Mar. Freshw. Res. 2016, 67, 1175–1185. [Google Scholar] [CrossRef]
  34. Soule, D.F.e.a. Marine Organisms as Indicators; Springer: New York, NY, USA, 1988. [Google Scholar]
  35. Reese, E.S. Predation on corals by fishes of the family Chaetodontidae: Implications for conservation and management of coral reef ecosystems. Bull. Mar. Sci. 1981, 31, 594–604. [Google Scholar]
  36. Chabanet, P.; Adjeroud, M.; Andrèfouet, S.; Bozec, Y.M.; Ferraris, J.; Garcia-Charton, J.; Schrimm, M. Human-induced physical disturbances and their indicators on coral reef habitats: A multi-scale approach. Aquat. Living Resour. 2005, 18, 215–230. [Google Scholar] [CrossRef] [Green Version]
  37. Noonan, K.R.; Childress, M.J. Association of butterflyfishes and stony coral tissue loss disease in the Florida Keys. Coral Reefs 2020, 39, 1581–1590. [Google Scholar] [CrossRef]
  38. Nicolet, K.J.; Chong-Seng, K.M.; Pratchett, M.S.; Willis, B.L.; Hoogenboom, M.O. Predation scars may influence host susceptibility to pathogens: Evaluating the role of corallivores as vectors of coral disease. Sci. Rep. 2018, 8, 5258. [Google Scholar] [CrossRef] [Green Version]
  39. Rice, M.M.; Ezzat, L.; Burkepile, D.E. Corallivory in the anthropocene: Interactive effects of anthropogenic stressors and corallivory on coral reefs. Front. Mar. Sci. 2019, 5, 525. [Google Scholar] [CrossRef] [Green Version]
  40. Hughes, T.P.; Connell, J.H. Multiple stressors on coral reefs: A long-term perspective. Limnol. Oceanogr. 1999, 44, 932–940. [Google Scholar] [CrossRef]
  41. Bell, J.D.; Galzin, R. Influence of live coral on coral reef fish communities. Mar. Ecol. Prog. Ser. 1984, 15, 265–274. [Google Scholar] [CrossRef]
  42. Chabanet, P.; Ralambondrainy, H.; Amanieu, M.; Faure, G.; Galzin, R. Relationships between coral reef substrata and fish. Coral Reefs 1997, 19, 93–102. [Google Scholar] [CrossRef]
  43. Done, T.J. Phase shifts in coral reef communities and their ecological significance. Hydrobiologia 1992, 247, 121–132. [Google Scholar] [CrossRef]
  44. McClanahan, T.R.; Glaesel, H.; Rubens, J.; Kiambo, R. The effects of traditional fisheries management on fisheries yields and the coral-reef ecosystem of southern Kenya. Environ. Conserv. 1997, 24, 105–120. [Google Scholar] [CrossRef]
  45. Dahdouh-Guebas, F.; Van Pottelbergh, I.; Kairo, J.G.; Cannicci, S.; Koedam, N. Human-impacted mangroves in Gazi (Kenya): Predicting future vegetation based on retrospective remote sensing, social surveys, and tree distribution. Mar. Ecol. Prog. Ser. 2004, 272, 77–92. [Google Scholar] [CrossRef] [Green Version]
  46. Cowburn, B.; Samoilys, M.A.; Obura, D. The current status of coral reefs and their vulnerability to climate change and multiple human sresses in the Comoros Archipelago, Western India. MArine Pollut. Bull. 2018, 133, 956–969. [Google Scholar] [CrossRef] [PubMed]
  47. Lieske, E.; Myers, R. Coral Reef Fishes; Princeton University Press: Princeton, NJ, USA, 2002. [Google Scholar]
  48. Kohler, K.E.; Gill, S.M. Coral Point Count with Excel extensions (CPCe): A Visual Basic program for the determination of coral and substrate coverage using random point count methodology. Comput. Geosci. 2006, 32, 1259–1269. [Google Scholar] [CrossRef]
  49. R Core Team. R: A Language and Environment for Statistical Computing; R Foundation for Statistical Computing: Vienna, Austria, 2018. [Google Scholar]
  50. Burnham, K.P.; Anderson, D.R. Multimodel interference—Understanding AIC and BIC in model selection. Sociol. Methoads Res. 2004, 33, 261–304. [Google Scholar] [CrossRef]
  51. Brooker, R.M.; Munday, P.L.; Mcleod, I.M. Habitat preferences of a corallivorous reef fish: Predation risk versus food quality. Coral Reefs 2013, 32, 613–622. [Google Scholar] [CrossRef]
  52. Smith, J.E.; Brainard, R.; Carter, A.; Grillo, S.; Edwards, C.; Harris, J.; Lewis, L.; Obura, D.; Rohwer, F.; Sala, E.; et al. Re-evaluating the health of coral reef communities: Baselines and evidence for human impacts across the central Pacific. Proc. R. Soc. B 2016, 283, 20151985. [Google Scholar] [CrossRef] [PubMed]
  53. Lieske, E.; Myers, R. Korallenriff-Führer Rotes Meer; Franckh-Kosmos Verlags GmbH & Co. KG: Stuttgart, Germany, 2010; Volume 2. [Google Scholar]
  54. Roberts, C.M.; Ormond, R. Habitat complexity and coral reef diversity and abundance on Red Sea fringing reefs. Mar. Ecol. Prog. Ser. 1987, 41, 1–8. [Google Scholar] [CrossRef]
  55. Fowler, A.J. Spatial and temporal patterns of distribution and abundance of chaetodontid fishes at One Tree Reef, southern GBR. Mar. Ecol. Prog. Ser. 1990, 64, 39–53. [Google Scholar] [CrossRef]
  56. Sebens, K.P. Biodiversity of coral reefs: What are we losing and why? Am. Zool. 1994, 34, 115–133. [Google Scholar] [CrossRef]
  57. Burkepile, D.E.; Hay, M.E. Herbivore species richness and feeding complementarity affect community structure and function on a coral reef. Proc. Natl. Acad. Sci. USA 2008, 105, 16201–16206. [Google Scholar] [CrossRef] [Green Version]
  58. McClanahan, T.R.; Kamukuru, A.T.; Muthiga, N.A.; Gilagabher Yebio, M.; Obura, D. Effect of sea urchin reductions to algae, coral and fish populations. Conserv. Biol. 1996, 10, 136–154. [Google Scholar] [CrossRef]
  59. Sammarco, P.W. Echinoid grazing as a structuring force in coral communities: Whole reef manipulations. J. Exp. Mar. Biol. Ecol. 1982, 61, 31–35. [Google Scholar] [CrossRef]
  60. Carpenter, R.C. Mass mortality of Diadema antillarum: 1. long-term effects on sea urchin population dynamics and coral reef algal communitites. Mar. Biol. 1990, 104, 67–77. [Google Scholar] [CrossRef]
  61. Hughes, T.P.; Reed, D.C.; Boyle, M.J. Herbivory on coral reefs: Community structure following mass mortalities of sea urchins. J. Exp. Mar. Biol. Ecol. 1987, 113, 39–59. [Google Scholar] [CrossRef]
  62. McClanahan, T.R. A coral reef ecosystem-fisheries model: Impacts of fishing intensity and catch selection on reef structure and process. Ecol. Model. 1995, 80, 1–19. [Google Scholar] [CrossRef]
  63. Norström, A.V.; Nyström, M.; Lokrantz, J.; Folke, C. Alternative states on coral reefs: Beyond coral-macroalgal phase shifts. Mar. Ecol. Prog. Ser. 2009, 376, 295–2009. [Google Scholar] [CrossRef]
  64. McClanahan, T.R.; Muthiga, N.A. Changes in Kenyan coral reef community structure and function due to exploitation. Hydrobiologia 1988, 166, 269–276. [Google Scholar] [CrossRef]
  65. Carreiro-Silva, M.; McClanahan, T.R. Echinoid bioerosion and herbivory on Kenyan coral reefs: The role of protection from fishing. J. Exp. Mar. Biol. Ecol. 2001, 262, 133–153. [Google Scholar] [CrossRef]
  66. Hughes, T.P.; Rodrigues, M.J.; Bellwood, D.R.; Ceccarelli, D.; Hoegh-Guldberg, O.; McCook, L.J.; Moltschaniwskyj, N.; Pratchett, M.S.; Steneck, R.S.; Willis, B.L. Phase shifts, herbivory, and the resilience of coral reefs to climate change. Curr. Biol. 2007, 17, 360–365. [Google Scholar] [CrossRef] [Green Version]
  67. Littler, M.M.; Littler, D.S. Assessment of coral reefs using herbivory/nutrient assays and indicator groups of benthic primary producers: A critical synthesis, proposed protocols. and critique of management strategies. Aquat. Conserv. Mar. Freschwater Ecosyst. 2007, 17, 195–215. [Google Scholar] [CrossRef]
  68. Unsworth, R.K.F.; Collier, C.J.; Henderson, G.M.; McKenzie, L.J. Tropical seagrass meadows modify seawater carbon chemistry: Implications for coral reefs impacted by ocean acidification. Environ. Res. Lett. 2012, 7, 7. [Google Scholar] [CrossRef]
  69. Hughes, T.P. Catastrophes, phase shifts, and large-scale degradation of a Caribbean coral reef. Science 1994, 265, 1547–1551. [Google Scholar] [CrossRef] [PubMed] [Green Version]
  70. Hendriks, I.E.; Olsen, Y.S.; Ramajo, L.; Basoo, L.; Steckbauer, A.; Moore, T.S.; Howard, J.; Duarte, C.M. Photosynthetic activity buffers ocean acidification in seagrass meadows. Biogeosciences 2014, 11, 333–346. [Google Scholar] [CrossRef] [Green Version]
  71. Nanami, A. Spatial distribution and feeding substrate of butterflyfishes (family Chaetodontidae) on an Okinawan coral reef. PeerJ 2020, 8, e9666. [Google Scholar] [CrossRef] [PubMed]
  72. Hoey, A.S.; Pratchett, M.S.; Cvitanovic, C. High macroalgal cover and low coral recruitment undermines the potential resilience of the world’s southermist coral reef assemblages. PLoS ONE 2011, 6, e25824. [Google Scholar] [CrossRef] [PubMed] [Green Version]
  73. Jennings, S.; Kaiser, M.J. The effects of fishing on marine ecosystems. Adv. Mar. Biol. 1998, 34, 203–352. [Google Scholar]
  74. Luckhurst, B.; Luckhurst, K. Estimating total abundance of a large temperate reef fish using visual strip-transect. Mar. Biol. 1987, 96, 469–478. [Google Scholar]
  75. Cole, A.J.; Pratchett, M.S.; Jones, G.P. Diversity and functional importance of coral-feeding fishes on tropical coral reefs. Fish Fish. 2008, 9, 286–307. [Google Scholar] [CrossRef]
  76. Darling, E.S.; Graham, N.A.J.; Januchowski-Hartley, F.A.; Nash, K.L.; Pratchett, M.S.; Wilson, S.K. Relationship between structural complexity, coral traits, and reef fish assemblages. Coral Reefs 2017, 36, 561–575. [Google Scholar] [CrossRef] [Green Version]
  77. Jones, G.P.; McCormick, M.I.; Srinivasan, M.; Eagle, J.V. Coral decline threatens fish biodiversity in marine reserves. Proc. Natl. Acad. Sci. USA 2004, 101, 8251–8253. [Google Scholar] [CrossRef] [PubMed] [Green Version]
  78. McClanahan, T.R. Kenyan coral reef lagoon fish: Effects of fishing, substrate complexity, and sea urchins. Coral Reefs 1994, 13, 231–241. [Google Scholar] [CrossRef]
  79. McClanahan, T.R.; Nugues, M.M.; Mwachireya, S. Fish and sea urchin herbivory and competition in Kenyan coral reef lagoons: The role of reef management. J. Exp. Mar. Biol. Ecol. 1994, 184, 237–254. [Google Scholar] [CrossRef]
  80. McClanahan, T.R. Recovery of a coral reef keystone predator, Balistapus undulatus, in East African marine parks. Biol. Conserv. 2000, 94, 191–198. [Google Scholar] [CrossRef]
  81. McClanahan, T.R.; Obura, D. Status of Kenyan coral reefs. Coast. Manag. 1995, 23, 57–76. [Google Scholar] [CrossRef]
  82. Watson, M.; Righton, D.; Austin, T.; Ormond, R. The effects of fishing on coral reef fish abundance and diversity. J. Mar. Biol. Assoc. United Kingd. 1996, 76, 229–233. [Google Scholar] [CrossRef]
  83. McClanahan, T.R.; Mwaguni, S.; Muthiga, N.A. Management of the Kenyan coast. Ocean. Coast. Manag. 2005, 48, 901–931. [Google Scholar] [CrossRef]
Figure 1. (A) Location of the study region on the southern Kenyan coast of East Africa; the scales indicate latitude south of the equator and longitude east of the prime meridian. Color on land indicates altitude. (B) Aerial image of Gazi Bay showing the location of the ten study sites: Chale 1 (C1), Chale 2 (C2), Doa Lower (DL), Doa Upper (DM), Kijamba Mkandi (KM), Kiziwa Kule (KZ), Kukuni (KK), Mikingamo (MG), Mikingamo 2 (ZM), Mwandamo (MD) (Satellite image © Google).
Oceans 03 00001 g001
Figure 2. Relationship of different substrate variables to coral genus richness and coral cover at the reefs in Gazi Bay. Black lines correspond to model prediction analysis, orange lines represent the estimates derived from multiple regression analysis. Coral genus richness decreased with increasing macroalgae (A) and seagrass cover (B). Coral cover increased with increasing herbivorous invertebrate abundance (C) and fish family richness (D). Grey data points show individual values on each of the 30 transects. The dashed line indicates that parameter estimates are only marginally significant (0.05 < p < 0.10).
Oceans 03 00001 g002
Figure 3. Relationship of different environmental factors to fish family richness and fish abundance. The orange lines represent the estimates derived from multiple-regression analysis. Fish family richness increases with increasing coral cover (A) and decreases with increasing invertebrate/sea urchin abundance (B). Fish abundance increases with increasing coral cover (C) and macroalgae cover (D). Grey dots show individual measures of response variables on the 30 transects.
Oceans 03 00001 g003
Table 1. Mean number of fish families per site ± standard deviation.
Chale 1Chale 2Doa LowerDoa UpperKijamba MkandiKiziwa KuleKukuniMikingamoMikingamo 2Mwandamo
Acanthuridae4.0 ± 2.60.00.00.018 ± 4.00.7 ± 1.26.0 ± 7.92.0 ± 1.76.0 ± 5.33.0 ± 1.7
Chaetodontidae4.3 ± 3.10.7 ± 1.20.00.3 ± 0.62.0 ± 1.71.0 ± 1.77.7 ± 7.12.0 ± 1.75.0 ± 5.01.7 ± 1.2
Ephippidae0.00.00.00.00.00.00.00.01.0 ± 1.70.0
Lutjanidae0.00.00.00.01.3 ± 2.30.01.0 ± 1.70.00.00.7 ± 1.2
Pomacanthidae 0.00.00.00.00.00.00.00.00.00.3 ± 0.6
Scaridae0.00.00.00.00.00.00.3 ± 0.60.01.3 ± 1.20.0
Siganidae0.00.00.00.00.00.00.00.00.3 ± 0.60.3 ± 0.6
Table 2. Mean number of coral colonies for different genera per site ± standard deviation.
Chale 1Chale 2Doa LowerDoa UpperKijamba MkandiKiziwa KuleKukuniMikingamoMikingamo 2Mwandamo
Acanthastrea0.000.000.000.000.000.000.000.33 ± 0.580.000.67 ± 0.58
Acropora0.004.33 ± 1.152.00 ± 1.004.00 ± 2.0014.00 ± 6.563.00 ± 1.731.33 ± 1.533.33 ± 3.062.007.33 ± 7.77
Astreopora0.001.00 ± 1.733.00 ± 1.003.67 ± 2.520.000.33 ± 0.581.00 ± 1.731.00 ± 1.001.33 ± 1.730.33 ± 0.58
Diploastrea0.000.000.000.000.000.000.33 ± 0.580.000.000.00
Echinopora0.33 ± 0.581.33 ± 0.581.33 ± 1.530.000.33 ± 0.580.001.67 ± 2.080.001.00 ± 1.733.33 ± 4.04
Favia0.67 ± 1.155.33 ± 1.530.000.000.67 ± 0.580.33 ±0.580.002.00 ± 2.650.001.33 ± 1.15
Favites0.001.33 ± 1.151.33 ± 1.150.33 ± 0.581.00 ± 1.731.67 ± 2.080.33 ± 0.582.67 ± 1.530.67 ± 0.580.67 ± 0.58
Fungia0.000.000.000.003.00 ± 5.200.003.33 ± 2.521.00 ± 1.730.000.33 ± 0.58
Galaxea2.33 ± 1.151.67 ± 1.530.67 ± 1.151.00 ± 1.0019.33 ± 8.080.33 ± 0.582.33 ± 2.080.33 ± 0.580.67 ± 0.580.00
Goniastrea0.000.000.000.000.000.000.000.000.000.00
Goniopora1.67 ± 1.532.67 ± 1.151.00 ± 1.000.000.000.000.33 ± 0.584.67 ± 1.532.33 ± 3.210.67 ± 1.15
Hydnophora0.000.000.33 ± 0.580.000.33 ± 0.580.67 ± 0.580.67 ± 0.580.33 ± 0.580.000.00
Leptoria0.002.67 ± 1.150.000.000.000.000.000.000.33 ± 0.580.00
Lobophyillia0.000.000.000.000.000.000.000.000.000.00
Millepora0.000.000.000.000.000.000.000.000.000.00
Montipora2.0 ± 1.731.33 ± 1.530.67 ± 0.580.001.00 ± 1.730.33 ± 0.580.33 ± 0.581.67 ± 1.152.00 ± 1.000.00
Pavona0.000.000.33 ± 0.580.000.000.000.67 ± 1.151.00 ± 1.000.003.00 ± 2.00
Platygyra0.001.33 ± 1.150.67 ± 0.580.000.67 ± 1.150.67 ± 0.581.00 ± 1.152.67 ± 0.580.002.67 ± 3.29
Plesiastrea0.001.00 ± 1.000.67 ± 0.580.000.000.000.000.001.33 ± 0.580.00
Pocillopora0.001.000.33 ± 0.581.33 ± 0.5812.67 ± 3.211.67 ± 2.081.67 ± 1.150.67 ± 1.150.67 ± 0.587.00 ± 6.00
Porites (Branching)0.000.000.33 ± 0.580.001.33 ± 1.150.000.000.000.67 ± 1.154.33 ± 5.13
Porites (Massive)0.004.67 ± 0.5816.67 ± 1.5310.67 ± 4.730.001.33 ± 1.150.67 ± 0.5817.33 ± 8.0816.00 ± 9.174.33 ± 2.52
Seriatopora0.000.000.000.33 ± 0.580.33 ± 0.580.000.000.33 ± 0.580.33 ± 0.580.00
Stylophora0.000.000.000.67 ± 0.580.000.003.00 ± 1.734.33 ± 5.861.00 ± 1.000.00
Symphilla0.000.000.000.000.000.000.000.000.000.00
Table 3. Percentage cover of the benthos per site ± standard deviation.
Chale 1Chale 2Doa LowerDoa UpperKijamba MkandiKiziwa KuleKukuniMikingamo 1Mikingamo 2Mwandamo
AHAL0.27 ± 0.460.000.27 ± 0.460.000.27 ± 0.460.81 ± 1.400.57 ± 0.960.001.39 ± 2.410.00
AMAC56.15 ± 0.7619.67 ± 11.412.68 ± 1.215.50 ± 1.3162.51 ± 5.5262.74 ± 9.4841.20 ± 16.855.91 ± 3.573.74 ± 1.6814.76 ± 17.35
ATRF33.27 ± 1.8951.48 ± 15.0732.45 ± 8.4746.41 ± 16.8314.67 ± 2.4618.63 ± 8.5926.97 ± 20.5963.63 ± 5.9154.50 ± 13.9528.31 ± 7.56
BS0.000.000.000.56 ± 0.960.000.003.56 ± 3.380.28 ± 0.480.000.00
HC0.53 ± 0.924.32 ± 1.8914.22 ± 0.372.18 ± 1.7210.73 ± 6.050.53 ± 0.928.33 ± 3.581.34 ± 1.6610.47 ± 6.7816.28 ± 8.56
DC0.000.000.000.000.000.001.40 ± 2.420.000.000.00
URC0.001.34 ± 1.243.77 ± 3.082.53 ± 2.281.89 ± 1.680.27 ± 0.461.88 ± 3.258.31 ± 8.372.22 ± 0.970.53 ± 0.92
RDC0.000.000.000.000.000.003.35 ± 5.802.70 ± 4.680.000.00
RUB0.000.54 ± 0.947.78 ± 1.713.89 ± 3.944.84 ± 4.473.49 ± 1.220.004.83 ± 5.2410.46 ± 13.9512.10 ± 10.67
SND5.39 ± 5.1915.94 ± 7.0128.53 ± 13.1516.45 ± 8.690.007.03 ± 3.274.63 ± 7.3410.04 ± 9.8715.04 ± 7.347.37 ± 7.03
SGR3.06 ± 5.295.07 ± 2.318.91 ± 6.9921.66 ± 20.034.27 ± 3.786.22 ± 0.889.23 ± 9.290.000.80 ± 1.3916.03 ± 13.00
SC1.33 ± 1.221.62 ± 1.411.39 ± 2.410.83 ± 1.440.81 ± 0.800.27 ± 0.460.000.27 ± 0.460.58 ± 0.501.33 ± 2.31
UNID/OT0.000.000.000.000.000.000.29 ± 0.500.000.80 ± 1.393.29 ± 1.67
OBS/TWS1.33 ± 0.460.80 ± 0.801.07 ± 0.462.93 ± 1.670.53 ± 0.461.33 ± 0.922.67 ± 1.221.07 ± 1.221.87 ± 1.671.07 ± 0.46
Table 4. Results of the AIC C based model selection for the environmental variables coral genus richness (CGR) and coral cover (CA), using the predictor variables AMAC (macroalgae), ATRF (turf algae), FABUND (fish abundance), FFM (fish family richness), Lg1(INV) (log-transformed herbivorous invertebrate abundance), and SGR (seagrass). ‘*’ p < 0.05; ‘**’ p < 0.01; ‘.’ 0.05 < p < 0.10. Successive lines show the results for the best supported, and second- and third-best supported models.
ResponseAMACATRFFABUNFFMLg1(INV)SGR A I C C R2
CGR−0.5676 ** −0.3010 .146.10.3581
−0.8815 **−0.4119 −0.4850 *146.20.4139
−0.5195 ** 147.30.2698
CA 0.3333 *0.3908 *0.5389 ** 247.00.3573
−0.1330 0.4886 ** 248.60.3211
0.3968 *0.6091 ** 249.30.3702
Table 5. Results of the AIC C based model selection for fish family richness (FFR) and fish abundance (FA) using the key predictor variables AMAC (macroalgae), ATRF (turf algae), CA (coral cover), Lg1(INV) (log-transformed invertebrate abundance), and SGR (seagrass). ‘*’ p < 0.05; ‘.’ 0.05 < p < 0.10. Successive lines show the results for the best supported, and second- and third-best supported models.
ResponseAMACATRFCALg1(INV)SGR A I C C R2
FFR 0.4747 *−0.4291 * 98.40.21930
0.4238 *−0.4498 *−0.205699.80.25690
0.2809 100.60.07892
FA0.3562. 0.3557. 217.20.20680
−0.3186 . −0.3737 .218.80.16360
0.2908 218.80.08457
Publisher’s Note: MDPI stays neutral with regard to jurisdictional claims in published maps and institutional affiliations.

