Article

A Conflict between the Legacy of Eutrophication and Cultural Oligotrophication in Hiroshima Bay

1
Graduate School of Biosphere Science, Hiroshima University, 1-4-4 Kagamiyama, Higashi-Hiroshima 739-8528, Japan
2
Fukken Co., Ltd., 2-10-11 Hikarimachi, Higashi-Hiroshima 732-0052, Japan
3
Graduate School of Integrated Arts and Sciences, Hiroshima University, 1-7-1 Kagamiyama, Higashi-Hiroshima 739-8521, Japan
*
Author to whom correspondence should be addressed.
Current Address: Center for Restoration of Basin Ecosystem and Environment (CERBEE), 4-3-13 Takaya-Takamigaoka, Higashi-Hiroshima 739-2115, Japan.
Oceans 2021, 2(3), 546-565; https://doi.org/10.3390/oceans2030031
Submission received: 30 December 2020 / Revised: 4 August 2021 / Accepted: 10 August 2021 / Published: 16 August 2021

Abstract

:
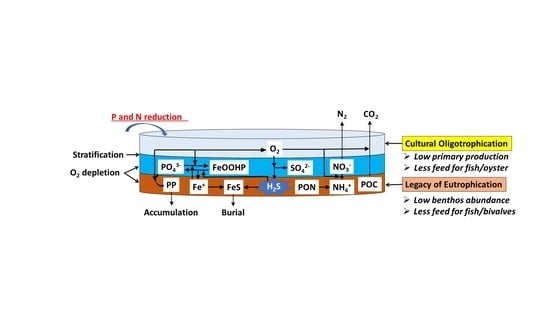
Although the water quality in Hiroshima Bay has improved due to government measures, nutrient reduction has sharply decreased fisheries production. The law was revised in 2015, where the nutrient effluents from the sewage treatment plants were relaxed, yet no increase in fishery production was observed. Herein, we investigate the distribution of C, N, S, and P within Hiroshima Bay. Material loads from land and oyster farming activity influenced the C and S distributions in the bay sediments, respectively. Natural denitrification caused N reduction in areas by the river mouths and the landlocked areas whose sediments are reductive. The P content was high in the areas under aerobic conditions, suggesting metal oxide-bound P contributes to P accumulation. However, it was low in the areas with reducing conditions, indicating P is released from the sediments when reacting with H2S. In such reductive sediments, liberated H2S also consumes dissolved oxygen causing hypoxia in the bottom layer. It was estimated that 0.28 km3 of muddy sediment and 1.8 × 10⁵ ton of P accumulated in Hiroshima Bay. There remains conflict between the ‘Legacy of Eutrophication’ in the sediment and ‘Cultural Oligotrophication’ in the surface water due to 40 years of reduction policies.

Graphical Abstract

1. Introduction

Estuaries function as filters/traps or removal devices for nitrogen (N) and phosphorus (P) to the offshore [1]. At the river mouth, flocculation of colloidal iron oxides occurs upon the mixing of riverine freshwater and seawater, and orthophosphate is trapped as Fe(III) (oxyhydr)oxides-P and sedimented on the bottom [2]. In addition to this chemical process, particulate matter tends to be sedimented at the innermost area of estuary due to estuarine circulation, which is induced by river discharge [3,4]. Phytoplankton grows by taking up nutrients supplied from land through rivers and other point sources and the sea. Phytoplankton will sink to the bottom as dead cells or feces of filter feeders along with other particulate matter. In the succession of mineralization on and in the sediments, organic-bound P can be liberated, and orthophosphate is taken up by phytoplankton and bacteria again in the water column. This is one main framework of the filtering or trapping function of P in estuarine systems.
However, the P cycle in the sediments and overlying water is much more complex. Iron phosphate is formed in rich Fe and phosphate conditions. Fe(III) (oxyhydr)oxides form at the oxic/anoxic boundary between sediment and overlying water [5]. During oxygen consumption via decomposition of organic matter supplied from the upper water column, Fe and P are released to the bottom of the water column. In anoxic sediments under non-sulfide conditions, such as lakes, ferrous phosphate may significantly contribute to P retention in the sediments [6]. However, the production of H2S in reducing sediments in estuaries counteracts the functioning of Fe(III) (oxyhydr)oxides in trapping P by forming iron sulphides (FeSx) instead [7]. Simultaneously, Fe(III) (oxyhydr)oxides-P may undergo reductive dissolution in the presence of S2− and release orthophosphate [8]. Subsequently, the increased liberation of orthophosphate, Fe2+ and Mn2+ over long periods forms authigenic phosphorites known as apatite [9,10,11] and vivianite [12,13,14,15]. Thus, in general, P is permanently removed from the water column and buried in the sediment, and not all sedimented P returns to the water column [16,17,18]. The importance of each diagenetic process is different in different areas and sites, depending on the depositional environment, sedimentation rate, and prevailing redox conditions [5].
N is removed in estuaries. The main pathway of N removal is denitrification, accounting for ~50% of N loaded through rivers [19,20,21,22], while anaerobic ammonium oxidation (anammox) and burial in sediments are negligible [23]. Nitrification can be the major nitrate source for denitrification, supplying >80% of the nitrate demand in the St. Lawrence Estuary [24,25]. When the bottom is always reductive with no nitrate supply, denitrification depends on riverine nitrate supply or oxic seawater intrusion, as observed in Lakes Shinji and Nakaumi, Japan [26]. Under anoxic conditions and during bottom water hypoxia, dissimilatory nitrate reduction to ammonium (DNRA) competes with denitrification, and it may recycle the N in the system and contribute to an increase in primary production [27,28,29,30,31,32]. This varies across different areas and sites depending on the level of eutrophication; the ratio of nitrate to organic matter is a primary factor which overcomes denitrification or DNRA in the system [33]. Furthermore, the presence of reduced sulfur in the sediments also influences denitrification, DNRA [34], and coupled nitrification-denitrification [35]. Furthermore, a larger fraction of nitrate can sometimes be retained in the system in the presence of sulfides [27,35]. Overall, estuaries can work naturally as N removal devices and phosphorus traps.
The Japanese government established the ‘Law Concerning Special Measures for Conservation of the Environment of the Seto Inland Sea’ in 1978, following its predecessor, the ‘Law Concerning Tentative Measures for Conservation of the Environment of the Seto Inland Sea’ in 1973 [36]. As part of the measures taken for the implementation of this law, reductions in P and N contents in discharge water from all workplaces/factories, which discharge >50 ton day−1 of water, began in 1980 and 2005, respectively. Thus, the long-term reduction of nutrients (40 years for P and 15 years for N) has successfully contributed to improving the water quality, as evidenced by the apparent increase in water transparency [37]. However, such simple reductions of P and N do not render the desired effect to the Seto Inland Sea ecosystem because the response of the ecosystem often shows non-linearities characterized by hysteresis [38,39,40,41]. Fishery production in the Seto Inland Sea has sharply decreased with decreasing primary production since the late 1980s without tracing the same trajectory as it had traveled during the eutrophication period [41].
In Hiroshima Bay, which is in the western part of the Seto Inland Sea, oyster culture has been conducted intensively for more than 60 years, accounting for 60% of the total production in Japan [42]. However, the oyster production in the bay is in a crisis due to the lack of feed phytoplankton, and recently, it has been observed that the oyster larvae cannot survive due to the lack of small-sized phytoplankton (<5 μm in diameter) suitable for their feed [43]. In contrast, oysters, through their feeding activity, stimulate biogeochemical processes in the sediments by increasing the sedimentation of organic matter from the water column [44,45]. Therefore, the sediment quality is muddy and contains vast amounts of refractory organic matter which have been historically deposited from the oyster culture via both oyster feces and dead oyster meat, and organisms attached on the shells sink to the bottom. In the sediment of such reduced conditions, sulfide is produced along with the anaerobic decomposition of refractory organic matter. Therefore, acid volatile sulfide (AVS), water content (WC), and ignition loss (IL) of the sediment are higher in the Hiroshima Bay compared to the neighboring area with less aquaculture activity [46]. Oxygen depletion in the bottom layer (hypoxia) is still observed even after 40 years of the P reduction measure. This can be attributed to the oxygen consumption by reductive substances such as sulfide produced in the sediment, not by freshly produced organic matter decomposition. This can be referred to as a ‘Legacy of Eutrophication’ or ‘Legacy of Hypoxia’, which has been referenced in the previous studies [47,48,49,50]. That is, H2S and other reductive matter produced in the anaerobic sediment, in which an abundance of refractory organic matter accumulated in the bottom sediments during the former eutrophication period, consume the bottom dissolved oxygen (DO) and liberate phosphate into the bottom water even several decades after the peak eutrophication period.
The fisheries production has been decreasing since the 1980s when the measure was implemented [41]. All kinds of bioproduction, not only seaweed culture, bivalve culture, and capture fisheries, have apparently decreased [41,51,52]; the fish catch and shellfish production in the Seto Inland Sea in 2014 was one-third and one-sixth of their peaks in 1980s and 1970s, respectively. Therefore, the central government revised the above-mentioned law in 2015 [53]. The major revision was the relaxation of nutrient removal from sewage treatment water. However, no signs of improvement in any aquaculture production and capture fisheries were observed until 2021. The challenge in the Seto Inland Sea including Hiroshima Bay is a ‘conflict’ between the ‘Legacy of Eutrophication’ of the sediments and ‘Cultural Oligotrophication’ of the surface water by the excess nutrient reduction, taken as the measure to improve eutrophication. The sediment quality of the Seto Inland Sea, including those in Hiroshima Bay, have been surveyed thrice thus far by the government [54,55,56] with the standard methods [57]; however, there are few analyses and discussions in relation to fishery production.
In this study, we investigate the sediment quality in Hiroshima Bay, describe the differences in the distribution patterns of sediment carbon (C), N, P, and sulfur (S) contents, and discuss the possible causes of the distribution patterns of these elements in the sediments from physical, chemical, and biological process perspectives. A discussion on the conflict between the eutrophic sediment state and the oligotrophic surface water condition, which has been induced by the long-term nutrient reduction measures is also presented.

2. Materials and Methods

2.1. Characteristics of Hiroshima Bay

Hiroshima Bay is in the western part of the Seto Inland Sea, Japan. A strict nutrient reduction measure of P and N for the Seto Inland Sea has been mandated by the government since 1980 and 1995, respectively. Both the total phosphorus (TP) and total nitrogen (TN) discharge loads in 2014 were approximately 1/2 of their peak loads of in 1976 and 1994, respectively [52]. Oyster culture is intensively conducted in the bay, producing ~60% of the total production in Japan [42]. Although the nutrients transported from the land well cherished the oyster production through feed phytoplankton growth in the bay, the nutrient reduction measure strongly damaged the oyster production, resulting a decrease in oyster production of fresh meat to 1.6–2.0 × 10⁴ ton yr−1 in recent years from the peak production of 3 × 10⁴ ton yr−1 in 1986 [42]. While cultured oysters may suppress excess phytoplankton blooms by their feeding activity, the biodeposits deteriorate the sediment quality [44]. In addition to feces, pseudofeces, dead oysters, and other creatures grown on the raft culture system sink onto the bottom when farmers are handling the oysters, deteriorating the sediment quality. Thus, the sediment quality of the bay is poor compared to that of the neighboring area in terms of oxidation-reduction potential (ORP), IL, and AVS [46].
Hiroshima Bay has an area of 1043 km2, average depth of 25.8 m, volume of 26.9 × 10⁹ m3, and catchment area of 3743 km2 [36]. It is geographically divided into two areas: the northern Hiroshima Bay (nHB), north of the narrow strait (Nasabi Strait) between Itsukushima Island and Etajima Island, and the southern Hiroshima Bay (sHB), south of the channel (Figure 1). The nHB area is 141.2 km2, excluding Etajima Bay and Kure Bay, and the remaining is that of sHB [58]. In nHB, pronounced stratification is established due to large freshwater input from the Ohta River system; the average total discharge including the other small rivers is 7.5 × 10⁶ m3 day−1 and the contribution of the Ohta River is ~90% [58]. The freshwater residence time in nHB is estimated to be 27 d in the study [58]. Thus, the stratification is a ‘halocline,’ ultimately reducing vertical mixing [58], thereby contributing to the expansion of hypoxia in the bottom layer [59]. The freshwater from the Ohta River system entrains approximately seven times volume saline bottom water on average from the sHB [58], which may transport both suspended and resolved matter from the sHB. Meanwhile, stratification of the water column is not as strong in sHB, except the western part where there is freshwater input from the Nishiki River and the Oze River (Figure 1). Kure Bay and Etajima Bay are stagnant; therefore, hypoxia with DO concentration <2 mg L−1 in the bottom water is observed in September in these bays in addition to the innermost area of nHB [59].

2.2. Field Observations

Field observations were conducted during a research cruise at 14 stations in nHB and 18 stations in sHB during 5–8 October 2010 (Figure 1). The thickness of muddy sediments in Hiroshima Bay was monitored throughout the cruise at a ship speed of 4–5 knots, using a sounding device (SH-20, Senbon Electric Co., Ltd., Numazu, Japan) emitting two acoustic frequency beams (15 and 200 kHz) [60]. As the device is graduated in 10 cm intervals, we measured 1 cm between the tick by the eyes. The sediment thickness data was used to estimate the accumulated P amounts in the sediments in Section 2.4.
At every station, five sediment core samples were collected using a KK-type core sampler with an acrylic tube inner diameter of 4.8 cm. Three of the sediment cores were selected for analyses based on their appearance and lack of artificial disturbance. First, the overlying water temperature was measured with a bar thermometer. The temperature range was small, between 22.7 (Stations 24 and 32) and 25.8 °C (Stations 10 and 19) because the water column had already mixed vertically due to surface cooling. After measuring the overlying water temperature, the core samples were sliced at 5-cm intervals from the surface to 20 cm depth, and at 10-cm intervals below this until the depth that the sediment was collected with the device was reached. The slicing of the sediment core samples was rapidly performed on the ship deck after the sediments were collected at each station. Although the surface of the sediment may have partially oxidized during the slicing process, we aimed to not oxidize the sediments by storing each sediment sample in a gas-tight plastic container 7.8 cm in diameter and 4.6 cm tall and placed them in a dark, cool (0–5 °C) container filled with nitrogen gas until various analyses are conducted. Sediment core sample collection failed at Station 5 because the bottom was composed of sandy sediments.

2.3. Chemical Analyses

Immediately after sediment core sampling, the ORP was measured for the samples collected from 0–5 cm using an ORP meter (PS-112C, DKK-TOA Corp., Tokyo, Japan). Temperature was recorded using the ORP meter. The Eh value was calculated from the ORP and temperature values, where Eh (mV) = ORP (mV) + 206 − 0.7 (t − 25). The AVS concentration was determined with a detection tube (Hedrotech-S, Gastech Corp.) for the sediment samples collected from 0–5 and 5–10 cm [61]. By adding acid to the sediment sample, H2S gas was detected as the color of the reagent in the test tube changed (brown); H2S + Pb(CH3COO)2 (white) → PbS (brown) + 2CH3COOH. The detection limit of the detection tube was 0.0002 mg, and the Coefficient of variation (CV) was 5%. Here, AVS is an operationally defined property that is the H2S evolved from the acid leaching of sediment. A detail review on what compounds are measured by the acid leaching method of AVS is described in the literature [62]. Dividing sediment into aqueous phase and solid phase, the major dissolved species in AVS are HS, H2S, and the aqueous FeS under the condition of reduced sediments with pH < 7. In the solid phase of sediment, FeS2 (pyrite) may not contribute to AVS. Notably, part of the FeS in the aqueous phase consists of nanoparticles of mackinawite due to sample handling usually through a 0.2 μm pore size filter. The hydrogen sulfide (H2S) concentration was determined with a detection tube (Kitagawa-type, Komyo Rikagaku, 200SA, 200SB, Kawasaki, Japan; detection limit 0.1 mg L−1, accuracy ± 15%) [63] for the interstitial water of sediment core samples collected from 0–5 and 5–10 cm after centrifugation at 3000 rpm for 15 min. The head space of the centrifugation tube was filled with nitrogen gas, and both AVS and H2S analyses were conducted within 3 min to minimize oxidation of the sample. This quick measurement procedure does not give significant results [64]. The detection tube was calibrated beforehand by H2S standard solution by dissolving an aliquot of Na2S9H2O (Nacalai Tesque, Kyoto, Japan) in 3% NaCl solution to correct a salinity error. The H2S oxidation rate is dependent on the initial concentration of H2S and salinity but not on water temperature and pH [64].
All sediment samples were stored in a cool (0–5 °C) dark box and brought back to the land laboratory. After thoroughly mixing each sample with a spatula, the mud wet density (g cm−3) was determined using a weighing balance. The sample dry weight was determined after drying the wet mud samples for 12 h at 110 °C in an oven. The WC (%) of each mud sample was determined as the difference between the wet and dry weights. The dried mud samples were combusted at 600 °C in a muffle furnace for 4 h and weighed again. IL was determined as the difference in weights before and after combustion [65].
After adding 2N HCl solution to a portion of the dried mud sample to remove inorganic carbon, samples were dried, and total organic carbon (TOC), TN, and total sulfur (TS) were determined using a CHN analyzer (CHNS/0 2400II, Perkin Elmer, Waltham, MA, USA). The TP was determined using an inductively coupled plasma-atomic emission spectroscopy (ICP-AES, Optima 7300DV, Perkin Elmer; The Ministry of the Environment of Japan [57]) with a detection limit of 0.1%. The measurements were conducted in duplicate in the first run, and then the second run was taken place in case the two values in the first run are apart. We adopted the average value of the two closest values.

2.4. Estimation of the Sediment P Content

First, we created a depth contour map showing the thickness of muddy sediments. All the depths of the surface muddy sediment measured with the acoustic device were characterized by WC (average: 61.4% +/− standard deviation: 3.6%) and IL (average: 9.90% +/− standard deviation: 0.91%). Here, the data were selected for 18 stations where the demarcation between the soft, muddy surface sediment and the hard sediment below it was clear. The demarcation level was used to estimate the thickness of the surface muddy sediment in the other stations.
Then, the mud volume (m3) was calculated by multiplying the area (m2) of every 5-cm-thick sample. A horizontal distribution map of each element concentration was produced at 5-cm depth intervals, and areas (m2) with the same concentration were summed. Then, total amount of P in the Hiroshima Bay sediments was estimated using the area (m2), average concentration (mg g−1), mud wet density (g cm−3), and thickness of each layer.

3. Results

3.1. Sediment C, N, S, and P Contents

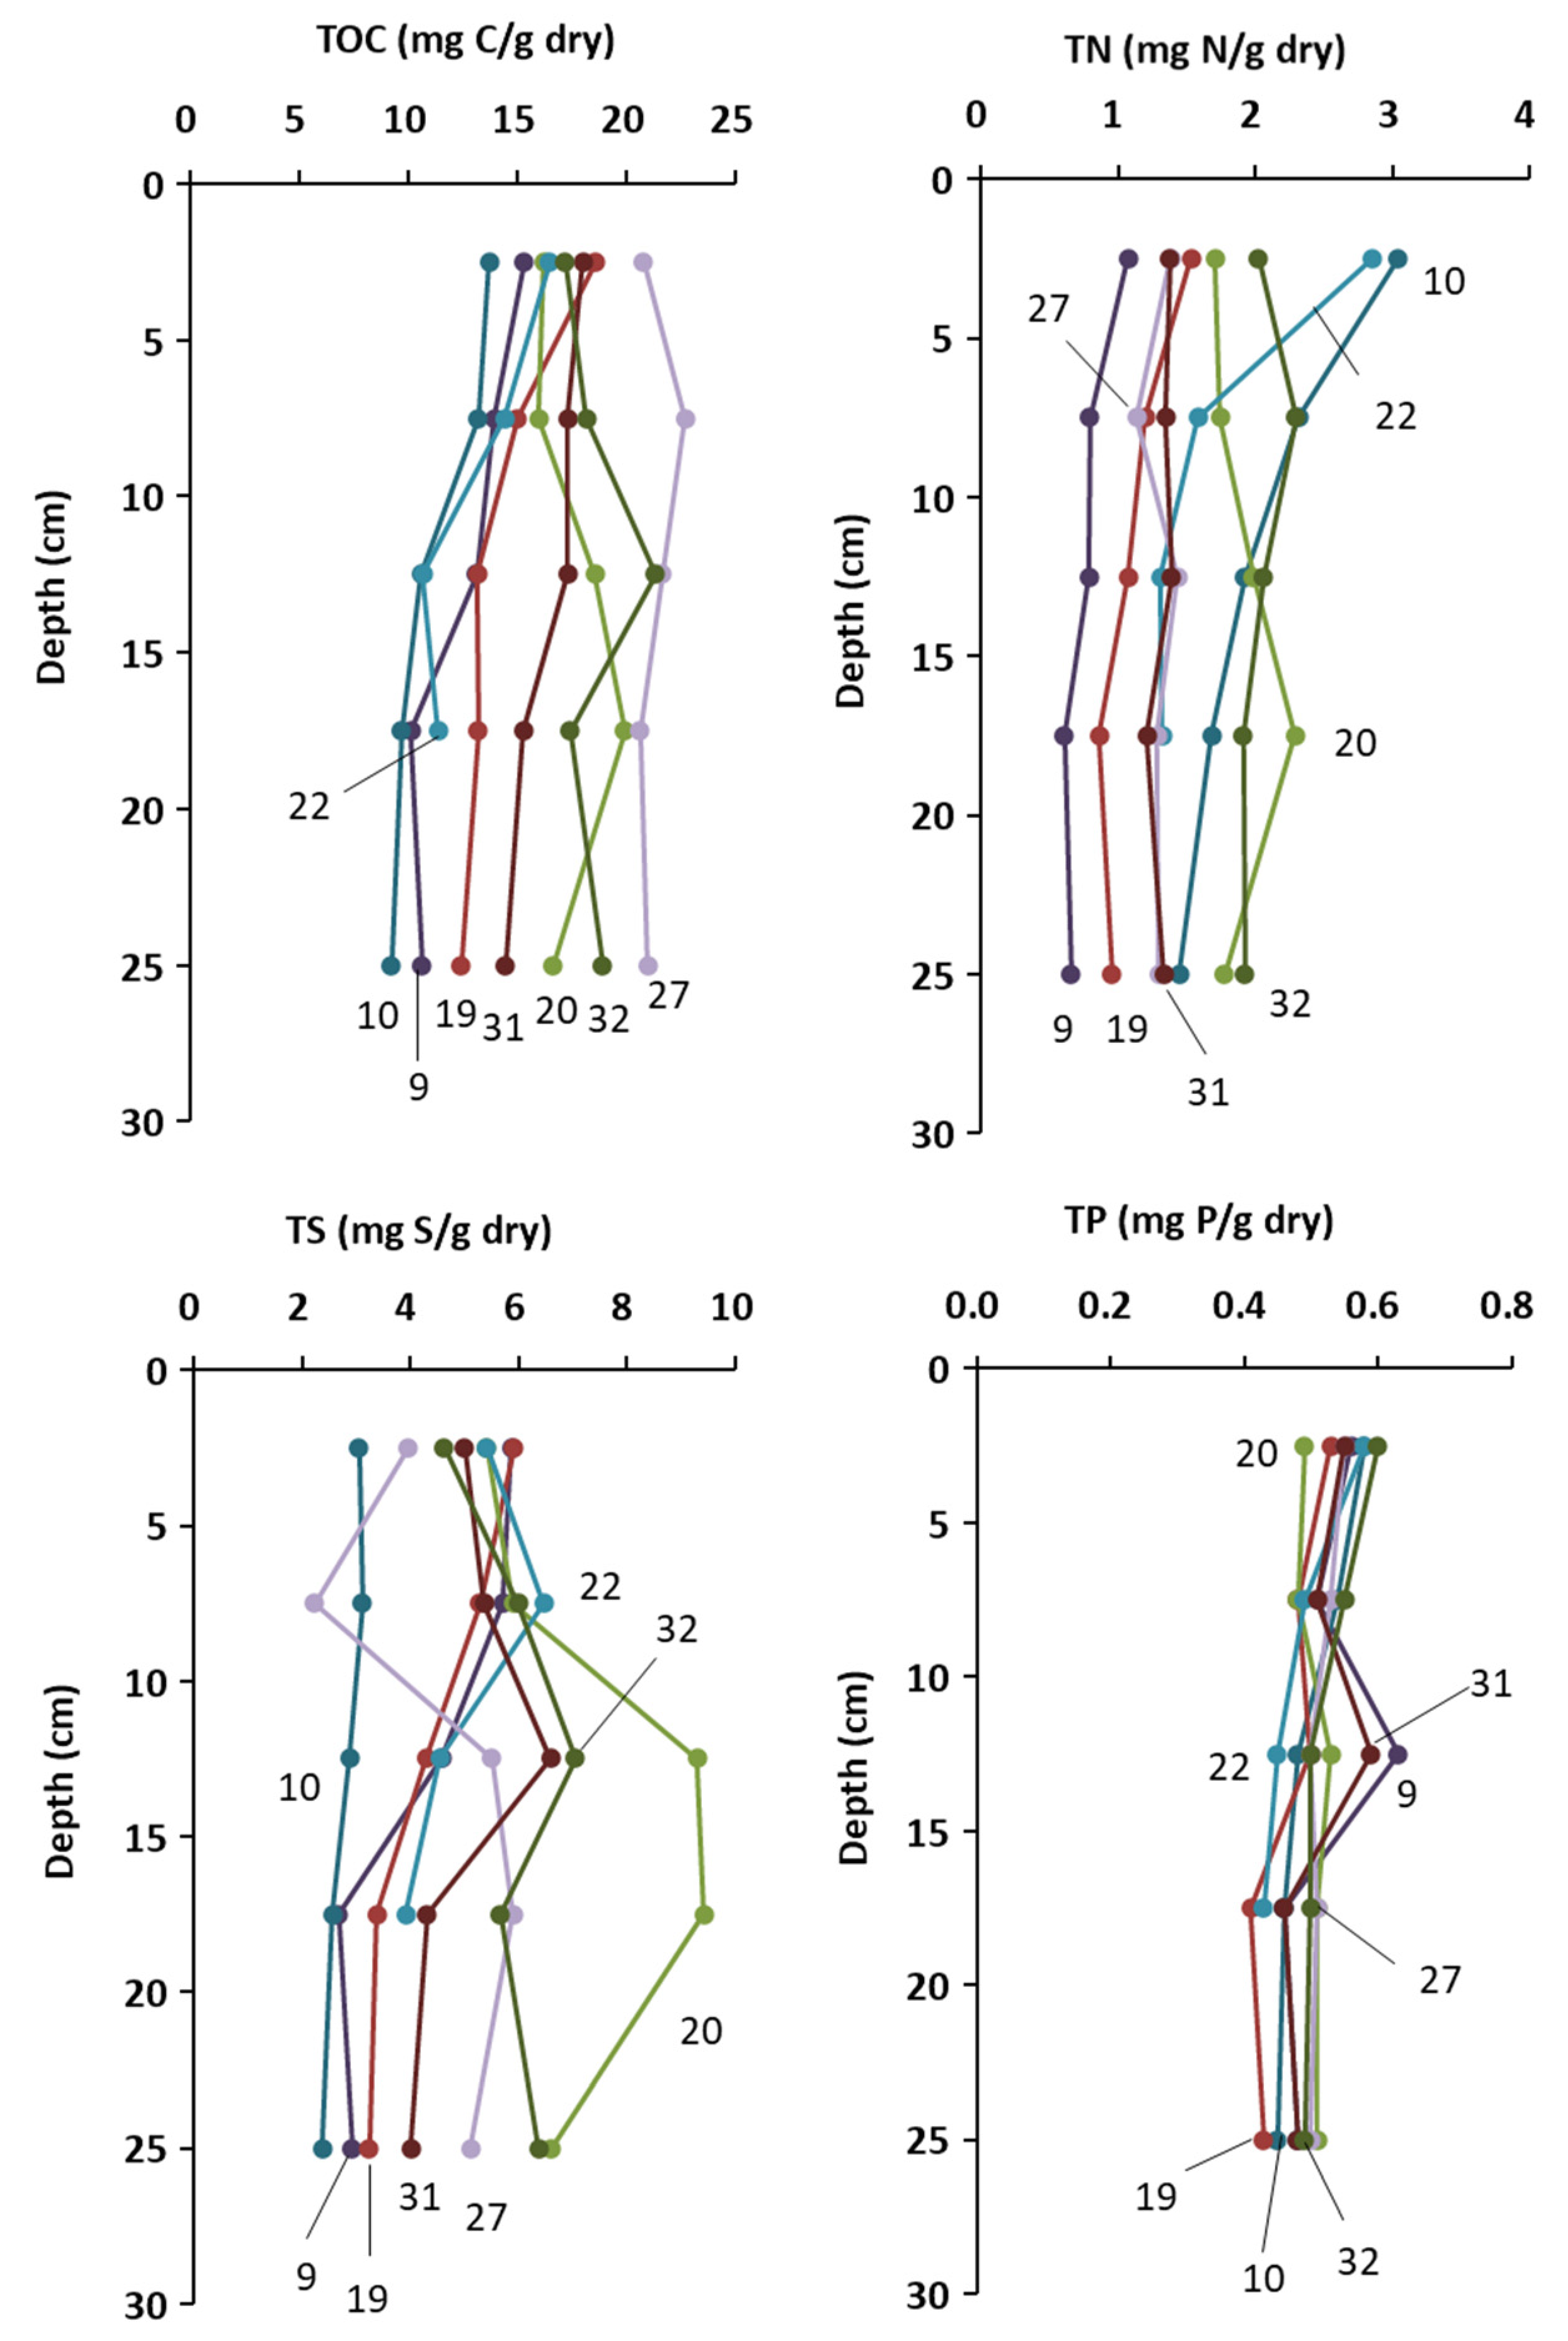
Vertical profiles and horizontal distributions of TOC, TN, TS, and TP are illustrated in Figure 2, Figure 3, Figure 4, Figure 5 and Figure 6. The vertical profiles of each element showed high values in the surface layer and decreased gradually with depth (Figure 2). Only the TS content was high in the depth of 10–20 cm at the Ohta River mouth (Station 27) and Kure Bay (Stations 31 and 32). The average values, standard variations, and coefficient of variations are summarized in Table 1. In the average value in the table, only TS has a peak value at 10–15 cm depth. Small variation in the vertical profile of TP values was clear (Figure 2), which is evidenced by the low CV (6–11%) as summarized in Table 1.
TOC was high in nHB, particularly at the Ohta River mouth (Stations 27) with the highest value (>20 mg g dry−1) followed by Etajima Bay (Station 20) and Kure Bay (Station 32) with values ~15–20.0 mg g dry−1 (Figure 2 and Figure 3). In sHB, TOC was slightly high in the western part, where the Nishiki River water enters, with values of 10–15 mg g dry−1 (Figure 3) which were high at the surface (Figure 2).
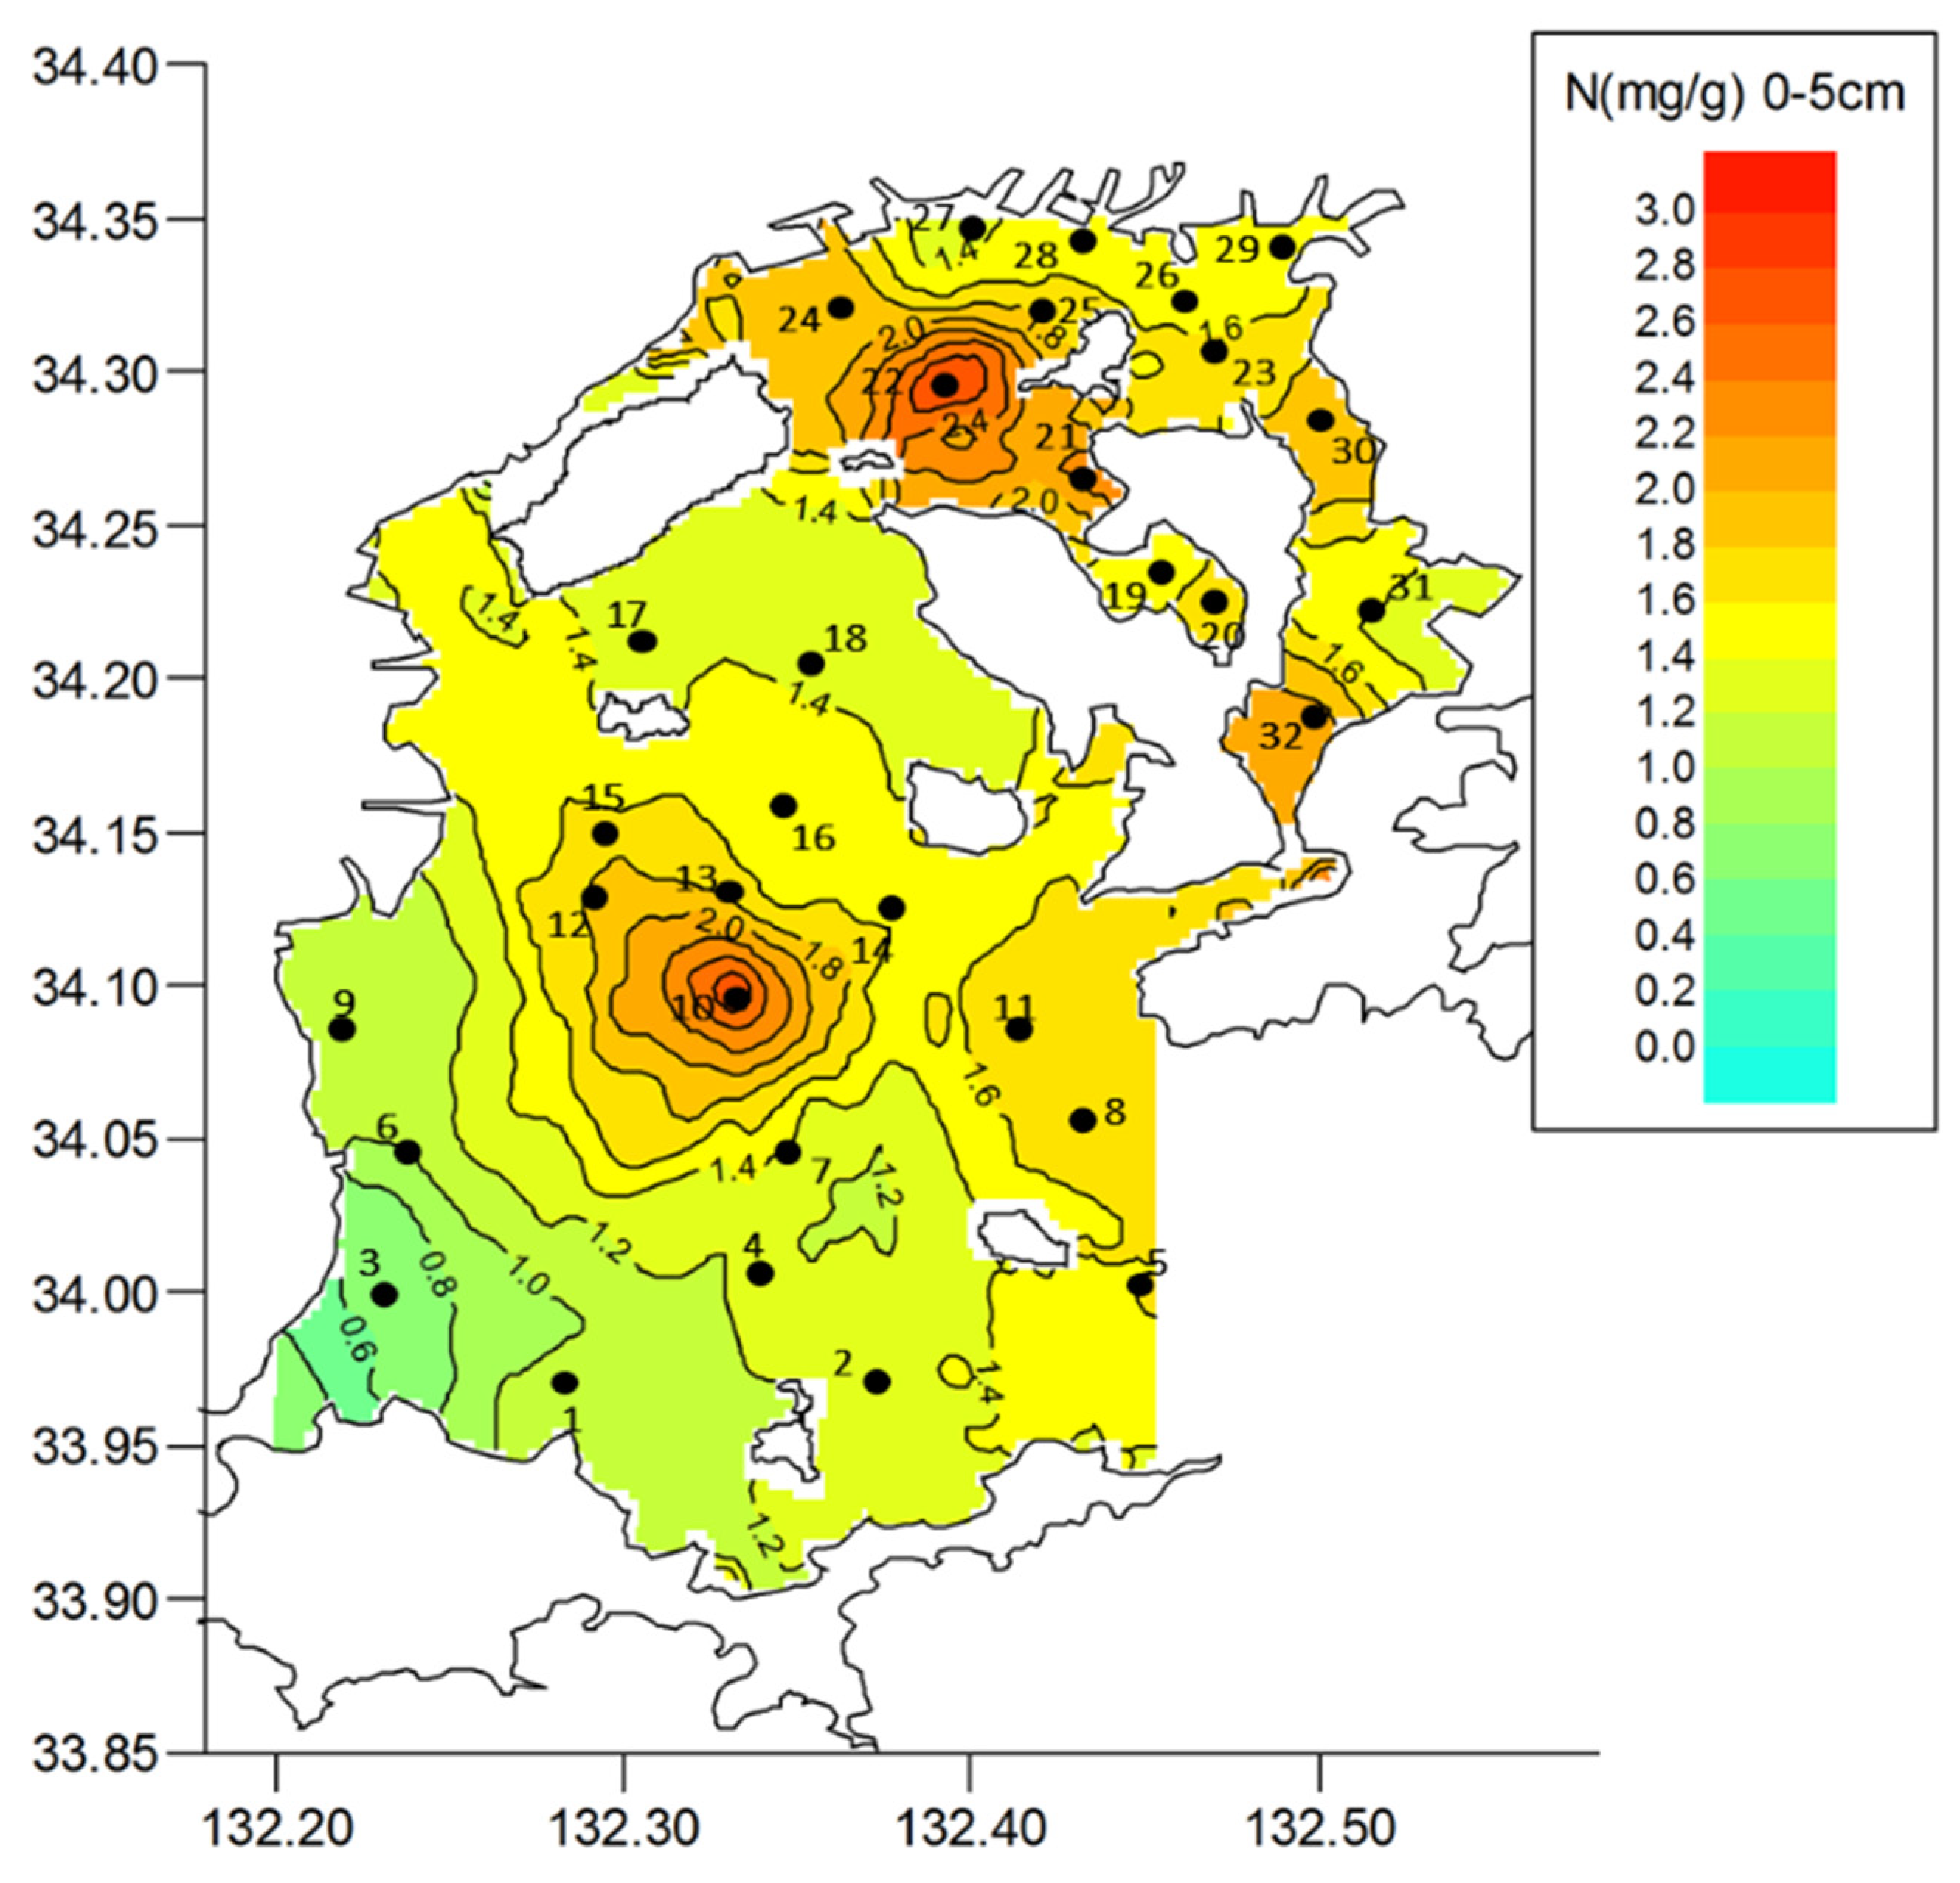
The highest TN values were observed in the central area, both in nHB (2.9 mg g dry−1 at Station 22) and sHB (3.0 mg g dry1 at Stations 10) as shown in Figure 4. However, it showed lower values (1–2 mg g dry1) below the surface (Figure 2). In contrast, the values at the Ohta River mouth (Station 27) and the Nishiki River mouth (Station 9) were <1.5 mg g dry−1, as shown in Figure 2 and Figure 4, which were different from the distribution of TOC, as shown in Figure 3.
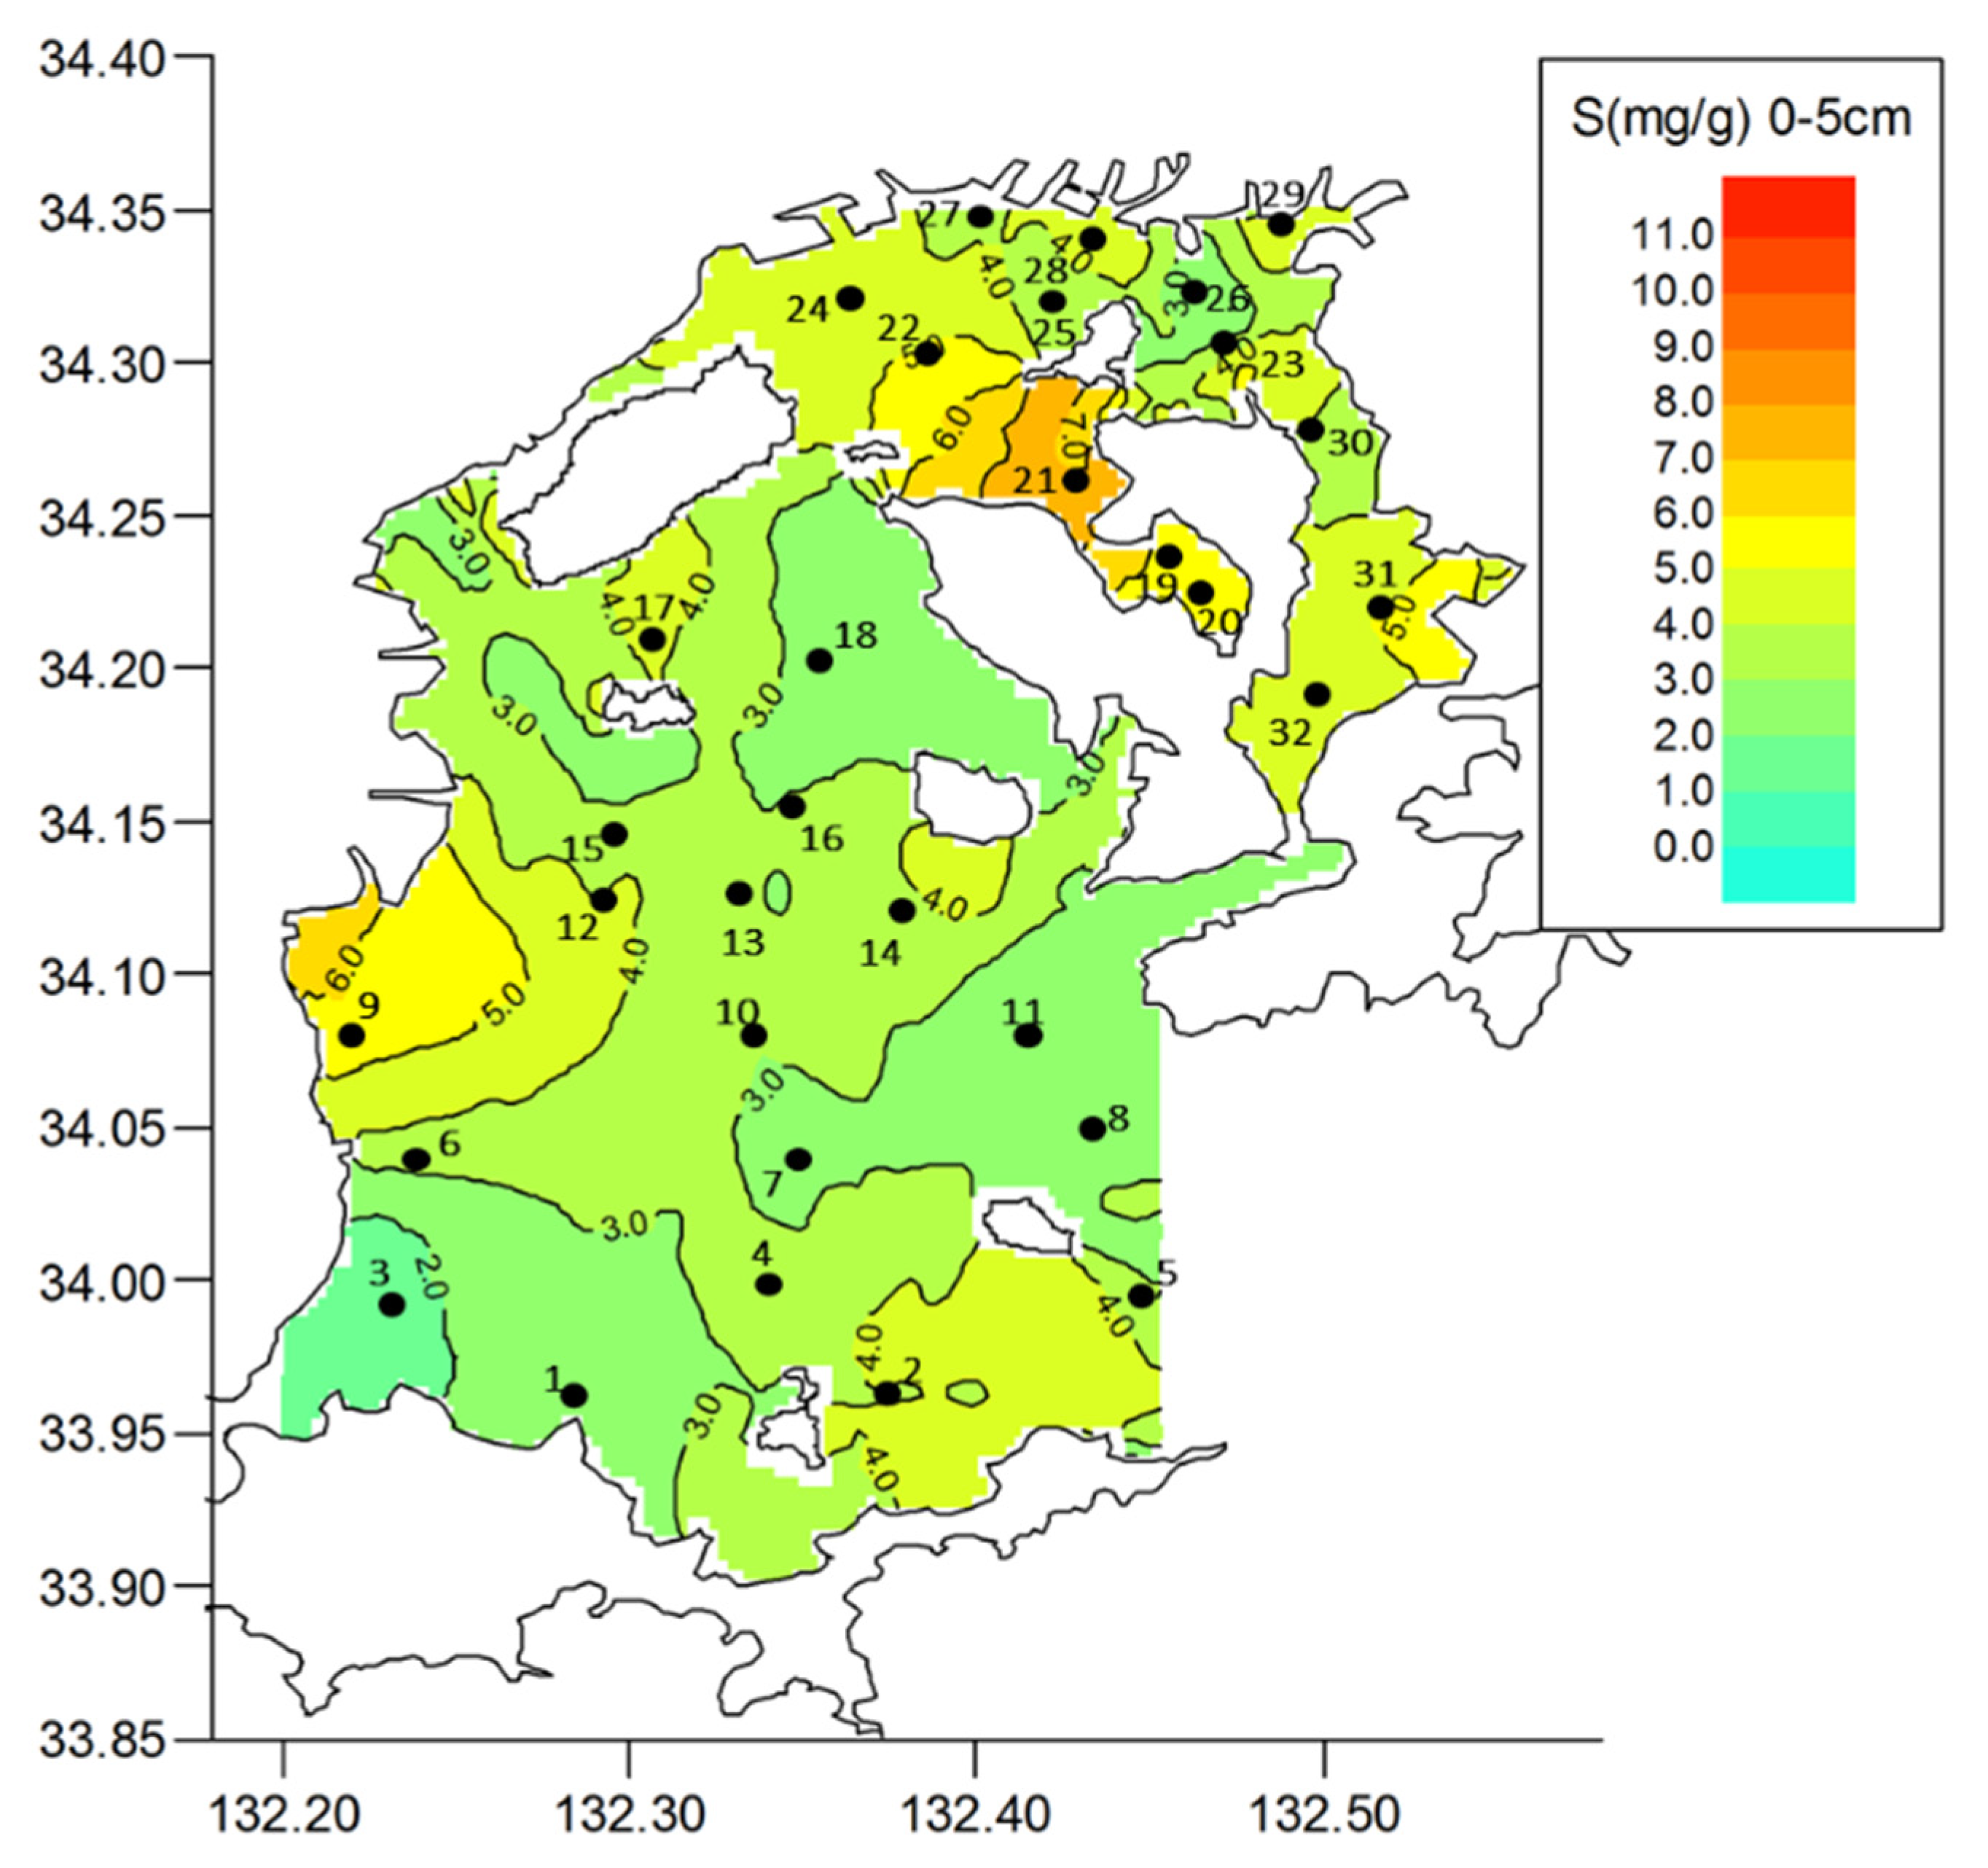
The highest TS value in the surface 0–5 cm layer, 7.3 mg g dry−1, was observed at the mouth of Etajima Bay (Station 21) as shown in Figure 5; however, the concentration was low in the deeper layer at this station (not shown in Figure 2). The highest values (9.3–9.4 mg g dry−1) were detected at 10–20 cm depth at Station 20 in Etajima Bay (Figure 2). Except those high values in and around Etajima Bay and the western part of sHB (5.9 mg g dry−1 at Station 9) in the surface layer, the TS concentration, including in the deeper layer, did not differ much between nHB (2.0–7.1 mg g dry−1) and sHB (1.1–5.9 mg g dry−1).
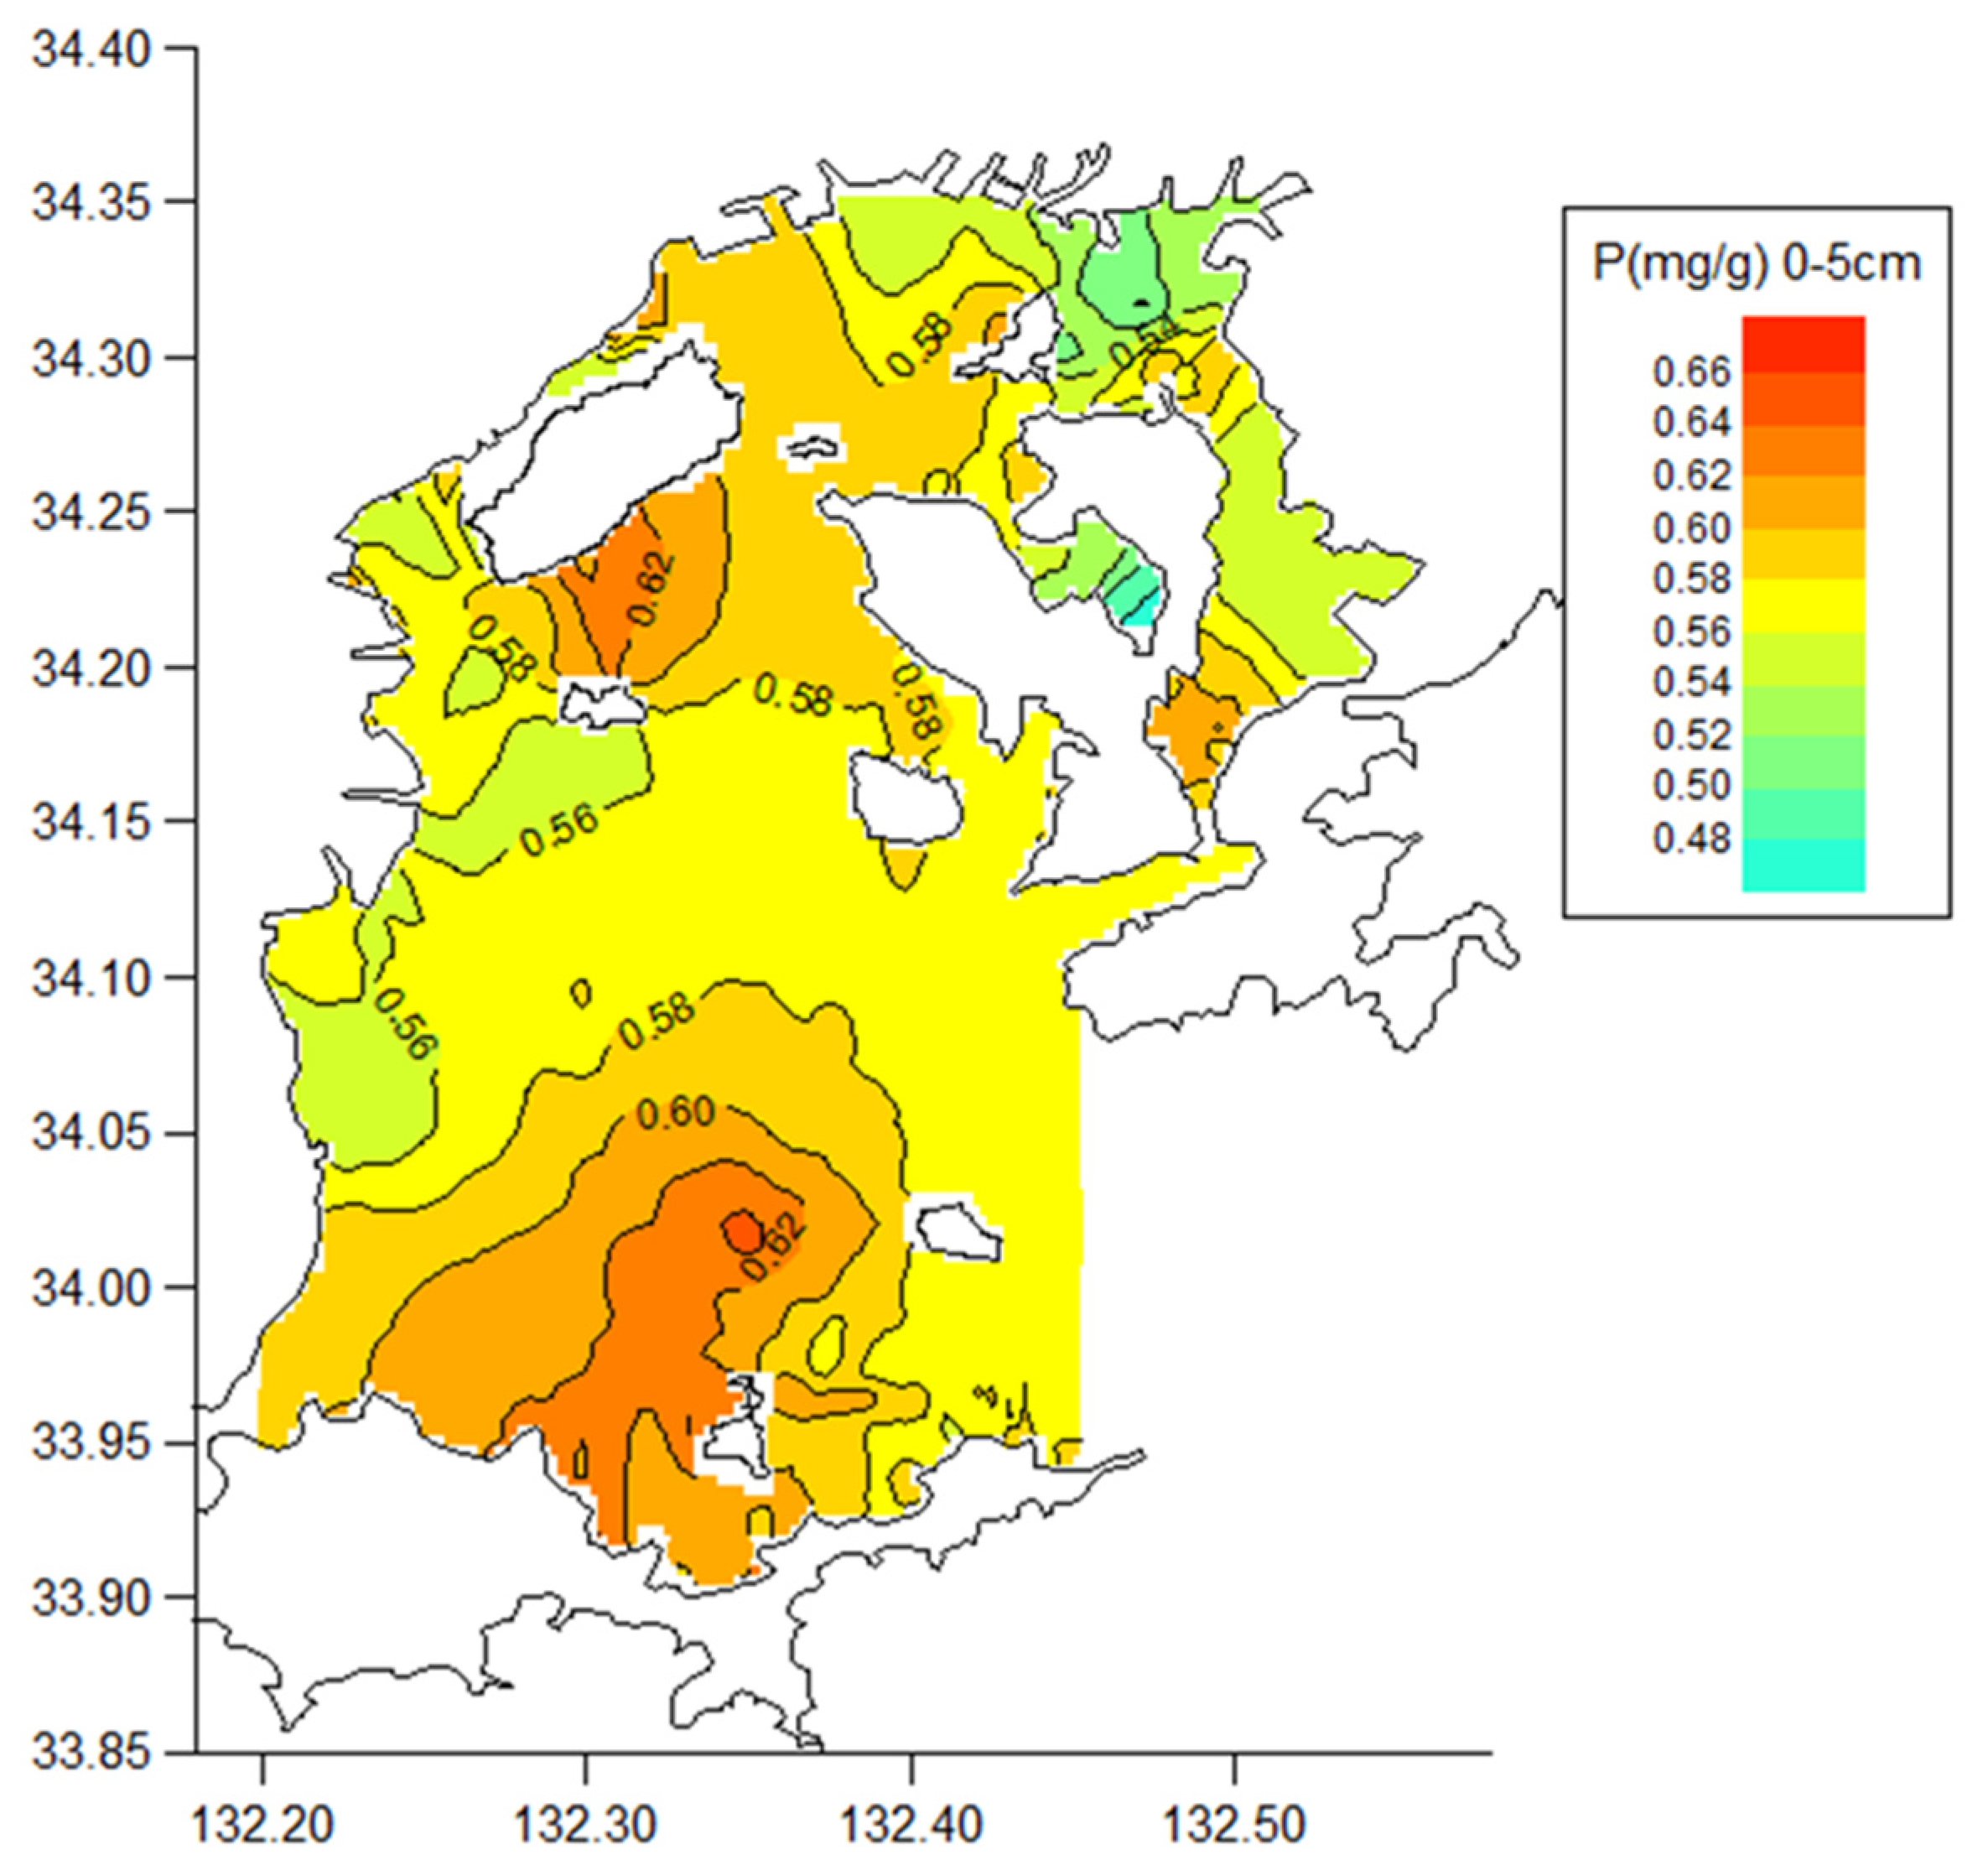
The spatial distribution of TP was somewhat homogeneous and was different from the other elements, with values of 0.37–0.67 mg g dry−1 in both nHB and sHB (Figure 2 and Figure 6). The values at the northeastern part of nHB along with the Ohta River mouth (Station 27) and the Nishiki River mouth (Station 9) were slightly low, as shown in Figure 6.
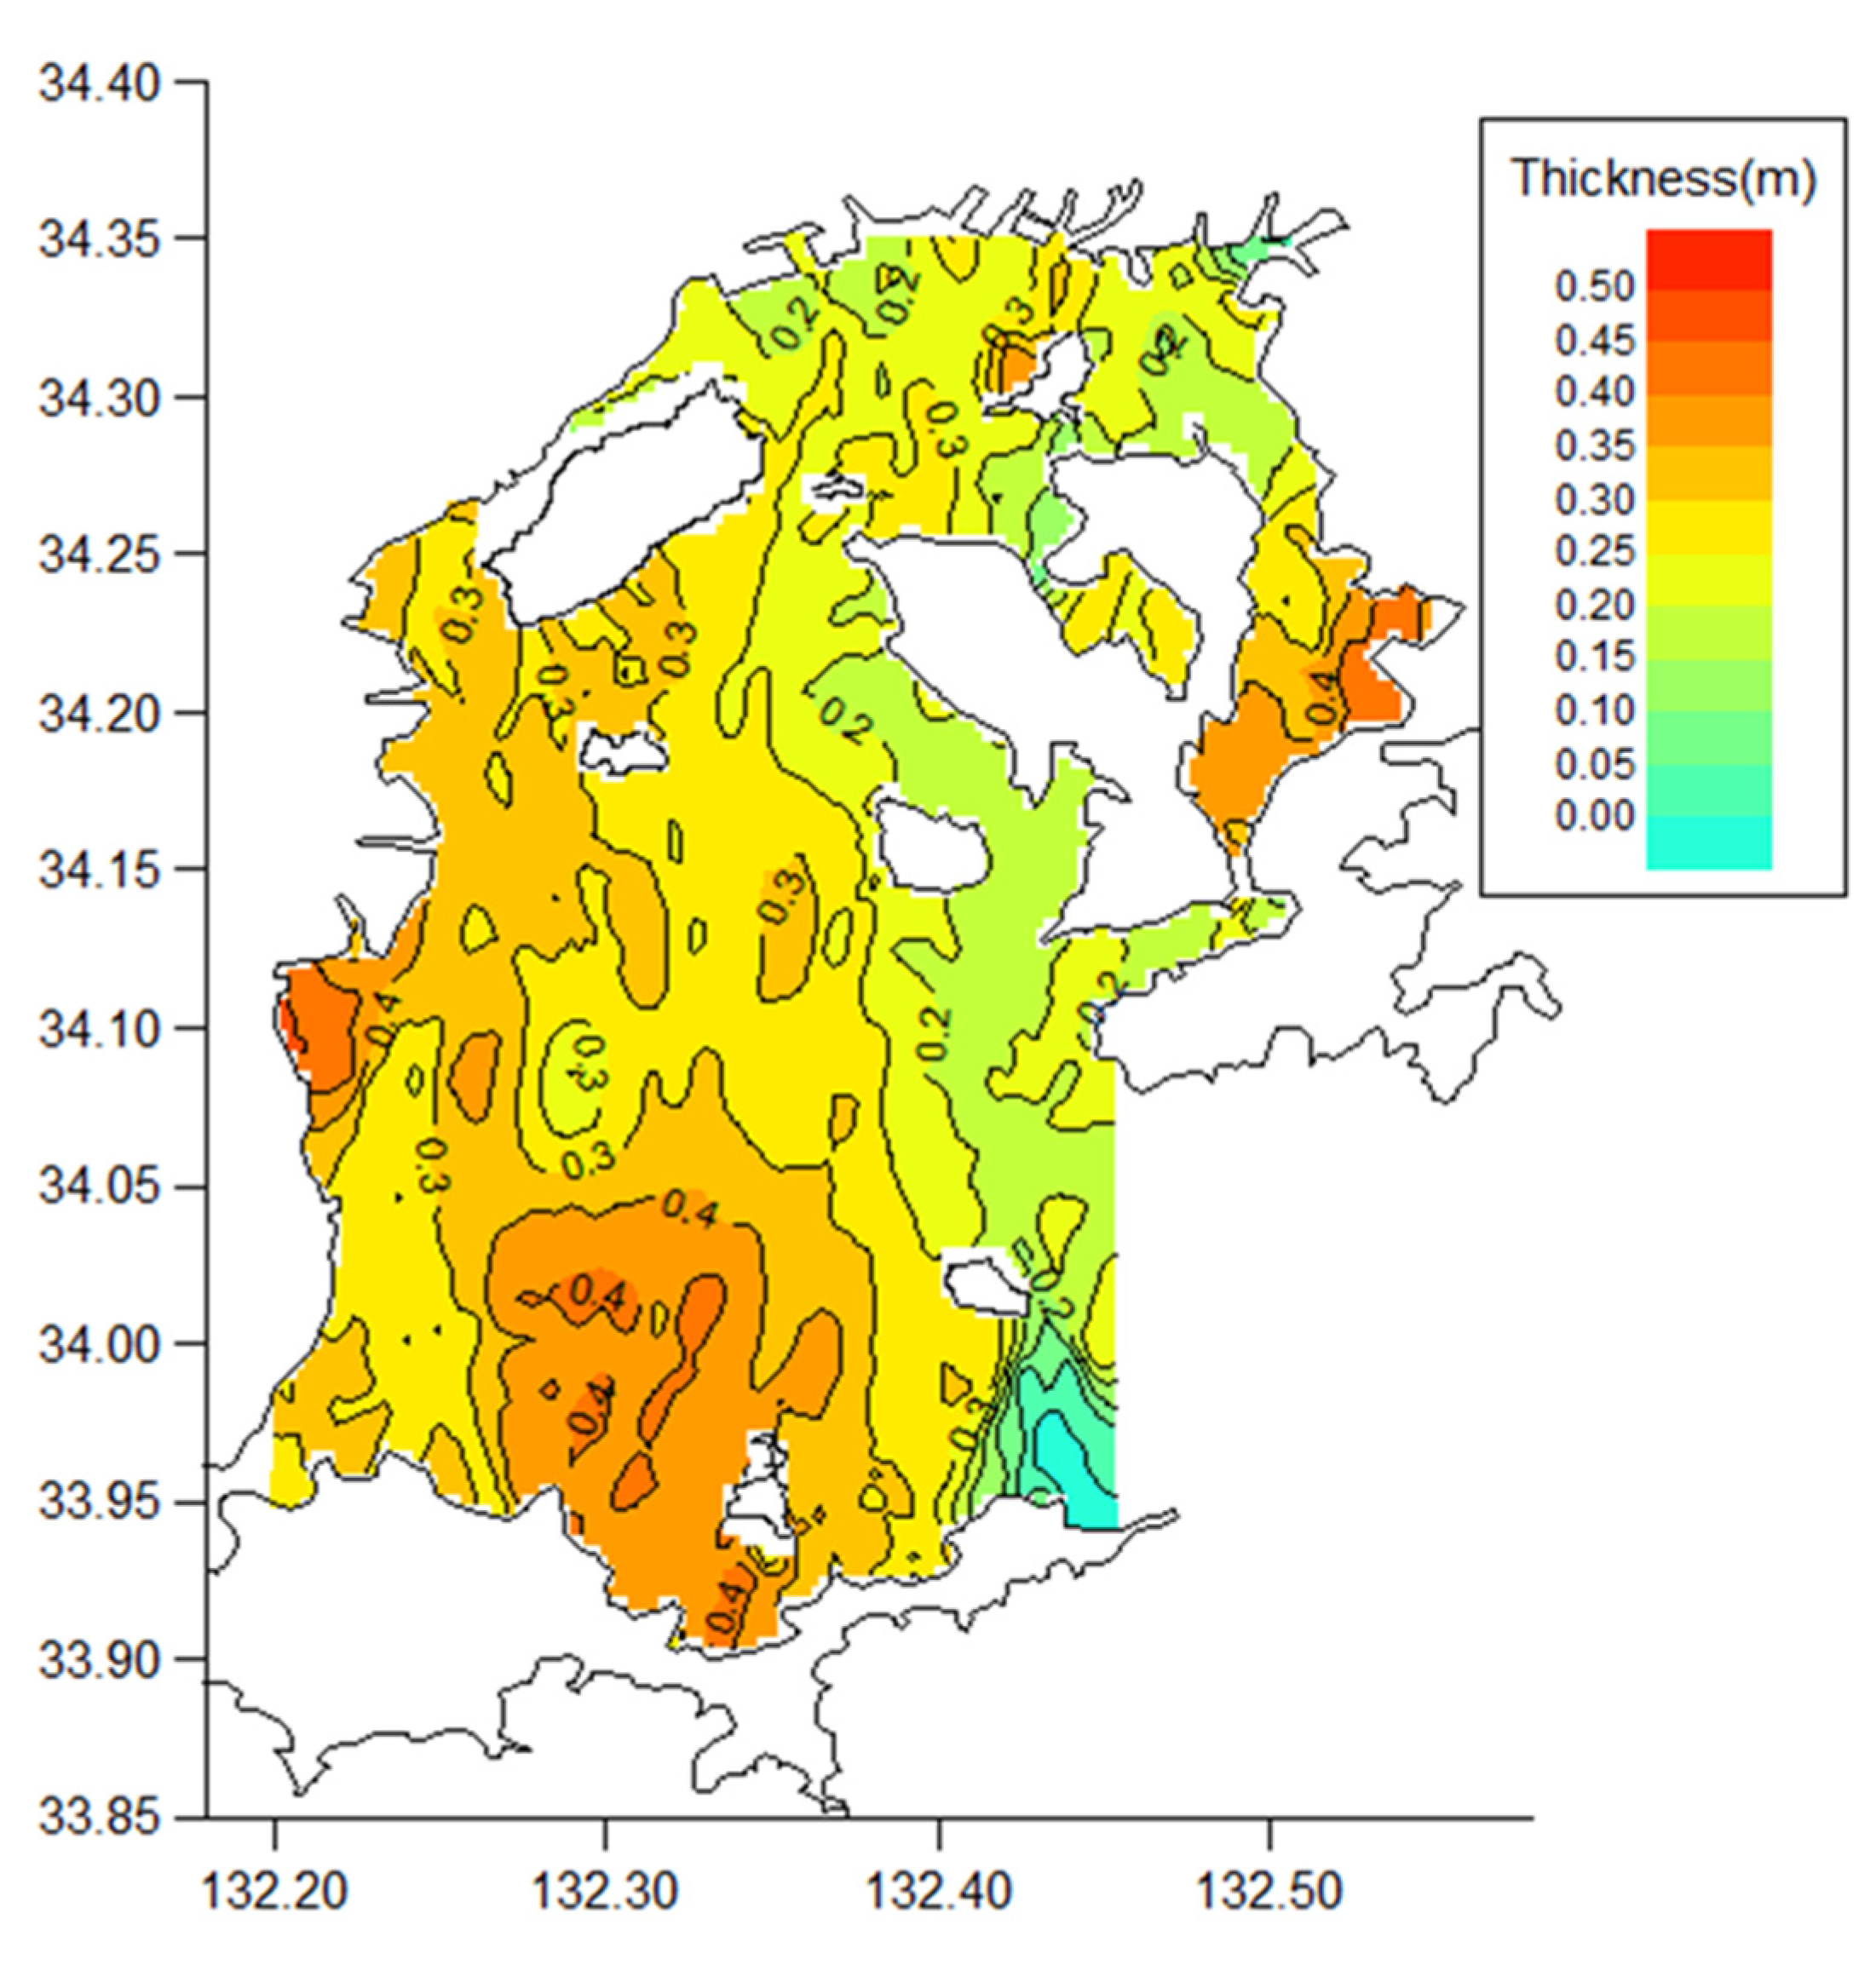
As shown in Figure 7, while the thickness of muddy sediments in nHB was 0.2–0.4 m at the mouths of the Ohta River and the Yahata River, it was 0.3–0.5 m thick in Kure Bay, where the water is stagnant due to the landlocked configuration (Figure 1). In sHB, the muddy sediment thickness was also high (0.4–0.5 m) in the southernmost area north of Yashiro Island and locally in western area. The volume of muddy sediments was estimated to be approximately 2.82 × 10⁸ m3 for the entire HB. The amount of P accumulated in the Hiroshima Bay sediment, estimated using thickness data of the muddy sediment and the P content, was 1.8 × 10⁵ ton. Accumulation processes will be discussed later.

3.2. Subsidiary Parameters Relating to C, N, S and P Cycles

Observed parameters (Eh, WC, IL, AVS, and H2S) for the soft, muddy surface sediment whose depths are different at every station, which relate to C, N, S and P cycles, are summarized in Table 2. The Eh in nHB was from −150 to −27 mV. The lowest area was Etajima Bay, with values ranging from −150 to −120 mV, indicating that sediment in Etajima Bay was under severe reducing conditions. In sHB, the sediment conditions were also generally reducing (−153 to −25 mV), except for some sandy areas (Stations 1 and 3: +23 and +45 mV, respectively). The WC ranged 69.8–82.5% in nHB and 46.6–81.8% in sHB. The IL values were high in nHB (10.9–12.7%), and particularly high in Etajima Bay, Kaita Bay, and Kure Bay, compared to those in sHB (4.8–11.3%). The AVS was higher in nHB, with values of 0.17–1.14 mg g−1, than in sHB (0.04–0.35 mg g−1). The highest AVS value was observed at the mouth of the Ohta River (Station 27). H2S in the interstitial water of the sediments was detected at most stations. The highest value (23 mg S L−1) was observed both in Kure Bay (Station 32) and the center of sHB (Station 13), and the second highest value (19 mg S L−1) was in Etajima Bay (Station 20).

4. Discussion

The C content was generally high at the mouths of Ohta River, Yahata River, and Seno River (Kaita Bay). This may be due to large inputs of organic matter from the cities of Hiroshima and Kure, which have large populations (Hiroshima: 1.2 million, Kure: 0.23 million). Even in sHB, the C content in the western part was high, which can be explained by the material load of the Nishiki River flowing through Iwakuni City (population: 0.14 million). One of the major sources of particulate organic matter is the direct load from the rivers. According to Kittiwanich et al. [66], the 10-years (1991–2000) average riverine particulate organic nitrogen (PON) and particulate phosphorus (PP) loadings are 14.5 mg N m−2 day1 and 2.73 mg P m−2 day−1, respectively for nHB, and 0.6 mg N m−2 day−1 and 0.27 mg P m−2 day−1 for sHB, respectively. Notably, other large PON and PP loads are those conveyed by the estuarine circulation, which is driven by the riverine discharge; those for nHB are 21.0 mg N m−2 day−1 and 2.59 mg P m−2 day−1, respectively, and for sHB they are 1.0 mg N m−2 day−1 and -0.26 mg P m−2 day−1, respectively. The minus PP value in sHB indicates PP was transported from sHB to outside the bay. These values indicate the material load by the estuarine circulation is comparative to the riverine direct N and P loads or more. Although the carbon loads from the rivers and the estuarine circulation were not estimated in their study, it is inferred that the same tendency in POC load being high in nHB and low in sHB.
The second largest source of particulate organic matter in Hiroshima Bay is biodeposits from oyster culture, which are intensively conducted particularly in nHB. According to the material budget calculation by Kittiwanich et al. [66], the amount of PON and PP produced as feces and pseudofeces by cultured oysters are 18.1 mg N m−2 day−1 and 2.09 mg P m−2 day−1 for nHB, respectively, and 1.3 mg N m−2 day−1 and 0.15 mg P m−2 day−1 for sHB, respectively. The particulate matter load by the biological process, particularly PON, is larger than those of direct riverine load both in nHB and sHB. The biodeposits from the cultured oysters contribute approximately 2/3 of the total sedimentation both in PON and PP in nHB. The remaining total biodeposits produced in the water column mainly comes from the feces of zooplankton. In nHB, including Etajima Bay, oyster farming is intensive; approximately 12,000 oyster rafts (of them, 1700 rafts in Etajima Bay) exist in nHB, equivalent to 5760 million individual oysters. According to Yamamoto et al. [44], 27.6 kg DW deposits raft−1 day−1 are estimated to be produced. Biodeposits of ~330 ton DW raft−1 day−1 sink down onto the seafloor of HB. This estimate does not include oyster meats, regardless if they were dead or alive, and other attached creatures, which may have fallen during handling by farmers, which may reflect almost the same amount of the feces and pseudofeces deposits.
Conversely, the distribution of N differed substantially from that of C, showing low values at the mouth of the Ohta River (Figure 4). Consequently, this area had high sediment C/N molar ratios (>11). In sHB, the C/N molar ratio was also high (12–23) in the western part near the Nishiki River than in the central part (5–11). The low N values in these river mouth areas can be explained by denitrification processes. The occurrence of denitrification is also evidenced by the low N/P molar ratio. The N/P value 5.6 recorded at the Ohta River mouth was much smaller than the Redfield ratio (16). It was reported that severe hypoxia (DO concentration <2 mg L−1) of the bottom layer is observed in the north-east part of nHB usually in September and recovers in October every year [59]. The hypoxia is limited in the innermost north end of nHB (Stations 27 and 28) where riverine input is received, and the area landlocked by islands with narrow connections to the neighboring areas (Stations 19, 20, 23, 26, 29, 30, 31, and 32). It is reported that the annual scale of hypoxia in the main nHB, except in the landlocked area, is dependent on the DO supply accompanied by the advective lateral flow driven by the estuarine circulation, although the seasonal recovery of hypoxia occurs due to ventilation by vertical mixing of the water column as the season progresses [59].
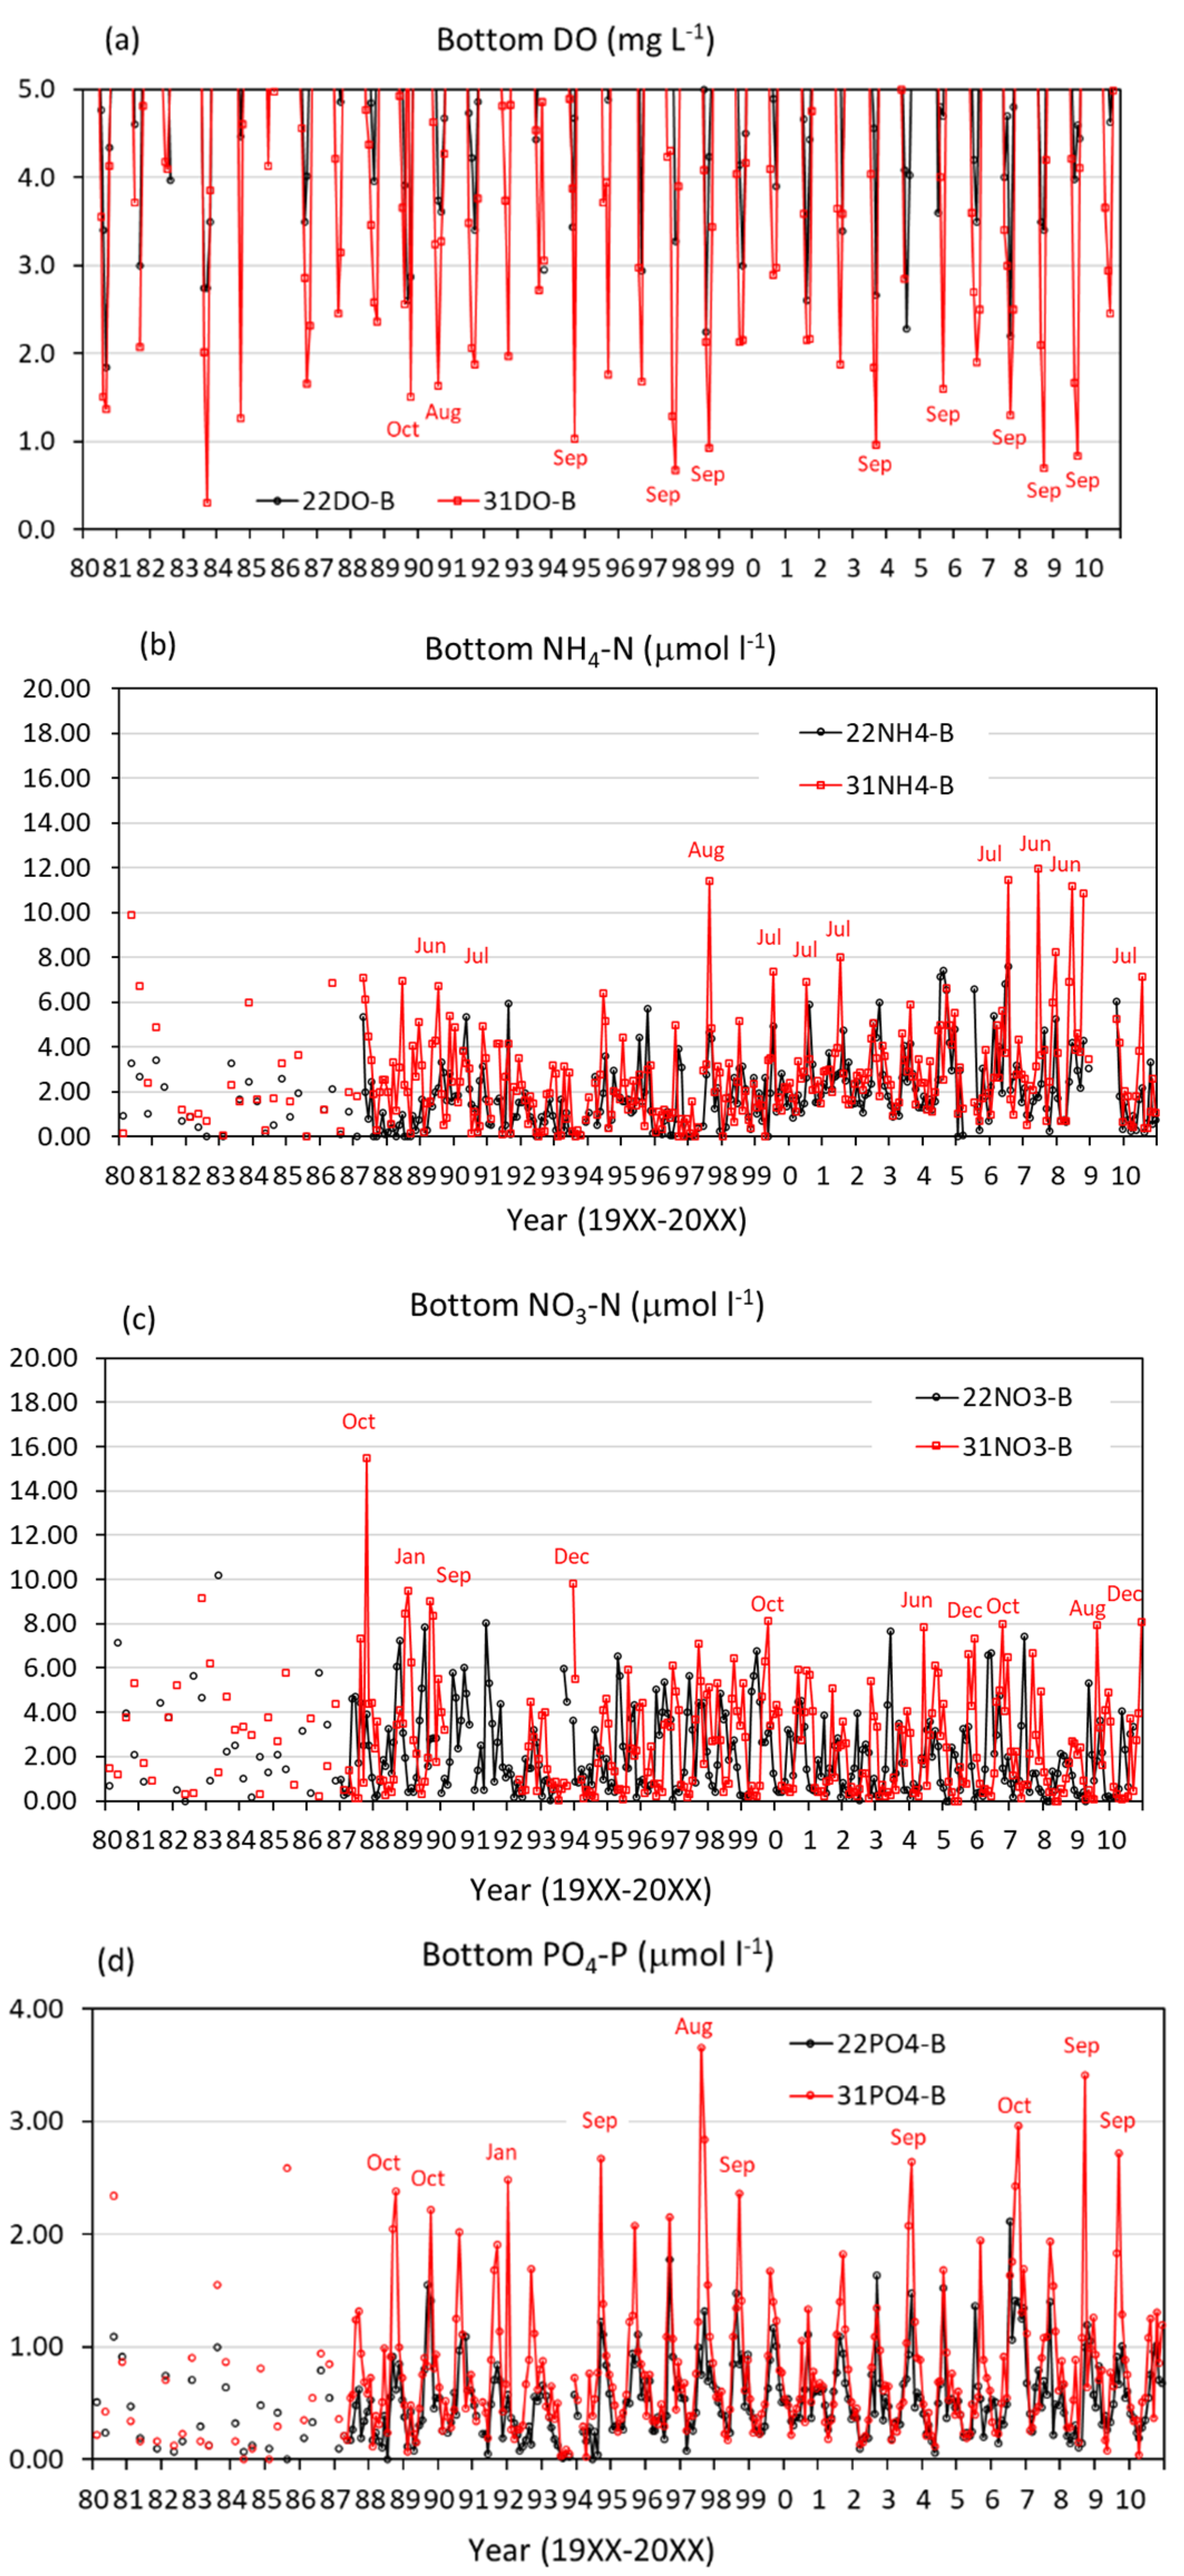
Long-term monitoring data on the bottom DO concentration as well as the other water quality data are available from the homepage of Hiroshima Fisheries and Marine Technology Center [67]. As the number of stations monitored by the prefectural institution is limited, here we use the data collected at two stations (Stations 17 and 21 in the original data set) whose locations are close to our sampling stations (Stations 22 and 31) for discussion. Therefore, in Figure 8, we used our station numbers for these sites. The data indicate that the bottom DO concentration at Station 31 in Kure Bay is much lower than that at Station 22 (Figure 8). This is due to the water stagnancy in Kure Bay, while DO is supplied by the estuarine circulation at Station 22 as mentioned above. There is no fixed long-term trend in the bottom DO concentrations even though the nutrient reduction measure has been implemented for 40 years. The most serious eutrophication period was during the 1970s–1980s and before in terms of the number of harmful algal blooms; the record high was 1974 (14 times yr−1) and the second record high was 1986 (10 times yr−1) in Hiroshima Bay [67]. However, no harmful algal blooms are observed in recent couple of years. This can be the ‘Legacy of Eutrophication’, which has been mentioned in previous studies [47,48,49,50]. That is, H2S and other reductive matter produced in the anaerobic sediment, in which an abundance of organic matter accumulated in the bottom sediments during eutrophication period, continue to consume the bottom DO and release phosphate into the bottom water, even several decades after the peak eutrophication period.
In Figure 8, we selected the lowest 10 values for DO and the highest 10 values for each nutrient species at Station 31 (Kure Bay) during 1988 to 2010 since the sampling interval is not regular before 1987. The bottom NH4-N concentration was high during June–July, except in August 1987; meanwhile, the bottom NO3-N was high during August–December with several exceptions (January 1989 and June 2004). This may imply that organic matter decomposition progresses in early summer (June–July) and is followed by nitrification (August–December). During the nitrification process followed by H2S generation, the DO consumption proceeds and forms hypoxia in September. Taking the difference between the NO3-N peak value to the following lowest value which occurred 1–2 months later, the denitrification rate is ~6.6 mg N m−2 day1 for Station 31 on average over the three decades. Correspondingly, it is estimated to be 4.6 mg N m−2 day−1 for Station 22. This is only a first-order estimation, and the values may be overestimated because the decrease in NO3-N concentration is also caused by the other processes such as physical dilution and ammonification, etc. However, it is in the range of the reported values (0–23.2 mg N m−2 day−1) determined by the acetylene inhibition method for the sediments collected at Station 22 in 1994–1995 [68], and close to the value estimated for the entire Hiroshima Bay using the data from April 1991 to March 1992 (7.9 mg N m−2 day−1) [69] and slightly lower than the value estimated for the nHB using the data set of 1991–2000 (14 mg N m−2 day−1) [70]. The latter two were those estimated by a material budget calculation using models. It is not so much different from the values estimated for the sediments of the eutrophic Stockholm archipelago, Baltic Sea (1.26–24.1 mg N m−2 day−1, in the original study, 90–1723 μmol N m−2 day−1) [50].
The S and P distribution patterns differed substantially from those of C and N. For the S and P cycles, we should consider whether the sediment conditions were aerobic or anaerobic, similar to N. Sulfate ions are plentiful in seawater and are the source of sulfate reduction under anaerobic conditions in addition to organic matter. In other words, H2S is the byproduct of sulfate reduction. As described above, the H2S concentration and AVS, in which H2S is contained, were high in Etajima Bay, where S originates not only from sulfate ions, but also from oyster feces. This may be the cause of the high S contents in the sediments of Etajima Bay (Figure 5). In Japan, the standard permissible values of AVS and H2S for aquatic life are 2 mg g dw−1 and 0 mg L−1, respectively [65]. Compared to the standards, all stations except Station 27 cleared the AVS standard, and Stations 1, 3, 8, 11, and 14 in sHB cleared the H2S standard. In comparison to the values between the samples from 0–5 cm depth and from 5–10 cm depth, the AVS was higher at 0–5 cm depth (0.34 ± 0.21 mg g dw−1) than 5–10 cm depth (0.21 ± 0.15 mg g dw−1). This may be attributed to the formation of FeS and other compounds, which can be detected as AVS [62]. Meanwhile, the H2S was higher in 5–10 cm (6.1 ± 5.4 mg L−1) than 0–5 cm (4.6 ± 5.6 mg L−1). This may indicate H2S dissolved in the pore water is diffused to the overlying water and causes the consumption of DO. The volume-based percentage content of AVS in TS and that of H2S in AVS were 7.3 ± 5.0% (0.8–28.6%) and 1.1 ± 1.3% (0.0–6.4%), respectively. Although the fraction of H2S in the sediment TS is somewhat small, it should be continuously produced as long as the vast organic matter remains in the sediments and sulfate is supplied from seawater.
The observed P content was comparatively low at the stations located at the mouth of rivers and stagnant areas (Stations 19, 20, 26, 27, 29, and 31 in Figure 6), contrary to the high C content at these stations (Figure 3). In these areas, material load is high either from rivers or oyster culture. The concentration of the elements in the sediment is determined by the balance between the sedimentation flux and the release of dissolved matter from the sediment due to decomposition. Therefore, although the organic matter sedimentation is high, the relatively low sediment P values implies a high benthic flux owing to anaerobic conditions. The sediment Eh was low (−150 to −120 mV) in these areas, as described before, indicating reducing conditions. H2S is contained in the sediments of all stations in nHB as described in Section 3.2. As shown in Figure 8, peak phosphate concentration in the bottom layer of Station 31 is usually observed in September, which coincides with the occurrence of hypoxia. This phenomenon is the same at Station 22. The phosphate under anaerobic conditions originates from metal oxide-bound P, such as FeOOH≡PO4 in the reaction with H2S, in the sediment. The production of H2S in the sediments will continue if both sulfate and the organic matter are present in the sediments, even if it is refractory. This is the ‘Legacy of Eutrophication’ as previously mentioned [47,48,49,50].
An estimated 1.8 × 10⁵ ton of P accumulated in the Hiroshima Bay sediment, equivalent to half the amount consumed in a year in Japan (3.5 × 10⁵ ton) [71]. Even if P is liberated yearly from metal oxide-bound-P, the amount liberated from the anoxic nHB sediments is estimated to be 26 ton P yr−1 from the average concentration in the bottom as 2 μmol L−1, assuming the bottom water depth containing the concentration is 3 m. If we assume the P accumulated in the sediment changed the form to those liberated yearly, it will take 6900 years until the end of release of all the accumulated P. Although this estimation is too simple and rough, it is certain that the annual hypoxia will last long even if a harsher nutrient reduction measure is taken.
Additional measures are required to remediate such deteriorated anoxic sediments. Two engineering methods have been implemented to remediate deteriorated anoxic sediments. One simply removes and dampens the deteriorated anoxic sediments in the other site. Because of the salt content, we cannot use the sediments in agriculture as fertilizer or anywhere else on land. Therefore, the most suitable place to dampen was the shallow coastal area along the coastline in terms of transportation cost. This kind of reclamation was effective during the rapid economic growth period because there was demand for land for industries and houses. However, such reclamation was restricted by the tentative law in 1973 because it damages coastal ecosystems. Another way is to remediate the sediment quality by adsorbing or oxidizing the reductive substances using materials that have such functions. Traditionally, natural sand was used for capping deteriorated coastal sediments. However, the collection of natural sand was restricted by the law because it may damage the ecosystems of original sites where the sand is collected regardless of whether it is land, river, or sea. Furthermore, natural sand has no function to reduce the reductive substances. Thus, we have developed several functional materials from industrial byproducts, which are certificated by the Ministry of the Environment of Japan [72], and hot-air dried oyster shell (HACOS), steel-making slag, and granulated coal ash are those in which the present authors’ group has been deeply involved [73,74,75,76,77,78]. Their use in the future will be beneficial due to cost-effectiveness and the aspect of creating a recycle-oriented society.
Third, the recovery of the accumulated P as a resource can be an alternative. Currently, P is recovered from sewage at treatment plants and used in fertilizers and other products [79]. Abelson [80] indicated that phosphorus is a resource facing shortages on the Earth; therefore, techniques should be developed in the future to recover P that is accumulated in coastal sediments.
The Ministry of the Environment of Japan observed the sediment quality in the Seto Inland Sea, Japan, including Hiroshima Bay [54,55,56]. There were 46 stations in the first observation in 1982, and 23 in the second and third observations, which did not differ drastically from our number of sampling stations (32) in October 2010, showing an even distribution of the stations. The results are summarized along with our data from October 2010 in Table 3. The sampling depth in the observation by the Ministry of the Environment was the same as those of the first layer in our observations (0–5 cm), with data in deeper layer >5 cm lacking. Decreasing trends over time in TOC and TN were found in a report by Komai [81]; however, the discussion is limited. In contrast, only TP values in the present study were slightly higher than the average TP value from 2003. A possible cause is the trapping/adsorption of phosphate by iron oxides and manganese oxides that are formed under aerobic conditions. While the sediment P retention capacity is small when the bottom condition is anaerobic because of the reductive dissolution of phosphate detached from iron/manganese oxides [82,83], it increases via trapping by iron/manganese oxides as oxygen is supplied [84]. A record flooding during July 10–16 of 2010 [85], 3 months before our observations, might have increased the sediment P content.
To remediate the eutrophic conditions, the P and N reduction measure has been in place for 40 years for the Seto Inland Sea including Hiroshima Bay. Consequently, the water transparency has increased drastically [37]; however, the production of commercially important fish, bivalves, and cultured seaweed has almost collapsed in the Seto Inland Sea [41,51,52]. We previously reported this could be because of ‘cultural oligotrophication’ [41,86]. Thus, we conclude that the Seto Inland Sea, including Hiroshima Bay, has been experiencing conflict between the oligotrophication of the surface water and the legacy of eutrophication of the bottom sediments. The recent decrease in the oyster production of Hiroshima Bay is a serious issue for farmers. The line length farmers use to hang oysters is 10 m. Therefore, the oysters are not affected by the hypoxia, which usually forms in the bottom layer. However, the anoxic sediment conditions are unsuitable for benthic animals, including bivalves, as their rearing environment. They should be an important feed for both benthic and pelagic fishes; for example, red sea bream, which is a highly regarded fish in Japan, prefers to feed on shrimp dwelling on the bottom. Thus, the hypoxia and sediment which contains deadly poisonous H2S can cause the collapse of the total ecosystem in addition to the oligotrophication in the surface water.
To alleviate the oligotrophic conditions of the surface water and increase the bioproduction, the Japanese government revised the law in 2015. The measure was to increase the sewage effluent load to a level at which natural and farming seaweeds, bivalves, and major fish species can sufficiently grow [53]. In Hyogo Prefecture, in the eastern part of the Seto Inland Sea, they relaxed the sewage treatment effluent during the Nori growing season in the winter by suppressing the nitrification and denitrification processes at sewage treatment plants [87]. However, observations have proven the effect was spatially limited because of the diffusion feature of seawater [87]. Computer simulations, which combine physical and biological processes, also showed limited effects [88]. Another cause of the limitation of the effect was a permissible limit in the maximum concentrations of nitrogen and phosphorus of the effluents they can release. The nutrient concentration was still regulated by the policy in 2015. Then, the central government revised the law again to expand the target sites to any workplace which emits phosphorus and nitrogen. The revised bill has recently passed the House of Representatives on 3 June 2021 [89].
Since the oyster rafts are extensively located in nHB, the supply of nutrients by increasing effluents from workplaces may not impact the offshore rafts. Therefore, we are attempting to develop a fertilizer to enhance the growth of farmed oysters [90], which can also be used for other bivalves, Nori, and other farming organisms. The most important issue that we must address is the concentration and time we should increase the effluents from workplaces, how many fertilizers, and when it should be applied. As the environmental conditions and type of fisheries conducted are different in each area, each prefectural government must devise a practical and effective plan for individual sea areas. For example, Hiroshima Prefecture is assigned to plan for Hiroshima Bay. When increasing nutrient load to maintain the oyster growth, the prefectural government should consider the oyster growing season is October to March. However, nutrient increases must not induce harmful algal blooms. Simultaneously, we must consider the remediation of anoxic sediments. Researchers are expected to propose some acceptable scientific perspectives using a sophisticated simulation model, which includes integrated physical-biogeochemical processes in both the water column and sediments. Our group has previously established a model that can reproduce the bottom hypoxia and remediation effects of byproducts by applying them to the sediments [91]. The other models we have been developed can be used to measure the oligotrophication of the surface water and oyster production [43,66]. We must discuss the simulation outputs in detail as a future prospect with different stakeholders.

5. Conclusions

The C, N, S, and P showed different spatial distributions within Hiroshima Bay. C was influenced more by material loads from land, whereas N reduced by denitrification in river mouths and landlocked areas with reduced sediments. S was affected by oyster farming activities, which are intensively conducted in, for example, nHB and Etajima Bay, and sulfate reduction that may occur under reducing conditions. P was relatively low in reduced sediments of landlocked areas (northeast of nHB, Kure Bay and Etajima Bay), where P is released under reduced conditions, and distributed evenly in the vertical profile compared to the other elements. P was somewhat high compared to C and N referring to the Redfield ratio, suggesting that it can accumulate in sediments. Compared to the governmental monitoring data on sediment quality, the P value of the present study is higher than that of 2003, whereas decreasing trends in C and N were found. Approximately 1.8 × 10⁵ tons of P is accumulated in 0.28 km3 of muddy sediment in Hiroshima Bay, with a maximum thickness of 0.5 m.
The Seto Inland Sea, including Hiroshima Bay, is facing conflict between the ‘Legacy of Eutrophication’ in the bottom sediments and the ‘Cultural Oligotrophication’ of the surface water. Particularly, the lack of feed phytoplankton for farming oyster is a serious challenge for farmers in the Hiroshima Bay. In contrast, the hypoxia observed every September is unlikely to recover forever. A major cause is the biodeposits supplied from farming oysters. The oxygen consumption in the bottom layer is attributed to the reductive substances such as H2S. Recovery of the sediment quality is important for animals which are feed for both benthic and pelagic fish. Therefore, we should apply materials that can adsorb the reductive substances to recover the total ecosystem, in addition to adding nutrients to the surface water. A science-based plan with several options with computer-aided perspectives, including cost performance, is warranted for the local government to facilitate proper decision-making.

Author Contributions

Conceptualization, T.Y. and S.-i.O.; methodology, T.Y. and H.Y.; software, H.Y.; validation, S.A.; formal analysis, K.O.; investigation, T.Y., K.O., S.A. and H.Y.; resources, T.Y.; data curation, S.A.; writing—original draft preparation, T.Y.; writing—review and editing, S.A. and H.Y.; visualization, K.O. and H.Y.; supervision, T.Y.; project administration, T.Y. and S.-i.O.; funding acquisition, S.-i.O. All authors have read and agreed to the published version of the manuscript.

Funding

This research was funded by JSPS Grant-in-Aid for Scientific Research (KAKENHI) (A), Grant Number JP21241011.

Data Availability Statement

The data presented in this study are available on request from the corresponding author. The data are not publicly available because they are collected in an university student’s graduation project. The corresponding author who was the supervisor of the student keeps all the data in the forms of CD and printed matter.

Acknowledgments

We thank the captain, Kazumitsu Nakaguchi and the crew of the R/T vessel Toyoshio Maru, Hiroshima University for their help during the research cruise.

Conflicts of Interest

The authors declare no conflict of interest.

References

  1. Asmala, E.; Carstensen, J.; Conley, D.; Slomp, C.P.; Stadmark, J.; Voss, M. Efficiency of the coastal filter: Nitrogen and phosphorous removal in the Baltic Sea. Limnol. Oceanogr. 2017, 62, S222–S238. [Google Scholar] [CrossRef]
  2. Prastka, K.E.; Malcolm, S.J. Particulate phosphorus in the Humber estuary. Neth. J. Aquat. Ecol. 1994, 28, 397–403. [Google Scholar] [CrossRef]
  3. Bowden, K.F.; Din, S.H.S.E. Circulation and mixing processes in the Liverpool Bay area of the Irish Sea. Geophys. J. Int. 1966, 11, 279–292. [Google Scholar] [CrossRef] [Green Version]
  4. Bowden, K.F.; Gilligan, R.M. Characteristic features of estuarine circulation as represented in the Mersey Estuary. Limnol. Oceanogr. 1971, 16, 490–502. [Google Scholar] [CrossRef]
  5. Ruttenberg, K.C.; Berner, R.A. Authigenic apatite formation and burial in sediments from non-upwelling, continental margin environments. Geochim. Cosmochim. Acta 1993, 57, 991–1007. [Google Scholar] [CrossRef]
  6. Gachter, R.; Muller, B. Why the phosphorus retention of lakes does not necessarily depend on the oxygen supply to their sediment surface. Limnol. Oceanogr. 2003, 48, 929–933. [Google Scholar] [CrossRef]
  7. Roden, E.E.; Edmonds, J.W. Phosphate mobilization in iron-rich anaerobic sediments: Microbial Fe(III) oxide reduction versus iron-sulfide formation. Arch. Hydrobiol. 1997, 139, 347–378. [Google Scholar] [CrossRef]
  8. Sugawara, K.; Koyama, T.; Kamata, E. Recovery of precipitated phosphate from lake muds related to sulfate reduction. J. Earth Sci. Nagoya Univ. 1957, 5, 60–67. [Google Scholar]
  9. Froelich, P.N.; Arthur, M.A.; Burnett, W.C.; Deakin, M.; Hensley, V.; Jahnke, R.; Kaul, L.; Kim, K.H.; Roe, K.; Soutar, A.; et al. Early diagenesis of organic matter in Peru continental margin sediments: Phosphorite precipitation. Mar. Geol. 1988, 80, 309–343. [Google Scholar] [CrossRef]
  10. Slomp, C.P.; Epping, E.H.G.; Helder, W.; Raaphorst, W.V. A key role for iron-bound phosphorus in authigenic apatite formation in North Atlantic continental platform sediments. J. Mar. Res. 1996, 54, 1179–1205. [Google Scholar] [CrossRef]
  11. Shulz, H.N.; Schulz, H.D. Large sulfur bacteria and the formation of phosphorite. Science 2005, 307, 416–418. [Google Scholar] [CrossRef] [PubMed]
  12. Suess, E. Mineral phases formed in anoxic sediments by microbial decomposition of organic matter. Geochim. Cosmochim. Acta 1979, 43, 339–352. [Google Scholar] [CrossRef]
  13. Egger, M.; Jilbert, T.; Behrends, T.; Rivard, C.; Slomp, C.P. Vivianite is a major sink for phosphorus in methanogenic coastal surface sediments. Geochim. Cosmochim. Acta 2015, 169, 217–235. [Google Scholar] [CrossRef] [Green Version]
  14. Rothe, M.; Kleeberg, A.; Hupfer, M. The occurrence, identification and environmental relevance of vivianite in waterlogged soils and aquatic sediments. Earth Sci. Rev. 2016, 158, 51–64. [Google Scholar] [CrossRef] [Green Version]
  15. Lenstra, W.K.; Egger, M.; van Helmond, N.A.G.M.; Kritzberg, E.; Conley, D.J.; Slomp, C.P. Large variations in iron input to an oligotrophic Baltic Sea estuary: Impact on sedimentary phosphorus burial. Biogeosciences 2018, 15, 6979–6996. [Google Scholar] [CrossRef] [Green Version]
  16. Froelich, P.N.; Bender, M.L.; Luedtke, N.A. The marine phosphorus cycle. Am. J. Sci. 1982, 4, 105. [Google Scholar] [CrossRef]
  17. Delaney, M.L. Phosphorus accumulation in marine sediments and the oceanic phosphorus cycle. Global Biogeochem. Cycles 1998, 12, 563–572. [Google Scholar] [CrossRef]
  18. Bouwman, A.F.; Bierkens, M.F.P.; Griffioen, J.; Hefting, M.M.; Middelburg, J.J.; Middelkoop, H.; Slomp, C.P. Nutrient dynamics, transfer and retention along the aquatic continuum from land to ocean: Towards integration of ecological and biogeochemical models. Biogeosciences 2013, 10, 1–22. [Google Scholar] [CrossRef] [Green Version]
  19. Knowles, R. Denitrification. Microbiol. Rev. 1982, 46, 43–70. [Google Scholar] [CrossRef]
  20. Seitzinger, S.P. Denitrification in freshwater and coastal marine ecosystems: Ecological and geochemical significance. Limnol. Oceanogr. 1988, 33, 702–724. [Google Scholar] [CrossRef]
  21. Seitzinger, S. Denitrification in aquatic sediments. In Denitrification in Soil and Sediment; Revsbech, N.P., Sørensen, J., Eds.; Plenum Press: New York, NY, USA, 1990; pp. 301–322. [Google Scholar]
  22. Smith, C.J.; DeLaune, R.D.; Patrick, W.H., Jr. Fate of riverine nitrate entering an estuary: I. Denitrification and nitrogen burial. Estuaries 1985, 8, 15–21. [Google Scholar] [CrossRef]
  23. Dalsgaard, T.; Thamdrup, B.; Canfield, D.E. Anaerobic ammonium oxidation (anammox) in the marine environment. Res. Microbiol. 2005, 156, 457–464. [Google Scholar] [CrossRef] [PubMed] [Green Version]
  24. Poulin, P.; Pelletier, E.; Saint-Louis, R. Seasonal variability of denitrification efficiency in northern salt marshes: An example from the St. Lawrence Estuary. Mar. Environ. Res. 2007, 63, 490–505. [Google Scholar] [CrossRef] [Green Version]
  25. Meyer, R.L.; Allen, D.E.; Schmidt, S. Nitrification and denitrification as sources of sediment nitrous oxide production: A microsensor approach. Mar. Chem. 2008, 110, 68–76. [Google Scholar] [CrossRef]
  26. Senga, Y.; Okumura, M.; Seike, Y. Seasonal and spatial variation in the denitrifying activity in estuarine and lagoonal sediments. J. Oceanogr. 2010, 66, 155–160. [Google Scholar] [CrossRef]
  27. Christensen, P.B.; Rysgaard, S.; Sloth, N.P.; Dalsgaard, T.; Schwærter, S. Sediment mineralization, nutrient fluxes, denitrification and dissimilatory nitrate reduction to ammonium in an estuarine fjord with sea cage trout farms. Aquat. Microb. Ecol. 2000, 21, 73–84. [Google Scholar] [CrossRef] [Green Version]
  28. An, S.M.; Gardner, W.S. Dissimilatory nitrate reduction to ammonium (DNRA) as a nitrogen link, versus denitrification as a sink in a shallow estuary (Laguna Madre/Baffin Bay, Texas). Mar. Ecol. Prog. Ser. 2002, 237, 41–50. [Google Scholar] [CrossRef]
  29. Nizzoli, D.; Carraro, E.; Nigro, V.; Viaroli, P. Effect of organic enrichment and thermal regime on denitrification and dissimilatory nitrate reduction to ammonium (DNRA) in hypolimnetic sediments of two lowland lakes. Water Res. 2010, 44, 2715–2724. [Google Scholar] [CrossRef]
  30. Jäntti, H.; Hietanen, S. The effects of hypoxia on sediment nitrogen cycling in the Baltic Sea. Ambio 2012, 41, 161–169. [Google Scholar] [CrossRef] [Green Version]
  31. Thamdrup, B. New Pathways and processes in the global nitrogen cycle. Annu. Rev. Ecol. Evol. Syst. 2012, 43, 407–428. [Google Scholar] [CrossRef]
  32. Giblin, A.E.; Tobias, C.R.; Song, B.; Weston, N.; Banta, G.T.; Rivera-Monroy, V.H. The importance of dissimilatory nitrate reduction to ammonium (DNRA) in the nitrogen cycle of coastal ecosystems. Oceanography 2013, 26, 124–131. [Google Scholar] [CrossRef] [Green Version]
  33. Burgin, A.J.; Hamilton, S.K. Have we overemphasized the role of denitrification in aquatic ecosystems? A review of nitrate removal pathways. Front. Ecol. Environ. 2007, 5, 89–96. [Google Scholar] [CrossRef] [Green Version]
  34. Tobias, C.R.; Anderson, I.C.; Canuel, E.A.; Macko, S.A. Nitrogen cycling through a fringing marsh-aquifer ecotone. Mar. Ecol. Prog. Ser. 2001, 210, 25–39. [Google Scholar] [CrossRef] [Green Version]
  35. Christensen, P.B.; Glud, R.N.; Dalsgaard, T.; Gillespie, P. Impacts of longline mussel farming on oxygen and nitrogen dynamics and biological communities of coastal sediments. Aquaculture 2003, 218, 567–588. [Google Scholar] [CrossRef]
  36. Ministry of the Environment, Japan. Available online: http://www.env.go.jp/water/heisa.html (accessed on 28 December 2020).
  37. Ministry of Land, Infrastructure, Transport and Tourism, Japan. Available online: http://www.pa.cgr.mlit.go.jp/chiki/suishitu/ (accessed on 28 December 2020).
  38. Scheffer, M. Alternative stable states in eutrophic, shallow freshwater systems: A minimal model. Hydrobiol. Bull. 1989, 23, 73–83. [Google Scholar] [CrossRef]
  39. Scheffer, M.; Carpenter, S.; Foley, J.A.; Folke, C.; Walker, B. Catastrophic shifts in ecosystems. Nature 2001, 413, 591–596. [Google Scholar] [CrossRef] [PubMed]
  40. Duarte, C.M.; Conley, D.J.; Carstensen, J.; Sanchez-Camacho, M. Return to Neverland: Shifting baselines affect eutrophication restoration targets. Estuar. Coasts 2009, 32, 29–36. [Google Scholar] [CrossRef] [Green Version]
  41. Yamamoto, T. The Set Inlad Sea—Eutrophic or oligotrophic? Mar. Poll. Bull. 2003, 47, 37–42. [Google Scholar] [CrossRef]
  42. Hiroshima City Agriculture, Forestry and Fisheries Promotion Center. Available online: http://www.haff.city.hiroshima.jp/suisansc/kaki_rekisi.html (accessed on 28 December 2020).
  43. Wahyudin Yamamoto, T. Modeling bottom-up and top-down controls on the low recruitment success of oyster larvae in Hiroshima Bay, Japan. Aquaculture 2020, 529, 735564. [Google Scholar] [CrossRef]
  44. Yamamoto, T.; Maeda, H.; Matsuda, O.; Hashimoto, T. Effects of culture density on the growth and fecal production of the oyster Crassostrea gigas. Nippon Suisan Gakkaishi 2009, 75, 230–236, (In Japanese with English Abstract). [Google Scholar] [CrossRef]
  45. Ray, N.E.; Fulweiler, R.W. Seasonal patterns of benthic-pelagic coupling in oyster habitats. Mar. Ecol. Prog. Ser. 2020, 652, 95–109. [Google Scholar] [CrossRef]
  46. Yamamoto, T.; Hashimoto, T.; Matsuda, O.; Go, A.; Nakaguchi, K.; Haraguchi, K. Comparison of sediment quality between Hiroshima Bay and Suo Nada-Special reference to the seasonal variations of sediment quality parameters and their relationships. Nippon Suisan Gakkaishi 2008, 74, 1037–1042, (In Japanese with English Abstract). [Google Scholar] [CrossRef] [Green Version]
  47. Conley, D.J.; Humborg, C.; Rahm, L.; Savchuk, O.P.; Wulff, F. Hypoxia in the Baltic Sea and basin-scale changes in phosphorus biogeochemistry. Environ. Sci. Technol. 2002, 36, 5315–5320. [Google Scholar] [CrossRef]
  48. Turner, R.E.; Rabalais, N.N.; Justic, D. Gulf of Mexico hypoxia: Alternate states and a legacy. Environ. Sci. Technol. 2008, 42, 2323–2327. [Google Scholar] [CrossRef]
  49. Hermans, M.; Lenstra, W.K.; van Helmond, N.A.G.M.; Behrends, T.; Egger, M.; Séguret, M.J.; Gustafsson, E.; Gustafsson, B.G.; Slomp, C.P. Impact of natural re-oxygenation on the sediment dynamics of manganese, iron and phosphorus in a euxinic Baltic Sea basin. Geochim. Cosmochim. Acta 2019, 246, 174–196. [Google Scholar] [CrossRef]
  50. Van Helmond, N.A.; Robertson, E.K.; Conley, D.J.; Hermans, M.; Humborg, C.; Kubeneck, L.J.; Lenstra, W.K.; Slomp, C.P. Removal of phosphorus and nitrogen in sediments of the eutrophic Stockholm archipelago, Baltic Sea. Biogeosciences 2020, 17, 2745–2766. [Google Scholar] [CrossRef]
  51. Abo, K.; Yamamoto, T. Oligotrophication and its measures in the Seto Inland Sea, Japan. Bull. Jap. Fish. Res. Edu. Agen. 2019, 49, 21–26. [Google Scholar]
  52. E-Stat, Statistics of Japan. Available online: https://www.e-stat.go.jp/ (accessed on 28 December 2020).
  53. Ministry of the Environment, Japan. The Partial Revision of the ‘Law Concerning Special Measures for Conservation of the Environment of the Seto Inland Sea’. Available online: https://www.env.go.jp/water/heisa/setonaikai_law_rev.html (accessed on 8 June 2021).
  54. Ministry of the Environment, Japan. Research on the Basic Information of Environmental Conditions of the Seto Inland Sea, Japan (I); CD-ROM; Ministry of the Environment: Tokyo, Japan, 1988. (In Japanese)
  55. Ministry of the Environment, Japan. Research on the Basic Information of Environmental Conditions of the Seto Inland Sea, Japan (II); CD-ROM; Ministry of the Environment: Tokyo, Japan, 1997. (In Japanese)
  56. Ministry of the Environment, Japan. Research on the Basic Information of Environmental Conditions of the Seto Inland Sea, Japan (III); CD-ROM; Ministry of the Environment: Tokyo, Japan, 2006. (In Japanese)
  57. Ministry of the Environment, Japan. The Methods of Sediment Analyses. 1998. Available online: http://www.env.go.jp/hourei/05/000178.html (accessed on 28 December 2020).
  58. Yamamoto, T.; Yoshikawa, S.; Hashimoto, T.; Takasugi, Y.; Matsuda, O. Estuarine circulation processes in the northern Hiroshima Bay, Japan. Bull. Coast. Oceanogr. 2000, 37, 111–118, (In Japanese with English abstract). [Google Scholar]
  59. Yamamoto, H.; Yamamoto, T.; Takada, T.; Mito, Y.; Takahashi, T. Dynamic analysis of oxygen-deficient water mass formed in the northern part of Hiroshima Bay using a pelagic-benthic coupled ecosystem model. J. Jap. Soc. Water Envir. 2011, 34, 19–28, (In Japanese with English Abstract). [Google Scholar] [CrossRef] [Green Version]
  60. Nishimura, K.; Sayanagi, K.; Nagao, T.; Murakami, F.; Joshima, M.; Takatou, M. Digitization of an analog sub-bottom profiler. J. Sch. Mar. Sci. Tech. Tokai Univ. 2008, 6, 129–139, (In Japanese with English Abstract). [Google Scholar]
  61. Arakawa, K. Teishitsu Chousa Hou (Methods of Sediment Quality Analyses). In Suishitsu Odaku Chosa Shishin; Japanese Fishery Resource Conservation Association, Ed.; Japanese Fishery Resource Conservation Association: Tokyo, Japan, 1980; pp. 237–272. (In Japanese) [Google Scholar]
  62. Rickard, D.; Morse, J.W. Acid volatile sulfide (AVS). Mar. Chem. 2005, 97, 141–197. [Google Scholar] [CrossRef]
  63. Asaoka, S.; Yamamoto, T.; Hayakawa, S. Removal of hydrogen sulfide using granulated coal ash. J. Japan Soc. Wat. Environ. 2009, 32, 363–368, (In Japanese with English Abstract). [Google Scholar] [CrossRef] [Green Version]
  64. Asaoka, S.; Yamamoto, T.; Takahashi, Y.; Yamamoto, H.; Kim, K.H.; Orimoto, K. Development of an on-site simplified determination method for hydrogen sulfide in marine sediment pore water using a shipboard ion electrode with consideration of hydrogen sulfide oxidation rate. In Interdisciplinary Studies on Environmental Chemistry—Environmental Pollution and Ecotoxicology; Kawaguchi, M., Misaki, K., Sato, H., Yokokawa, T., Itai, T., Nguyen, T.M., Ono, J., Tanabe, S., Eds.; TERRAPUB: Tokyo, Japan, 2012; pp. 345–352. [Google Scholar]
  65. Japan Fisheries Resource Conservation Association. Standard for Fisheries Water; Japanese Fishery Resource Conservation Association: Tokyo, Japan, 1995; 68p. (In Japanese) [Google Scholar]
  66. Kittiwanich, J.; Yamamoto, T.; Kawaguchi, O.; Hashimoto, T. Analyses of phosphorus and nitrogen cyclings in the estuarine ecosystem of Hiroshima Bay by a pelagic and benthic coupled model. Est. Coast. Shelf Sci. 2007, 75, 189–204. [Google Scholar] [CrossRef]
  67. Hiroshima Fisheries and Marine Technology Center. Available online: https://www.pref.hiroshima.lg.jp/soshiki/32/suigi-top.html (accessed on 31 May 2021).
  68. Kim, D.H.; Matsuda, O.; Yamamoto, T. Nitrification, denitrification and nitrate reduction rates in the sediment of Hiroshima Bay, Japan. J. Oceanogr. 1997, 53, 317–324. [Google Scholar]
  69. Yamamoto, T.; Takeshita, K.; Hiraga, N.; Hashimoto, T. An estimation of net ecosystem metabolism and net denitrification of the Seto Inland Sea, Japan. Ecol. Model. 2008, 215, 55–68. [Google Scholar] [CrossRef]
  70. Yamamoto, T.; Kubo, A.; Hashimoto, T.; Nishii, Y. Long-term changes in net ecosystem metabolism and net denitrification in the Ohta River estuary of northern Hiroshima Bay—An analysis based on the phosphorus and nitrogen budgets. In Progress in Aquatic Ecosystem Research; Burk, A.R., Ed.; Nova Science Publisher, Inc.: New York, NY, USA, 2005; pp. 99–120. [Google Scholar]
  71. Kuroda, A.; Takiguchi, N.; Kato, J.; Ohtake, H. Development of technolgies to save phosphorus resources in response to phosphate crisis. J. Environ. Biotech. 2005, 4, 87–94. (In Japanese) [Google Scholar]
  72. Ministry of the Environment, Japan. Environmental Technology Verification (ETV) Program. Available online: https://www.env.go.jp/policy/etv/ (accessed on 4 June 2021).
  73. Asaoka, S.; Yamamoto, T.; Kondo, S.; Hayakawa, S. Removal of hydrogen sulfide using crushed oyster shell from pore water to remediate organically enriched coastal marine sediments. Biores. Technol. 2009, 100, 4127–4132. [Google Scholar] [CrossRef] [Green Version]
  74. Yamamoto, T.; Kondo, S.; Kim, K.H.; Asaoka, S.; Yamamoto, H.; Tokuoka, M.; Hibino, T. Remediation of muddy tidal flat sediments using hot air-dried crushed oyster shells. Mar. Poll. Bull. 2012, 64, 2428–2434. [Google Scholar] [CrossRef] [PubMed]
  75. Asaoka, S.; Yamamoto, T. Blast furnace slag can effectively remediate coastal marine sediments affected by organic enrichment. Mar. Poll. Bull. 2010, 60, 573–578. [Google Scholar] [CrossRef] [PubMed] [Green Version]
  76. Kim, K.H.; Asaoka, S.; Yamamoto, T.; Hayakawa, S.; Takeda, K.; Katayama, M.; Onoue, T. Mechanisms of hydrogen sulfide removal with steel making slag. Environ. Sci. Technol. 2012, 46, 10169–10174. [Google Scholar] [CrossRef]
  77. Asaoka, S.; Yamamoto, T.; Yoshioka, I.; Tanaka, H. Remediation of coastal marine sediments using granulated coal ash. J. Hazard. Mat. 2009, 172, 92–98. [Google Scholar] [CrossRef] [Green Version]
  78. Asaoka, S.; Hayakawa, S.; Kim, K.H.; Takeda, K.; Katayama, M.; Yamamoto, T. Combined adsorption and oxidation mechanisms of hydrogen sulfide on granulated coal ash. J. Coll. Interface Sci. 2012, 377, 284–290. [Google Scholar] [CrossRef] [PubMed] [Green Version]
  79. Harada, Y. Outlook of Japan’s policy in recycling phosphorus from sewage. J. Japan Soc. Wat. Environ. 2011, 34, 2–6. (In Japanese) [Google Scholar]
  80. Abelson, P.H. A potential phosphate crisis. Science 1999, 283, 2015. [Google Scholar] [CrossRef]
  81. Komai, Y. Changes of sediment quality and benthos in the Seto Inland Sea. In Sediment Quality of the Seto Inland Sea, Japan; Yanagi, T., Ed.; Kouseisha-Kouseikaku: Tokyo, Japan, 2008; pp. 43–60. (In Japanese) [Google Scholar]
  82. Ingall, E.D.; Bustin, R.M.; Vancappellen, P. Influence of water column anoxia on the burial and preservation of carbon and phosphorus in marine shales. Geochim. Cosmochim. Acta 1993, 57, 303–316. [Google Scholar] [CrossRef]
  83. Rozan, T.F.; Taillefert, M.; Trouwborst, R.E.; Glazer, B.T.; Ma, S.F.; Herszage, J.; Valdes, L.M.; Price, K.S.; Luther, G.W. Iron-sulfur-phosphorus cycling in the sediments of a shallow coastal bay: Implications for sediment nutrient release and benthic macroalgal blooms. Limnol. Oceanogr. 2002, 47, 1346–1354. [Google Scholar] [CrossRef] [Green Version]
  84. Heidenreich, M.; Kleeberg, A. Phosphorus-binding in iron-rich sediments of a shallow Reservoir: Spatial characterization based on sonar data. Hydrobiologia 2003, 506, 147–153. [Google Scholar] [CrossRef]
  85. Hiroshima Prefecture: Records of Huge Desarsters in Hiroshima Area. Available online: https://www.sabo.pref.hiroshima.lg.jp/portal/sonota/saigai/002dosya.htm (accessed on 20 June 2021).
  86. Yamamoto, T.; Hanazato, T. Oligotrophication in Seas and Lakes—No Fish. in Clear Water; Yamamoto, T., Hanazato, T., Eds.; Chijin Shokan: Tokyo, Japan, 2015; p. 195. (In Japanese) [Google Scholar]
  87. Harada, K.; Abo, K.; Kawasaki, S.; Takesako, F.; Miyahara, K. Influence of DIN derived from ports and treated sewage effluent on nori (Pyropia) farms of the northeastern part of Harima Nada. Bull. Jpn. Soc. Fish. Oceanogr. 2018, 82, 26–35, (In Japanese with English Abstract). [Google Scholar]
  88. Abo, K.; Tarutani, K.; Harada, K.; Miyahara, K.; Nakayama, A.; Yagi, H. Effects of nutrient discharge on Nori aquaculture area in Kako River estuary. J. JSCE Ser. B2 Coast. Eng. 2012, 68, I1116–I1120, (In Japanese with English Abstract). [Google Scholar]
  89. House of Representatives, Japan. The Diet, No. 204, Report on Discussions of The Partial Revision of the ‘Law Concerning Special Measures for Conservation of the Environment of the Seto Inland Sea’. Available online: https://www.shugiin.go.jp/internet/itdb_gian.nsf/html/gian/keika/1DD1E7A.htm (accessed on 9 June 2021).
  90. Yamamoto, T.; Ishida, S.; Nakahara, S.; Hiraoka, K.; Omichi, Y.; Mutsuda, H. Fertilizer application to enhance the growth of raft-cultured oysters. In Proceedings of the JSFS 85th Anniversary-Commemorative International Symposium “Fisheries Science for Future Generations”, Tokyo, Japan, 22–24 September 2017. No. 05001, 2p. [Google Scholar]
  91. Yamamoto, H.; Yamamoto, T.; Mito, Y.; Asaoka, S. Numerical evaluation of the use of granulated coal ash to reduce an oxygen-deficient water mass. Mar. Poll. Bull. 2016, 107, 188–205. [Google Scholar] [CrossRef] [PubMed]
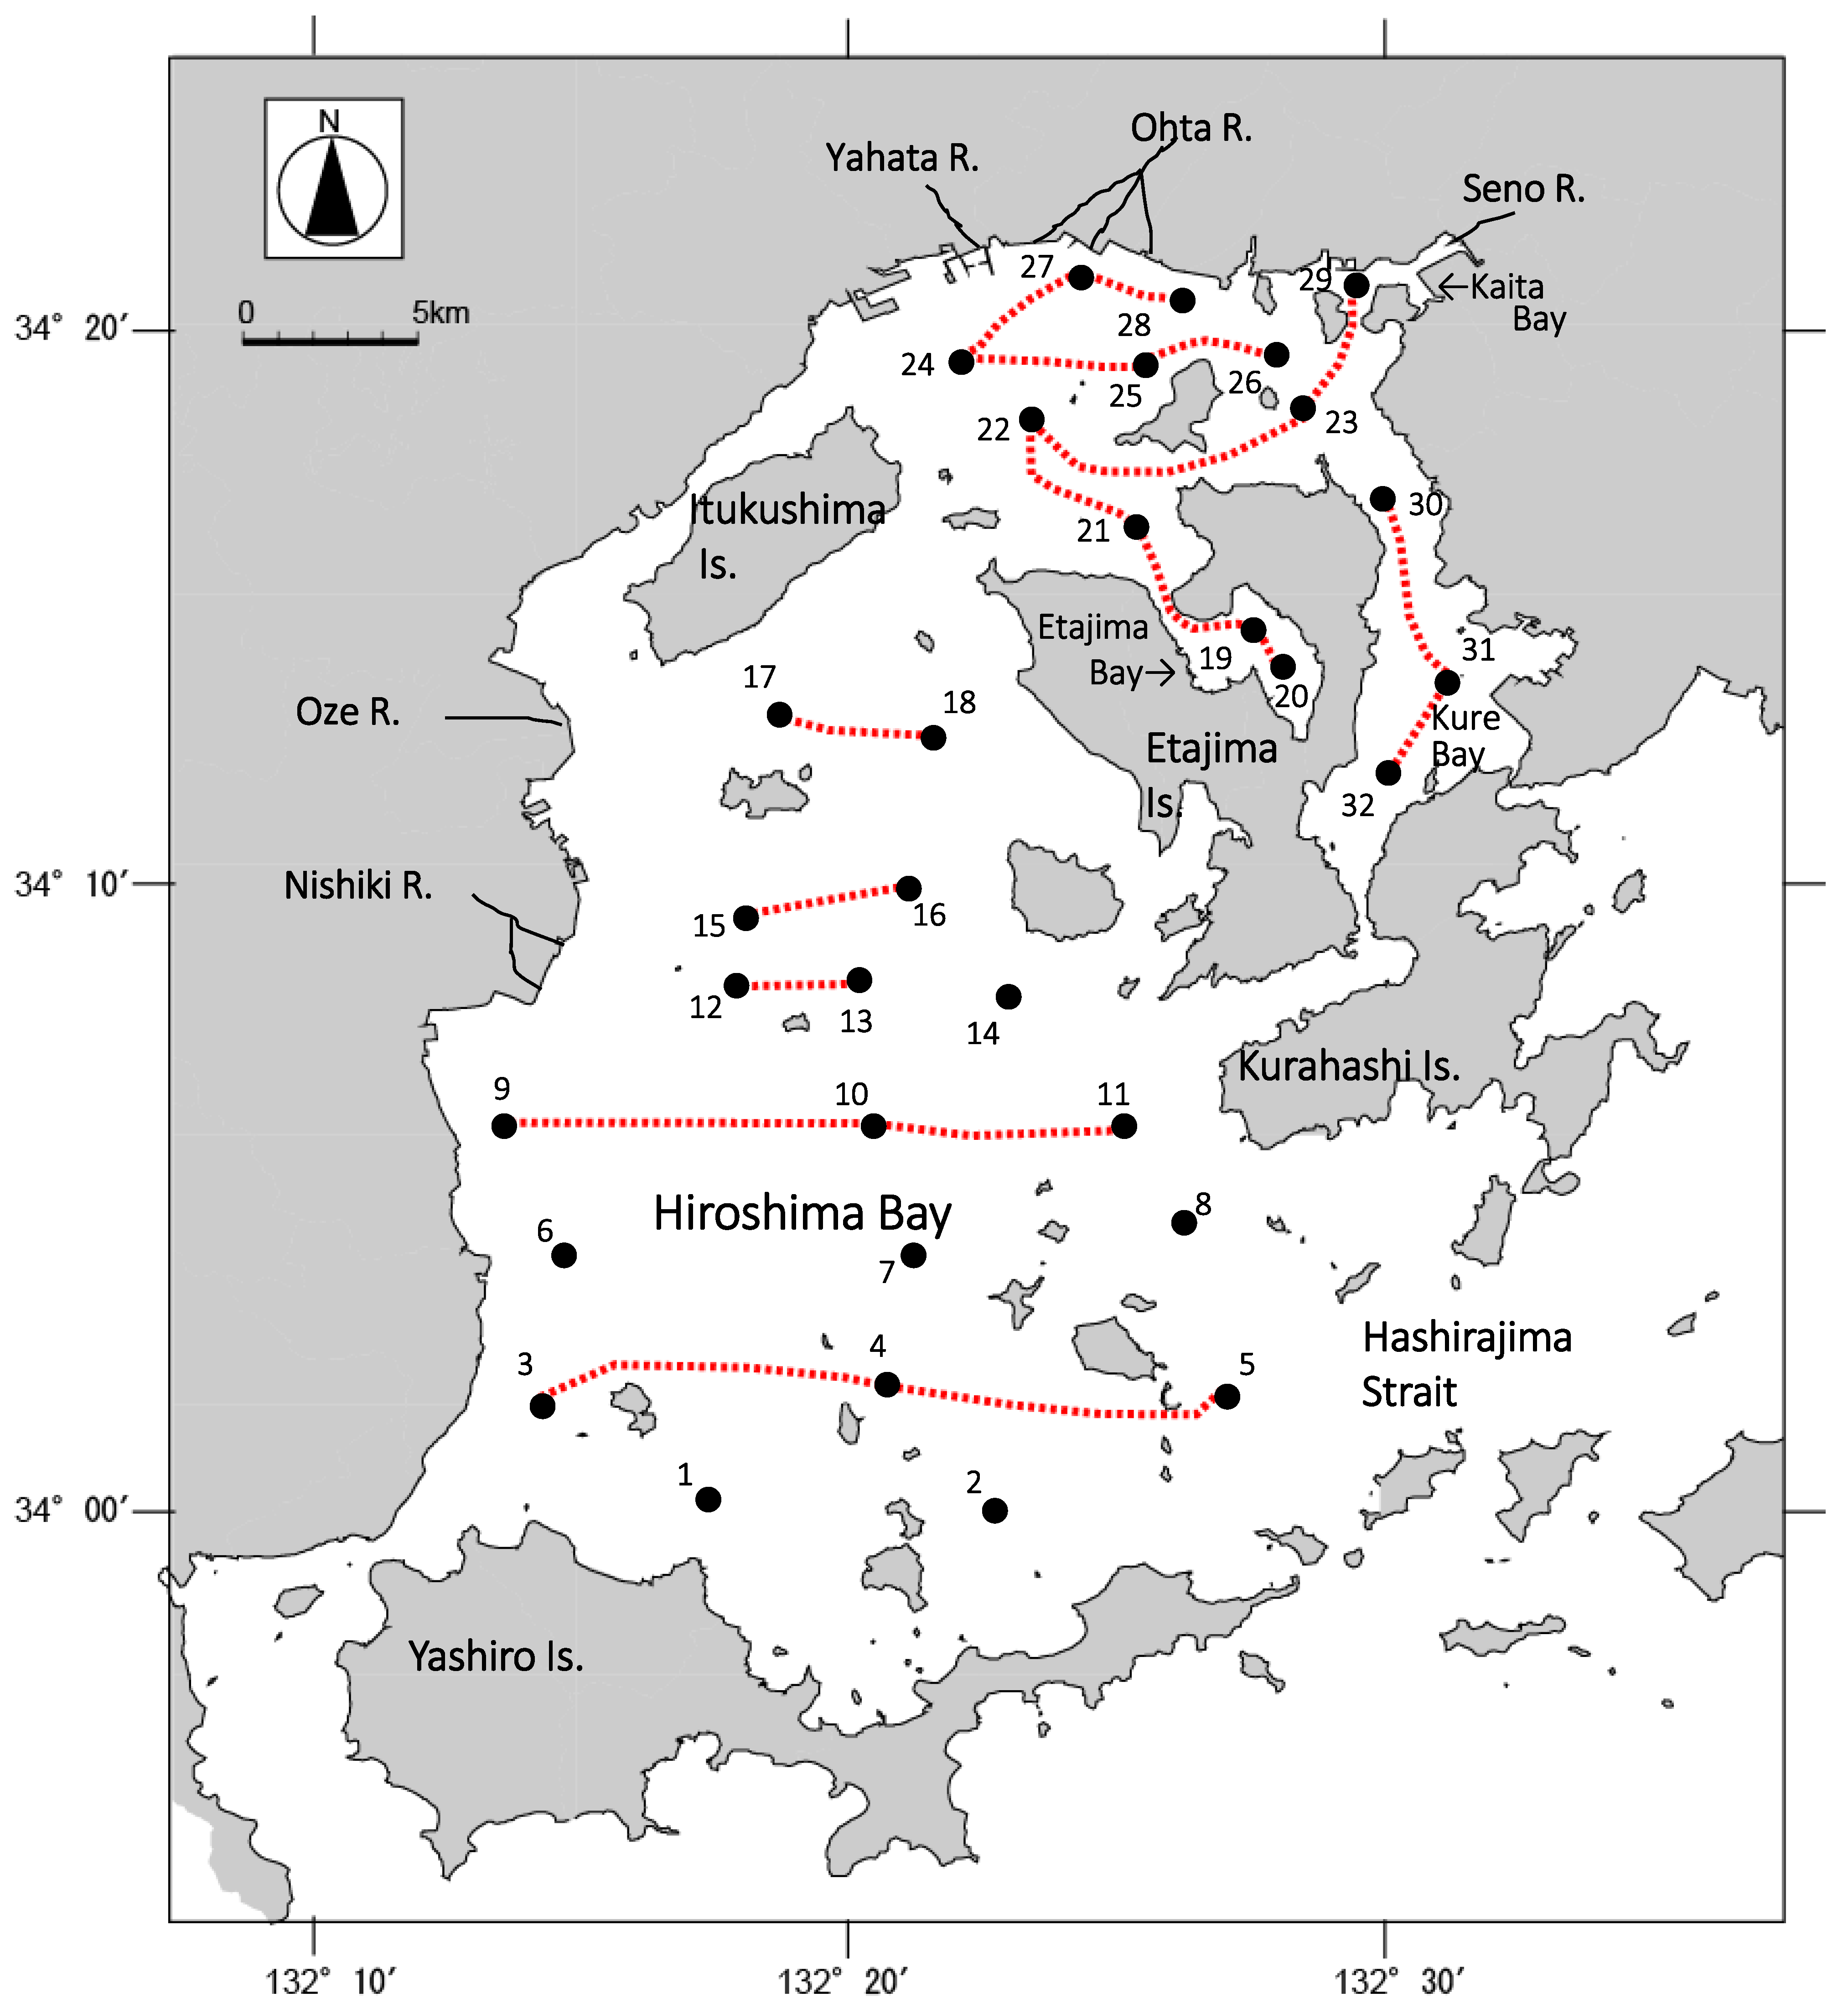
Figure 1. Map showing the monitoring lines of sediment thickness (dotted line) and core sampling stations (filled circle). 5–8 October 2010.
Oceans 02 00031 g001
Figure 2. Vertical distributions of total organic carbon (TOC), total nitrogen (TN), total sulfur (TS), and total phosphorus (TP) at selected stations. 5–8 October 2010. The number in the figure indicates the station number of the selected stations; 27 (the Ohta River mouth), 9 (the Nishiki River mouth), 22 (the center of nHB), 10 (the center of sHB), 31, 32 (Kure Bay), and 19, 20 (Etajima Bay), respectively.
Oceans 02 00031 g002
Figure 3. Spatial distributions of the total organic carbon content of muddy surface sediments (0–5 cm) in Hiroshima Bay in 5–8 October 2010.
Oceans 02 00031 g003
Figure 4. Spatial distributions of the nitrogen content of muddy surface sediments (0–5 cm) in Hiroshima Bay in 5–8 October 2010.
Oceans 02 00031 g004
Figure 5. Spatial distributions of the sulfur content of muddy surface sediments (0–5 cm) in Hiroshima Bay in 5–8 October 2010.
Oceans 02 00031 g005
Figure 6. Spatial distributions of the phosphorus content of muddy surface sediments (0–5 cm) in Hiroshima Bay in 5–8 October 2010.
Oceans 02 00031 g006
Figure 7. Spatial distributions of the thickness of muddy sediments in Hiroshima Bay estimated for the observed data in 5–8 October 2010.
Oceans 02 00031 g007
Figure 8. Temporal variations of bottom water (a) dissolved oxygen (DO), (b) PO4-P, (c) NH4-N and (d) NO3-N concentrations. The samples were collected at 1 m above the bottom. Data are cited from Hiroshima Fisheries and Marine Technology Center [67]. Month names were given to the top 10 annual peak values for each nutrient species (lowest 10 for DO) at Station 31 (Kure Bay) during 1988 to 2010 since the data set was not complete before 1987.
Oceans 02 00031 g008
Table 1. Average (Avg) and standard deviation (Stdev) of TOC, TN, TS, and TP in the Hiroshima Bay sediments observed in 5–8 October 2010. Coefficient of variation (CV, %) is also shown.
Depth (cm)TOC (mg C g dry−1)TN (mg N g dry−1)TS (mg S g dry−1)TP (mg P g dry−1)
AvgStdevCV (%)AvgStdevCV (%)AvgStdevCV (%)AvgStdevCV (%)
2.5153171.60.5323.91.4350.570.046
7.5143211.40.4313.91.3320.520.049
12.5143241.20.4334.11.7410.500.0611
17.5133251.20.4353.71.6430.460.036
25124301.20.4363.61.3370.460.048
Table 2. Summary of observed parameters (Eh, water content, ignition loss, acid volatile sulfide, and hydrogen sulfide) in the surface (0–5 cm) sediments of Hiroshima Bay. 5–8 October 2010. H2S is the concentration in the interstitial water of sediment. N and S mean northern and southern Hiroshima Bay, respectively.
ParametersAreaValue Range
Eh (mV)N−150–−27
S−153–+45
WC (%)N69.8–82.5
S46.6–81.8
IL (%)N10.9–12.7
S4.8–11.3
AVS (mg g dw−1)N0.17–1.14
S0.04–0.35
H2S (mg L−1)N0–19
S0–23
Table 3. Comparison of TOC, TN, and TP values between those reported by Ministry of the Environment, Japan [54,55,56] and the present study (2010). The sediments were collected from the same depth in all samples (0–5 cm) in Hiroshima Bay. A similar number of sampling stations were included in the observations (46 in 1982, 23 in 1993 and 2003, and 32 in 2010), and were evenly distributed throughout the bay.
Year TOC (mg g−1)TN (mg g−1)TP (mg g−1)References
1982Max303.50.75[54]
Min9.61.00.34
Avg202.50.59
SD5.40.660.11
CV (%)272718
1993Max262.80.62[55]
Min2.80.360.26
Avg182.10.53
SD5.70.620.090
CV (%)323017
2003Max293.10.68[56]
Min4.40.600.20
Avg172.20.51
SD6.80.780.12
CV (%)393623
Oct 2020Max213.00.66This study
Min9.40.620.49
Avg151.60.57
SD2.60.500.040
CV (%)17326
Publisher’s Note: MDPI stays neutral with regard to jurisdictional claims in published maps and institutional affiliations.