1. Introduction
Tems et al. [
1] analysed deep-sea sediment cores from the Pescadero Basin, 616 m water depth, adjacent to the Pacific coast of central Mexico (
Figure 1), to look for oceanographic evidence of oxygen minimum zone (OMZ) and productivity variations over the last 1200 years. They suggested that long-term variability in the North American Monsoon (NAM) might be the cause of their observed variability. On a seasonal basis, the winter (dry) phase of the NAM produces offshore winds and significant coastal upwelling that would produce high productivity and stronger OMZ, while the summer (wet) phase produces onshore winds that diminish upwelling, weaken the OMZ, and cause significant rainfall [
2,
3,
4]. Tems et al. [
1] hypothesized that longer-term variability in the NAM, due to a changing ratio of winter versus summer dominance in the NAM, caused their observed pattern of OMZ/productivity variability and might be due to multi-decadal- to centennial-scale Pacific Decadal Oscillations (PDO; [
5,
6,
7]).
In this paper we use rock magnetic studies from the same cores to study sediment variability (proportion of clastic flux per unit time and clastic grain size) in Pescadero Basin that we think is due to variable coastal Mexico rainfall and runoff to the neighboring Pescadero Basin (
Figure 1). This is the first deep-sea sediment study along the California/Mexico Pacific margin to consider long-term variability in coastal hydrologic variability. We think that multi-decadal- to centennial-scale oscillations in summer versus winter dominance of the NAM can also explain our sedimentologic data. Our sedimentologic variations strongly correlate with the Tems et al. [
1] evidence for OMZ/paleoproductivity variations. They note long-term oscillations in the NAM winter (dry) phase; we note long-term oscillations in the NAM summer (wet) phase. They see a strong NAM winter (dry) phase when we see a weak NAM summer (wet) phase and visa versa. We view these two separate patterns of variability to be common-cause responses to long-term variability in winter versus summer dominance in the NAM.
2. Methods and Materials
Sediment cores from Pescadero Basin (
Table 1) were studied rock magnetically to assess the concentration of magnetic particles in the sediments, the magnetic grain size distribution, and variations in the percentage of various magnetic minerals. Such measurements have been used routinely, e.g., [
8,
9], as proxies for variations in bulk clastic sedimentology (clastic concentration, grain size, mineralogy).
Two gravity cores (PESC-GC1, 138 cm and PESC-GC3, 204 cm) and an associated multicore (PESC-MC1, 64 cm) were recovered from the Pescadero Basin (
Figure 1; 24.28° N, 108.20° W) in 616 m water depth. Cores were stored in a cold room (5 °C) and subsequently sampled at USC. All cores were sampled with contiguous 2 × 2 × 2 cm cubes for our magnetic studies. We report only on cores MC1 and GC3 because they were the primary cores studied by Tems et al. (2016) [
1]. The results of GC1 and GC3 are not significantly different. Magnetic susceptibility (chi) of all samples was initially measured. Then the natural remanence (NRM) was measured and step-wise demagnetized and measured in 10 mT steps up to 60 mT. Next, two artificial remanences were sequentially applied (anhysteretic remanence, ARM, with 0.1 T af field and 0.05 mT bias field; saturation isothermal remanence, SIRM, with 1T bias field) and measured, then step-wise demagnetized in fields of 10 mT, 20 mT, 40 mT, and 60 mT.
Variations in chi, ARM, and SIRM intensity were used to assess the concentration of magnetic particles in the sediments (and by proxy, clastic sediment concentration). The ratios ARM/chi, ARM20/0, and SIRM20/0 were used to estimate the percentage of finer-grained magnetic particles (and by proxy, clastic grain size variability). The ratios ARM20/0 and SIRM20/0 (ARM or SIRM intensity after 20 mT af demagnetization divided by their initial intensity) estimate how strongly remanence is retained in sediments (coercivity). Higher ratios indicate higher coercivity; finer-grained sediments have higher coercivity while coarser-grained sediments have lower coercivity. Thus, higher (lower) ARM20/0 and SIRM20/0 ratios estimate more (less) fine-grained (clays) sediments versus coarser-grained (silt, sand) sediments.
Tems et al. [
1] used δ
15N of the bulk sediment in our cores to estimate the degree of bottom water oxygenation in Pescadero Basin. Higher (lower) δ
15N values indicated lower (higher) bottom water oxygenation. This was used to establish the strength of the oxygen minimum zone (OMZ) in Pescadero Basin as a function of time. Tems et al. [
1] also measured total organic content (TOC) and Br/Cl variations in the sediment by XRF studies. High TOC and Br/Cl values indicated more organic material. High organic content is associated with high δ
15N (low bottom water oxygenation). Tems et al. [
1] argued that these variations were due to variations in the NAM dry/winter phase with offshore winds. Stronger winter/dry offshore winds created more upwelling, higher biologic productivity, higher δ
15N and stronger OMZs. Our rock magnetic study will test the long-term variability in the NAM that Tems et al. [
1] reconstructed.
Tems et al. [
1] used a combination of lead-210 dating and radiocarbon dating to develop a chronology for these cores. Laminae-couplet counting was also conducted and shows that most of the sediment accumulation in PESC-GC3 was continuous in rate and that couplets do occur annually. The overall sediment accumulation rate is ~200 cm/ky. Each magnetic sample is 2 cm
3, and so averages about 10 years. The Nyquist frequency for magnetic variability is then ~0.05 cycles/ky (20 year minimum period). We will use this chronology below to correlate our rock magnetic data to other regional records of NAM and their variability.
3. Results
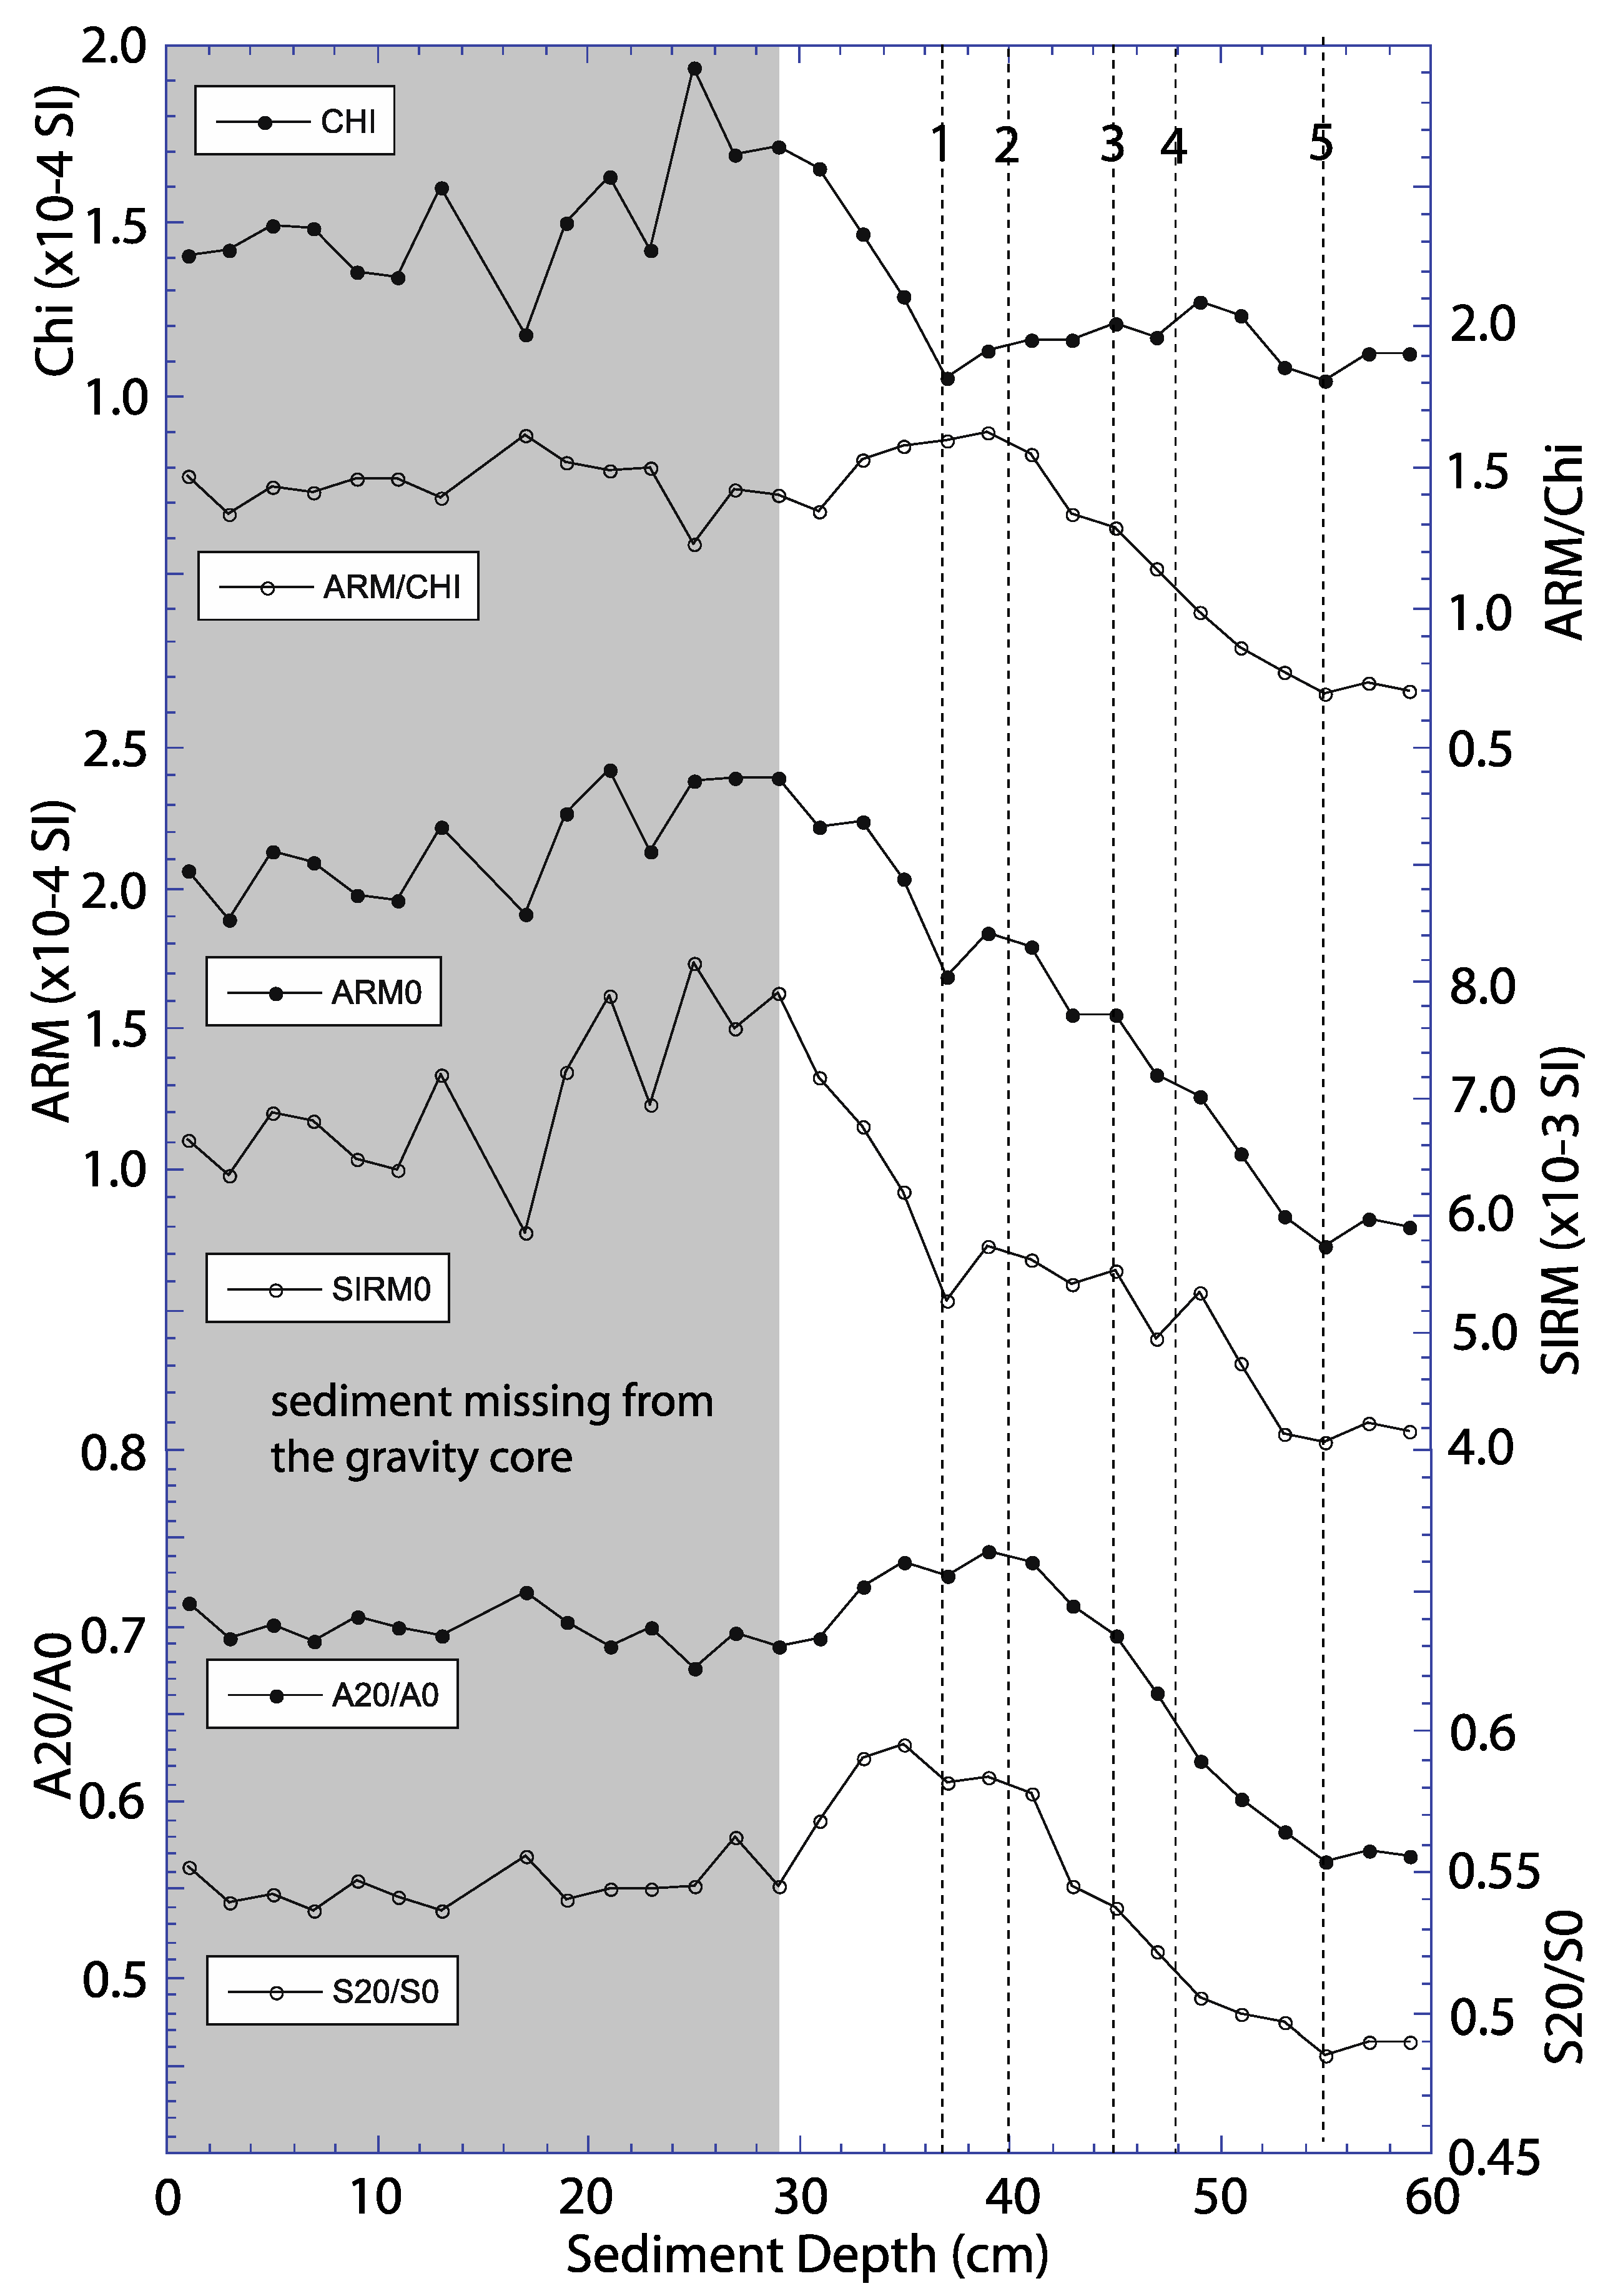
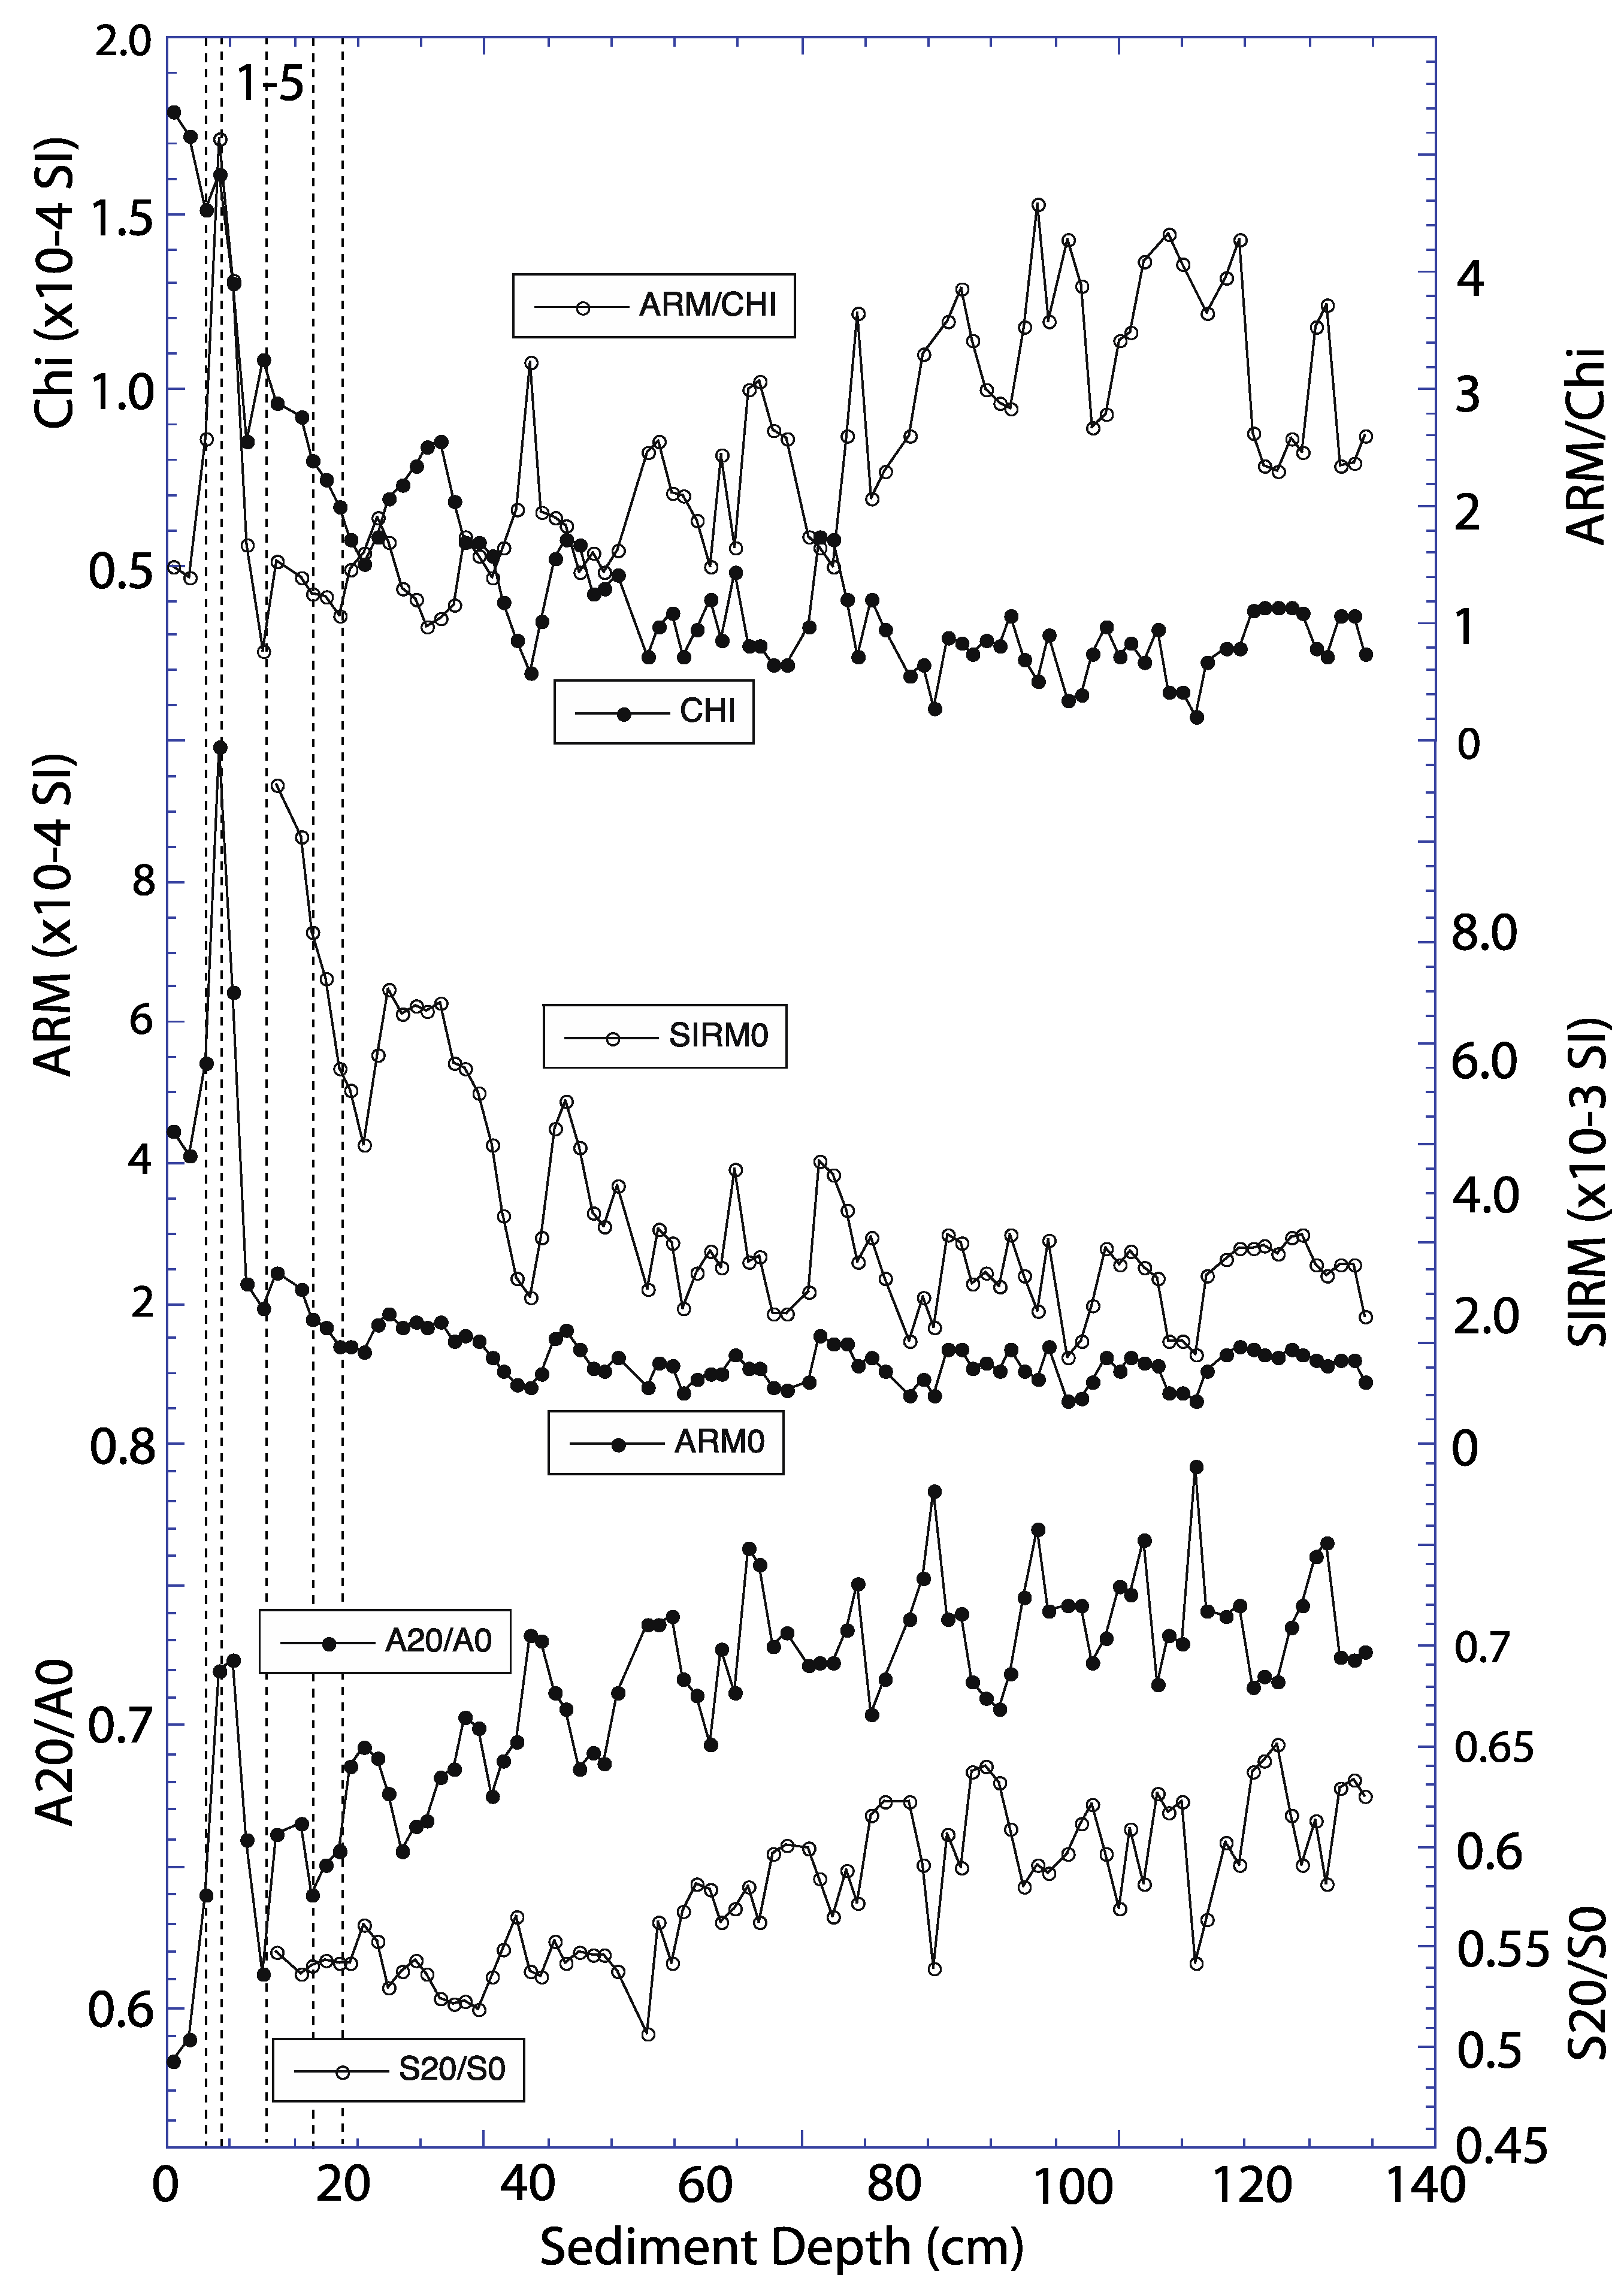
Figure 2 and
Figure 3 summarize the magnetic intensities and selected magnetic ratios for both cores. Both the magnetic intensities and magnetic ratios strongly covary in both cores and contain both decimeter oscillations and a long-term trend. There is a notable drop in all intensities within the uppermost 20–50 cm. We attribute this to overall magnetic mineral dissolution of the finest magnetic grains associated with relatively high organic content and porewater anoxia. This pattern of magnetic behavior is common along California coastline marine sediments where high organic productivity occurs e.g., [
10,
11,
12].
We next compared the rock magnetic parameters between PESC-MC1 and PESC-GC3 to estimate their pattern of overlap. Our initial assumption was that the multicore should contain a complete record of the uppermost sediment with the sediment/water interface intact. The gravity core could possibly be missing some of the surface sediment due to coring processes. Twelve clear magnetic intensity or ratio highs/lows could be correlated between the cores and there was a simple linear relationship identified between them.
Figure 2 and
Figure 3 show five distinctive horizons in both cores with distinctive patterns of magnetic highs/lows that summarize those correlations. The correlations indicated that PESC-MC1 had 28.8 cm of sediment (
Figure 2, grey zone) not present in PESG-GC3 [
1]. In addition, rock magnetic variability in MC1 below the top 28.8 cm was consistent with the uppermost rock magnetic variability in GC3. It makes sense that the uppermost ~28.8 cm in MC1 was lost from the top of GC3 during coring and that we use that in our analysis to complement the rest of GC3.
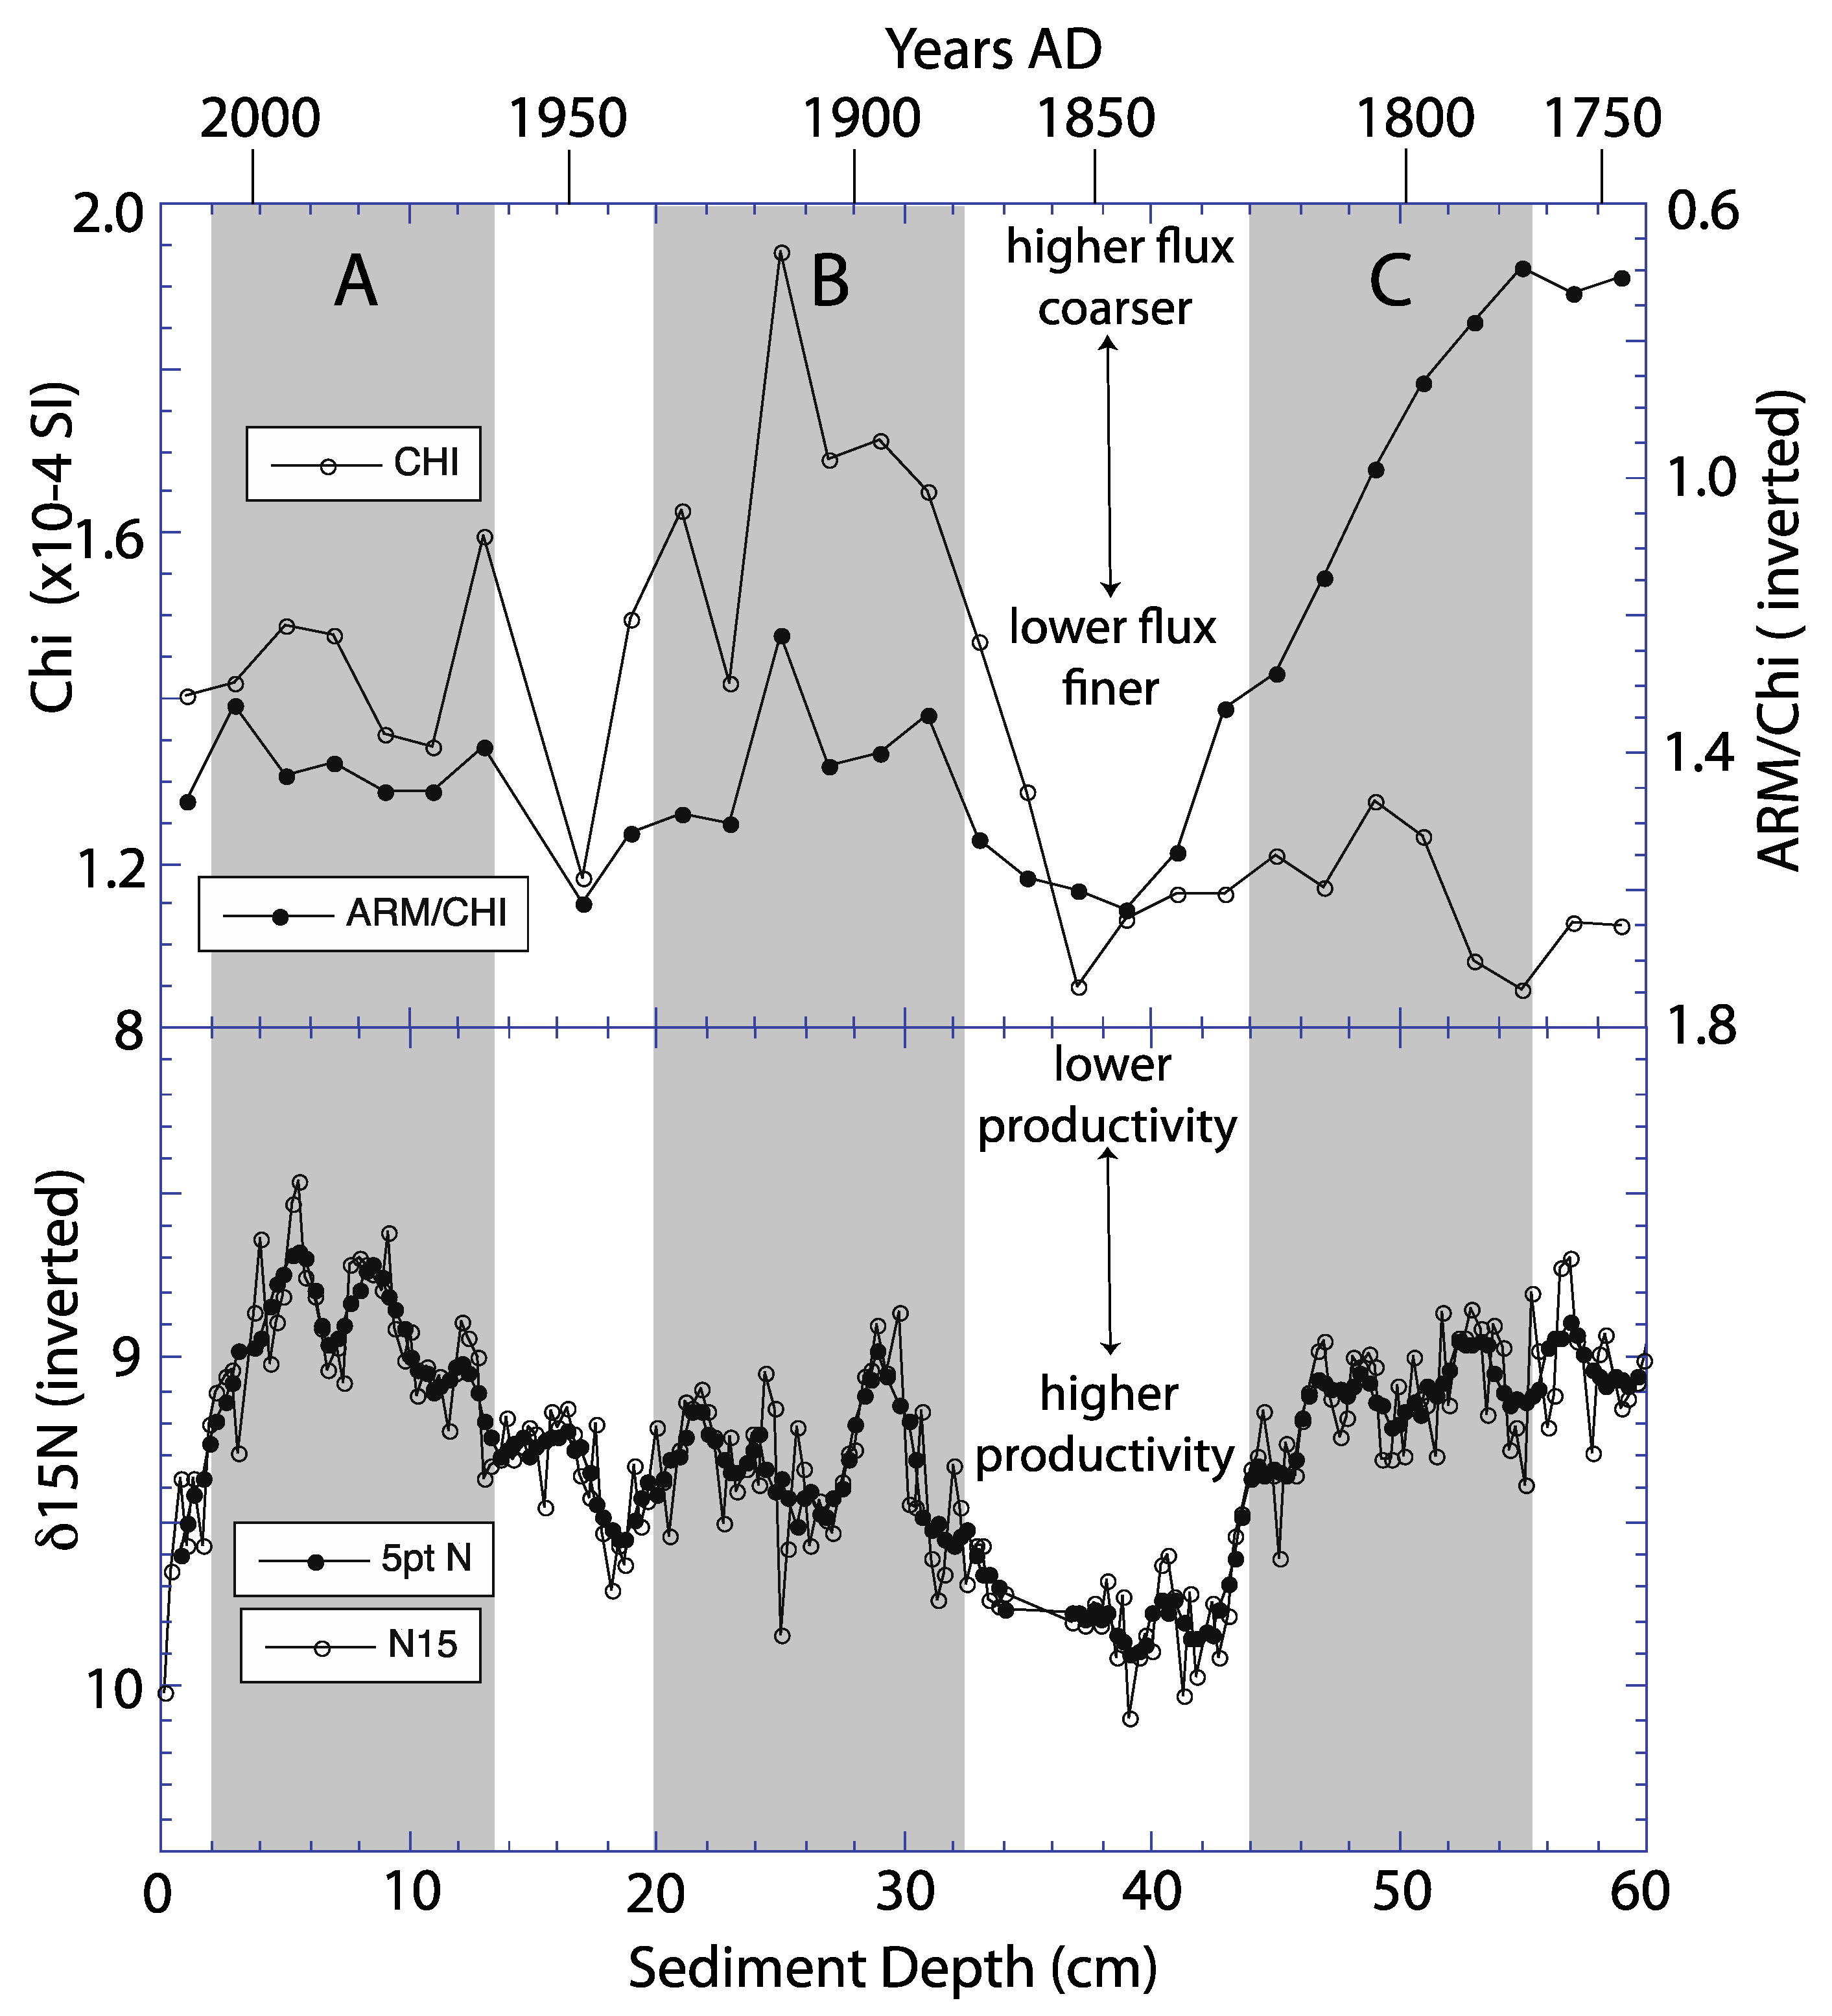
There is a distinctive, oscillatory decimeter pattern of rock magnetic variability that occurs in both cores. All magnetic intensity indicators covary and all magnetic ratios covary with high intensities correlating with low magnetic ratios and visa versa. This pattern is shown in
Figure 4 and
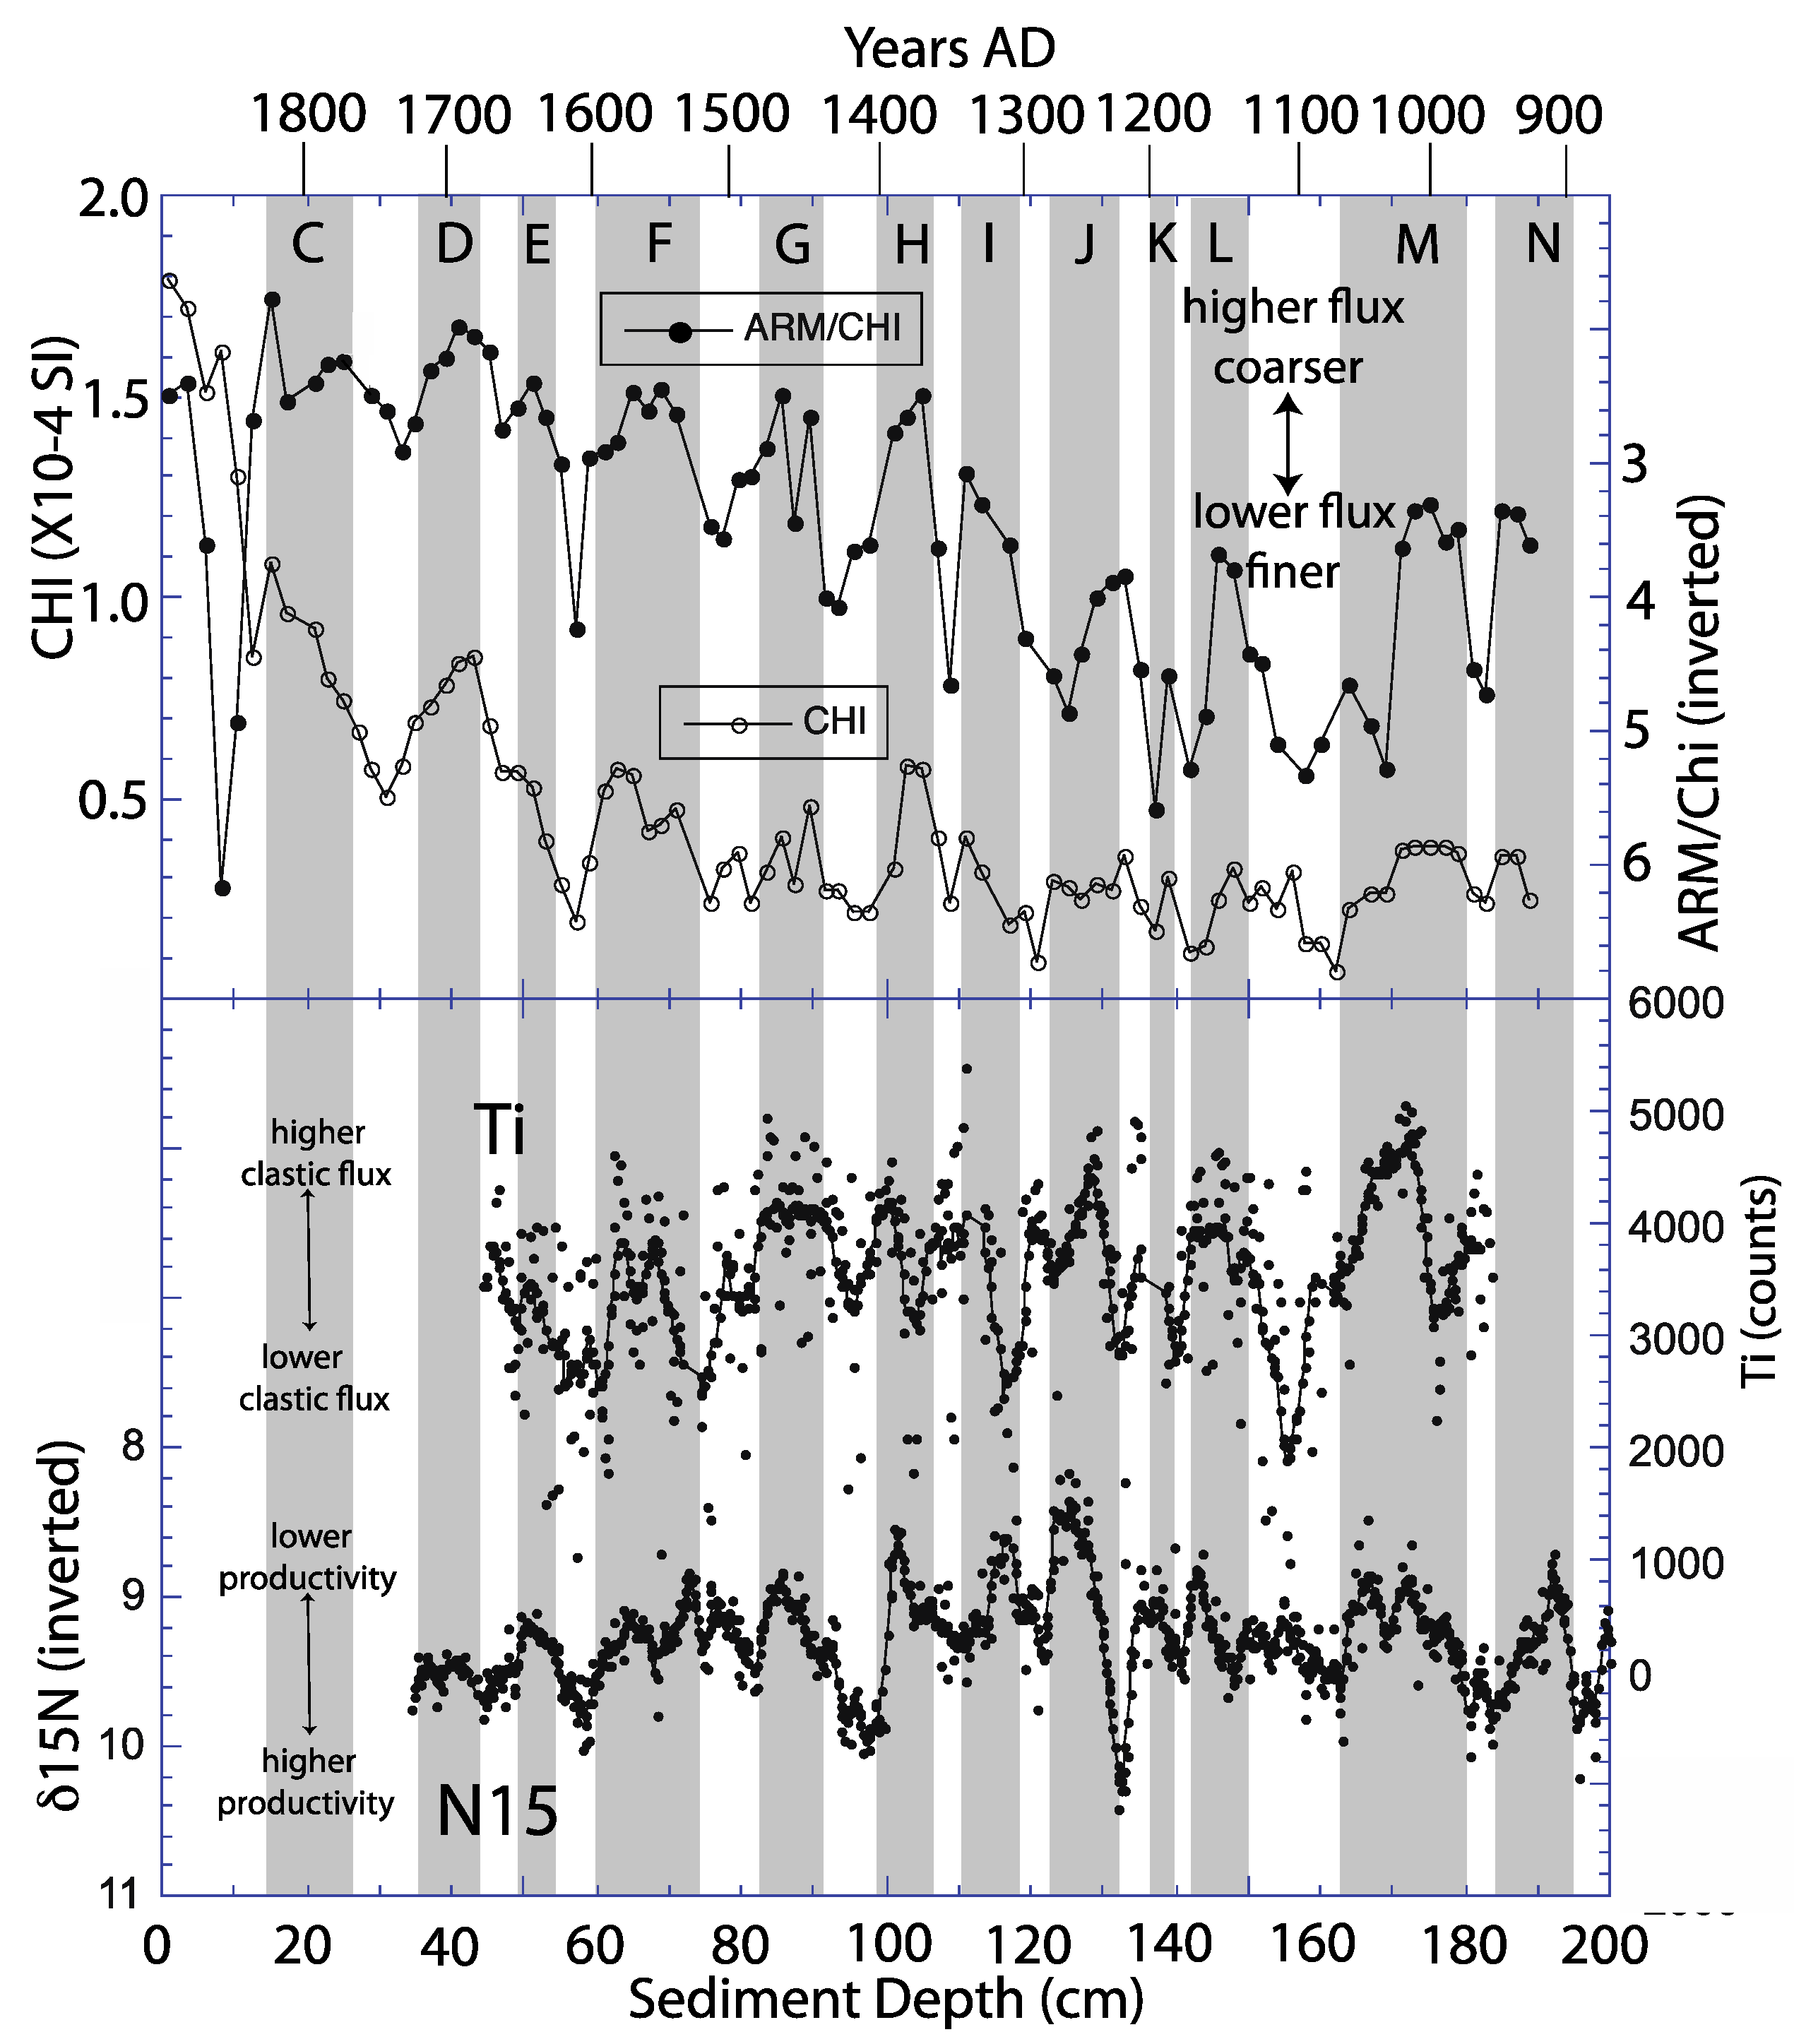
Figure 5 using chi as the intensity proxy and ARM/chi as the magnetic ratio proxy. This pattern indicates that the cores contain an oscillating pattern of coarser-grained clastic flux with high intensity (relatively high clastic concentration) and finer-grained clastic flux with low intensity (relatively low clastic concentration). The intensity oscillations can be interpreted to be due to some combination of variable dilution by biogenic materials and variable rate of clastic flux advection to the coastal ocean. If the high and low intensity sediments have the same average grain size, then dilution by variable organic flux would be the primary cause of variability. However, the high intensity sediments are coarser grained and low intensity sediments are finer grained; this suggests that the rock magnetic variability results primarily from oscillation between intervals of higher (lower) energy coastal rainfall/runoff with higher (lower) clastic flux rate and coarser (finer) sediment grain size. The letters A–N in
Figure 4 and
Figure 5 (grey zones) identify fourteen intervals of higher/coarser clastic flux. The intervening white zones are intervals of lower magnetic intensity and finer grain size.
Table 2 lists the average ages of the individual high clastic flux intervals (grey zones) and the intervening low clastic flux intervals. The ± indicates the half-width of the individual grey or white zones.
The δ
15N ratio of Tems et al. [
1] is also plotted in
Figure 4 and
Figure 5. Individual data points average about 2 years of time; we have also plotted a 5-pt (10 yr) running average to indicate decadal and longer-term variability. High (heavier) δ
15N values should indicate a more intense OMZ along the Pescadero Basin and low (lighter) δ
15N values should indicate a weaker OMZ. Tems et al. [
1] noted a strong correlation between δ
15N, weight % organic matter, and Br/Cl (a proxy for organic carbon) with high (low) δ
15N associated with high (low) organic flux. They attributed the organic matter variability to changes in productivity/carbon export and suggested that it contributes to the OMZ variability. High δ
15N indicates high productivity and a stronger OMZ; lower δ
15N indicates weaker productivity/carbon export and a weaker OMZ. The intervals of higher productivity/stronger OMZ may be due to intervals of relatively strong winter (dry) phase of the NAM with stronger offshore winds and stronger upwelling and a relatively weak summer (wet) monsoon with reduced rainfall/runoff.
We see a strong co-relationship on the decadal to centennial scale of δ
15N variability and our rock magnetic variability. This pattern is indicated in
Figure 4 and
Figure 5 (gray zones are high magnetic intensity/low magnetic ratios and low δ
15N ratios). We note high clastic flux occurs with low δ
15N and vice versa. High clastic flux intervals should be associated with NAM summer (wet) phase dominance and low δ
15N intervals are associated with weaker NAM (dry) winter phase. These two proxies are saying the same thing about a multi-decadal oscillation in dominance of NAM summer (wet) versus winter (dry) phases.
Tems et al. [
1] also measured Ti counts in gravity core PESC-GC3 via XRF scanning using an Avaatech XRF core-scanner at ETH Zurich. XRF scans were made at a tube voltage of 10 kV with a current of 2000 μA and a counting time of 20 s. The Ti counts and a 5-pt running average are plotted in
Figure 5 (bottom) together with the δN15 values for PESC-GC3. Higher Ti counts should indicate stronger clastic fraction in the sediment. This is consistent with the other correlations noted in
Figure 5. Grey zones associated with rock magnetic evidence for high-concentration, coarse clastic flux are associated with high Ti concentrations also indicative of high clastic flux. Both should be associated with intervals of heavier rainfall/coastal runoff due to dominance of the summer (wet) phase of the NAM.
4. Discussion
Laguna de Juanacatlan (
Figure 1; 20.6° N, 104.7° W; 2000 m a.s.l) is a lava-dammed lake situated in the Sierra de Mascotta, along the Pacific coast of central Mexico [
13,
14] and located southeast of Pescadero Basin. The lake is fed primarily by summer NAM rainfall, centered around the Gulf of California (and Pescadero Basin), and is a crucial source of moisture for the American Southwest [
15,
16,
17]. The lake is a closed basin lake with one small stream entering on the east side of the lake. The sediments are laminated due to perennial bottom/pore water anoxia. An overall age model for the sediments was developed [
13] using 26 AMS radiocarbon dates on bulk sediment. The overall sediment accumulation rate for the sediment cores was about 150 cm/ky (1.5 mm/yr). The chronology of the record is based on 25 calibrated radiocarbon dates with an average uncertainty of ±25 years.
Scanning XRF (at 300 μm resolution) was carried out on the sediments. Ti was determined to be the best clastic flux indicator for the sediments. Metcalfe et al. (2010) [
13] argue that Ti is the best indicator of clastic flux washing into the lake and that its variability is due to local runoff to the lake associated with variable rainfall.
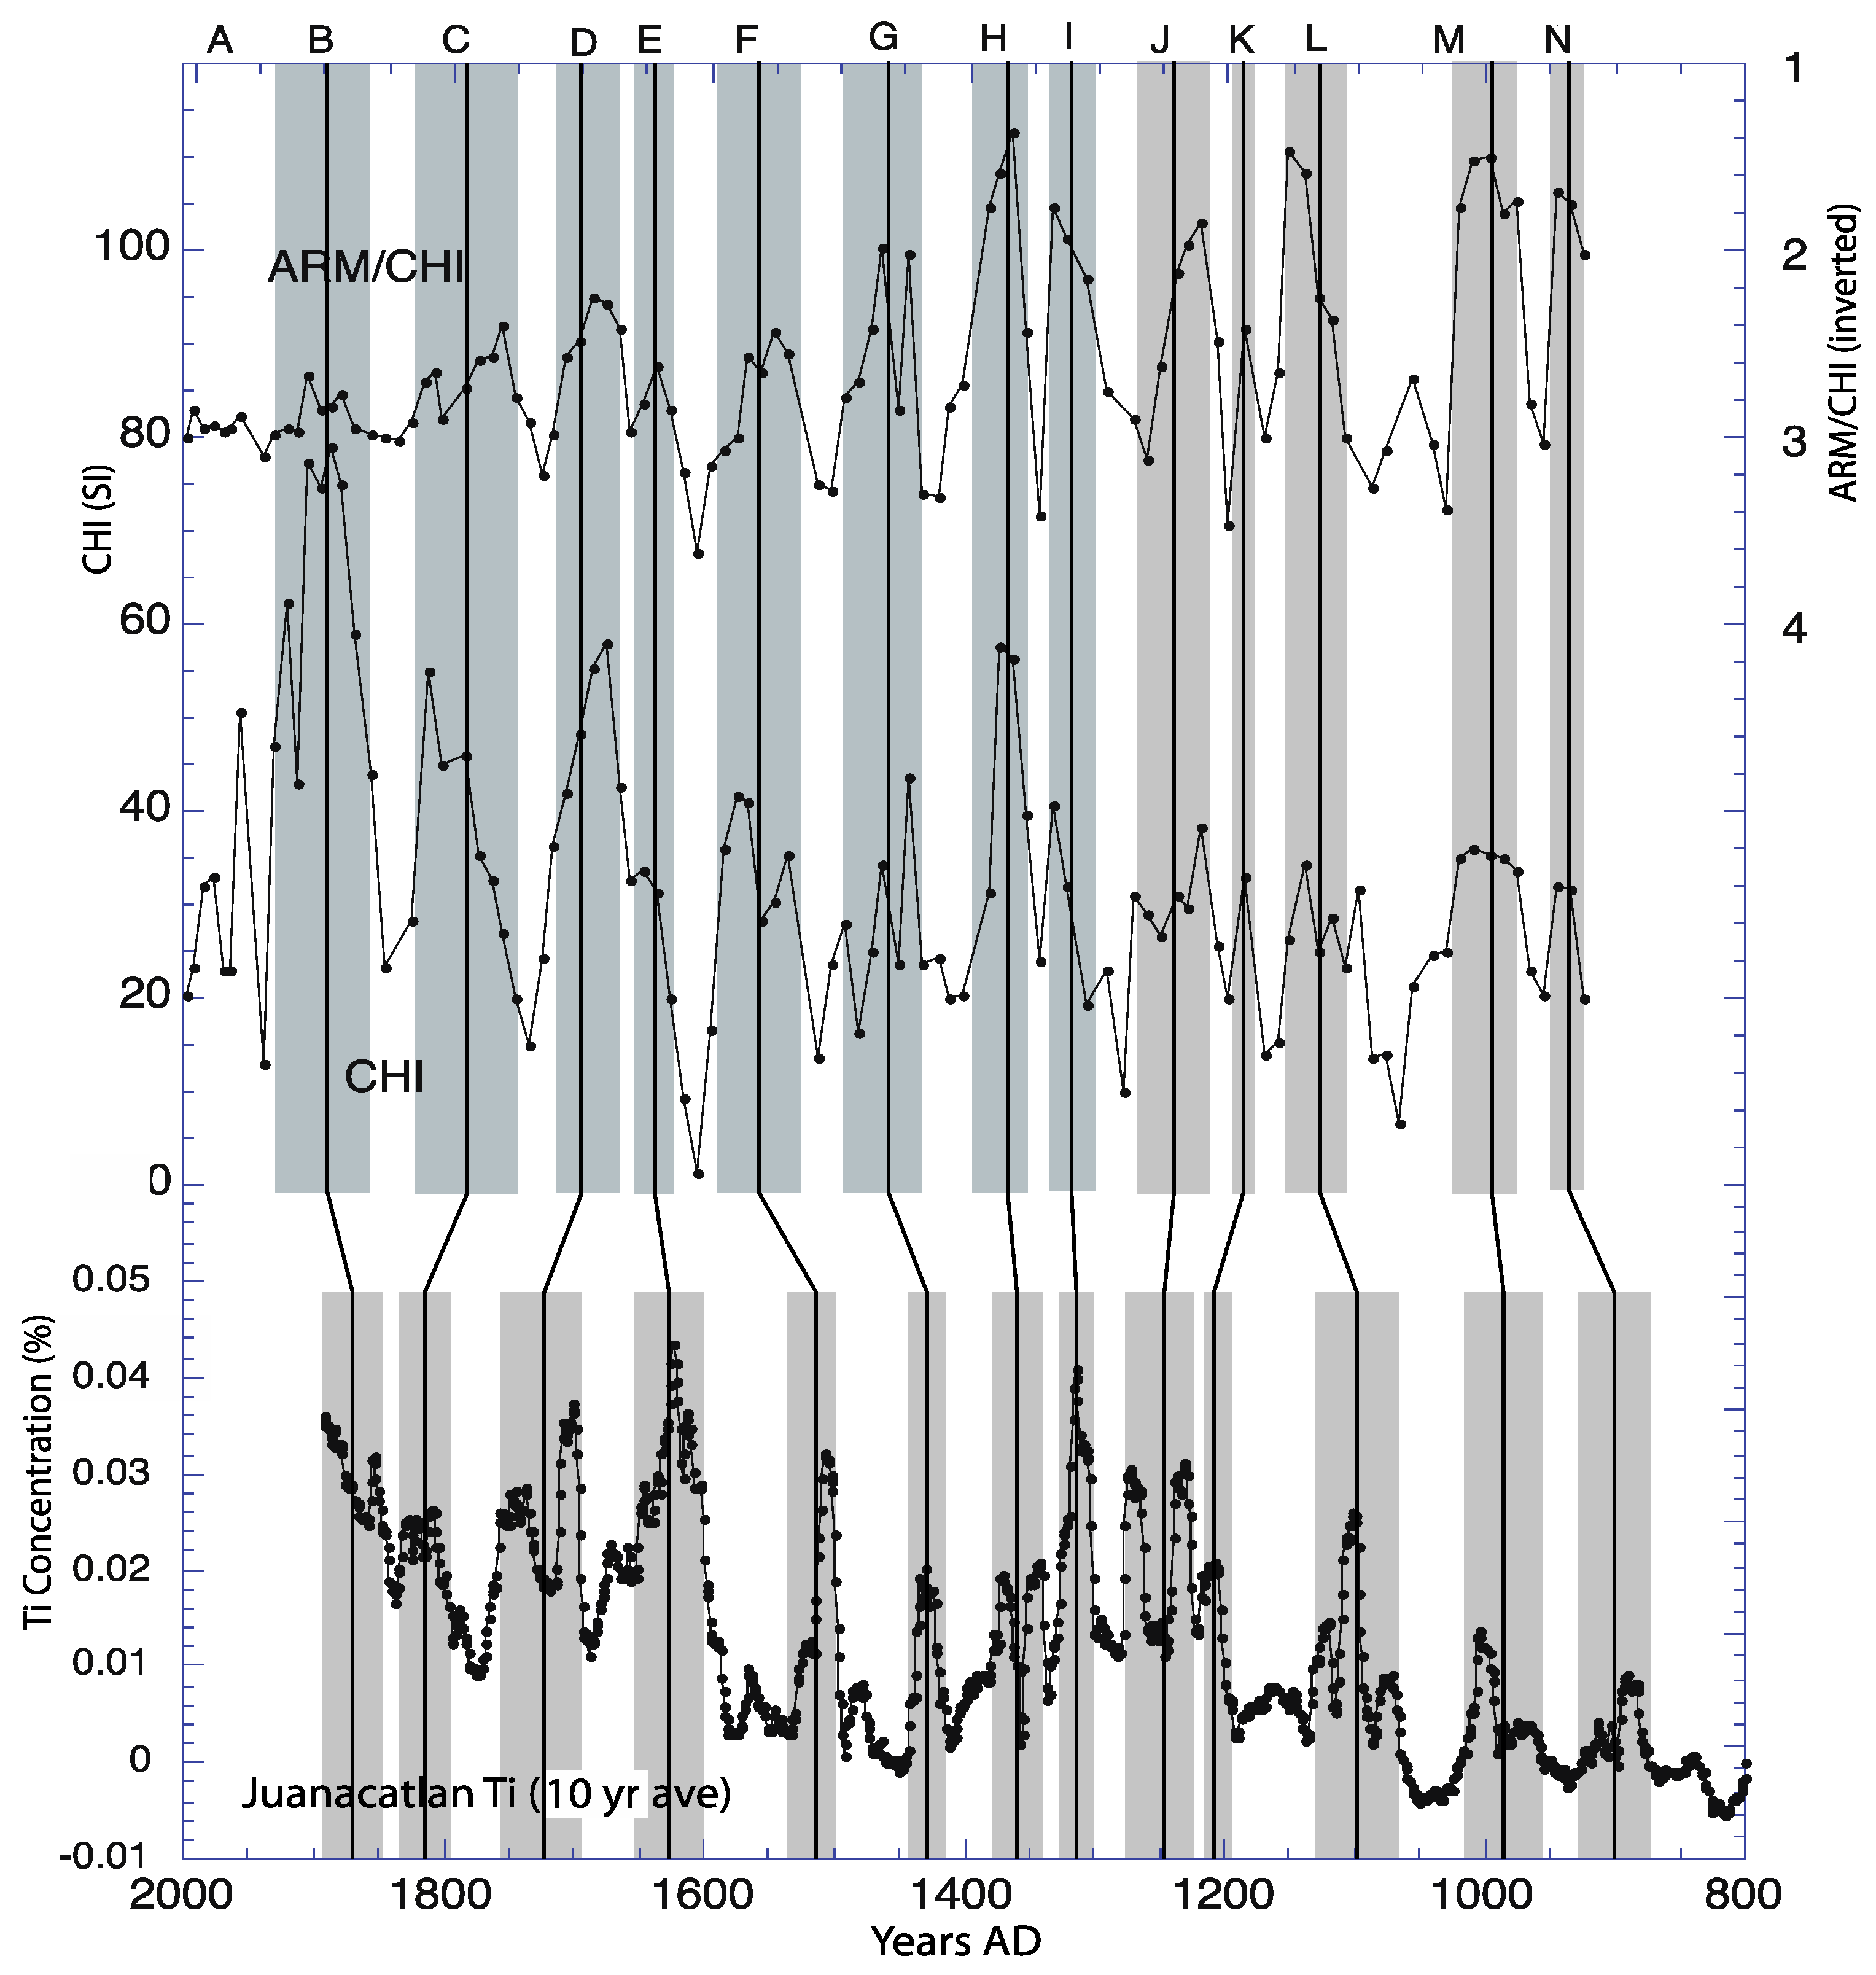
The Laguna de Jaunacatlan Ti record for the last 1200 years [
13,
14] is shown in
Figure 6. We have used a 10 yr running average of the annual data to show decadal and longer-scale variability. We have also plotted our detrended rock magnetic data (
Figure 4 and
Figure 5) for the combined multi-core and gravity core results using the chronology of Tems et al. [
1]. Both records show a notable multi-decadal to centennial-scale oscillation in estimated rainfall. We have correlated 13 high-Ti/high-rainfall intervals (B–N) (grey zones at the bottom half of
Figure 6) to the high intensity/coarse intervals (grey zones in the top half of
Figure 6) in our Pescadero Basin cores. The mean ages of the Juanacatlan high-Ti (wet) intervals (grey) and low-Ti (dry) intervals (white) are listed in
Table 2. The ± indicate the half-width of the grey or white zones. The timing is almost always synchronous between the two records to ±25 years (
Table 2). Minor variations in average age of each grey interval are probably due to minor differences in our chronologic age estimates. We think both of these records characterize the same multi-decadal pattern of Central Mexico Pacific Coast rainfall/runoff for the last 1200 years. Jones et al. [
13] also noted this distinctive pattern of cyclicity. We think the high rainfall intervals, associated with high/coarse clastic flux in Pescadero Slope and high Ti concentrations in Laguna Juanacatlan, are due to intervals of long-term summer phase (high rainfall) NAM dominance. The intervening dryer intervals (low/finer-grained clastic flux and lower Ti concentrations) then indicate intervals of long-term winter (dry) NAM dominance.
Lachneit et al. [
18] carried out a δ18O study on a stalagmite (JX-6) from Juxtlahuaca Cave (
Figure 1; Guerrero, Mexico). The core was dated using Uranium-series geochronology with a nominal ±1% age uncertainty (±10 years at 1000 BP). They compared δ18O variability over the last 130 years to historical records of rainfall and were able to extend that correlation back 2400 years. The estimated yearly rainfall determined by their δ
18O study for the last 1200 years is shown in
Figure 7. Their sample interval was much finer than our rock magnetic data and so we have plotted a 10-yr running average of their rainfall estimates. We see a strong multi-decadal to centennial scale oscillation in rainfall variability in their results. Intervals of high rainfall at Juxtlahuaca Cave are indicated by grey intervals at the bottom of
Figure 7. Estimated intervals of high rainfall in Pescadero Basin are indicated by grey intervals at the top of
Figure 7. These are the same grey intervals noted in
Figure 4 and
Figure 5. We think we can correlate all of our wet intervals (A–N in
Figure 7) with rainfall peaks in their record.
Table 2 lists the mean ages of the Juxtlahuaca wet intervals (grey) and dry intervals (white). The ± indicates the half-width of the grey or white intervals. The age uncertainties are almost always less than ±25 years. This correlation is consistent with our correlation to Laguna Juanacatlan and suggests the western half of Mexico is dominated by the same pattern of NAM oscillatory rainfall variability [
14,
19].
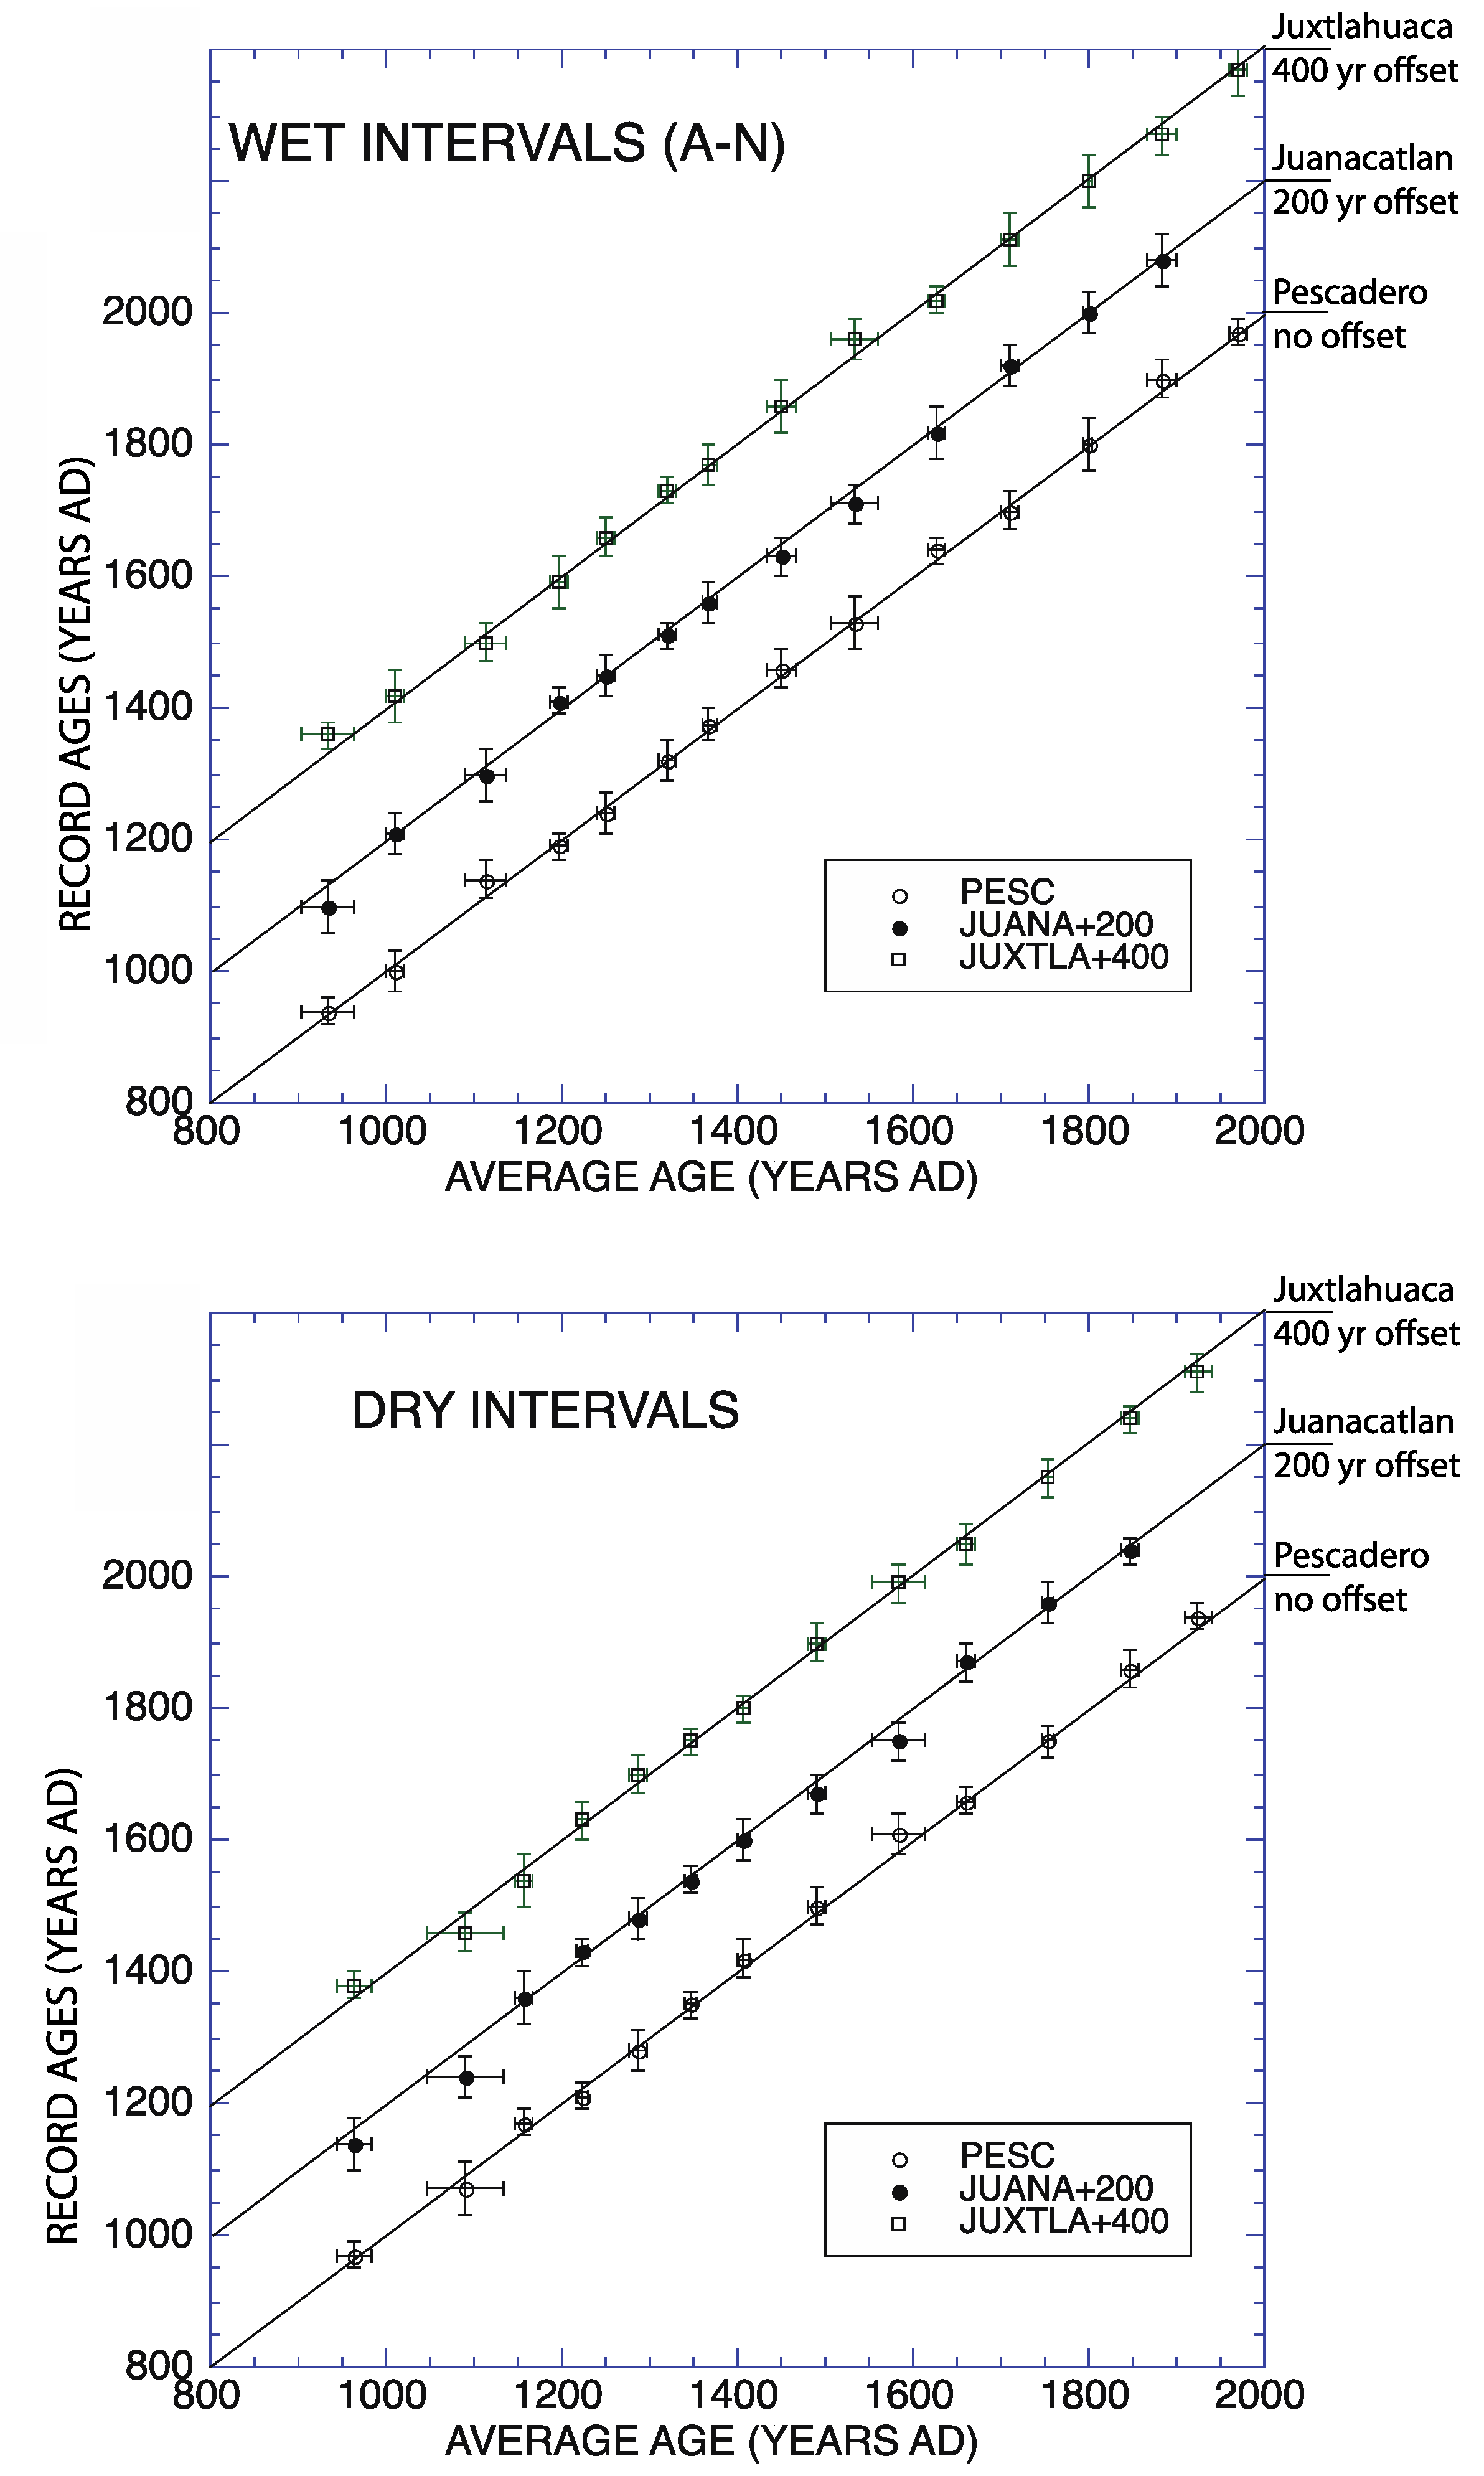
Table 2 lists the mean ages of the wet (grey) and dry (white) intervals of Pescadero Basin, Laguna Juanacatlan, and Juxtlahuaca Cave. The average ages of these intervals are also listed in
Table 2.
Figure 8 plots the ages of the individual wet/dry intervals from the three records versus their average ages with ± indicating the half-width of the individual intervals. The Laguna Juanacatlan and Juxtlahuaca data are offset 200 or 400 years relative to the Pescadero Basin data to make the results clearer. Diagonal lines indicate a 1:1 slope between the recorded ages in each record and the average ages. It is clear that the wet/dry intervals of all three records are not significantly different from one another and their average ages.
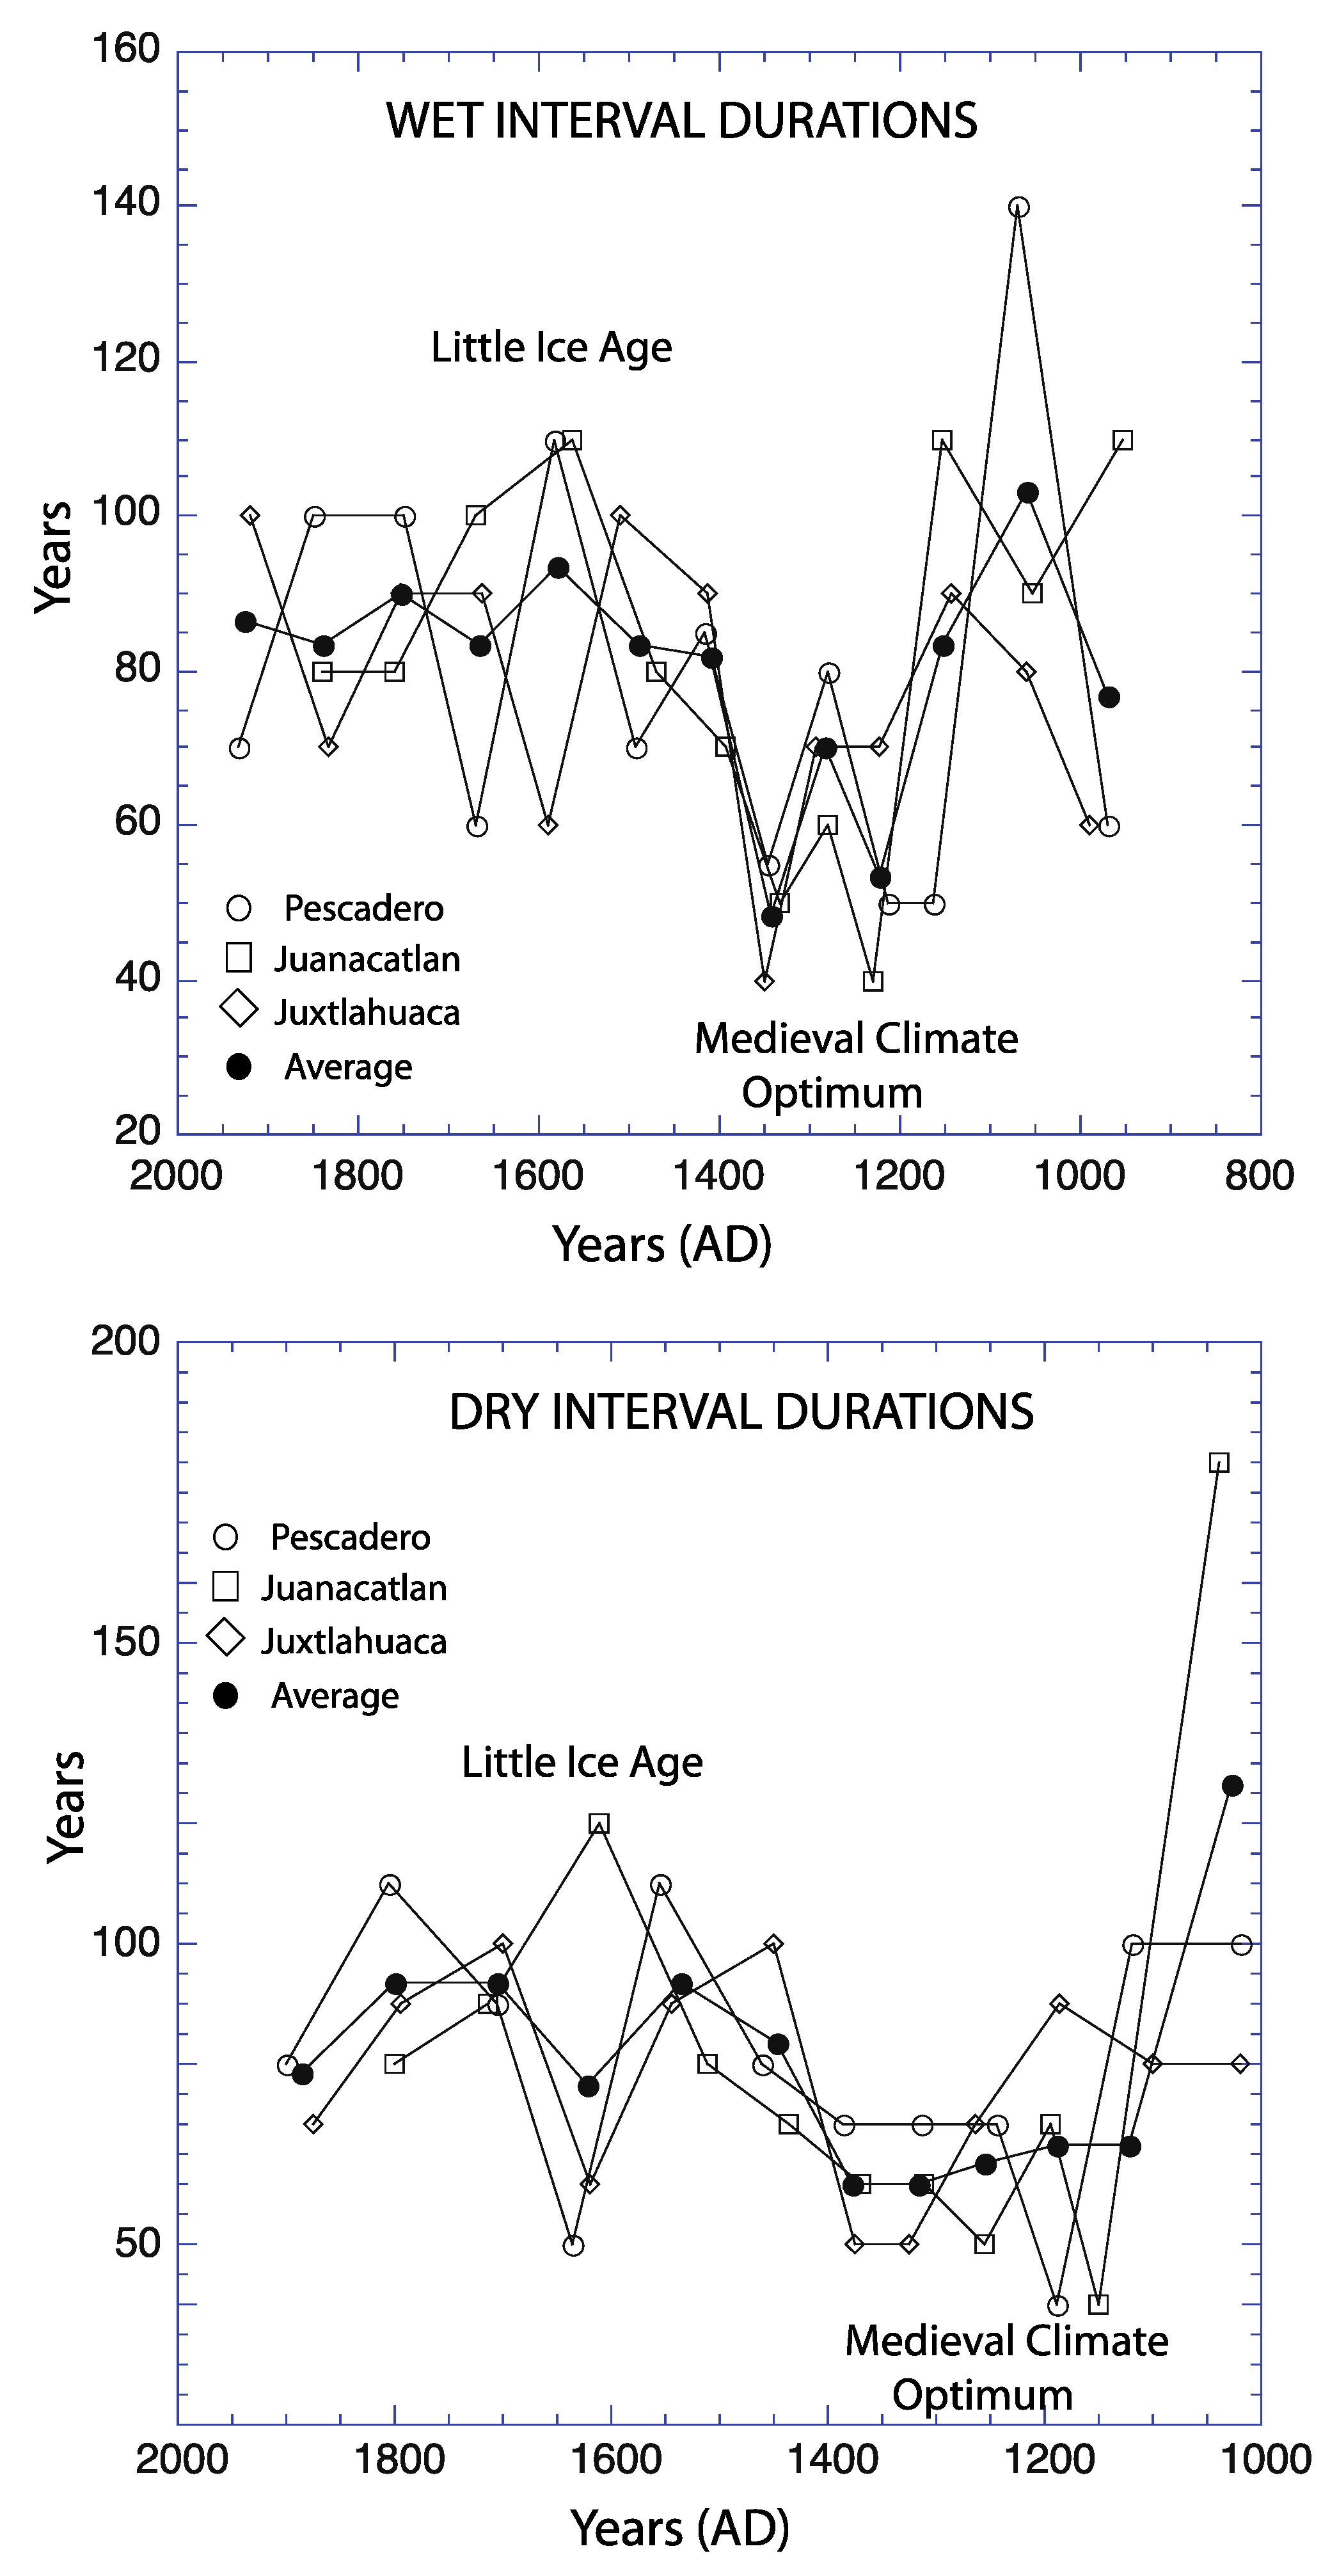
We have also calculated the time intervals between successive wet intervals and dry intervals. They are plotted in
Figure 9. It is clear that all three sites record a pattern of oscillating wet versus dry conditions at a long multi-decadal scale. But the interval ages are closer to 90 years during the Little Ice Age (~1350–1850 AD) and closer to 60 years during the Medieval Climate Optimum (~900–1300 AD). This variability in interval duration suggests that this multi-decadal scale variability is due to the internal chaotic behavior of the global climate engine or non-linear interaction with some multi-decadal-scale forcing.
Tems et al. [
1] attribute the multi-decadal to centennial scale OMZ and productivity oscillations of the NAM in Pescadero Basin region to long-term solar and/or PDO climate forcing, but they did not propose a particular mechanism for long-term climate forcing to produce the observed OMZ/productivity variability. We suggest a common cause (but out of phase) between productivity/OMZ oscillations and rainfall/runoff oscillations that are documented and summarized in this paper. We think that long-term oscillations in the NAM are the cause for both patterns of variability. Relative strong winter (dry) conditions enhance coastal upwelling, increase productivity, and strengthen the OMZ. These conditions produce less rainy summers and hence diminished rainfall/runoff. When the monsoonal dominance is reversed, weaker winter (dry) monsoon causes lower upwelling, lower productivity, and diminished OMZ, while the summer monsoon creates stronger rainfall and runoff. This is a cumulative effect, rather than a single season effect. We see a reasonable correspondence between oscillating North American Monsoon dominance in our two sets of proxies: low OMZ/productivity and high rainfall/runoff oscillate with high OMZ/productivity and low rainfall/runoff for the entire last 1200 years.
Tems et al. (2016) [
1] have carried out spectral analysis that shows that the OMZ/productivity pattern of oscillation occurs on a broad 70–90 year cycle. We would argue our rainfall variability should follow that same overall cyclicity. Jones et al. [
14] see the same ~70–90 cyclicity in the Laguna de Juanacatlan Ti record and direct PDO proxies [
5]. Our wet/dry cycles at Pescadero Basin, Laguna Juanacatlan, and Juxtlahuaca Cave are all consistent with that overall pattern of variability (
Table 2,
Figure 8). However, the observation that the spectral peaks are so broad is probably due to the fact that the individual wet or dry intervals are not strictly periodic in their recurrence, but rather vary from 60–90 years as documented in
Figure 9. It is interesting to note that the shorter, ~60 yr, wet/dry cycles occur during the Medieval Climate Optimum (~1100–1400 AD) (
Figure 9), while the longer, ~90 yr, cycles occur during the Little Ice Age and pre-Medieval Climate Optimum colder intervals. No simple periodic forcing (solar?) can produce such distinctive and regional multi-decadal NAM hydrologic variability. The variable durations of the multi-decadal wet/dry cycles rather suggest either a chaotic internal pattern to regional climate variability or some non-linear forcing (PDO?) that has temperature as a factor.
5. Conclusions
We have carried out a rock magnetic study on two cores of laminated deep-sea sediments from Pescadero Slope adjacent to the Pacific coast of central Mexico. The magnetic measurements included magnetic susceptibility (chi), natural remanence (NRM), anhysteretic remanence (ARM) and saturation isothermal remanence (SIRM). The magnetic intensities are interpreted to estimate total magnetic material in each sediment cube; we consider these to be proxies for the total clastic material in each sediment cube. Ratios of ARM/chi and ARM or SIRM intensities at two different steps of demagnetization are interpreted to estimate the grain size of the magnetic material; larger (smaller) values of the ratios indicate a finer-grained (coarser-grained) magnetic mineral distribution. These grain size estimates are also considered to be proxies for the overall clastic material grain size in each sediment cube. We have used the rock magnetic data to correlate the multi core and gravity core and dated the sediments using lead210 dating, radiocarbon dating, and lamination counts. These cores cover the last 1200 years with an average sediment accumulation rate of ~200 cm/ky.
The rock magnetic intensities from the two cores show a distinct decimeter oscillation in intensity; we note fourteen multi-decadal cycles of intensity variation in the two cores. The rock magnetic ratios also show a strong decimeter scale oscillation with the same number of cycles; coarser (finer) magnetic material is associated with stronger (weaker) magnetic intensity. We think these oscillations reflect alternating intervals of stronger magnetic (and clastic) flux to the coastal ocean with coarser overall grain size and intervals of weaker magnetic flux with finer overall grain size. This multi-decadal pattern is caused by oscillation in long-term dominance of the NAM summer phase that creates rainy conditions (with runoff) in this region versus long-term dominance of the NAM winter phase that creates drier conditions.
We can correlate our rock magnetic oscillations to sediment variations in laminated sediment of Laguna de Juanacatlan, a few hundred km southeast of Pescadero Slope. The Laguna de Juanacatlan sediments have a distinctive pattern of elemental Ti that is estimated to reflect variable rainfall/runoff to the lake. We see evidence of the same pattern of multi-decadal rainfall-runoff variability in this lake as we see in Pescadero Basin. Both appear to be synchronous to within ±25 years. We can also correlate our rock magnetic oscillations to δ18O variability in a stalagmite from Juxtlahuaca Cave that estimates local rainfall variability for the last 2400 years. Here too, we see evidence of the same pattern of multi-decadal rainfall-runoff oscillation in this lake as we see in Pescadero Basin.
These records and their correlations document a multi-decadal regional pattern of rainy versus drier conditions associated with the NAM in western Mexico. The wet/dry cycle durations are longer (~90 yrs) during the Little Ice Age (1850–1400 AD) and shorter (~60 yrs) during the Medieval Climate Optimum (~1100–1400 AD) in all three records. The cycles are not periodic. No simple periodic forcing (solar?) can produce such distinctive and regional multi-decadal NAM hydrologic variability. The variable durations of the multi-decadal wet/dry cycles rather suggest either a chaotic internal pattern to regional NAM climate variability or some non-linear forcing (PDO?) that has temperature as a factor.


 ,
, 


