Abstract
Ocean acidification is predicted to have widespread impacts on marine species. The early life stages of fishes, being particularly sensitive to environmental deviations, represent a critical bottleneck to recruitment. We investigated the effects of ocean acidification (∆pH = −0.4) on the oxygen consumption and morphometry during the early ontogeny of a commercially important seabream, Chrysoblephus laticeps, up until flexion. Hatchlings appeared to be tolerant to hypercapnic conditions, exhibiting no difference in oxygen consumption or morphometry between treatments, although the yolk reserves were marginally reduced in the low-pH treatment. The preflexion stages appeared to undergo metabolic depression, exhibiting lower metabolic rates along with lower growth metrics in hypercapnic conditions. However, although the sample sizes were low, the flexion-stage larvae exhibited greater rates of metabolic and growth metric increases in hypercapnic conditions. This study shows that the effects of OA may be stage specific during early ontogeny and potentially related to the development of crucial organs, such as the gills. Future studies investigating the effects of climate change on fish larvae should endeavour to include multiple developmental stages in order to make more accurate predictions on recruitment dynamics for the coming decades.
Keywords:
ocean acidification; metabolism; oxygen consumption; morphometry; fish larvae; seabream; sparid 1. Introduction
Atmospheric carbon dioxide (CO2) concentrations have been rising at an increasing rate since the industrial revolution. As a major sink, the oceans are expected to take up much of this CO2, leading to a decrease in the ocean pH, carbonate ion concentration (CO3−2) and calcium carbonate (CaCO3) saturation state, collectively known as ocean acidification (OA) []. At the current rate of change, the ocean pH may decline to levels over the next 300 years not encountered over the past 300 million years []. Average ocean surface waters have already dropped by 0.1 units since preindustrial times and are expected to decline by a further 0.4 units by the end of the century, with coastal areas likely to experience an even greater rate of change [,,]. While marine organisms will be adversely affected by OA, the severity of these effects appears to be highly variable among taxa and even within taxa among life-history stages [,]. Much of the earlier research focused on marine calcifying invertebrates, primarily due to their increased susceptibility to OA but also due to the early assumption that fish would be widely tolerant to rising CO2 levels owing to their well-developed regulatory mechanisms [,]. Using extreme CO2 levels (greater than 10,000 µatm), early studies revealed an efficient acid–base regulatory system capable of compensating for hypercapnic disturbances [,].
Recent studies using CO2 levels relevant to near-future and longer-term climate change over the 21st century (values typically below 2000 µatm) have revealed adverse effects on the growth, metabolism, development, behaviour and survival of some fishes [,,,]. These relatively low rates of CO2 increase have resulted in respiratory acidosis, causing a decline in cellular pH, due to increasing CO2 diffusion gradients []. This, in turn, drives an acid–base compensation response, which includes an increase in plasma bicarbonate (HCO3−), which is thought to result in downstream physiological consequences [,]. For instance, acid–base compensation in response to environmental hypercapnia has been proposed to change the reversal potential of the GABA receptor in the brain, altering behavioural responses [,]. Results, however, vary widely and may be species, life-stage or even population specific, with a number of studies revealing no physiological consequences. Nevertheless, some generalisations have been made, with species-specific responses being linked to their habitat affinity. Pelagic species, for example, appear to be more sensitive to environmental hypercapnia than benthic and bentho-pelagic species, which are naturally exposed to greater environmental variability (reviewed in []).
External conditions influence the partial pressure of CO2 in the arterial blood (PaCO2), and therefore, environmental hypercapnia will lead to acid–base disturbances or acidosis that cannot be brought to levels below that of the environment [,]. Fish must therefore regulate acid–base disturbances through the differential regulation of H+ and HCO3−, or other acid–base equivalents []. Apart from gas exchange and ammonia excretion, the gills are the predominant site for ionoregulation, an active process that carries an energetic cost [,,]. While the cost of ionoregulation is generally only between 6 and 15% of the standard metabolic rate (SMR), any increases may require energy reallocations from other processes [,].
The early life stages, specifically embryos and larvae, are often more sensitive to increased CO2 than are juvenile and adult stages [,,]. The greater sensitivity of early life stages to hypercapnia is likely due to two main factors, including the incomplete development of regulatory mechanisms, which leads to inadequate ionoregulation, and a greater surface-area-to-volume ratio, which results in PaCO2 levels that more closely match those of the environment [,]. Indeed, most explanations for the negative effects of hypercapnia are centred on increases in internal pCO2 and elevations in HCO3− [].
The larvae of most teleosts represent a transitionary stage between single-celled eggs and immature juveniles and, despite being exposed to the chemical challenges imposed by an aquatic environment, typically lack the cells, tissues and organs present in later stages []. The early development of the gills appears to be more crucial for ionoregulation than gas exchange, as cutaneous exchange becomes limited as the cuticle thickens and the ratio of the surface area to body volume decreases across ontogeny [,]. As such, it is not surprising that larvae from the broadcast spawners of temperate species appear to be more negatively affected by environmental hypercapnia, as they are typically smaller and slower growing and potentially have less developed acid–base regulatory mechanisms than their tropical counterparts []. The reduced capacity for acid–base regulation during hypercapnia currently forms the explanatory basis for many of the negative effects displayed by fish larvae, including neurosensory, behavioural and metabolic changes [].
Environmental hypercapnia is expected to act as a loading stress, thereby increasing the SMR and reducing the energy available for activity, given by the aerobic scope (AS), essentially reducing the energy available for growth [,]. While the metabolic costs of ionoregulation may be relatively small for juvenile or adult fish, they may be considerable for larvae undergoing rapid and energetically costly development. Furthermore, the necessary extracellular pH adjustments, facilitated by an increase in blood plasma HCO3−, can be far greater for larvae than for juveniles and adults, given their relatively lower PaCO2 []. Unlike adults, fish larvae lack substantial energy reserves and are required to rapidly resume feeding after any interruption. For instance, once endogenous feeding ends, through the consumption of yolk and oil reserves, exogenous feeding must commence within an exceptionally short period, often only hours before reaching a “point of no return” after which starvation becomes irreversible [,]. Therefore, even small additions to the energy budget may have significant effects on individuals and ultimately population recruitment [].
Within this context, this study investigated how the ocean acidification conditions expected by 2100 (∆pH = −0.4) might affect the metabolism, development and morphometry of early-stage Roman seabream Chrysoblephus laticeps exposed from shortly after fertilisation up to flexion (25 days of exposure). An increased pCO2 together with an associated decrease in pH was expected to result in elevated metabolic rates and reduced growth at age, leading to delayed development when compared with control specimens due to the increased energetic costs associated with acid–base regulation. The Roman seabream is an endemic South African fishery species that is a slow-growing, late-maturing protogynous hermaphrodite that is highly resident and exploited throughout its range. The high rates of residency, coupled with slow growth, have led to population declines by overfishing throughout much of their range, but the species appears to respond well to marine protected areas []. Due to the low dispersal potential of post-recruits, the pelagic egg and larval stages are critical for ensuring population connectivity and persistence in exploited regions []. Understanding how the early stages of C. laticeps will cope with predicted future environmental stress may provide valuable information on the future stock conditions of this commercially important species.
2. Materials and Methods
2.1. Field Spawning, Egg Incubation and Larval Rearing
Mature C. laticeps (n = 18) were collected from coastal waters immediately to the south of Port Elizabeth, Eastern Cape, South Africa (−34°04′14″ S 25°37′59″ E–−34°02′22″ S 25°41′56″ E), on the 14th and 15th of November 2019. Fish were captured by hooks and lines from a ski boat in waters ranging from 10 to 25 m in depth, with surface temperatures of 20 °C. This species exhibits an extended summer breeding season with peaks in the gonado-somatic index from November to January, with the spawning activity being related to the temperature []. Ovulation was ensured by injecting the recommended dosage of Aquaspawn (0.5 mL per kg), a synthetic gonadotropin, on the day of capture. Gametes were stripped from females (n = 12, 400–830 g) and males (n = 3, 1300–1460 g) after 48 h by applying light pressure to the abdomen []. Eggs collected from all 12 females were mixed together with 10 mL of sperm from the 3 males. The eggs and sperm were continuously mixed with a fine-bristled brush over 10 min while adding small amounts of seawater to reach a total volume of 1 L. After allowing the mixture to stand for a further 15 min, 0.27 mL of formaldehyde was added along with aeration to disinfect the eggs of potential pathogens for a further 15 min []. Following disinfection, all the eggs were repeatedly strained with fresh seawater and were equally distributed into large Ziplock bags and stored in a polystyrene cooler whilst being transported to the NRF-SAIAB Aquatic Ecophysiology Research Platform (AERP) Laboratory at Rhodes University in Grahamstown, South Africa.
On arrival, all the eggs were mixed in a single 25 L glass tank with heavy aeration while acclimating to control temperature. After approximately 30 min, the air line was removed and the eggs were allowed to separate. All the eggs that sank were assumed to be non-fertilised (approximately 75% appeared to be non-fertilised) and were discarded, while the floating (fertilised) eggs were collected in a 1 L beaker, which was lightly aerated to ensure the complete mixing of the eggs throughout the water volume. The eggs were enumerated by drawing ten 2 mL samples and then randomly distributed into each of eight tanks at 80 eggs L−1 or 6000 eggs per tank. The tanks were 75 L in volume, fibreglass moulded and square with squared conical bottoms, and painted white with an epoxy-based paint. Two water supply inlets were located in the top corners, while the outlet was centrally placed at the surface to prevent a surface film, and water exited through a 250 µm mesh screen. Air was introduced from the centre of the tank through diffusers placed approximately 5 cm above the tank bottom. The tanks were isolated (no flow) up to day after hatching (DAH) 4 when flow was introduced at night only (7 p.m.–7 a.m.), with renewal rates of approximately 1 L·h−1·tank−1. From DAH 7 until the completion of the experiments, the water flow was increased to 4.5 L·h−1·tank−1 at night only. The supply water was from a reservoir (total capacity, 6000 L) recirculating system with ozone treatment, degassing, and mechanical and biological filtration, with partial (approximately 25% per week) seawater renewal. There was no detectable change in the water chemistry of the recirculating system throughout the study period. The photoperiod was set to a 14 h light/10 h dark cycle with low lighting conditions before first feeding, after which additional lighting was added for 10 of 14 h. Low lighting and morning/evening conditions were simulated using 3-foot, 8000 K and high-light (daytime) conditions, with 5-foot 6000 K fluorescent tubes placed directly above the tanks.
Larvae were fed from 3 days after hatching (DAHs) up to flexion with rotifers Brachionus plicatilis, which were cultured using an enrichment diet (ORI-ONE, Skretting Stavanger, Norway). The rotifers were maintained at levels of 10 mL−1 in rearing tanks and were added in three feedings at a ratio of 50:40:10 for the morning, afternoon and evening. A nightly flow with an outlet screen of a 250 µm mesh allowed the removal of the rotifers from the tanks so that newly enriched rotifers could be added daily; the rotifer densities were enumerated each morning by taking five 1 mL samples from each tank. A green-water culturing technique was used by daily additions of algal paste (Nanno 3600, Reed Mariculture, FL, USA) at a concentration of approximately 400,000 cells per mL []. To our knowledge, this species has not been reared in captivity, with the exception of in a study conducted for an MSc thesis []; thus, the rearing protocols were adapted from the culture of similar species [].
2.2. Water Chemistry
The tanks were randomly assigned to one of two pCO2 treatments: (1) a present-day control with pH = 8.03 and pCO2 ≈ 420 µatm, and (2) a high-pCO2 treatment with pH = 7.63 and pCO2 ≈ 1400 µatm, for the coastal conditions expected for 2100 based on ∆−0.4 pH units [,]. The present-day control conditions were determined from discrete monthly surface water samples collected inshore (30–60 m depth contour) in Algoa Bay, Port Elizabeth, between June 2018 and January 2020 (mean pH = 8.03 ± 0.07 SD; mean pCO2 = 423.93 µatm ± 84.6 SD) (Edworthy, unpublished data). The temperature was controlled using aquarium heaters in all the tanks and set to 19 °C. The pH was slowly brought to experimental conditions over 24 h following the introduction of the eggs and was controlled with pH/CO2 controllers (Tunze 7070.200, Aquarientechnik GmbH, Penzberg, Austria) fitted with a non-return valve and pH electrode (Tunze 7070.110) in each tank. The electrodes were calibrated regularly using buffer solution (Tunze 7040.130). The CO2 was slowly bled into individual tanks with diffusers and needle valves to ensure a slow release. The temperature and pH (measured on the National Bureau of Standards scale) were measured in each tank twice daily, and the salinity was measured daily with a Hanna HI 98194 multi-parameter meter. The oxygen levels were maintained above 90% saturation with air diffusers in each tank. The total alkalinity (TA) was measured twice weekly using a total alkalinity mini-titrator (Hanna Hi 84531) in the supply water. The ammonium, nitrite and nitrate were measured twice weekly using a colorimeter (Hach DR900) and maintained at values near zero. Carbonate chemistry parameters were calculated using the TA, pH, temperature and salinity as inputs, using the CO2SYS program with the constants K1 and K2 [] refitted by Dickson and Millero [] and using the NBS pH scale. The water conditions and carbonate chemistry parameters maintained throughout the study period are summarised in Table 1.

Table 1.
Mean (±SD) seawater parameters and carbonate chemistry maintained throughout the study. Temperature and pHNBS were measured twice daily, salinity and dissolved oxygen (DO) were measured daily in each rearing tank, and total alkalinity (TA) was measured twice weekly. pCO2 and carbonate chemistry (ΩCa and ΩAr) were estimated from these parameters in CO2SYS.
2.3. Developmental Stages and Oxygen Consumption Measurements
Larvae were grouped into developmental stages based on the examination of developmental milestones. The hatchlings included DAH 0, 1 and 2; early-preflexion included DAH 7 and 8; late-preflexion, DAH 13; and flexion, DAH 21. The oxygen consumption rates for all the stages were determined using static-respirometry methods with O2 measurements taken every 15 s using 24-well microplates placed in a water bath and a 24-channel optical fluorescence, oxygen-sensing system (Loligo Systems, Copenhagen, Denmark). Larvae of all stages were captured by siphoning from throughout the water column of the rearing tanks into glass beakers and subsequently siphoning again by targeting into a beaker with 30 µm-filtered tank water to separate the rotifers from the larvae. Following this, the separate beakers were placed into a water bath at the control temperature for a three-hour fasting period to ensure the testing of post-absorptive larvae and avoid confounding the measurements of digestion with the metabolic rates [,]. Respirometry trials were performed twice per day for the hatchling and early-preflexion stages; few remaining larvae resulted in a single trial per day for the late-preflexion and flexion stages. The first or single trials started at 10:00, while the second began at 15:00. A minimum of 4 wells were designated as blanks to record the background rates of oxygen consumption and were treated as all other wells. As the microplates were not fitted with mixing devices, they were selected based on the size and activity of the larvae to ensure adequate mixing from movement while preventing confinement-related stress; 80 µL wells were used for hatchlings and early preflexion, 200 µL for late preflexion, and 1700 µL for flexion. The respirometry trials were carried out until the majority of the wells reached 80% oxygen saturation (5.6 mg O2 L−1), resulting in the trials lasting up to two hours. The microplates were cleaned between trials by flushing with 70% ethanol, while the beakers and other equipment were rinsed with a 500 ppm hypochlorite solution.
2.4. Morphometrics
Following the respirometry trials, individual larvae were recovered from the wells and mounted on a millimetric slide for image capture. Only living individuals were captured due to the rapid change in morphology of dead larvae. No physical damage to larvae was evident at this time, as handling was kept to a minimum by siphoning and pipetting into and out of wells; the post-respirometry mortality rates were, on average, less than 40%. Micrographs were captured with a Leica EZ4 stereomicroscope and fitted camera and analysed with the ImageJ software. Morphometric traits including the standard length (SL), depth at vent (DV) and eye diameter (ED) were measured for all individuals, while the yolk length (YL), yolk depth (YD) and oil globule diameter (OD) (Figure 1) were measured for hatchlings using the measurement landmarks recommended by Chambers et al. []. Following respirometry or image capture, all specimens were preserved in 99% ethanol. No specimens were returned to rearing tanks.
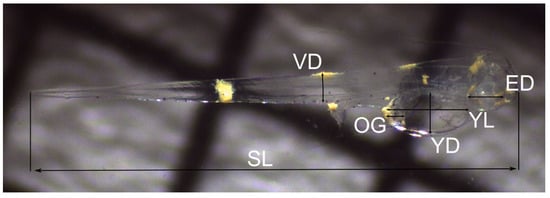
Figure 1.
Micrograph of 1 day after hatching (DAH) red Roman Chrysoblephus laticeps showing morphometric traits measured. SL, standard length; VD, muscle depth at vent; OG, oil globule diameter; YD, yolk depth; YL, yolk length; ED, eye diameter.
2.5. Data Preparation
The respirometry data were filtered by removing measurements below 80% oxygen saturation, which, given the experimental temperature and air pressure, was 5.6 mg O2 L−1. A quality threshold, R2 > 0.85, was implemented to filter the linear decline in oxygen. The individual respirometry measurements were analysed using the R package “RespR” [] in order to extract alternatives for metabolic rate indices, such as the standard (SMR) and maximum (MMR) metabolic rates, from the routine rates of oxygen consumption (RMRroutine). The alternatives for the MMR included the active (RMRmax) and, for the standard metabolic rate, the inactive (SMRmin) rates of oxygen consumption derived from linear estimation. RMRmax was determined by selecting the greatest rate of decline over a 5 min period, RMRmin represented the lowest rate of decline over a 10 min period, and RMRroutine represented the most linear rate observed using 75% of the data. A preliminary study was performed to determine the repeatability of these metabolic rate estimates by carrying out repeated within-day trials on the same individuals; the estimates exhibited moderate-to-good agreement values, with R = 0.74, 0.84 and 0.85 for RMRroutine, RMRmin and RMRmax, respectively (Muller, unpublished data). The absolute and routine factorial scope derived from the above method also fell within previously published results (Table 2, Peck and Moyano []). The oxygen consumption rates for blank wells were averaged and subtracted from the individual measurements to account for background respiration. The average volume of the specimens was calculated using the formula:
where r represents radius of the head, and h is the length from the tail to eye. This specimen volume was then subtracted from the measurement chamber volume []. The relative aerobic scope (RAS) was calculated using the equation:
Table 2.
Mean (±SD) metabolic rate estimates (nmol O2 ind−1·h−1) for early C. laticeps by developmental stage with corresponding days after hatching (DAHs), treatment (control, pCO2 ≈ 420 µatm; treatment, pCO2 ≈ 1600 µatm) and number of individuals sampled (n). RMRmin was estimated as the lowest rate of oxygen decline over a 10 min period, RMRroutine was estimated as the most linear rate of oxygen consumption using 75% of the data, RMRmax was estimated as the greatest rate of oxygen decline over a 5 min period.
The volume of the yolk sac was approximated by the formula for a prolate spheroid:
where l is the yolk sac length and h is the height [,].
2.6. Statistical Analysis
Linear mixed models (LMMs) were used to examine the effects of pCO2 treatment on the metabolic rate estimates (RMRmin, RMRroutine, RMRmax and RAS) and morphometry across early development (“lme4” package []). The metabolic rate estimates were log (X + 1) transformed in order to meet parametric assumptions, while the depth at vent required a Box–Cox transformation. The treatment (control and high pCO2), development (DAH) and their interaction were included as factors. To avoid pseudo-replication “tank” was added as a random effect, while “DAH” was included as a nested random effect to account for the hierarchy of the measurements in each LMM. Differences in metabolic rates between treatments were tested by modelling a second-order polynomial relationship between the metabolic rate and development (DAH). Orthogonal polynomials were used to reduce the effect of collinearity and because the Y values did not approximate the fit curve, as the relationship was curvilinear. The Akaike information criterion (AIC) was used for model selection and inference [].
The respirometry data are reported in nanomoles of O2 per individual per hour (nmol O2 indiv−1 h−1). Attempts were made to determine the masses of individuals so as to report oxygen consumption per gram; however, weighing multiple individuals, even at later stages, proved unsuccessful due to their small sizes, even when using a micro-balance.
Residual diagnostics were carried out for hierarchical regression models using the “DHARMa” package []. All statistical analysis was conducted using R v3.6.3 [] with the Rstudio interface. The α level was set to p < 0.05 for all analyses.
3. Results
3.1. Effect of pCO2 on Metabolic Rates of Developing Larvae
The metabolic rates (RMRmin, RMRroutine, RMRmax and FAS) all showed positive increases from hatching through to late preflexion (up to DAH 13), after which a separation between the treatments became evident for RMRmin and RMRroutine, in particular, with a greater rate of increase for high pCO2, while the metabolic rates for control larvae increased at a comparatively lower rate (Figure 2). The rate of increase in RMRmin was initially greater for the control larvae, with the average RMRmin of the hatchlings increasing by over 500% until late preflexion (13 DAHs), compared with larvae from the high pCO2 treatment, which showed a 340% increase over the same time period (Table 2). The rates of increase in RMRmin from late preflexion to flexion (21 DAHs) were greatly dissimilar, increasing by 137% and 900% for control and high pCO2, respectively.
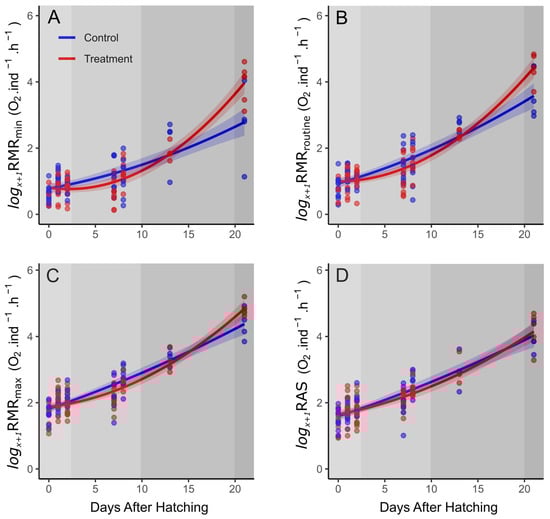
Figure 2.
Log(x+1)-transformed metabolic rate estimates for C. laticeps larvae from control and treatment (blue, current day, and red, high pCO2) for (A) minimum, (B) routine and (C) maximum routine rates, and (D) routine aerobic scope measured across development (DAH). Individual data are indicated by points, and the modelled second-order polynomial relationship with development is the solid line, with shaded 95% confidence intervals. Shaded grey regions indicate approximate developmental stages from lightest to darkest: hatchling, early preflexion, late preflexion and flexion.
The developmental rates of the increase in RMRmax between the treatments followed the same pattern, although the variance between the treatments was not as pronounced. The average rates of RMRmax increased from hatchling to late preflexion by 378% and 298% for control and high pCO2, respectively. Meanwhile, the average rates of increase from late preflexion up to flexion were 181% and 393% for control and high pCO2, respectively.
Development showed a significant positive relationship with all the metabolic rates (RMRmin, RMRroutine, RMRmax and RAS), with a clear increase in the oxygen consumption over larval development (Table 3, Figure 2). Although the treatment (control/high pCO2) was not a significant factor for any of the rates measured, the interaction between treatment and development (treatment: DAH2) was significant for RMRmin, RMRroutine and RMRmax. The significance of the polynomial interaction term suggests that the rate of change differs between treatments and that the relation is a non-linear one. There was no significant effect of treatment or its interaction with development on RAS (Figure 2, Table 3).
Table 3.
Results of the linear mixed model (LMM) analyses of metabolic rate estimates of C. laticeps larvae in response to control and high pCO2 treatments across early development presented as a linear (DAH) and quadratic (DAH2) function, with treatment as an interaction term. Akaike information criterion (AIC) and Pseudo-R2 reported; significant values in bold.
3.2. Effect of pCO2 on Larval Morphometrics
The standard length and depth for the vent measurements mirrored the metabolic rates, with lower average values for the larvae in the high-pCO2 treatment up until flexion, where the values of both measurements were greater than the control larvae (Figure 3A,B). The average values of the standard length and depth at vent for the flexion-stage larvae were approximately 12 and 61% greater, respectively, for the high-pCO2 larvae when compared to the control larvae. While the treatment was not a significant factor, the interaction between the treatment and development was significant for the quadratic term (Table 4).
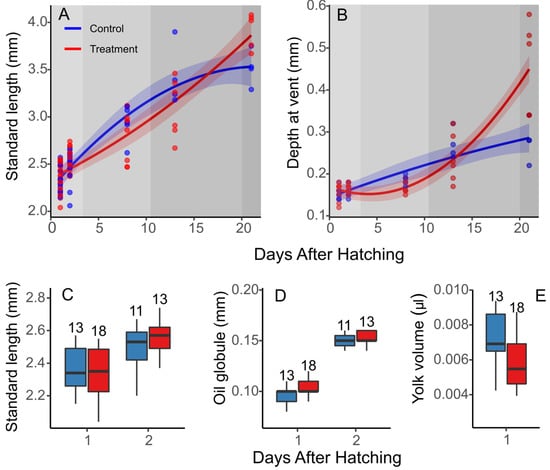
Figure 3.
Effect of elevated pCO2 on morphometrics of early C. laticeps. Standard length (mm) (A) and depth at vent (mm) (B) throughout early development, standard length by day for 1 and 2 DAHs (C), oil globule diameter (mm) (D), and yolk volume (µL) for 1 DAH (E). Box and whisker plots, where whiskers denote 10th and 90th percentiles, the box denotes 25th and 75th percentiles, median values are indicated by horizontal bars, and values above whiskers indicate n per treatment.
Table 4.
Results of the LMM analyses of standard length and depth at vent of C. laticeps larvae in response to control and high-pCO2 treatments across early development presented as a linear (DAH) and quadratic (DAH2) function, with treatment as an interaction term. AIC and Pseudo-R2 reported; significant values in bold.
Despite the exposure of the embryos to high-pCO2 conditions, the standard length at DAHs 1 and 2 showed no significant differences between treatments or in the interaction between the treatment and DAH (Linear mixed effects (LME), p > 0.05) (Figure 3C). The oil globule diameter at 2 DAHs, was 2% larger for the high-pCO2 larvae, but the yolk volume at 1 DAH was approximately 15% less for the high-pCO2 larvae compared to control larvae (Figure 3D,E). The oil globule diameter, as well as the yolk volume, did not show any significant difference between treatments (LME, p > 0.05). By 2 DAHs, the yolk reserves were spent for the majority of individuals, regardless of the treatment, and could not be compared.
4. Discussion
This study revealed that experimental ocean acidification produced stage-specific but opposing results during the early development of Chrysoblephus laticeps. Hatchlings appeared to exhibit some resilience to OA, as there was little-to-no difference in metabolic or growth metrics in control and treatment larvae apart from a small decrease in yolk volume. Early-preflexion larvae in the high-pCO2 treatment group began to exhibit reduced metabolisms and growth, which became more evident by the late-preflexion stage. However, although the sample sizes were reduced and the results should be interpreted with caution, it appeared that this pattern in metabolic and growth metrics was reversed by the onset of flexion, with greater metabolic and growth rates in larvae exposed to high-pCO2 conditions by 21 DAHs.
Despite the embryos being exposed to hypercapnic conditions for two days, hatchlings exhibited no significant differences in metabolism, growth or endogenous resource supplies when compared with those from the control. Although the yolk volume was 15% smaller at 1 DAH in larvae from the high-pCO2 treatment, there was little difference in oil globule diameter between the treatments. Reduced energy reserves, in the form of smaller yolks and/or oil globules, have been observed in other marine larvae exposed to elevated-pCO2 treatments (up to 4714 µatm, pH 7.5), including summer flounder Paralichthys dentatus, yellowtail kingfish Seriola lalandi, Senagalese sole Solea senegalensis and blacktail seabream Diplodus sargus [,,]. The smaller yolk volumes in the larvae exposed to high pCO2 levels may suggest that they utilised a larger proportion of their endogenous energy reserves to attain the same size and may indicate a trade-off between growth, necessary for first feeding, and a smaller window to begin exogenous feeding in []. This critical period begins at yolk exhaustion and can be as little as 12 h []. Therefore, even minor reductions in yolk size may have large ecological implications, as they will reduce the length of the window between the depletion of endogenous reserves and feeding. This is of particular concern in a natural setting, where food availability may be sporadic [].
During preflexion (7, 8 and 13 DAHs), C. laticeps from the high-CO2 treatment were smaller and also exhibited lower average metabolic rates (Table 2, Figure 2 and Figure 3). The smaller size of the treatment larvae at this stage may be related to the smaller yolk reserves of the hatchlings but may also be due to metabolic depression induced by acidosis. Metabolic depression is an important strategy that allows organisms to enhance their tolerance and survival time when exposed to stressful environmental conditions [,]. By down-regulating energy-utilising processes, such as protein synthesis, in favour of maintenance mechanisms, such as ionoregulation, organisms may reduce energetic demands while further reducing the energetic costs associated with ionoregulation as a consequence of declines in intracellular pH []. Indeed, a characteristic decline in intracellular pH is associated with, but may even be a cause of, metabolic depression [,]. Given the increasing environmental pCO2, and concomitant decline in pH, modifications to the diffusion gradient will result in an increase in organismal pCO2 and lead to extracellular acidosis, which may result in metabolic depression and reductions in growth if there is no active compensation [,]. Additionally, a greater overall decline in the active or maximum metabolic rate is suspected to lead to reductions in aerobic scope [], which, while minor, was observed for the relative aerobic scope of the preflexion larvae in this study (Table 2). Reductions in early growth in response to elevated CO2 have also been observed in gilt-head bream Sparus aurata, inland silverside Menidia beryllina and yellowfin tuna Thunnus albacares [,,] and may be one of the more common findings in general [,]. However, as many of these studies did not simultaneously measure metabolism, it is not clear whether the reductions in growth rates were related to reduced metabolism and therefore metabolic depression. Given the current findings, it seems reasonable to suggest that metabolic depression is indeed taking place and that the observed reductions in growth can be attributed to the down-regulation of protein synthesis and subsequent reduction in somatic growth. This is especially applicable given that the gills, which are the primary site for ionoregulation and acid–base regulation, of the preflexion C. laticeps appeared to be in a primitive state of development.
By 20 DAHs, the majority of the C. laticeps appeared to be undergoing notochord flexion. For pelagic-spawned eggs and larvae, this period generally coincides with muscle differentiation, an increasing density of ionocytes at the gill surface and the further gill development of secondary lamellae to cope with the increasing oxygen demands [,]. While there was a considerable difference between the lengths and depths at vent at 21 DAHs, with the high-pCO2 larvae larger, on average, than control larvae, the latter were particularly apparent (Figure 3B). The deepening of the trunk occurs along with muscle differentiation and the formation of the caudal fin to aid in a transition to increased active swimming []. The greater depth at vent for the high-pCO2 larvae therefore indicates a more rapid rate of development, with them having reached flexion before the control larvae. While this may introduce a confounding factor when considering metabolism, the routine metabolic rates at 21 DAHs for the high-pCO2 treatment were more than double those of the control. Other studies have similarly found increased lengths at age during the flexion period. Dolphinfish Coryphaena hippurus exposed to high-pCO2 treatments (1460 µatm) were larger than those exposed to ambient (350 to 490 µatm) conditions at 8 DAHs while also displaying a greater proportion at the flexion stage, but by 9 DAHs, once all the larvae had reached flexion, the differences in length between treatments had disappeared []. Similarly, at 28 DAHs, larval P. dentatus were larger and had developed faster under elevated-CO2 treatments (4714 µatm pCO2) compared with low and intermediate treatments (775 and 1808 µatm) []. Furthermore, Frommel et al. [] found that the growth of larval Atlantic cod Gadus morhua was positively affected by high pCO2 (4200 µatm) between 25 and 39 DAHs, coinciding again with flexion [], but by 46 DAHs, there was no difference between the treatments. The increased growth rate during a critical developmental stage for G. morhua apparently came at a high cost though, as severe-to-lethal tissue damage in internal organs was associated with elevated CO2 concentrations []. Pimentel et al. [] likewise observed a greater incidence of body malformations at 15 DAHs (preflexion) S. aurata exposed to elevated CO2 (1400 µatm).
The present study provides some perspective on the potential impacts of OA on metabolism and growth during the early life stages of a large, commercially important species. Few studies have examined the impacts of OA throughout early ontogeny; rather, most have focused on key developmental periods or arbitrary stages post-hatching. As such, the literature is interspersed with negative, neutral and positive findings on development and growth (reviewed in []). Indeed, if only specific life stages were investigated in the current study, the results could have supported either of these findings, highlighting the importance of conducting studies of this nature throughout the various larval developmental stages. Nevertheless, it would appear in the current instance that elevated CO2 does indeed present an ecologically relevant stressor to developing C. laticeps. Hatchlings appear to be otherwise tolerant, apart from the potentially greater energy expenditure evidenced through the reduced yolk reserves. At preflexion, an inability to respond to and adequately compensate for acid–base disturbances leads to metabolic depression, potentially through a direct environmental effect on extra- and intra-cellular pH []. Consequently, the response to elevated CO2 resulted in reduced growth at age, which may be due to related behavioural and physiological adjustments in line with the theory of metabolic depression, such as reduced activity and protein synthesis, respectively []. Toward the end of preflexion and along with an increase in the gill surface area and mitochondrion-rich ionocyte densities, it appears that acid–base regulation may begin to compensate for imbalances. This is most likely facilitated by an increase in metabolic rate, necessary to maintain acid–base balance, and is fuelled by an increase in energy intake, which promotes compensatory growth [,]. However, this compensatory growth may be associated with developmental abnormalities or tissue damage [,,]. Finally, the potentially negative effects of elevated CO2 encountered here, and possibly even cryptic impacts, are likely mediated by a limitless supply of food, potentially leading to an underestimation of negative outcomes [,]. Future studies would benefit by including varying prey-availability scenarios, while investigations into the development of gills and regulatory potential under varying pCO2 conditions through ontogeny would provide valuable insights for our understanding of pH regulation in the early life stages of fishes.
Author Contributions
Conceptualization, W.M.P. and N.C.J.; methodology, W.M.P.; formal analysis, C.M. and A.-R.C.; investigation, C.M.; writing—original draft preparation, C.M.; writing—review and editing, W.M.P., N.C.J. and A.-R.C.; visualization, C.M.; supervision, W.M.P., A.-R.C. and N.C.J.; project administration, W.M.P.; funding acquisition, W.M.P. and N.C.J. All authors have read and agreed to the published version of the manuscript.
Funding
This research was funded by the African Coelacanth Ecosystem Programme, grant number 110762.
Data Availability Statement
The data presented in this study, as well as that reported as unpublished data, are available on request from the corresponding author. The data are not publicly available due to its incorporation in a doctoral thesis.
Acknowledgments
The authors would like to thank Aldi Nel and Seshnee Reddy for their assistance. We would also like to thank the NRF-SAIAB Aquatic Ecophysiology Research Platform at Rhodes University for the use of infrastructure and equipment as well as the two anonymous reviewers for their valuable comments.
Conflicts of Interest
The authors declare no conflict of interest.
References
- Doney, S.C.; Fabry, V.J.; Feely, R.A.; Kleypas, J.A. Ocean Acidification: The Other CO2 Problem. Ann. Rev. Mar. Sci. 2009, 1, 169–192. [Google Scholar] [CrossRef]
- Caldeira, K.; Wickett, M.E. Anthropogenic carbon and ocean pH. Nature 2003, 425, 365. [Google Scholar] [CrossRef]
- McNeil, B.I.; Matsumoto, K. The Changing Ocean and Freshwater CO2 System, 1st ed.; Elsevier Inc.: Amsterdam, The Netherlands, 2019; Volume 37. [Google Scholar]
- Frieder, C.A.; Nam, S.H.; Martz, T.R.; Levin, L.A. High temporal and spatial variability of dissolved oxygen and pH in a nearshore California kelp forest. Biogeosciences 2012, 9, 3917–3930. [Google Scholar] [CrossRef]
- Munday, P.L.; Jarrold, M.D.; Nagelkerken, I. Ecological Effects of Elevated CO2 on Marine and Freshwater Fishes: From Individual to Community Effects, 1st ed.; Elsevier Inc.: Amsterdam, The Netherlands, 2019; Volume 37. [Google Scholar]
- Pörtner, H.O.; Langenbuch, M.; Reipschläger, A. Biological Impact of Elevated Ocean CO2 Concentrations: Lessons from Animal Physiology and Earth History. J. Oceanogr. 2004, 60, 705–718. [Google Scholar] [CrossRef]
- Ishimatsu, A.; Hayashi, M.; Kikkawa, T. Fishes in high-CO2, acidified oceans. Mar. Ecol. Prog. Ser. 2008, 373, 295–302. [Google Scholar] [CrossRef]
- Heuer, R.M.; Grosell, M. Physiological impacts of elevated carbon dioxide and ocean acidification on fish. Am. J. Physiol. Regul. Integr. Comp. Physiol. 2014, 307, 1061–1084. [Google Scholar] [CrossRef] [PubMed]
- Cameron, J.N. Regulation of blood pH in teleost fish. Respir. Physiol. 1978, 33, 129–144. [Google Scholar] [CrossRef]
- Toews, D.P.; Holeton, G.F.; Heisler, N. Regulation of the acid-base status during environmental hypercapnia in the marine teleost fish Conger conger. J. Exp. Biol. 1983, 107, 9–20. [Google Scholar] [PubMed]
- Brauner, C.J.; Shartau, R.B.; Damsgaard, C.; Esbaugh, A.J.; Wilson, R.W.; Grosell, M. Acid-Base Physiology and CO2 Homeostasis: Regulation and Compensation in Response to Elevated Environmental CO2, 1st ed.; Elsevier Inc.: Amsterdam, The Netherlands, 2019; Volume 37. [Google Scholar]
- Lefevre, S. Effects of High CO2 on Oxygen Consumption Rates, Aerobic Scope and Swimming Performance, 1st ed.; Academic Press: Cambridge, MA, USA, 2019; Volume 37. [Google Scholar]
- Cattano, C.; Claudet, J.; Domenici, P.; Milazzo, M. Living in a high CO2 world: A global meta-analysis shows multiple trait-mediated fish responses to ocean acidification. Ecol. Monogr. 2018, 88, 320–335. [Google Scholar] [CrossRef]
- Esbaugh, A.J.; Heuer, R.; Grosell, M. Impacts of ocean acidification on respiratory gas exchange and acid–base balance in a marine teleost, Opsanus beta. J. Comp. Physiol. B 2012, 182, 921–934. [Google Scholar] [CrossRef]
- Heuer, R.M.; Grosell, M. Elevated CO2 increases energetic cost and ion movement in the marine fish intestine. Sci. Rep. 2016, 6. [Google Scholar] [CrossRef] [PubMed]
- Heuer, R.M.; Welch, M.J.; Rummer, J.L.; Munday, P.L.; Grosell, M. Altered brain ion gradients following compensation for elevated CO2 are linked to behavioural alterations in a coral reef fish. Sci. Rep. 2016, 6. [Google Scholar] [CrossRef] [PubMed]
- Brauner, C.J. Fish Larval Physiology; Finn, R.N., Kapoor, B.G., Eds.; CRC Press: Boca Raton, FL, USA, 2008; Volume 75, pp. 185–198. [Google Scholar]
- Esbaugh, A.J.; Ern, R.; Nordi, W.M.; Johnson, A.S. Respiratory plasticity is insufficient to alleviate blood acid–base disturbances after acclimation to ocean acidification in the estuarine red drum, Sciaenops ocellatus. J. Comp. Physiol. B Biochem. Syst. Environ. Physiol. 2016, 186, 97–109. [Google Scholar] [CrossRef] [PubMed]
- Claiborne, J.B.; Edwards, S.L.; Morrison-Shetlar, A.I. Acid-base regulation in fishes: Cellular and molecular mechanisms. J. Exp. Zool. 2002, 293, 302–319. [Google Scholar] [CrossRef]
- Dahlke, F.; Lucassen, M.; Bickmeyer, U.; Wohlrab, S.; Puvanendran, V.; Mortensen, A.; Chierici, M.; Pörtner, H.O.; Storch, D. Fish embryo vulnerability to combined acidification and warming coincides with a low capacity for homeostatic regulation. J. Exp. Biol. 2020, 223. [Google Scholar] [CrossRef] [PubMed]
- Zimmer, A.M.; Wright, P.A.; Wood, C.M. What is the primary function of the early teleost gill? Evidence for Na+/NH+4 exchange in developing rainbow trout (Oncorhynchus mykiss). Proc. R. Soc. B Biol. Sci. 2014, 281. [Google Scholar] [CrossRef]
- Fu, C.; Wilson, J.M.; Rombough, P.J.; Brauner, C.J. Ions first: Na þ uptake shifts from the skin to the gills before O2 uptake in developing rainbow trout, Oncorhynchus mykiss. Proc. R. Soc. B Biol. Sci. 2010, 277, 1553–1560. [Google Scholar] [CrossRef] [PubMed]
- Fry, F.E.J. The effect of environmental factors on the physiology of fish. In Fish Physiology; Hoar, W.S., Randall, D.J., Eds.; Academic Press: Cambridge, MA, USA, 1971; Volume 6, pp. 1–98. [Google Scholar]
- Garcia, L.M.B.; Sayco, M.J.P.; Aya, F.A. Point-of-no-return and delayed feeding mortalities in first-feeding larvae of the silver therapon Leiopotherapon plumbeus (Kner) (Teleostei: Terapontidae). Aquac. Rep. 2020, 16, 100288. [Google Scholar] [CrossRef]
- Blaxter, J.H.S.; Hempel, G. The Influence of Egg Size on Herring Larvae (Clupea harengus L.). J. Cons. Int. Explor. Mer. 1963, 28, 211–240. [Google Scholar] [CrossRef]
- Stiasny, M.H.; Mittermayer, F.H.; Sswat, M.; Voss, R.; Jutfelt, F.; Chierici, M.; Puvanendran, V.; Mortensen, A.; Reusch, T.B.H.; Clemmesen, C. Ocean Acidification Effects on Atlantic Cod Larval Survival and Recruitment to the Fished Population. PLoS ONE 2016, 11, e0155448. [Google Scholar] [CrossRef]
- Kerwath, S.E.; Winker, H.; Götz, A.; Attwood, C.G. Marine protected area improves yield without disadvantaging fishers. Nat. Commun. 2013, 4, 2347. [Google Scholar] [CrossRef] [PubMed]
- Teske, P.R.; Forget, F.R.G.; Cowley, P.D.; von der Heyden, S.; Beheregaray, L.B. Connectivity between marine reserves and exploited areas in the philopatric reef fish Chrysoblephus laticeps (Teleostei: Sparidae). Mar. Biol. 2010, 157, 2029–2042. [Google Scholar] [CrossRef]
- Buxton, C.D. The reproductive biology of Chrysoblephus laticeps and C. cristiceps (Teleostei: Sparidae). J. Zool. 1990, 220, 497–511. [Google Scholar] [CrossRef]
- Pavlidis, M.A.; Mylonas, C.C. Sparidae: Biology and Aquaculture of Gilthead Sea Bream and Other Species; Wiley-Blackwell: Oxford, UK, 2011. [Google Scholar]
- De Swaef, E.; Van den Broeck, W.; Dierckens, K.; Decostere, A. Disinfection of teleost eggs: A review. Rev. Aquac. 2016, 8, 321–341. [Google Scholar] [CrossRef]
- Davis, J.A. Investigations into the Larval Rearing of Two South African Sparid Species. Ph.D. Thesis, Rhodes University, Grahamstown, South Africa, 1996. [Google Scholar]
- Orr, J.C.; Fabry, V.J.; Aumont, O.; Bopp, L.; Doney, S.C.; Feely, R.A.; Gnanadesikan, A.; Gruber, N.; Ishida, A.; Joos, F.; et al. Anthropogenic ocean acidification over the twenty-first century and its impact on calcifying organisms. Nature 2005, 437, 681–686. [Google Scholar] [CrossRef] [PubMed]
- Mehrbach, C.; Culberson, C.H.; Hawley, J.E.; Pytkowicx, R.M. Measurement of the Apparent Dissociation Constants of Carbonic Acid in Seawater at Atmospheric Pressure. Limnol. Oceanogr. 1973, 18, 897–907. [Google Scholar] [CrossRef]
- Dickson, A.G.; Millero, F.J. A comparison of the equilibrium constants for the dissociation of carbonic acid in seawater media. Deep Sea Res. Part A Oceanogr. Res. Pap. 1987, 34, 1733–1743. [Google Scholar] [CrossRef]
- Andrade, C.A.P.; Brazão, I.P.G.; Nogueira, N.; Ferreira, M.P.; Dillinger, T.; Dinis, M.T.; Narciso, L. Red porgy (Pagrus pagrus) larval feeding performance and behavior at the onset of exogenous feeding. J. Exp. Mar. Biol. Ecol. 2011, 407, 377–381. [Google Scholar] [CrossRef]
- Moyano, M.; Illing, B.; Christiansen, L.; Peck, M.A. Linking rates of metabolism and growth in marine fish larvae. Mar. Biol. 2018, 165, 1–14. [Google Scholar] [CrossRef]
- Chambers, R.C.; Candelmo, A.C.; Habeck, E.A.; Poach, M.E.; Wieczorek, D.; Cooper, K.R.; Greenfield, C.E.; Phelan, B.A. Effects of elevated CO2 in the early life stages of summer flounder, Paralichthys dentatus, and potential consequences of ocean acidification. Biogeosciences 2014, 11, 1613–1626. [Google Scholar] [CrossRef]
- Harianto, J.; Carey, N.; Byrne, M. respR—An R package for the manipulation and analysis of respirometry data. Methods Ecol. Evol. 2019, 10, 912–920. [Google Scholar] [CrossRef]
- Peck, M.A.; Moyano, M. Measuring respiration rates in marine fish larvae: Challenges and advances. J. Fish Biol. 2016, 88, 173–205. [Google Scholar] [CrossRef] [PubMed]
- Bagarinao, T. Yolk resorption, onset of feeding and survival potential of larvae of three tropical marine fish species reared in the hatchery. Mar. Biol. 1986, 91, 449–459. [Google Scholar] [CrossRef]
- Bates, D.; Mächler, M.; Bolker, B.M.; Walker, S.C. Fitting linear mixed-effects models using lme4. J. Stat. Softw. 2015, 67, 1–48. [Google Scholar] [CrossRef]
- Zuur, A.F.; Ieno, E.N.; Walker, N.J.; Saveliev, A.A.; Smith, G.M. GLMM and GAMM; Springer: New York, NY, USA, 2009. [Google Scholar]
- Hartig, F. DHARMa: Residual Diagnostics for Hierarchical Multi-Level. Available online: https://cran.r-project.org/web/packages/DHARMa/vignettes/DHARMa.html (accessed on 4 July 2020).
- R Core Team. R: A Language and Environment for Statistical Computing; R Core Team: Vienna, Austria, 2018. [Google Scholar]
- Munday, P.L.; Watson, S.-A.; Parsons, D.M.; King, A.; Barr, N.G.; Mcleod, I.M.; Allan, B.J.M.; Pether, S.M.J. Effects of elevated CO2 on early life history development of the yellowtail kingfish, Seriola lalandi, a large pelagic fish. ICES J. Mar. Sci. 2015, 73, 641–649. [Google Scholar] [CrossRef]
- Faria, A.M.; Filipe, S.; Lopes, A.F.; Oliveira, A.P.; Gonçalves, E.J.; Ribeiro, L. Effects of high pCO2 on early life development of pelagic spawning marine fish. Mar. Freshw. Res. 2017, 68, 2106. [Google Scholar] [CrossRef]
- Voss, R.; Clemmesen, C.; Baumann, H.; Hinrichsen, H. Baltic sprat larvae: Coupling food availability, larval condition and survival. Mar. Ecol. Prog. Ser. 2006, 308, 243–254. [Google Scholar] [CrossRef]
- Hand, S.C.; Hardewig, I. Downregulation of Cellular Metabolism During Environmental Stress: Mechanisms and Implications. Annu. Rev. Physiol. 1996, 58, 539–563. [Google Scholar] [CrossRef]
- Richards, J.G. Metabolic rate suppression as a mechanism for surviving environmental challenge in fish. In Progress in Molecular and Subcellular Biology; Springer: Berlin/Heidelberg, Germany, 2010; Volume 49, pp. 113–139. [Google Scholar]
- Guppy, M.; Withers, P. Metabolic depression in animals: Physiological perspectives and biochemical generalizations. Biol. Rev. 1999, 74, 1–40. [Google Scholar] [CrossRef]
- Guppy, M.; Fuery, C.J.; Flanigan, J.E. Biochemical principles of metabolic depression. Comp. Biochem. Physiol. Part B Biochem. 1994, 109, 175–189. [Google Scholar] [CrossRef]
- Nilsson, G.E.; Dixson, D.L.; Domenici, P.; McCormick, M.I.; Sørensen, C.; Watson, S.A.; Munday, P.L. Near-future carbon dioxide levels alter fish behaviour by interfering with neurotransmitter function. Nat. Clim. Chang. 2012, 2, 15. [Google Scholar] [CrossRef]
- Pörtner, H.O.; Peck, M.A. Climate change effects on fishes and fisheries: Towards a cause-and-effect understanding. J. Fish Biol. 2010, 77, 1745–1779. [Google Scholar] [CrossRef] [PubMed]
- Baumann, H.; Talmage, S.C.; Gobler, C.J. Reduced early life growth and survival in a fish in direct response to increased carbon dioxide. Nat. Clim. Chang. 2012, 2, 38–41. [Google Scholar] [CrossRef]
- Pimentel, M.S.; Faleiro, F.; Marques, T.; Bispo, R.; Dionísio, G.; Faria, A.M.; Machado, J.; Peck, M.A.; Pörtner, H.; Pousão-Ferreira, P.; et al. Foraging behaviour, swimming performance and malformations of early stages of commercially important fishes under ocean acidification and warming. Clim. Chang. 2016, 137, 495–509. [Google Scholar] [CrossRef]
- Frommel, A.Y.; Margulies, D.; Wexler, J.B.; Stein, M.S.; Scholey, V.P.; Williamson, J.E.; Bromhead, D.; Nicol, S.; Havenhand, J. Ocean acidification has lethal and sub-lethal effects on larval development of yellowfin tuna, Thunnus albacares. J. Exp. Mar. Biol. Ecol. 2016, 482, 18–24. [Google Scholar] [CrossRef]
- Rombough, P. The functional ontogeny of the teleost gill: Which comes first, gas or ion exchange? Comp. Biochem. Physiol. A Mol. Integr. Physiol. 2007, 148, 732–742. [Google Scholar] [CrossRef] [PubMed]
- Rombough, P.J. Respiratory gas exchange, aerobic metabolism, and effects of hypoxia during early life. Fish Physiol. 1988, 11, 59–161. [Google Scholar] [CrossRef]
- Downie, A.T.; Illing, B.; Faria, A.M.; Rummer, J.L. Swimming performance of marine fish larvae: Review of a universal trait under ecological and environmental pressure. Rev. Fish Biol. Fish. 2020, 30, 93–108. [Google Scholar] [CrossRef]
- Bignami, S.; Sponaugle, S.; Cowen, R.K. Effects of ocean acidification on the larvae of a high-value pelagic fisheries species, Mahi-mahi Coryphaena hippurus. Aquat. Biol. 2014, 21, 249–260. [Google Scholar] [CrossRef]
- Frommel, A.Y.; Maneja, R.; Lowe, D.; Malzahn, A.M.; Geffen, A.J.; Folkvord, A.; Piatkowski, U.; Reusch, T.B.H.; Clemmesen, C. Severe tissue damage in Atlantic cod larvae under increasing ocean acidification. Nat. Clim. Chang. 2012, 2, 42–46. [Google Scholar] [CrossRef]
- von Herbing Hunt, I.; Miyake, T.; Hall, B.; Boutilier, R.G. Effects of Temperature on Morphological Landmarks Critical to Growth and Survival in Larval Atlantic Cod (Gadus Morhua); Springer: Berlin/Heidelberg, Germany, 1996; Volume 124. [Google Scholar]
- Munday, P.L.; Donelson, J.M.; Dixson, D.L.; Endo, G.G.K. Effects of ocean acidification on the early life history of a tropical marine fish. Proc. R. Soc. B Biol. Sci. 2009, 276, 3275–3283. [Google Scholar] [CrossRef] [PubMed]
- Frommel, A.Y.; Maneja, R.; Lowe, D.; Pascoe, C.K.; Geffen, A.J.; Folkvord, A.; Piatkowski, U.; Clemmesen, C. Organ damage in Atlantic herring larvae as a result of ocean acidification. Ecol. Appl. 2014, 24, 1131–1143. [Google Scholar] [CrossRef] [PubMed]
- Stiasny, M.H.; Sswat, M.; Mittermayer, F.H.; Falk-Petersen, I.; Schnell, N.K.; Puvanendran, V.; Mortensen, A.; Reusch, T.B.H.; Clemmesen, C. Divergent responses of Atlantic cod to ocean acidification and food limitation. Glob. Chang. Biol. 2019, 25, 839–849. [Google Scholar] [CrossRef] [PubMed]
Publisher’s Note: MDPI stays neutral with regard to jurisdictional claims in published maps and institutional affiliations. |
© 2020 by the authors. Licensee MDPI, Basel, Switzerland. This article is an open access article distributed under the terms and conditions of the Creative Commons Attribution (CC BY) license (http://creativecommons.org/licenses/by/4.0/).