1. Introduction
An accurate marginal fit is one of the most important factors determining the clinical success of fixed prosthodontic restorations. Inadequate adaptation at the crown margin may result in cement dissolution, plaque accumulation, microleakage, and the onset of caries or periodontal disease, ultimately compromising the longevity of restorations [
1]. Advances in computer-aided design and computer-aided manufacturing (CAD/CAM) have made it possible to fabricate restorations with consistent precision and reproducibility, often achieving marginal gaps below the generally accepted clinical threshold of 100 μm [
2]. Nevertheless, the choice of restorative material and preparation design remain major variables influencing the accuracy of fit.
Leucite-reinforced glass ceramics, such as IPS Empress CAD, have been extensively utilised due to their superior esthetics, translucency, and satisfactory mechanical strength. Previous studies have reported that such materials exhibit high compressive strength and reliable marginal adaptation when processed through CAD/CAM systems [
3]. Despite these beneficial properties, glass ceramics are brittle compared with newer resin-based or composite materials, which has stimulated ongoing research into alternative CAD/CAM blocks capable of combining esthetics with improved resilience [
2,
3].
Hybrid CAD/CAM blocks such as Cerasmart (GC) incorporate a flexible nano-ceramic matrix with uniformly distributed nanoceramic fillers in a resin matrix, designed to provide a modulus of elasticity closer to dentin and easier machinability. Studies have demonstrated that Cerasmart restorations achieve clinically acceptable marginal gaps and fracture resistance comparable to other composite-based materials [
3]. Moreover, in comparative tests, Cerasmart performed favorably against glass ceramics such as IPS e.max CAD, with both materials yielding acceptable internal and marginal fit values [
3]. There is evidence suggesting that hybrid ceramics may offer a balance between adaptability, mechanical performance, and repairability [
1,
3].
More recently, graphene-reinforced composites such as G-CAM have been introduced into the CAD/CAM market. Despite their reduced mechanical strength in comparison to glass ceramics, these materials exhibit advantageous load distribution and enhanced resistance to catastrophic fracture. These properties render them particularly well-suited for utilization in single-unit restorations [
3]. In parallel, preparation geometry has been shown to also influence marginal fit, as proved in early CAD/CAM studies with composite crowns where different finish line configurations produced variations in adaptation [
4,
5]. Together, these findings highlight the need for systematic in vitro evaluations that compare the marginal fit of diverse CAD/CAM materials under standardized preparation conditions, bridging the gap between mechanical performance and clinical applicability.
Marginal and internal fit play a critical role in the long-term clinical success of fixed restorations, as inadequate marginal fit promotes plaque accumulation and microleakage, potentially leading to secondary caries, pulpal inflammation and periodontal disease [
6]. Clinically acceptable marginal discrepancies have been reported to range from 50 to 120 μm [
7]. CAD/CAM technology allows the fabrication of restorations both chairside and in the dental laboratory, either from partially sintered blocks milled in a soft state and subsequently sintered, or from fully sintered blocks milled under high load conditions [
1]. Studies have shown that different CAD/CAM systems produce significantly different marginal gap values; for example, CEREC inLAB showed a lower absolute marginal discrepancy compared to the LAVA system, while both remained within the clinically acceptable range [
8].
Digital scanning techniques also affect marginal accuracy. Intraoral scanning has been shown to produce smaller vertical marginal gaps than extraoral scanning of impressions or stone casts, regardless of whether zirconia or hybrid ceramics were used [
9]. In addition, material selection affects both adaptation and fracture resistance. For example, endocrown restorations fabricated from polyetheretherketone (PEEK) showed superior marginal and internal fit compared to zirconia, and fracture resistance comparable to zirconia but higher than hybrid ceramics [
10].
Although several investigations have assessed the marginal adaptation or mechanical performance of individual CAD/CAM materials, few studies have directly compared glass ceramics, hybrid ceramics, and graphene-reinforced composites under the same experimental conditions. Available reports often focus on either mechanical strength [
3] or marginal fit in limited material combinations [
1,
4], leaving a lack of comprehensive evidence regarding how these classes of materials perform relative to one another. Furthermore, while the effect of preparation geometry on marginal adaptation has been recognized [
5], the interaction between preparation design and novel CAD/CAM materials remains underexplored.
Considering that there are some gaps in the literature regarding this matter [
11], there is a need for controlled laboratory studies that evaluate the marginal fit of clinically relevant CAD/CAM materials using standardized and reproducible protocols. In particular, the combination of 3D-printed abutments with high-resolution scanning electron microscopy (SEM) offers a reliable platform to measure discrepancies with precision. The present study therefore aimed to investigate the influence of three CAD/CAM restorative materials—IPS Empress CAD (leucite-reinforced glass ceramic), Cerasmart (resin-based hybrid ceramic), and G-CAM (graphene-reinforced composite)—on the marginal fit of single-unit crowns fabricated under standardized preparation conditions.
The null hypotheses tested were that (1) there would be no significant difference in marginal gap values among the three CAD/CAM materials; (2) preparation design would not significantly influence marginal adaptation; and (3) all tested crowns would present marginal discrepancies within clinically acceptable thresholds.
2. Materials and Methods
2.1. Study Design
This was an in vitro experimental study designed to evaluate the marginal adaptation of single-unit crowns fabricated from three CAD/CAM restorative materials. Standardized abutments representing a maxillary first molar were produced by 3D printing, restored with crowns milled from CAD/CAM blocks, cemented using dual-cure resin cement, and examined under scanning electron microscopy (SEM). Marginal fit was evaluated at the vestibular crown–abutment interface using multiple magnifications (45×, 100×, and 450×).
2.2. Sample Preparation
A representative upper first molar was selected as the reference tooth, given its frequent involvement in restorative procedures due to high caries prevalence. The tooth was scanned with an intraoral scanner (TRIOS 3, 3Shape, Copenhagen, Denmark), and the digital model was used to design standardized preparations. Three sets of occlusal/cervical reduction depths were defined: 1.5/1.0 mm, 1.0/0.7 mm, and 0.6/0.4 mm. These were chosen to simulate clinically relevant preparation geometries while ensuring standardization.
Abutments were fabricated using an Asiga MAX UV stereolithography (SLA) 3D printer (Asiga, Alexandria, Australia) with a layer thickness of 50 µm. A photopolymer resin (DentaMODEL, Asiga) (NextDent, Vertex-Dental B.V., Soesterberg, The Netherlands) was deposited layer by layer, followed by cleaning in isopropyl alcohol and post-curing in a UV chamber. This technology was selected for its high accuracy, reproducibility, and efficiency compared to conventional methods.
The sample size was established using prior literature on marginal adaptation of CAD/CAM crowns and preliminary morphometric measurements. Mean vertical marginal gap values from similar SEM-based studies ranged between approximately 30–70 µm, with reported standard deviations of 10–15 µm. Assuming a clinically relevant difference of 20 µm between groups, a standard deviation of 12 µm, a significance level (α) of 0.05, and a desired power of 80%, a priori power analysis (G*Power 3.1) indicated that six specimens per subgroup would be sufficient to detect statistically significant differences. This resulted in a total of 18 crowns (three materials × three preparation designs × two specimens per subgroup). This sample size is consistent with the methodology adopted in previous investigations of CAD/CAM marginal fit [
12,
13], in which a similar number of specimens per material group was considered adequate for in vitro comparison.
2.3. Crown Fabrication and Group Allocation
A total of 18 crowns were produced (n = 6 per material, 2 for each preparation depth). The three material groups were
Group E: IPS Empress CAD (Ivoclar Vivadent, Schaan, Liechtenstein);
Group C: Cerasmart (GC, Tokyo, Japan);
Group G: G-CAM (Graphenano Dental, Valencia, Spain).
Each crown was designed with identical morphology using CAD software (Exocad DentalCAD, version 3.0 Galway, Exocad GmbH, Darmstadt, Germany).) and a uniform cement space of 80 µm. Milling was performed with a CORiTEC 150i PRO unit (Imes-Icore, Eiterfeld, Germany) under constant water cooling and manufacturer-recommended parameters to avoid chipping and preserve marginal integrity.
Each material group was further subdivided into three subgroups according to the tooth preparation design:
Subgroup 1: 1.5 mm occlusal/lateral reduction and 1.0 mm cervical reduction;
Subgroup 2: 1.0 mm occlusal/lateral reduction and 0.7 mm cervical reduction;
Subgroup 3: 0.6 mm occlusal/lateral reduction and 0.4 mm cervical reduction.
This resulted in six specimens per material group (two per preparation design), for a total of 18 crowns. The number of specimens per subgroup was determined following a priori sample size calculation based on data from Nakamura et al. (2005) [
13], assuming an expected difference of 20 μm, standard deviation of 12 μm, α = 0.05, and statistical power of 80%.
2.4. Digital Scanning and CAD/CAM Design
The digital abutment designs were produced identically for each subgroup, ensuring reproducibility. Abutments were fabricated by 3D printing using an Asiga MAX UV printer (Asiga, Alexandria, NSW, Australia) with a photopolymer resin, selected for its precision, repeatability, and reduced working time.
2.5. Crown Manufacturing
A total of 18 crowns were milled from three materials:
Group E: IPS Empress CAD (Ivoclar Vivadent, Schaan, Liechtenstein)
Group C: Cerasmart (GC, Tokyo, Japan)
Group G: G-CAM (Graphenano Dental, Valencia, Spain)
Each material group included all three preparation subgroups, resulting in six crowns per material. Crowns were designed in CAD software using uniform cement space and morphology parameters and milled with a CORiTEC 150i PRO unit (Imes-Icore, Eiterfeld, Germany).
2.6. Cementation Protocols
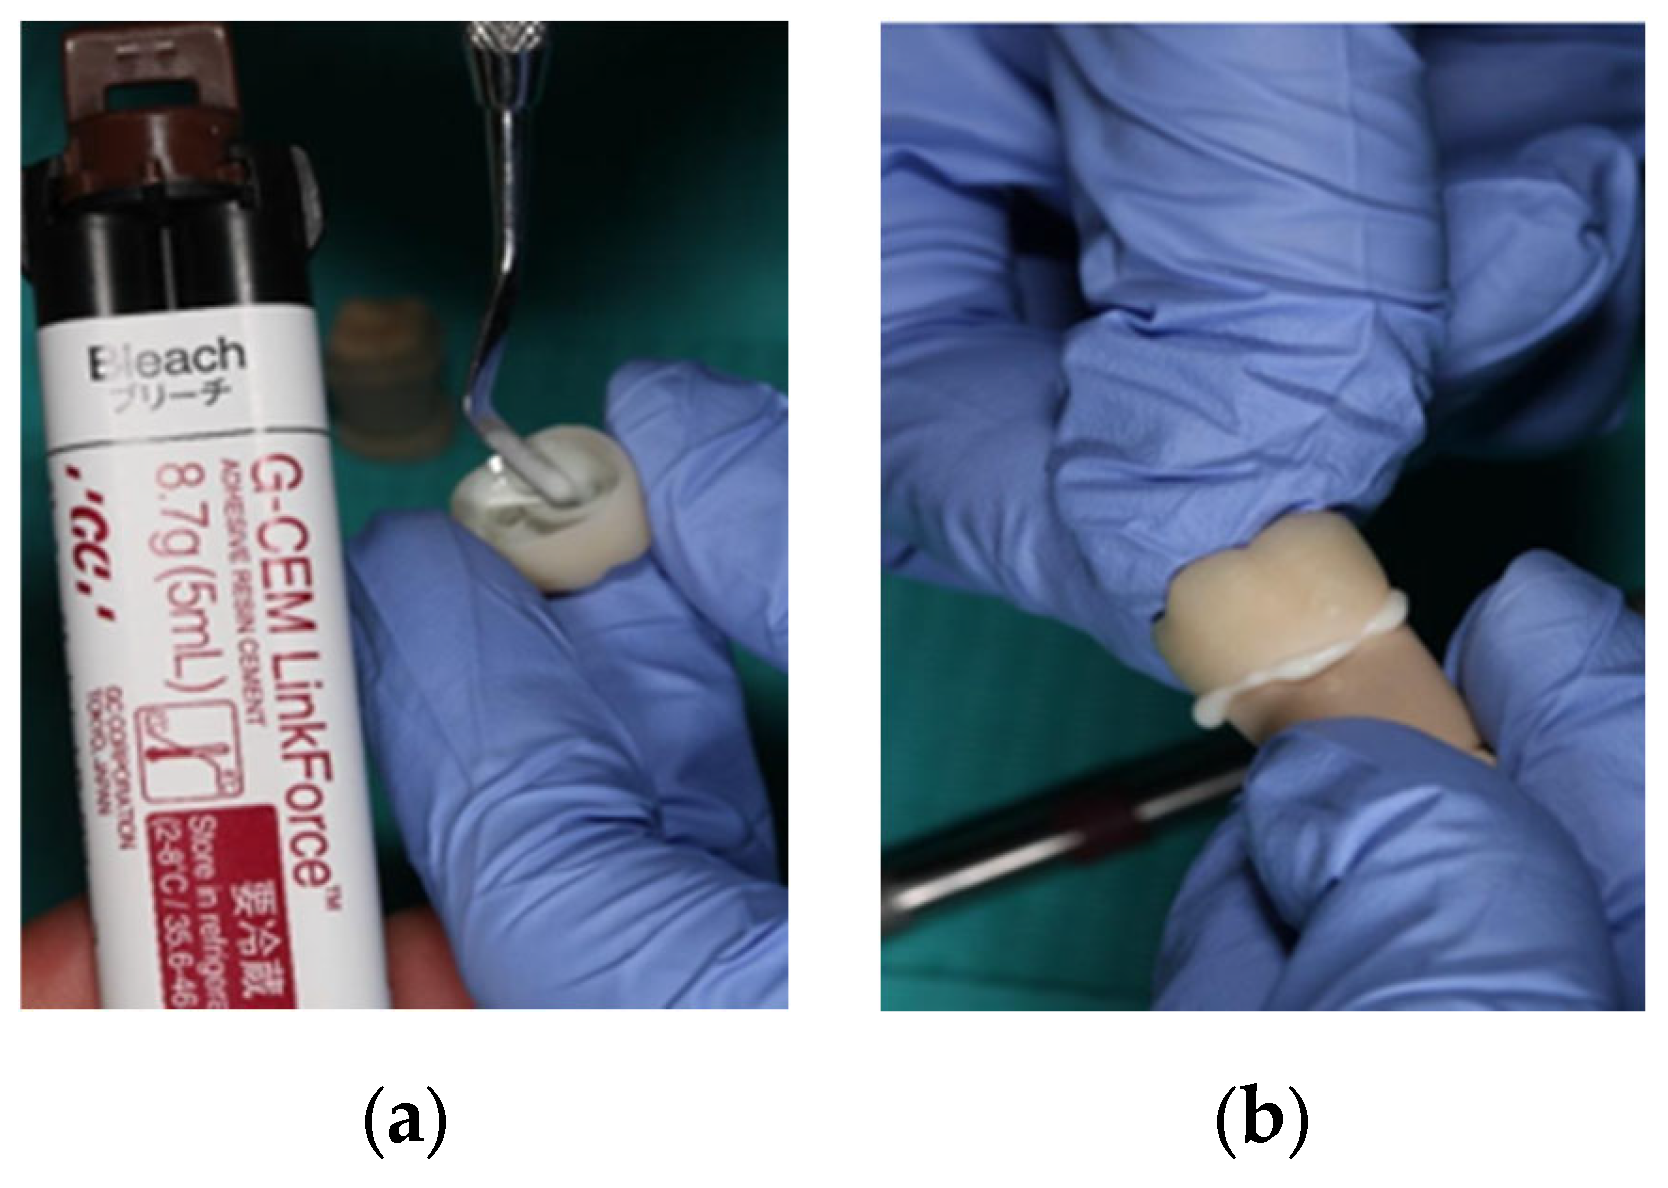
Crowns were cemented using dual-cure resin cement (G-CEM LinkForce (GC Corporation, Tokyo, Japan) according to the manufacturer’s recommendations and material-specific surface treatments:
IPS Empress CAD: Abutment degreased with alcohol, bonding agent (G-Premio BOND, GC Corporation, Tokyo, Japan) (
Figure 1) applied, light-cured; inner surface etched with hydrofluoric acid for 60 s, rinsed, dried, silanated (G-Multi PRIMER, GC Corporation, Tokyo, Japan), and cemented (
Figure 2).
Cerasmart: Abutment prepared as above; crown interior sandblasted (25–50 μm Al2O3, 0.15 MPa), rinsed, silanated, and cemented.
G-CAM: Same protocol as Cerasmart.
After crown seating, excess cement was removed following short pre-polymerization (1–2 s), and final light-curing was performed for 20 s on each surface.
2.7. Marginal and Internal Fit Assessment
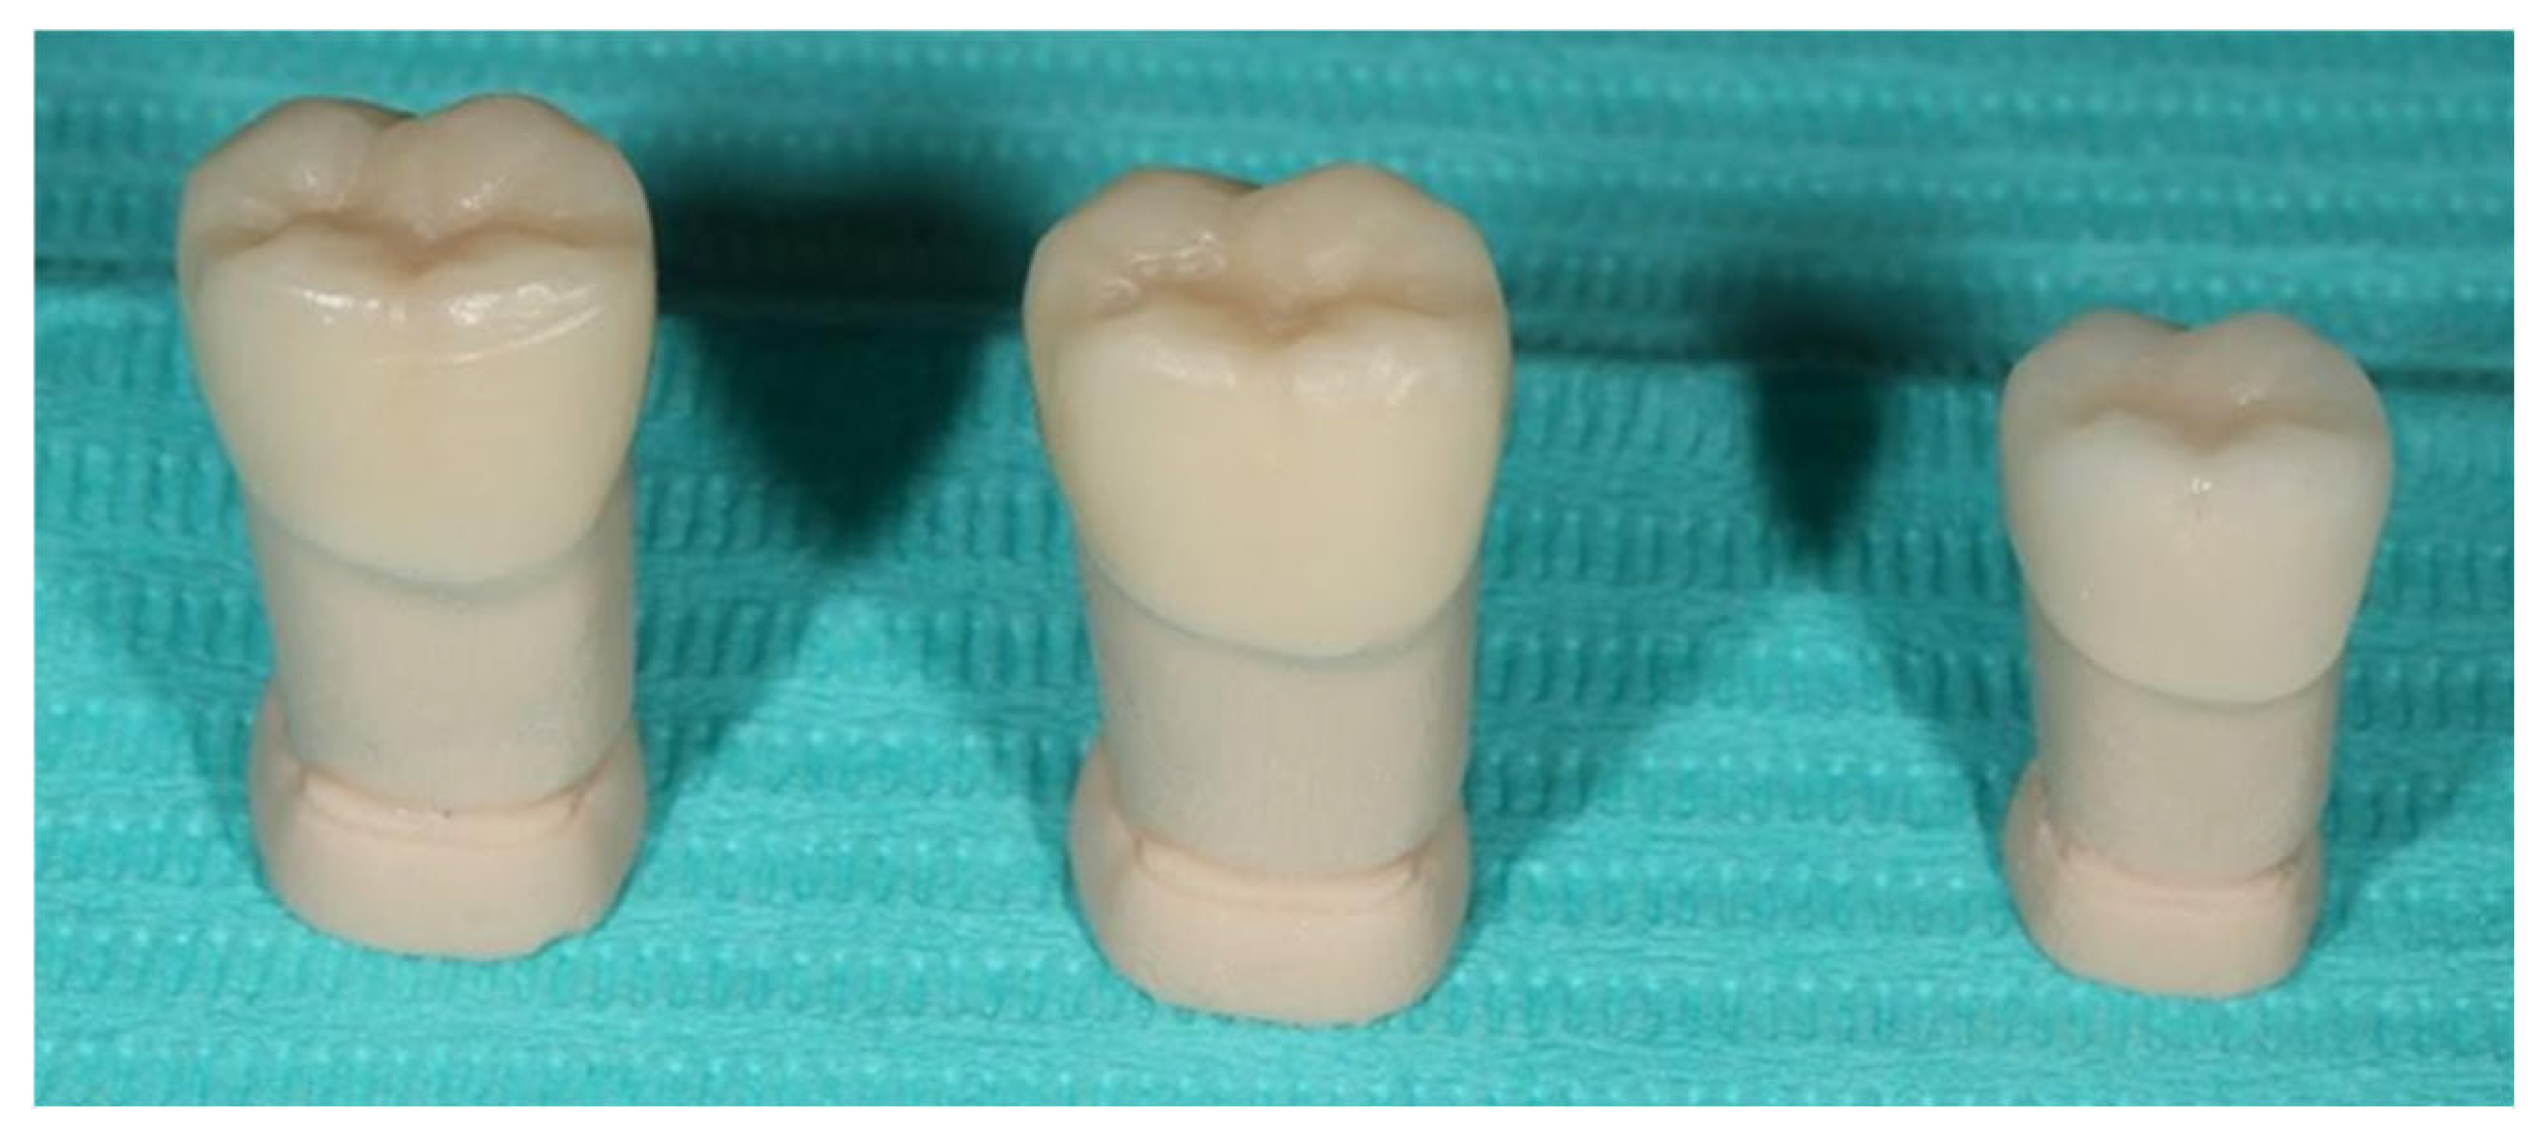
After cementation, all crowns were macroscopically inspected (
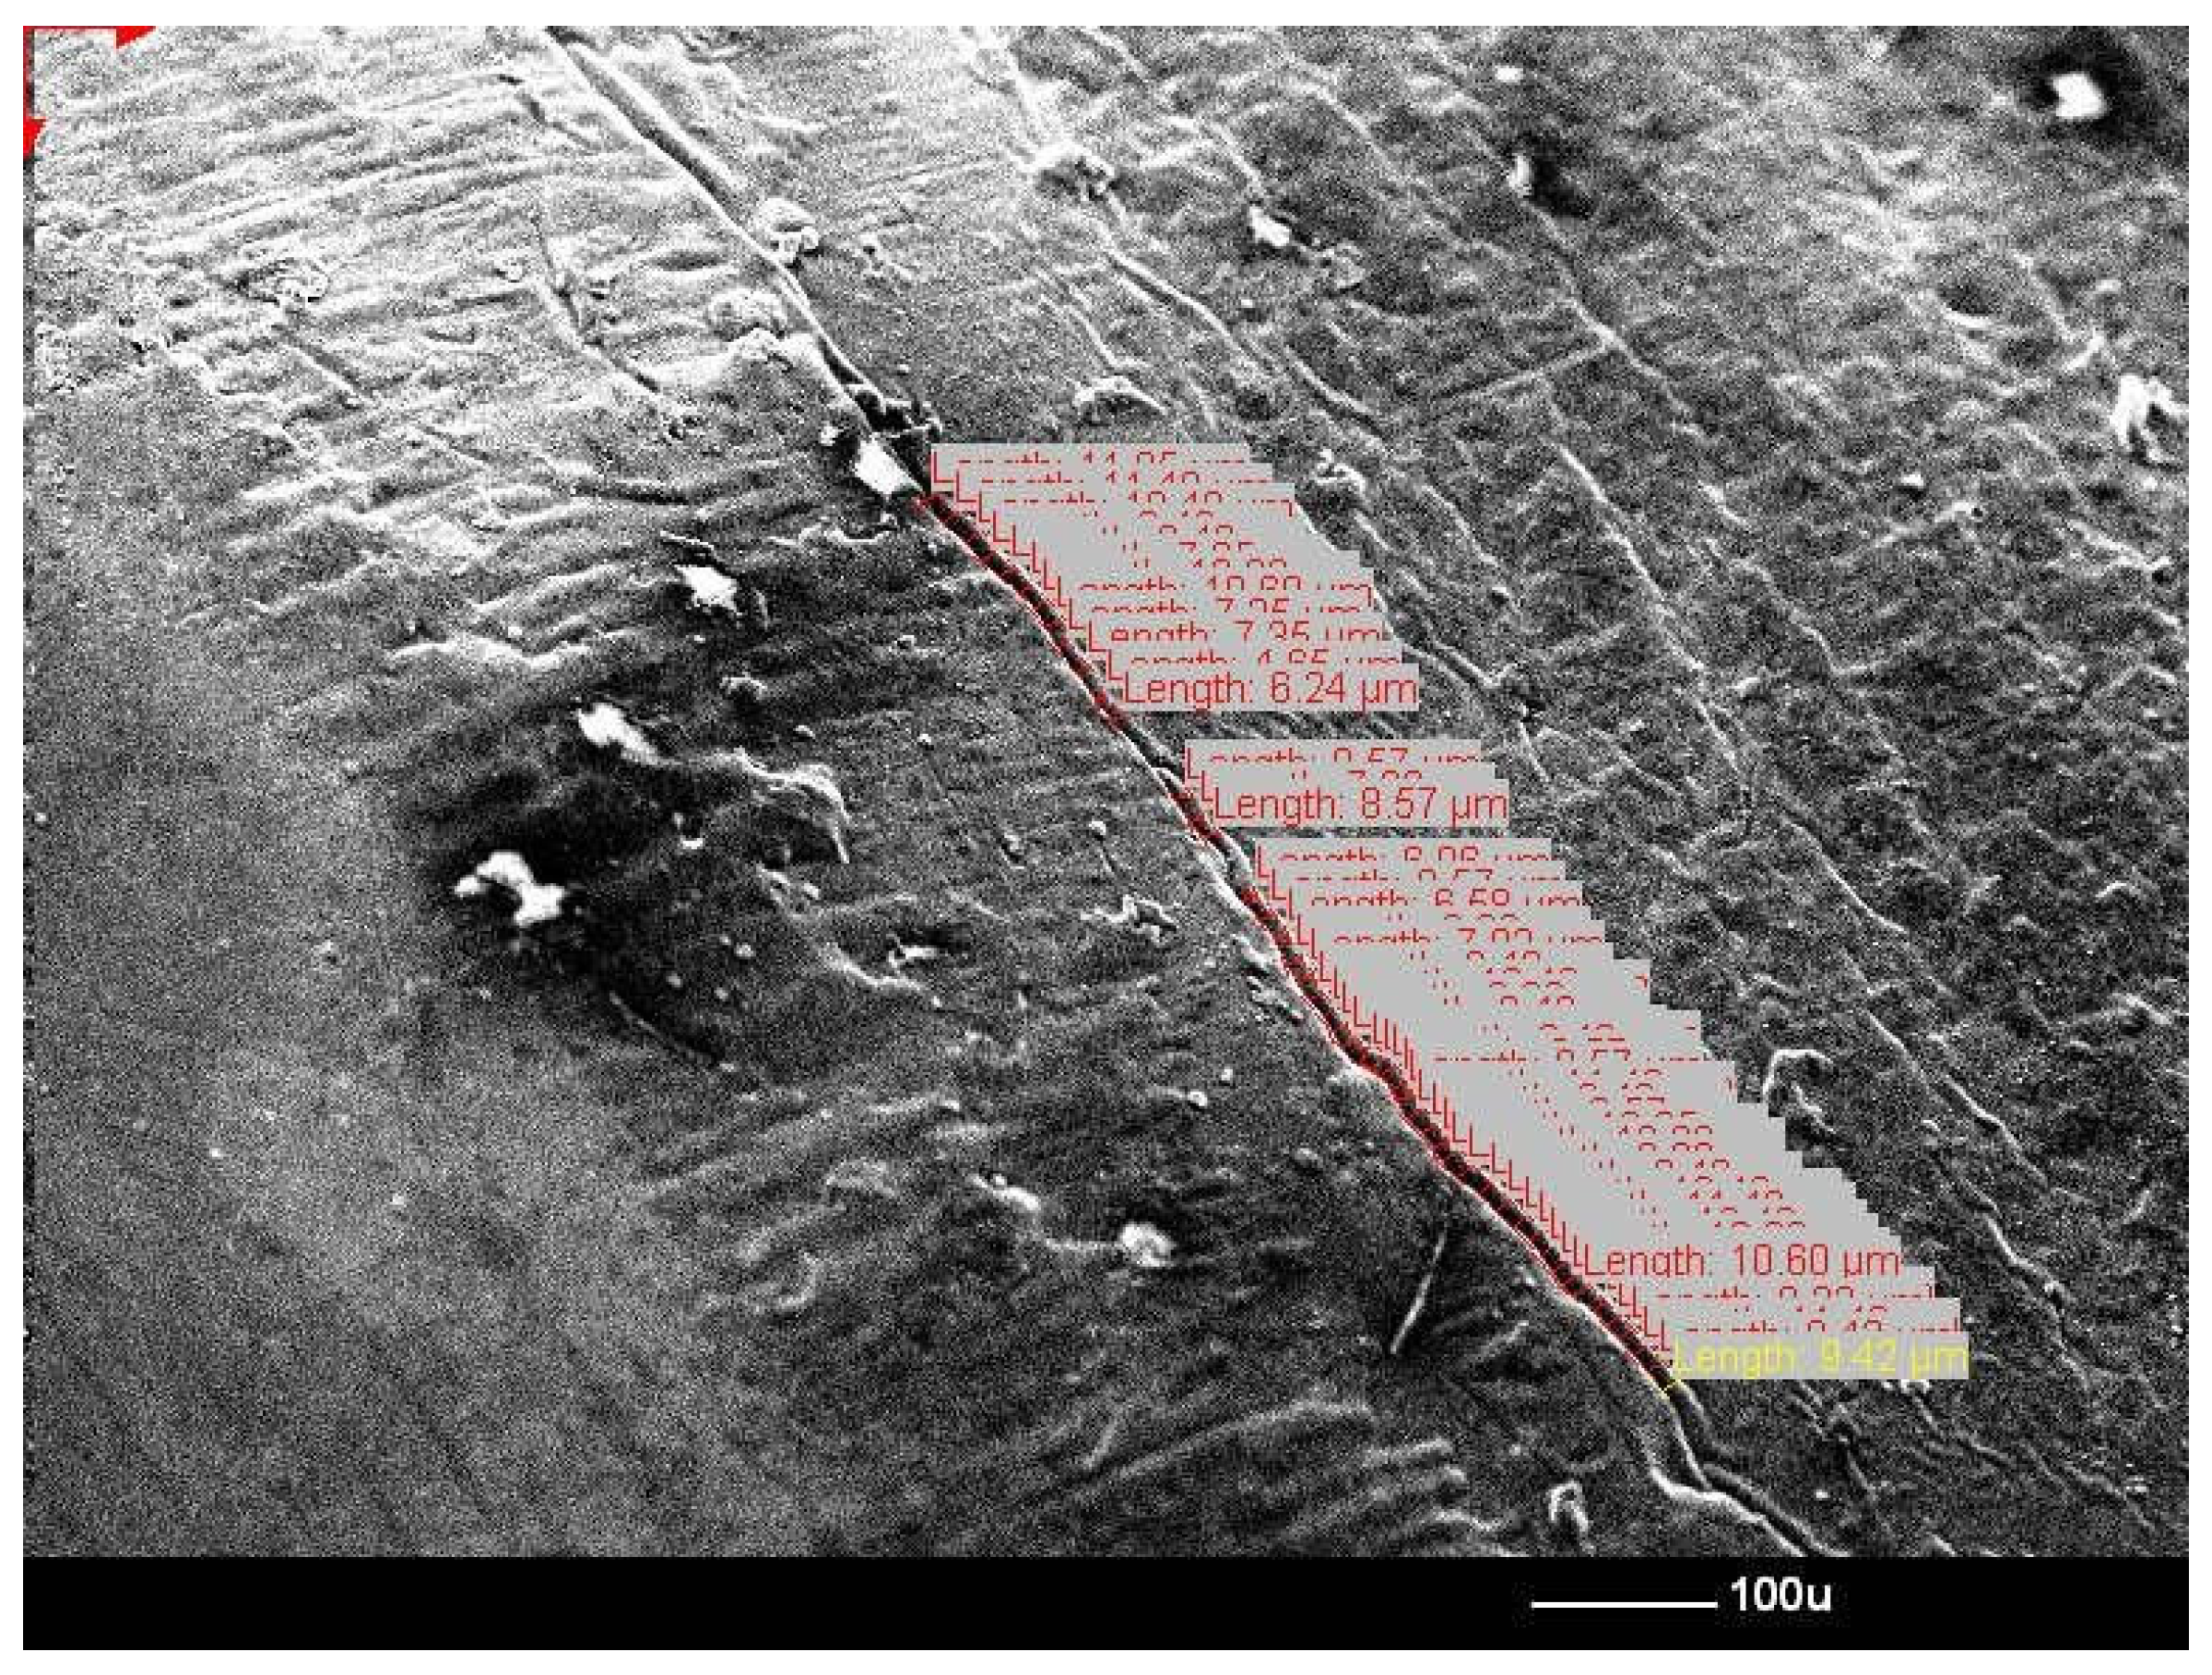
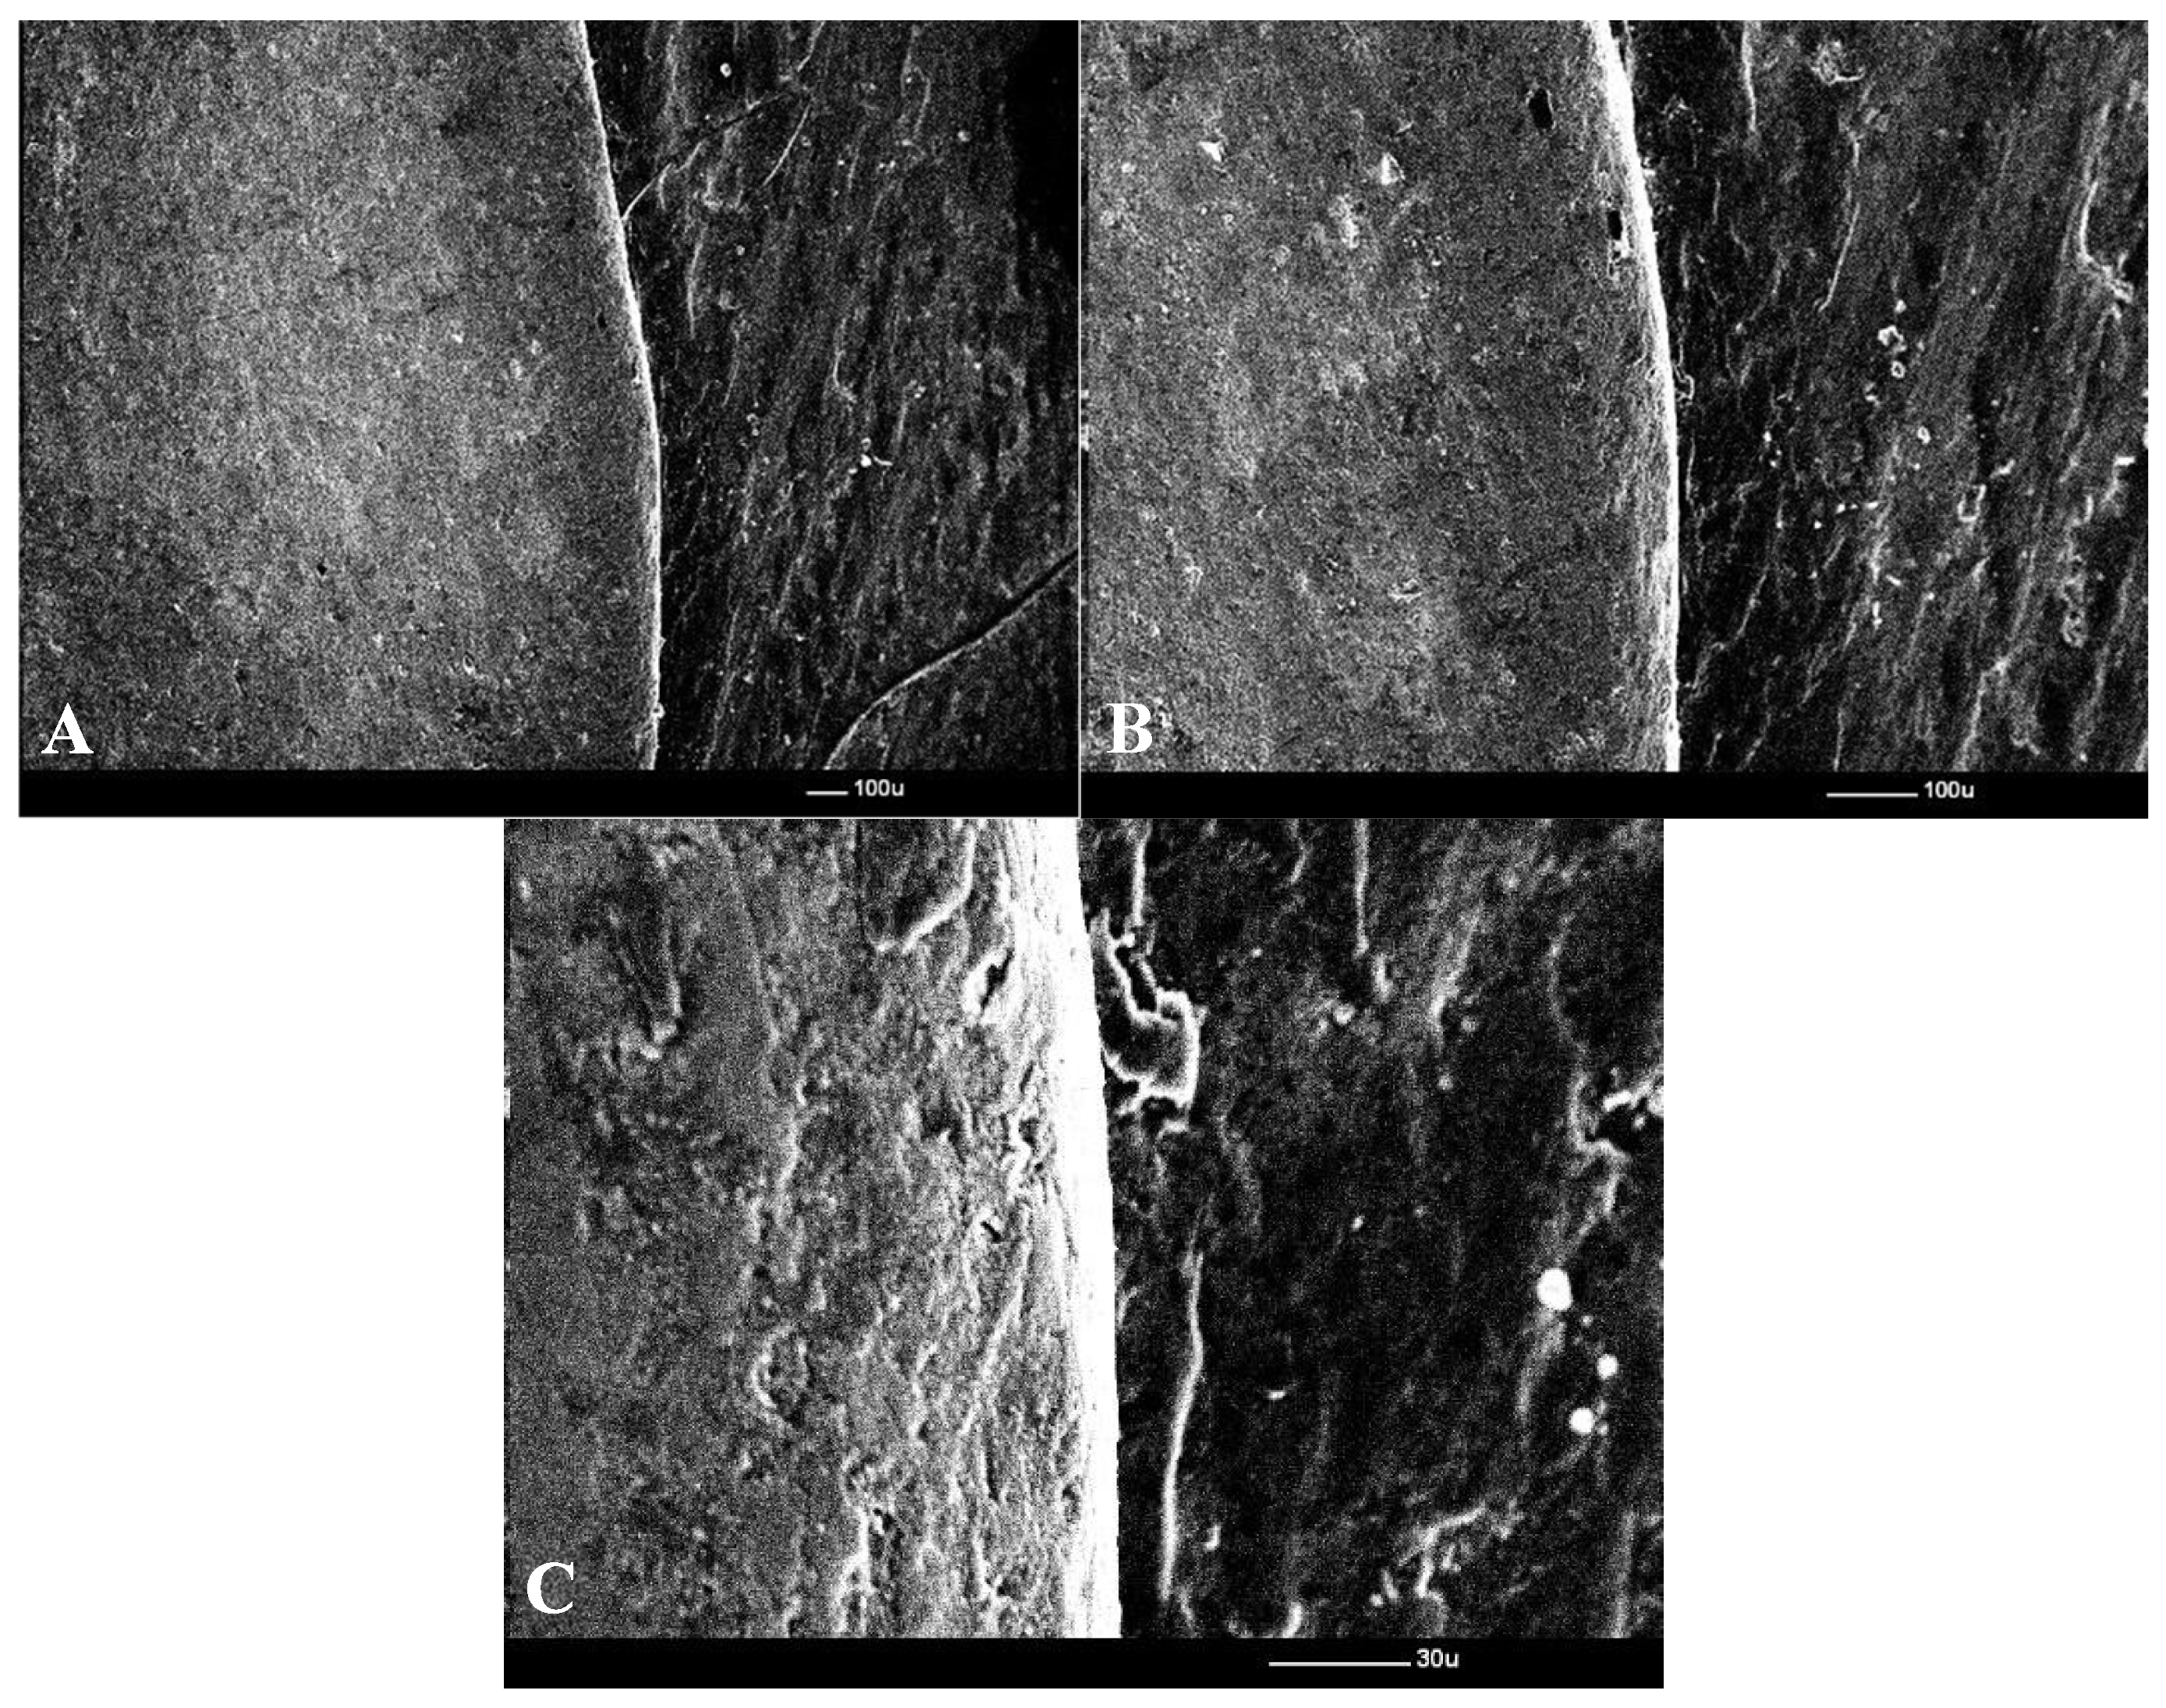
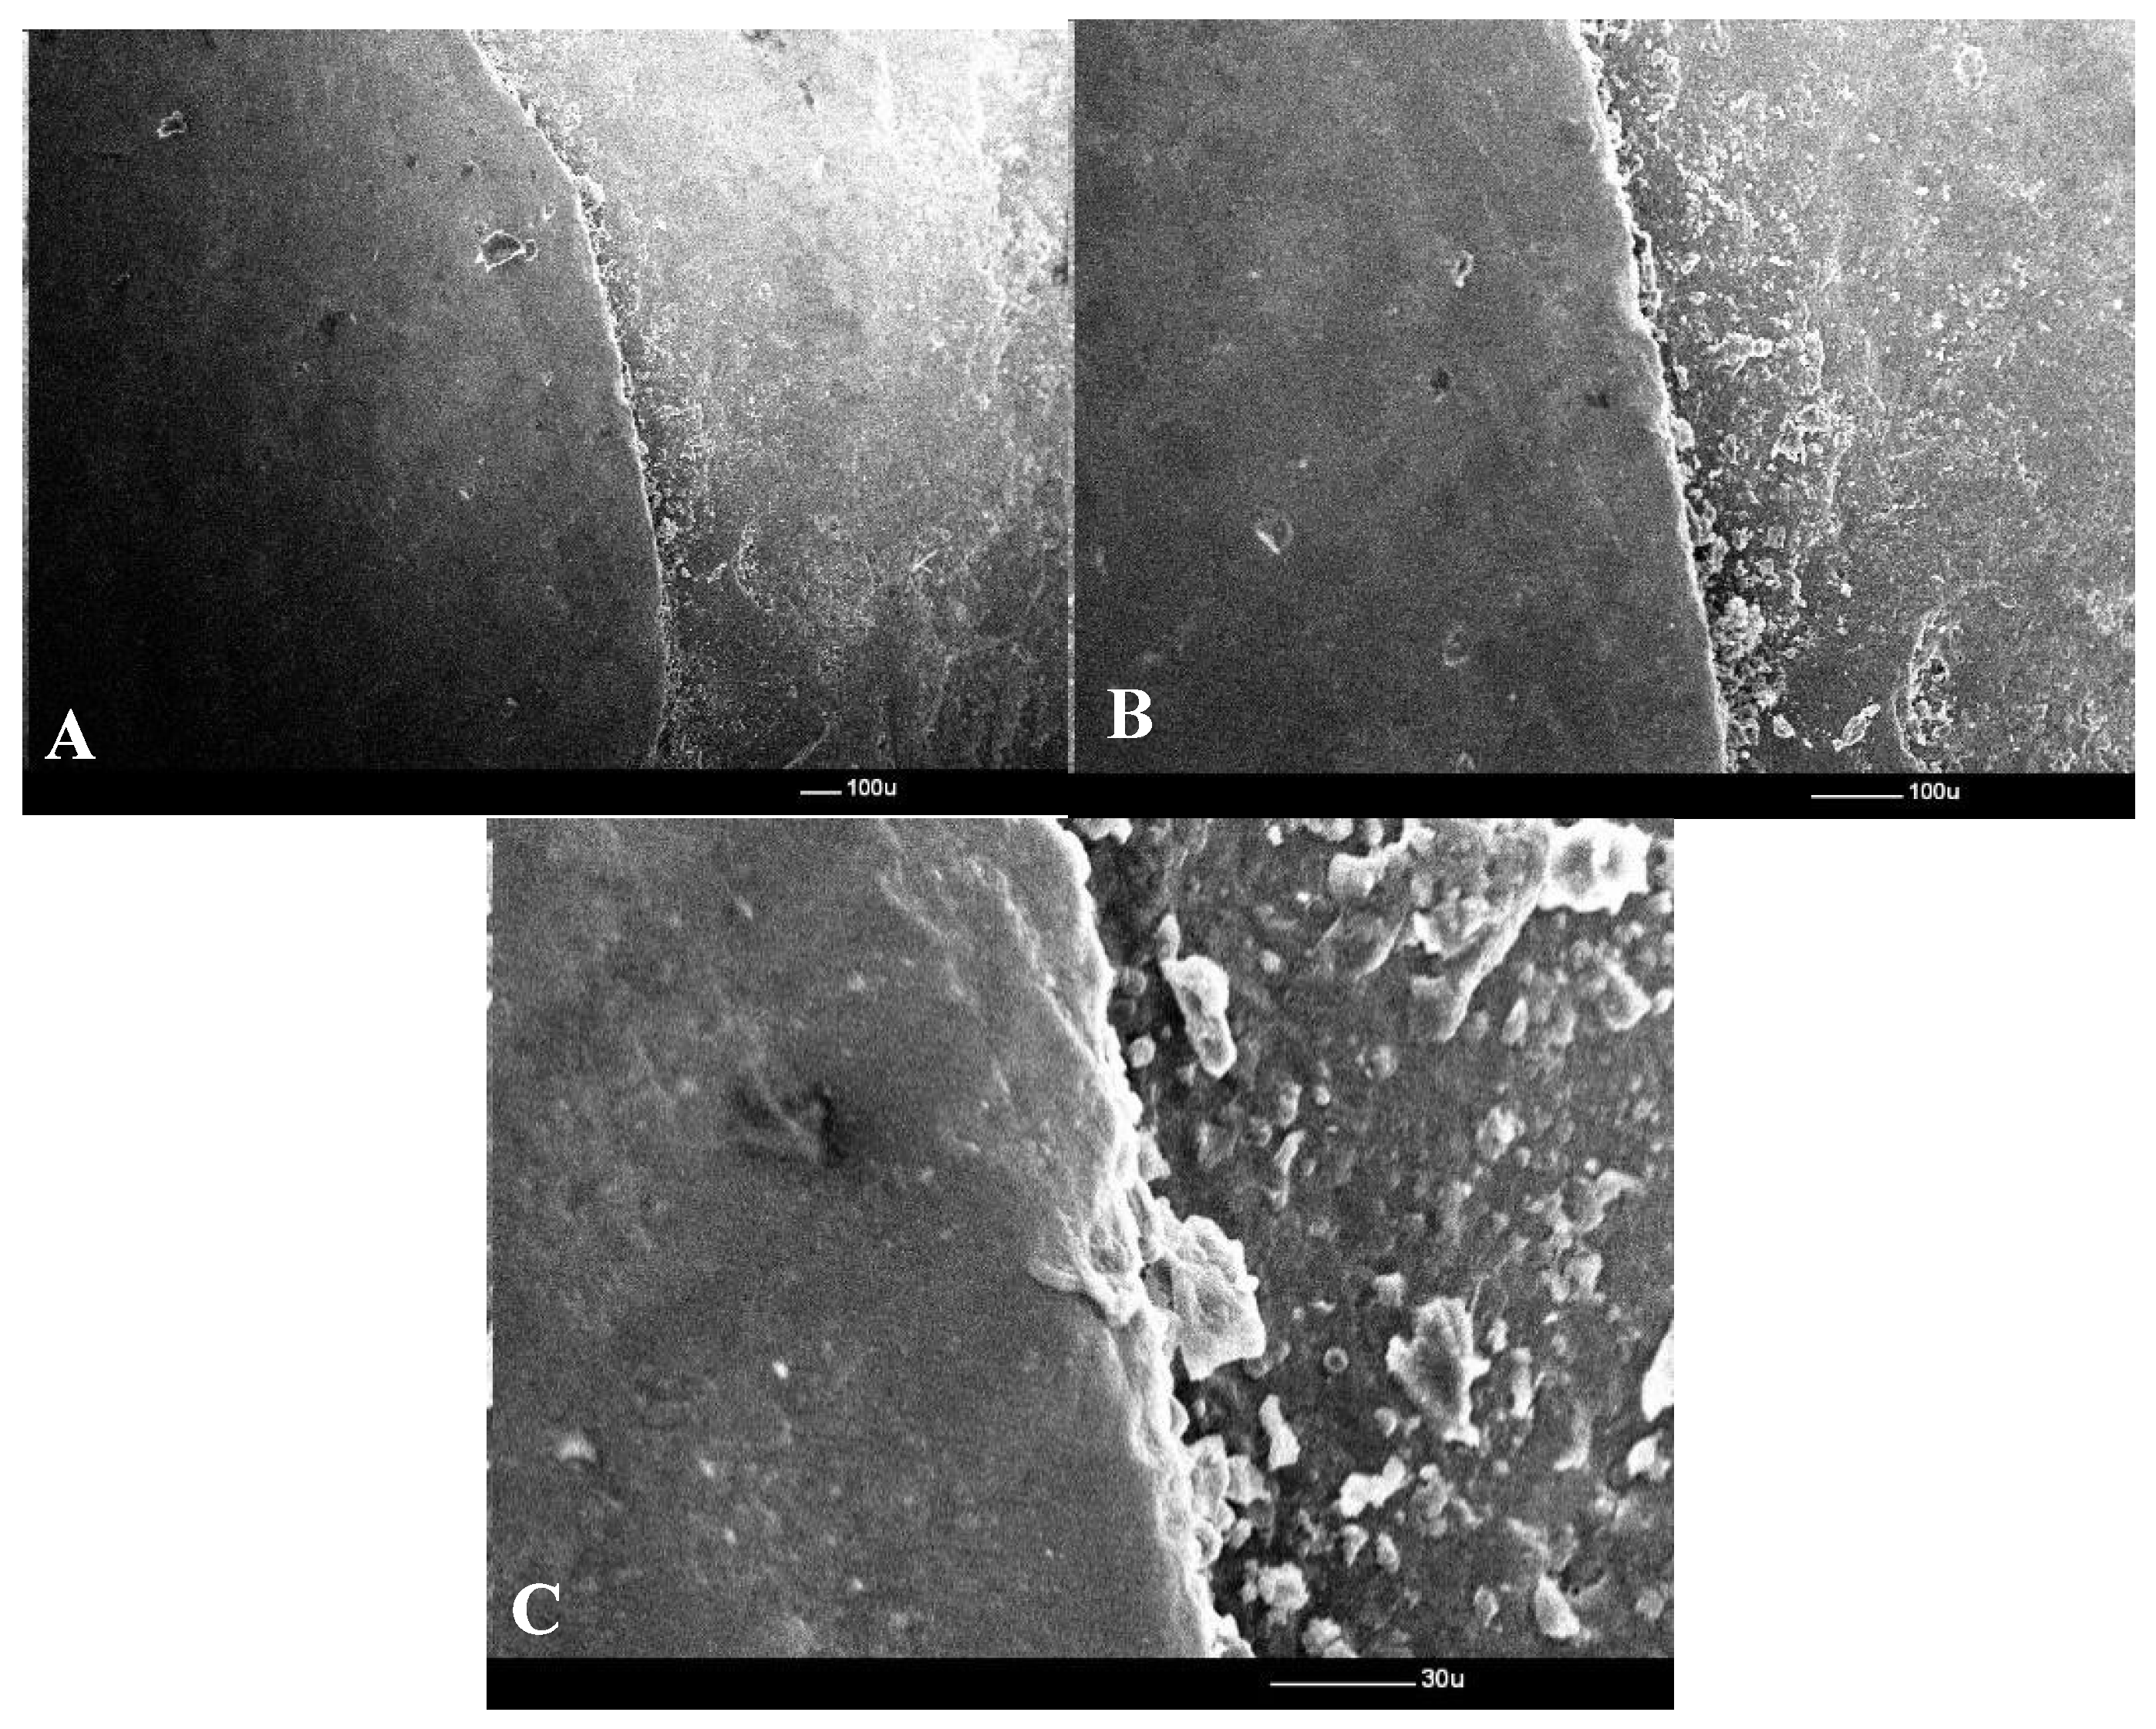
Figure 3) for marginal adaptation, then prepared for SEM observation. Each sample was gold-coated (3–5 nm) using a Polaron E-5100 sputter coater in an argon atmosphere (0.05 torr, 2 kV, 20 mA, 40 s per side). SEM analysis was performed using a JSM-25S Scanning Electron Microscope (JEOL Ltd., Tokyo, Japan) ) at 45×, 100×, and 450× magnification, corresponding to scale bars of 100 µm (45× and 100×) and 30 µm (450×). Digital images were captured using a Deben Pixie–3000 processor ((Deben UK Ltd., Bury St Edmunds, Suffolk, UK)). This multi-scale approach was chosen to capture (i) overall seating at 45×, (ii) continuity of the crown–abutment interface at 100×, and (iii) precise micrometric measurement of marginal gaps at 450× (
Figure 4).
The vestibular surface was examined systematically from distal to mesial, with 3–4 sets of images obtained along the crown–abutment interface for each sample.
2.8. Selection of Crowns for Quantitative SEM Measurement
All 18 crowns were initially examined under low magnification (45×) to verify the continuity and visibility of the crown–abutment interface. All measurements were performed by a single calibrated operator. Intra-operator reliability was verified through repeated pilot measurements prior to data collection, ensuring consistency of tracing and landmark placement under SEM. Only crowns where the entire vestibular margin could be clearly interpreted were included in quantitative morphometric analysis. Crowns presenting polishing artefacts, incomplete seating, blurred margins, chipping or insufficient contrast at the cement line were excluded to avoid measurement bias.
As a result, 9 crowns generated valid measurable data (2 Cerasmart, 1 IPS Empress CAD and 6 G-CAM), yielding a total of 362 SEM gap measurements (Cerasmart: 98; IPS Empress CAD: 56; G-CAM: 208). In this study, the unit of analysis was the individual SEM measurement site, not the fabricated crown. This approach is consistent with previously published SEM-based marginal fit protocols where interpretability of the cement line is the primary inclusion criterion [
14,
15,
16].
2.9. Statistical Analysis
Descriptive and inferential statistics were computed using SPSS v27 (IBM Corp., Armonk, NY, USA). Normality was assessed using the Shapiro–Wilk test and homogeneity of variance with Levene’s test. Pairwise comparisons were performed using independent-samples t-tests, with effect size expressed as Cohen’s d.
In order to improve clarity, a methodological flowchart (
Figure 5) was prepared to summarize the workflow.
Because multiple SEM measurements were taken from each crown, the dataset follows a nested structure (measurement points within crowns, crowns within materials). The analysis was therefore based on pooled measurement points per material, which is a standard approach in SEM-based marginal gap studies where the measurement unit is the interface rather than the specimen count.
3. Results
A total of 18 crowns (n = 6 per material) were fabricated and examined macroscopically and under SEM. However, only 9 crowns presented margins that were sufficiently interpretable for quantitative SEM measurement.
3.1. Adaptation Under SEM
All cemented crowns exhibited continuous seating along the abutment-restoration interface when examined macroscopically. SEM evaluation revealed variations in marginal gap width between groups and subgroups.
At 45× magnification, the crown margins appeared well adapted in all specimens, with no visible overhangs or open margins. At 100×, the marginal line was clearly visible, with some specimens showing a uniform cement line and others showing small discontinuities. At 450×, the cement space was clearly visible, allowing accurate morphometric measurements.
The descriptive marginal gap values per preparation subgroup are presented in
Table 1.
3.2. Quantitative Analysis
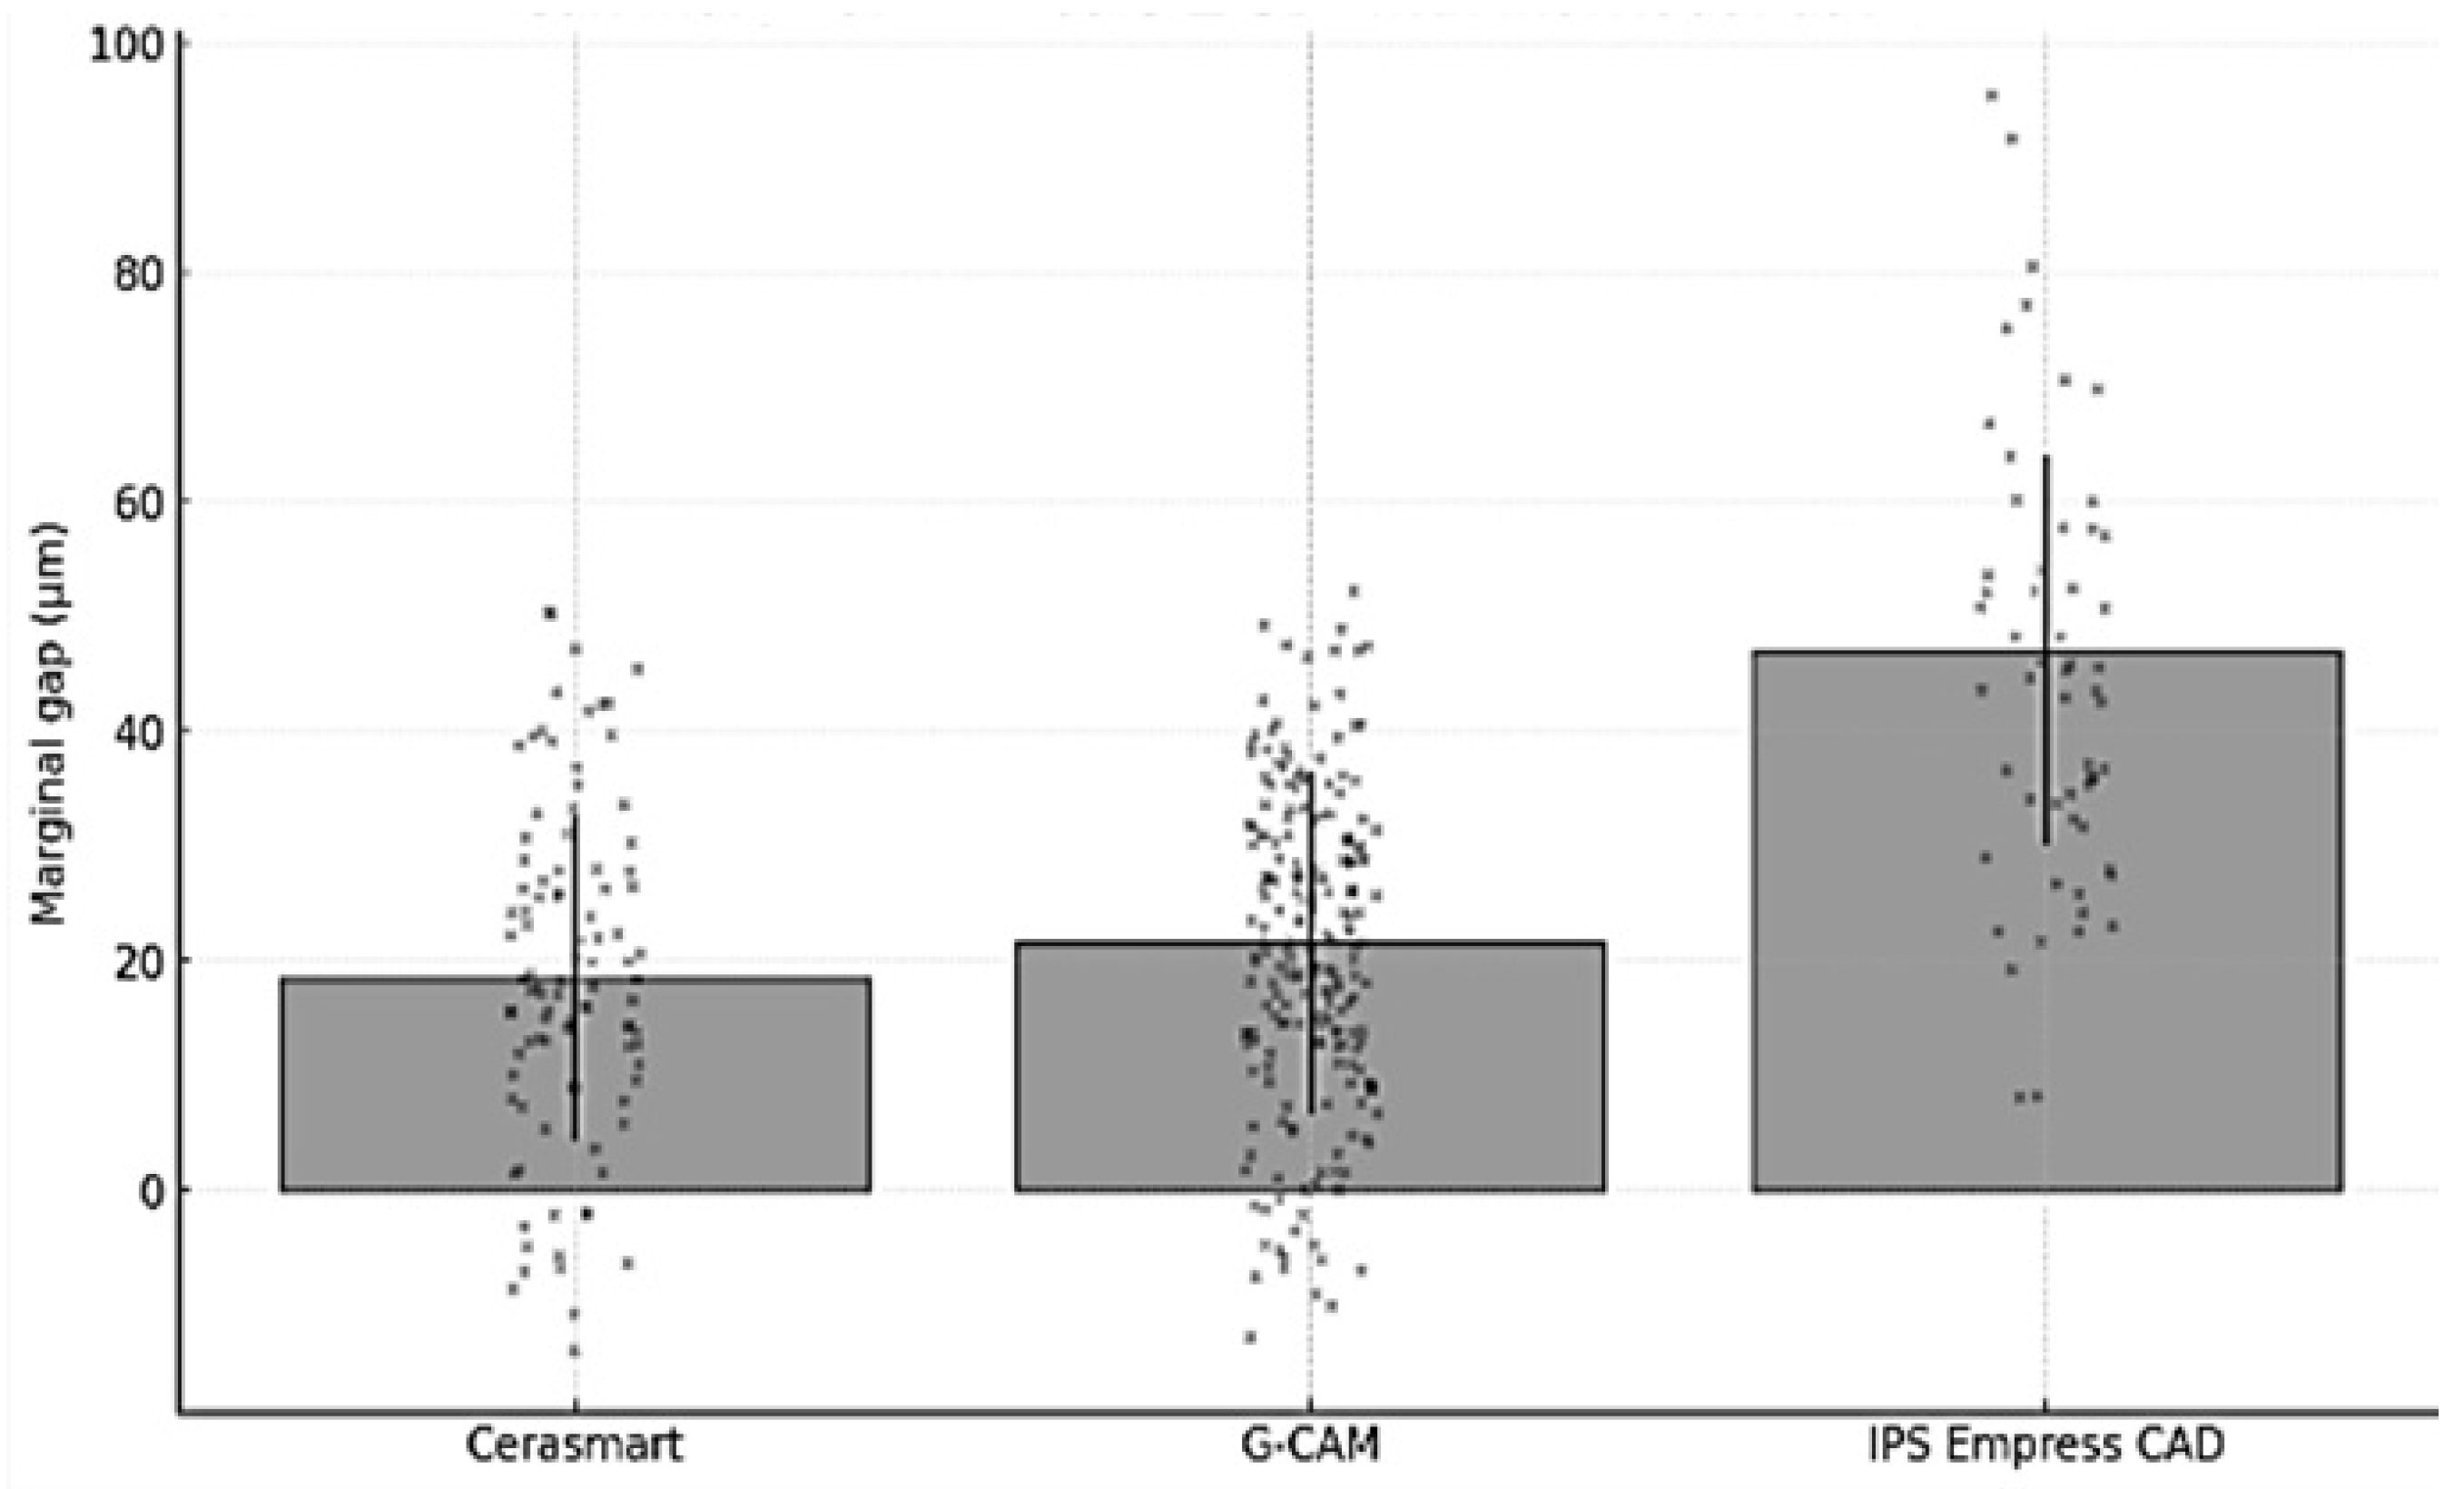
When pooled per material group, the overall mean ± SD marginal gap values were 18.53 ± 14.15 µm for Cerasmart, 21.60 ± 14.89 µm for G-CAM, and 47.09 ± 16.93 µm for IPS Empress CAD (
Table 2). All three materials remained well below the clinically accepted threshold of 100–120 µm. These values reflect only the crowns that exhibited clearly interpretable margins under SEM (n = 9), yielding a total of 362 pooled measurement points.
To provide transparency at the specimen level, the individual mean marginal gap values per crown are presented in
Table 3 with measurement counts estimated proportionally to the number of SEM images captured per specimen.
To ensure transparency at the specimen level, the individual mean marginal gap values for each crown included in the quantitative analysis are shown in
Table 3. Because only clearly interpretable SEM regions were eligible for measurement, the number of measurement points per crown was not uniform and reflects the proportional contribution of each specimen to the pooled dataset.
To quantify the magnitude of the difference between materials beyond statistical significance, effect sizes (Cohen’s d) were calculated using the pooled SEM dataset. The results are summarized in
Table 4.
These effect sizes indicate that IPS Empress CAD demonstrated substantially larger marginal gaps than both composite-based materials, while the difference between Cerasmart and G-CAM was small-to-moderate in magnitude.
3.3. Quantitative Results and Statistical Outcomes
Pairwise t-tests performed on pooled SEM measurements showed statistically significant differences between all three materials (p < 0.05), with Cerasmart presenting the smallest marginal gaps, followed by G-CAM and IPS Empress CAD. Preparation depth was documented descriptively only and was not statistically tested due to insufficient replication per subgroup (n = 2).
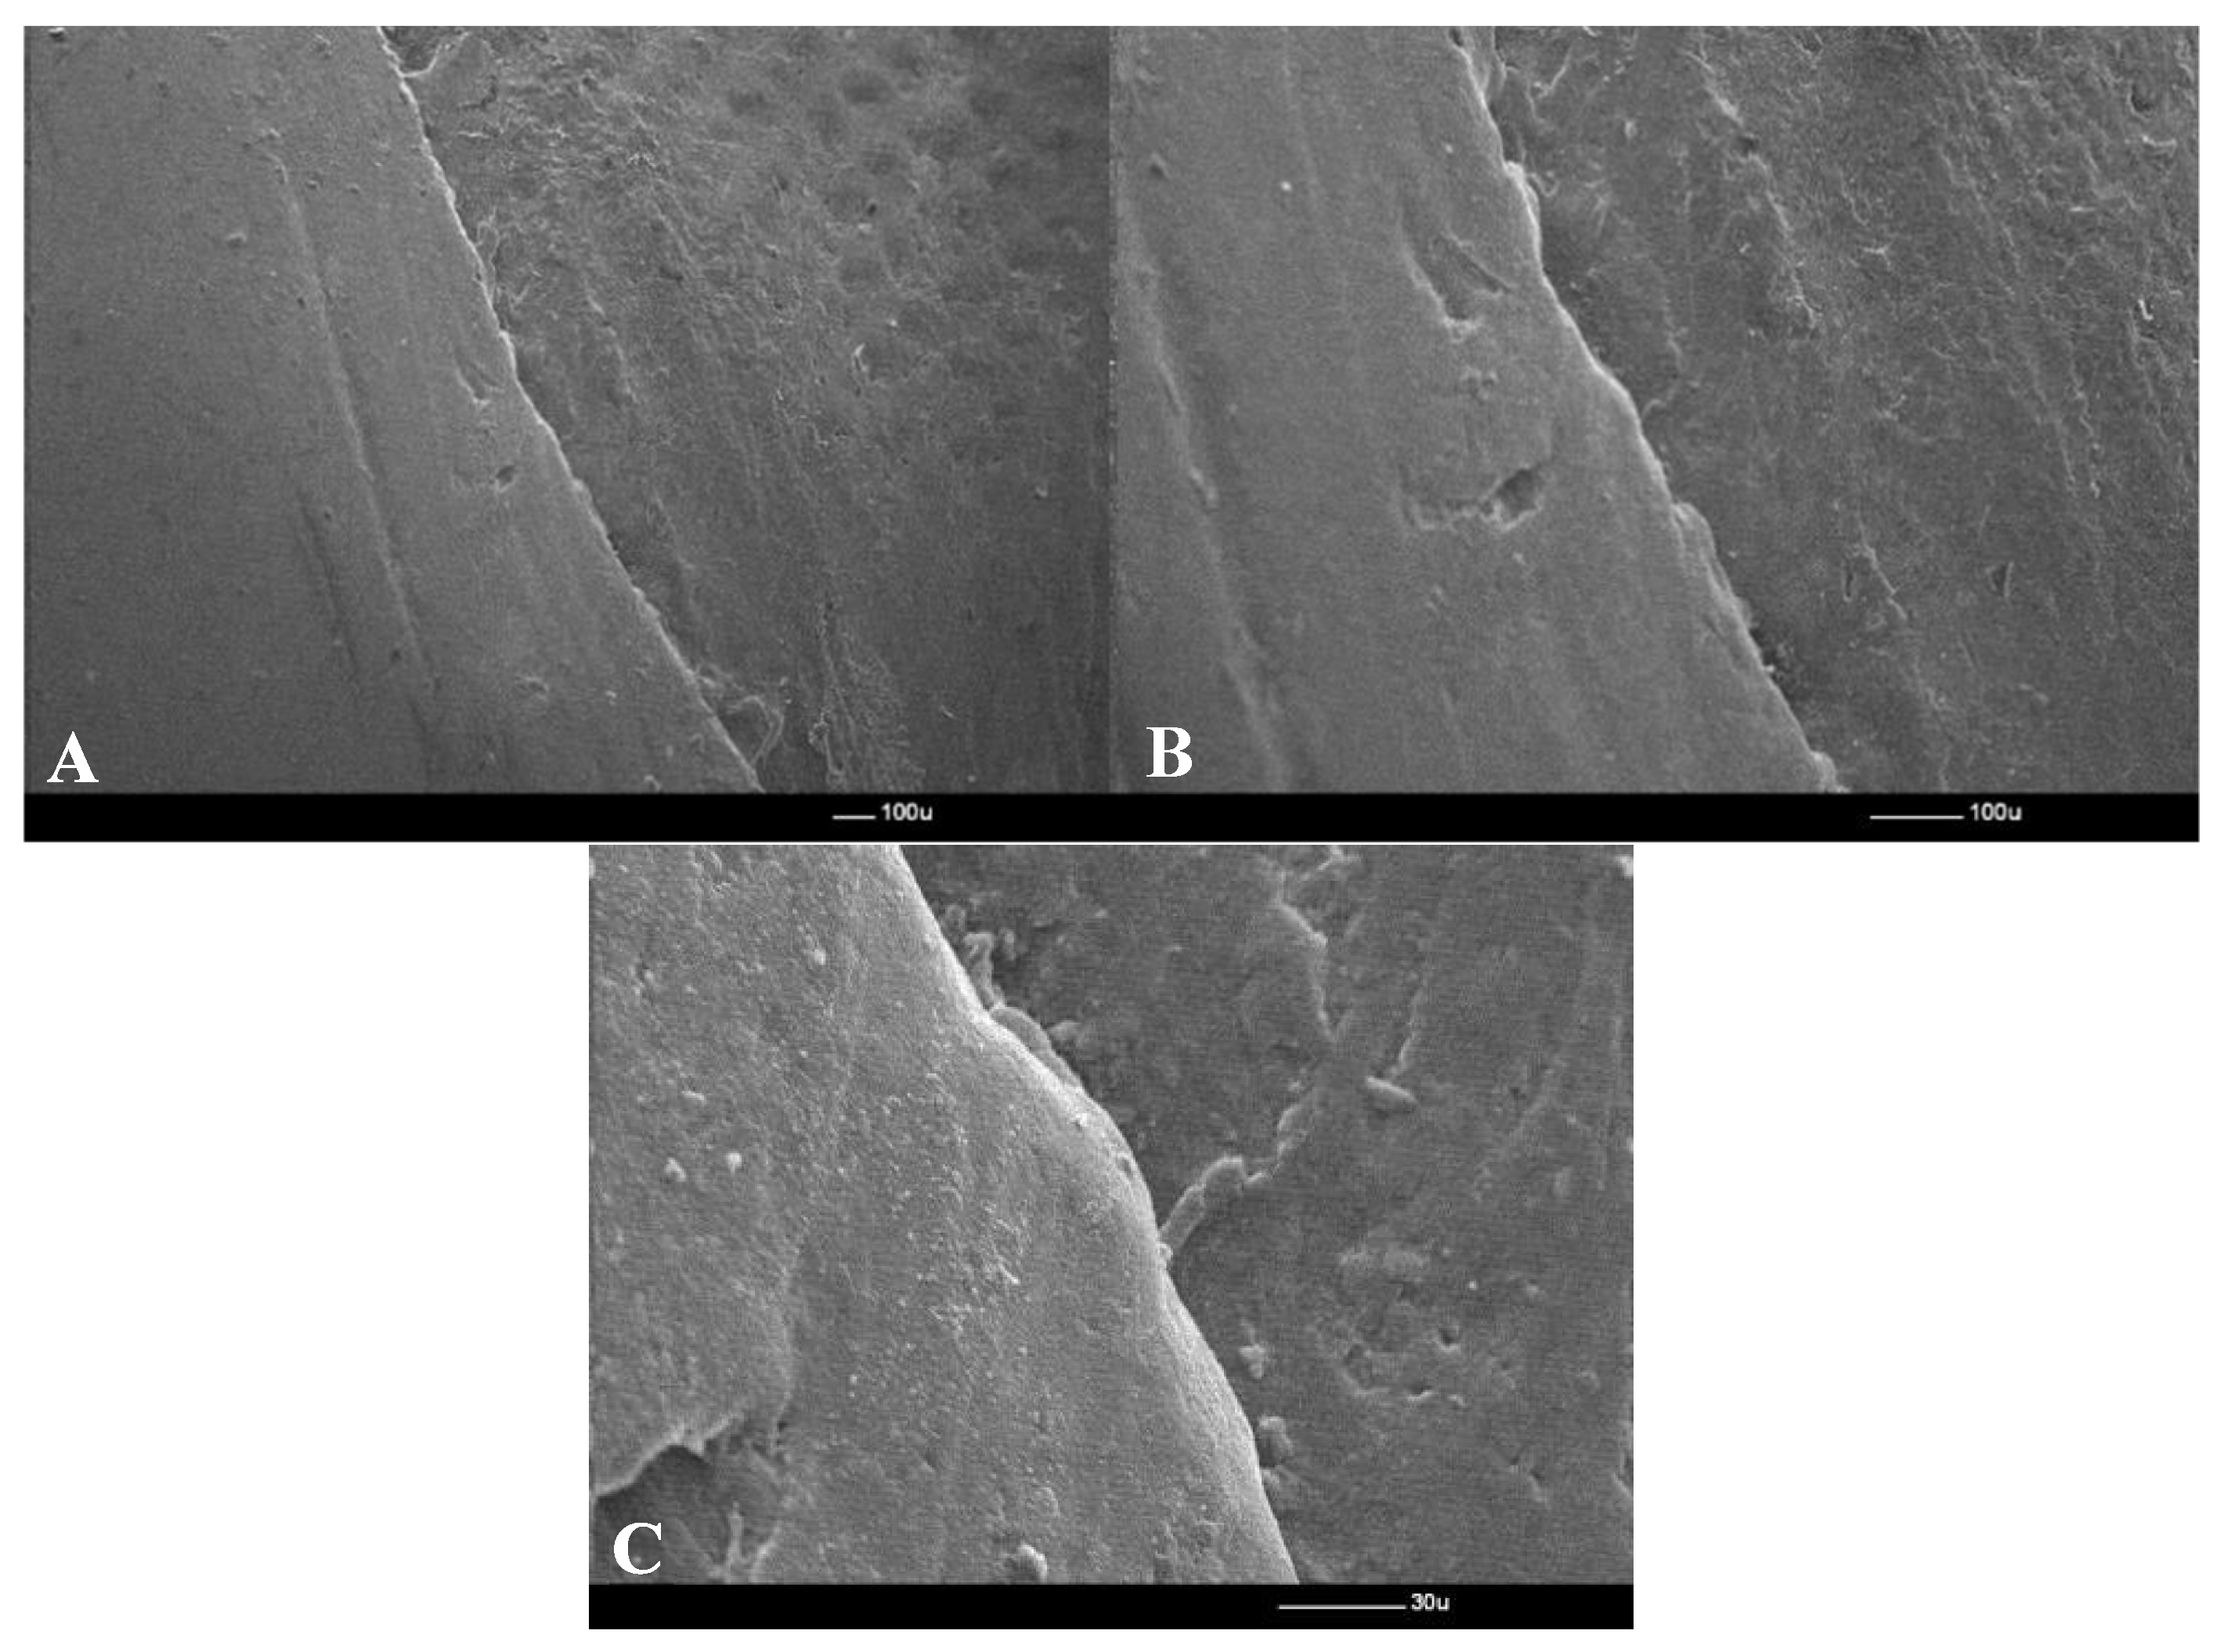
Representative SEM micrographs illustrating the marginal interface for the three materials are shown in
Figure 6,
Figure 7 and
Figure 8. These results suggest that both the restorative material and the amount of tooth reduction influence marginal adaptation.
Normality of the pooled SEM measurements was assessed using the Shapiro–Wilk test, and homogeneity of variances was verified using Levene’s test. All material groups demonstrated normally distributed data and comparable variance levels. The large pooled sample size (n = 362) supports the use of parametric testing under the Central Limit Theorem. Therefore, pairwise independent-sample t-tests were considered appropriate. Preparation depth was reported descriptively only and was not statistically tested due to insufficient subgroup replication (n = 2).
4. Discussion
This study evaluated the marginal adaptation of three CAD/CAM restorative materials—IPS Empress CAD, Cerasmart, and G-CAM—fabricated on standardized 3D-printed abutments with three preparation designs and cemented using material-specific adhesive protocols. Quantitative SEM analysis of the 9 crowns with interpretable margins showed marginal gaps well below the threshold of 120 μm, supporting their potential for clinical use in single-crown restorations [
14,
15,
16].
The present analysis was based on pooled SEM measurement points rather than per-crown averages, as this approach reflects the true variability along the crown–abutment interface. This statistical choice was supported by prior SEM-based studies and is justified by the large total number of measurements (n = 362), which provides adequate power and normal data distribution for parametric testing.
The superior marginal adaptation observed for Cerasmart is consistent with findings from previous studies reporting that resin-based hybrid ceramics allow for more accurate milling and reduced marginal discrepancies due to their improved milling performance and lower brittleness compared with conventional ceramics [
17,
18]. Similar trends have been described for other polymer-infiltrated ceramic networks, where the elastic modulus and machining behavior contribute to improved fit [
19]. In contrast, IPS Empress CAD exhibited higher marginal gap values, in line with reports that leucite-reinforced glass ceramics are more susceptible to chipping at the margin during milling, which may compromise adaptation [
20,
21]. G-CAM demonstrated intermediate values, reflecting its composite matrix reinforced with graphene, a material recently reported to provide good dimensional stability and favorable handling during milling, but with less extensive clinical validation [
22].
From a clinical perspective, the large effect size observed between IPS Empress CAD and the two composite-based materials (
Table 3) suggests that microstructural flexibility may play a relevant role in marginal adaptation. Resin nano-ceramics, such as Cerasmart and G-CAM, contain a polymer-infiltrated network that allows elastic accommodation of minor discrepancies during seating, whereas glass-ceramics such as IPS Empress CAD are more brittle and less capable of compensating for internal misfit. This explains the narrower distribution and lower mean gaps observed for Cerasmart and G-CAM. Although all materials remained within the accepted clinical threshold (<120 µm), the magnitude of the difference indicates a potential advantage of resin nano-ceramics in situations where preparation geometry or insertion axis is less than ideal.
The strong differences in pooled means were also reflected by large effect sizes (Cohen’s d > 1.5) when comparing IPS Empress CAD to either composite-based material, confirming that these differences are not only statistically significant but also practically meaningful. However, the small-to-moderate effect between Cerasmart and G-CAM (d ≈ 0.2–0.3) indicates a close performance range between the two hybrid materials.
The superior marginal behavior of the composite-based materials may also be explained by their lower elastic modulus. Resin nano-ceramics such as Cerasmart (≈12–14 GPa) and G-CAM (≈14–16 GPa) possess a polymer-infiltrated microstructure capable of slight elastic accommodation during crown seating. In contrast, IPS Empress CAD is a leucite-reinforced glass-ceramic with an elastic modulus in the range of 60–65 GPa, resulting in greater stiffness and less tolerance to minor internal discrepancies. This microstructural difference provides a mechanistic explanation for the lower marginal gaps recorded in the composite-based materials.
4.1. Effect of Preparation Design
Across all materials, larger preparation dimensions tended to result in smaller marginal gaps, although this trend was descriptive only and not statistically tested due to subgroup sample size. This is consistent with earlier work showing that adequate occlusal and cervical reduction facilitates milling accuracy and improves crown seating [
23]. Conservative preparations may limit the milling tool’s ability to reproduce fine internal geometry, increasing friction during cementation and preventing complete seating [
18].
These findings further illustrate the interaction between preparation geometry and material machinability. Hybrid composites appear more tolerant to minimal reduction designs, whereas glass ceramics require more generous clearance to achieve proper seating without marginal chipping. This interaction aligns with earlier observations that geometric constraints can amplify intrinsic material differences in milling accuracy.
4.2. Clinical Implications
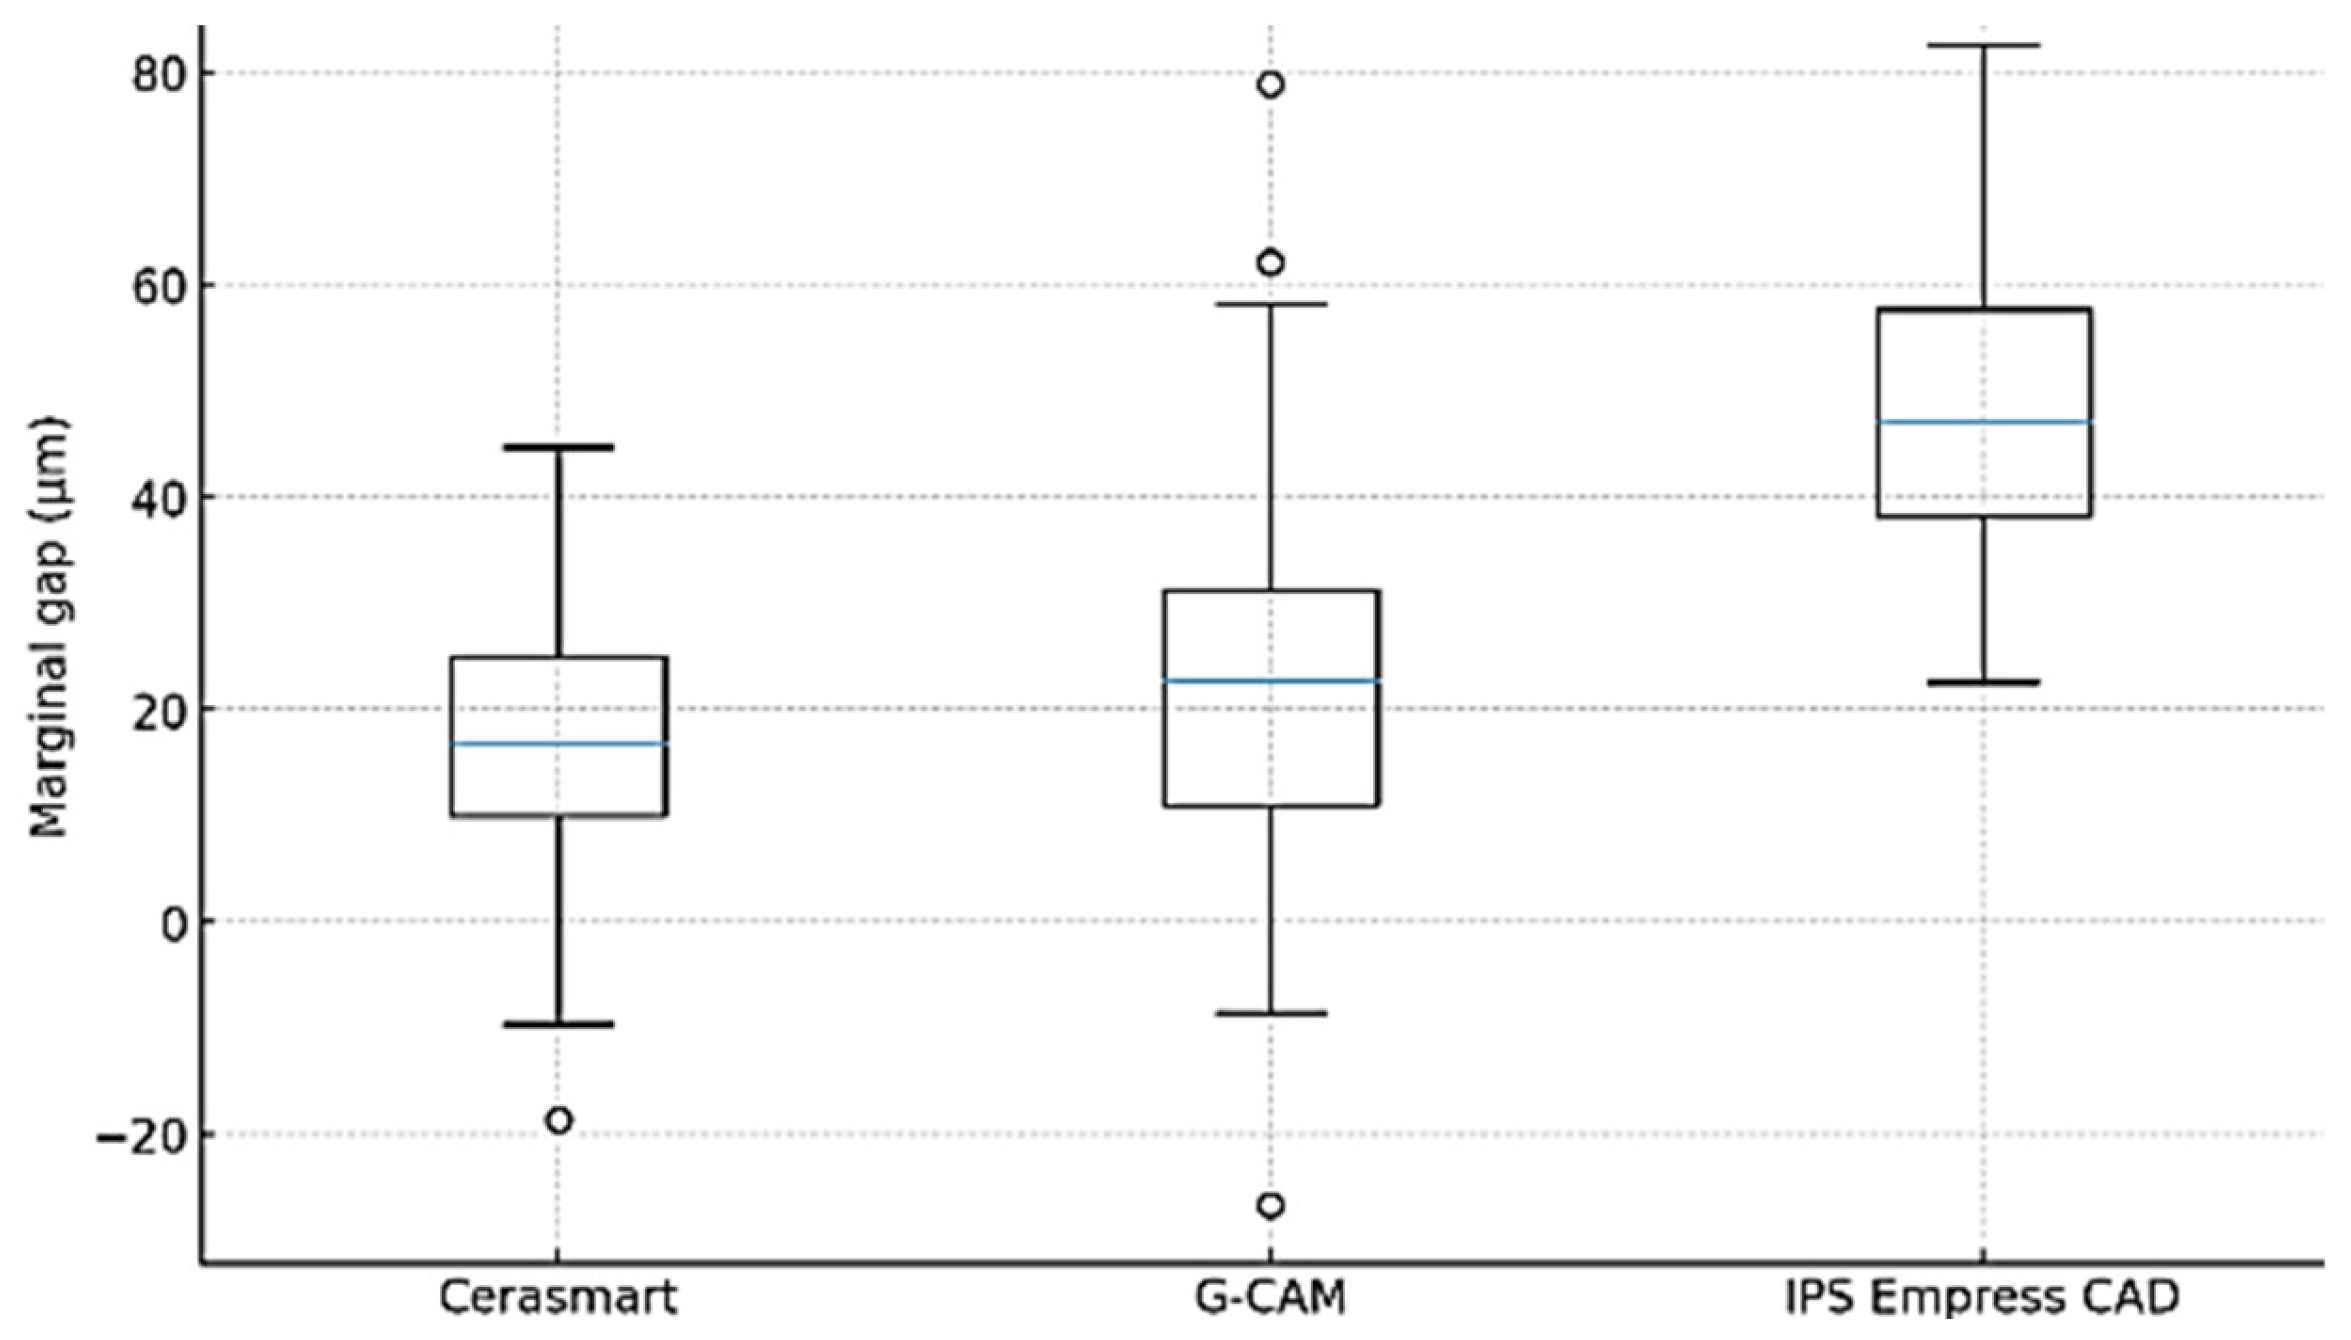
Pooled means for all three materials were below 70 µm, with the dispersion and distribution of values illustrated in
Figure 9 and
Figure 10. Such adaptation is expected to reduce microleakage, cement dissolution and bacterial ingress, thereby improving the longevity of the restoration [
19,
20]. The data also highlight the importance of preparation geometry in optimizing adaptation, particularly for brittle ceramics that are more sensitive to milling inaccuracies [
21,
22].
The consistent finding that resin-based hybrid and graphene-reinforced composites produced narrower marginal gaps supports the concept that these materials’ viscoelastic matrices contribute to better adaptation during seating. Their capacity for minor elastic deformation under load may explain why small discrepancies at the internal interface did not translate into measurable marginal gaps.
The results of our study showed statistically lower marginal gap values for Cerasmart compared to IPS Empress CAD and G-CAM. This supports previous reports that resin-based hybrid ceramics offer improved and reduced chipping during milling, contributing to a more accurate fit [
17,
19]. IPS Empress CAD, although still within the clinical threshold, showed larger gap values, probably due to its brittle microstructure and susceptibility to marginal chipping. G-CAM, a graphene-reinforced composite, showed intermediate results consistent with preliminary studies highlighting its dimensional stability and polymer-based resilience [
20].
Across all materials, the largest occlusal and cervical reductions (subgroup 1) produced the smallest marginal gaps, whereas minimal reductions (subgroup 3) resulted in wider gaps. This observation corroborates the findings of Papadiochou and Pissiotis [
21], who emphasized that conservative preparations may limit tool access during milling, resulting in incomplete seating during cementation. Adequate reduction provides better clearance for the bur, which facilitates accurate reproduction of the CAD design.
All recorded marginal gaps in this study were well below the often-cited threshold of 100–120 μm [
14,
15]. This indicates that, regardless of material or preparation size, the CAD/CAM workflow and cementation protocols used here are capable of producing restorations with acceptable adaptation. Clinically, such precision may reduce microleakage, delay cement dissolution, and improve restoration longevity [
16,
18].
Our investigation has several notable strengths. First, the use of standardized 3D-printed abutments ensured high reproducibility of the preparation designs, eliminating the variability inherent in natural tooth morphology. Second, the digital workflow-including intraoral scanning, CAD design, and precision milling-reflected contemporary clinical practice, thereby enhancing the relevance of the results. Third, the inclusion of three different CAD/CAM materials with different microstructural compositions (glass ceramic, resin-based hybrid ceramic, and graphene-reinforced composite) allowed for meaningful inter-material comparisons. In addition, the SEM evaluation protocol provided high-resolution, quantitative assessment of marginal gaps at multiple magnifications, offering greater measurement accuracy than optical microscopy. Finally, the use of material-specific cementation protocols followed manufacturers’ recommendations, reflecting realistic clinical conditions and improving the external validity of the results.
Overall, these results reinforce that both material composition and preparation geometry play complementary roles in determining marginal integrity. Statistical significance alone does not capture the full clinical picture; therefore, interpretation in the context of adhesive cementation thresholds (<70 µm for modern workflows) provides a more realistic assessment of clinical relevance.
Clinical threshold and meaningfulness of the differences. Although the classical acceptability threshold for marginal gaps is 100–120 µm, contemporary adhesive workflows often target values below ~70 µm. In our dataset, all three materials achieved pooled means within this stricter target (Cerasmart 18.53 µm, G-CAM 21.60 µm, IPS Empress CAD 47.09 µm). The large effect sizes versus IPS Empress CAD indicate a material-related tendency, but the absolute differences remain within ranges considered clinically acceptable for adhesive cementation. Conversely, the 3.07 µm difference between Cerasmart and G-CAM (small–to-moderate effect) is unlikely to be clinically meaningful relative to common sources of variability (finish-line quality, internal relief, seating dynamics). Practically, preparation accuracy and seating protocol are likely to outweigh the small inter-material differences once the <70 µm target is met.
4.3. Limitations and Future Research
A key limitation of this in vitro design is the absence of thermomechanical or aging simulation, meaning that the findings represent initial seating adaptation rather than long-term clinical stability [
18]. In addition, the number of crowns that contributed quantitative SEM values was limited by the requirement for clearly interpretable margins, reducing the effective sample size at the specimen level and restricting generalizability [
19]. The dataset also follows a nested structure (multiple measurements originating from the same crown), which reduces independence between datapoints; however, this approach is consistent with established SEM marginal fit protocols, where the measurement site—rather than the specimen—is considered the analytical unit [
12,
13]. Future studies should incorporate mechanical fatigue and thermocycling, assess aging-induced changes in adaptation, and combine marginal and internal fit evaluations to better correlate initial seating behavior with long-term functional performance [
20,
23].
5. Conclusions
Within the limitations of this in vitro study, all three CAD/CAM restorative materials—IPS Empress CAD, Cerasmart, and G-CAM—demonstrated marginal adaptation values well below the clinically acceptable threshold of 100–120 μm. Cerasmart exhibited the smallest mean marginal gaps, followed by G-CAM and IPS Empress CAD. Larger preparation dimensions yielded better marginal adaptation across all materials, highlighting the influence of preparation design on restoration fit.
The standardized use of 3D-printed abutments, SEM evaluation, and material-specific cementation protocols enhanced the reliability of the results. These findings suggest that all tested materials are suitable for single-crown restorations from a marginal fit perspective, with resin-based hybrid ceramics showing a potential advantage. Future research should investigate the long-term stability of marginal adaptation under functional loading and aging conditions, as well as integrate mechanical performance testing to provide a more comprehensive assessment of clinical performance.

