Article

Comparison of Vertical Measurements Between Panoramic Radiograph Images and Corresponding Cone-Beam Computed Tomography Scans

by
Ali-Reza Ketabi
1,2,*,
Stefan Hassfeld
3,
Laurentia Schuster
4,
Sandra Ketabi
2,
Julius Stueben
1 and
Andree Piwowarczyk
1
1
Department of Prosthodontics, School of Dentistry, Faculty of Health, Witten/Herdecke University, Alfred-Herrhausen-Straße 45, 58455 Witten, Germany
2
Private Dental Office of Dr. Ali-Reza Ketabi, Kirchheimerstr. 71, 70619 Stuttgart, Germany
3
Department of Oral and Maxillofacial Surgery and Dortmund Hospital and Faculty of Health, Witten/Herdecke University, Muensterstr. 240, 44145 Dortmund, Germany
4
Department of Periodontology and Operative Dentistry, University of Münster, Waldeyerstraße 30, 48149 Münster, Germany
*
Author to whom correspondence should be addressed.
Prosthesis 2025, 7(6), 131; https://doi.org/10.3390/prosthesis7060131
Submission received: 18 August 2025 / Revised: 15 October 2025 / Accepted: 17 October 2025 / Published: 22 October 2025
(This article belongs to the Section Prosthodontics)

Abstract

Background: This study analysed whether vertical measurements in the maxillary posterior region are more accurate using panoramic radiography (PAN) or cone-beam computed tomography (CBCT). Methods: Corresponding maxillary posterior regions on both PAN and CBCT images were selected and examined for vertical measurements. The vertical distance between the bone crest and the floor of the maxillary sinus was measured. Measurements in edentulous regions were performed using a similar procedure. Additionally, the vertical height of any defect, if present, was measured. Results were evaluated statistically. Results: When comparing corresponding regions on the CBCT and PAN images, 204 patients with a total of 341 measurements (n = 341) met the inclusion criteria. The mean values for all measurements were 7.21 ± 3.74 mm on PAN and 7.62 ± 4.06 mm on CBCT. The mean difference between all paired measurements was −0.41 ± 1.03 mm. Significant differences between PAN and CBCT were observed (p < 0.001). Defects were detected in 58 (17%) of the 341 measurements. The mean defect height was 1.85 ± 1.05 mm on PAN and 1.99 ± 1.00 mm on CBCT. No significant differences were noted between PAN and CBCT (p = 0.052). Conclusions: Although the relationship between vertical height measurements on PAN and CBCT showed a significant difference of −0.41 ± 1.03 mm for all paired measurements, the difference was very small upon closer inspection. Both PAN and CBCT are suitable methods for measuring vertical heights in the posterior maxilla.

1. Introduction

After tooth extraction, horizontal and vertical bone defects can alter the original shape of the alveolar ridge. Compromised hard tissue leads to soft tissue resorption, negatively impacting both aesthetic and biocompatibility outcomes [1]. Figure 1 illustrates a case of vertical bone defects before and after implant prosthetic restoration (Figure 1). Another issue is limited hygiene due to the step formation caused by the vertical bone defect.
Low alveolar ridge height and alveolar ridge defects are the most important limiting factors complicating posterior maxillary reconstruction [2]. Sinus lift surgery is often recommended for implant-supported reconstruction. It is considered an effective and predictable augmentation technique for the posterior maxilla, providing clinicians with sufficient bone volume for implant placement [3,4,5]. However, the method also entails surgical risks, such as perforations of the Schneiderian membrane or bleeding caused by injury to blood vessels [6].
Although the method is predictable with high success rates, various complications have been documented during surgery or the postoperative period [7]. One such complication is blood vessel trauma, which may lead to severe haemorrhaging [8]. Accidental bleeding following surgical damage to the alveolar antral artery (AAA) is one of the two most frequent complications of sinus lifting (SL), along with perforation of the sinus membrane [9].
On the other hand, recent studies have shown that even short implants can be a good alternative for long-term successful rehabilitation after tooth loss [7,8]. The use of short implants offers several advantages for both patients and clinicians, including reduced morbidity, lower costs, and a relatively short treatment time [8,9].
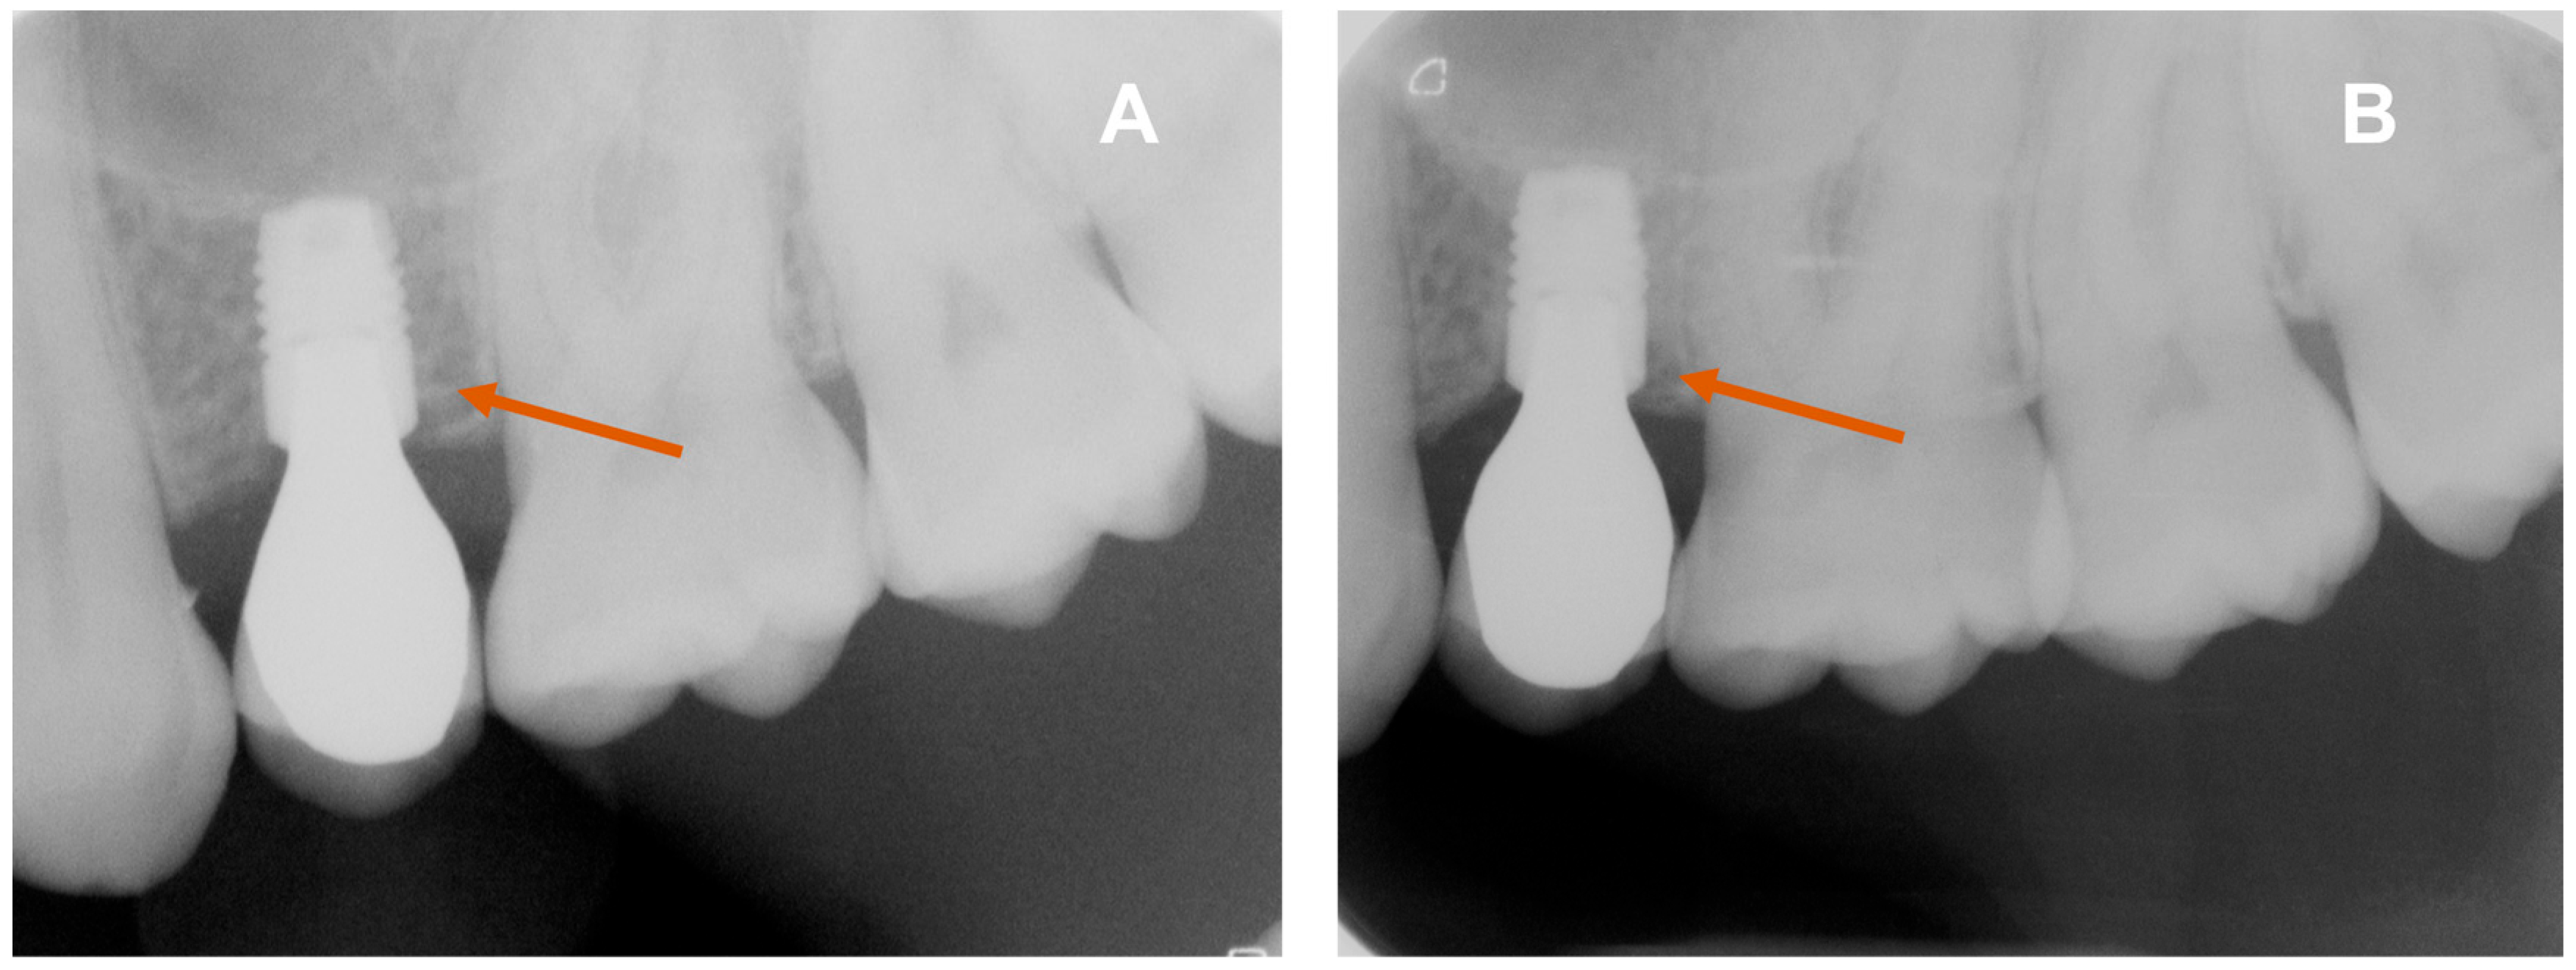
Figure 2 shows X-ray images of short implants in region 26 after prosthetic insertion (A) and 3 years after prosthetic restoration (B). The short implant in region 26 eliminated the need for augmentation (Figure 2).
Fundamentally, implant position is a key factor for subsequent prosthetic construction because it influences the design of the emergence profile [10].
Vertical implant position is also important, since sufficient space is an important prerequisite for optimal transmucosal design, good gingival architecture, and clinical crown shape [11].
Sufficient height must be planned to allow for the development of healthy soft tissue, with an appropriate mucosal thickness of 3–4 mm and a keratinised gingiva of 2 mm [12,13].
The literature recommends performing a thorough radiological examination of the maxilla before surgical interventions to prevent possible complications [14,15].
Both panoramic radiography (PAN) and/or cone-beam computed tomography (CBCT) are commonly used and advantageous tools for successful diagnosis in oral and maxillofacial surgery and general preoperative planning [16,17,18]. Many studies have identified the comparative superiority of CBCT over PAN in detecting anatomical structures and planning dental implant insertions in the maxilla [19,20,21].
Although accurate vertical measurements play an important role in the decision-making process for implant surgery of the maxillary posterior region, the comparability of PAN and CBCT images has not been adequately investigated. This study could be helpful in decision-making in everyday practice.
The present study investigated whether the vertical distance (VD) measurement between the bone crest of the first molar and the maxillary floor is comparable using corresponding panoramic radiographs (PANs) or cone-beam computed tomography (CBCT).
Measurements were also performed on patients who were either completely edentulous or only edentulous in the defined area.
If vertical defects were visible in the defined area, the defect height (DH) was measured on both PAN and CBCT images in addition to the previously described measurements.
The study hypothesised that there is no difference in the measurement of both VD and DH on CBCT and corresponding PAN images.

2. Materials and Methods

The examination was registered with the Committee of the Baden–Württemberg Medical Association (F-2014-006-z) and conducted in accordance with the ethical standards of the 1964 Declaration of Helsinki [22]. Details regarding the selection of panoramic and cone-beam computed tomography images, standardised measurement procedure, room conditions, software and monitor used, and examiner qualifications are detailed in the Material and Method section of Ketabi et al. [21].
For inclusion in the present study, 549 patients were initially selected from the database of a dental practice in Stuttgart, Germany, after undergoing PAN and CBCT between February 2010 and January 2017. Both PAN and CBCT images were already available before the commencement of the study.
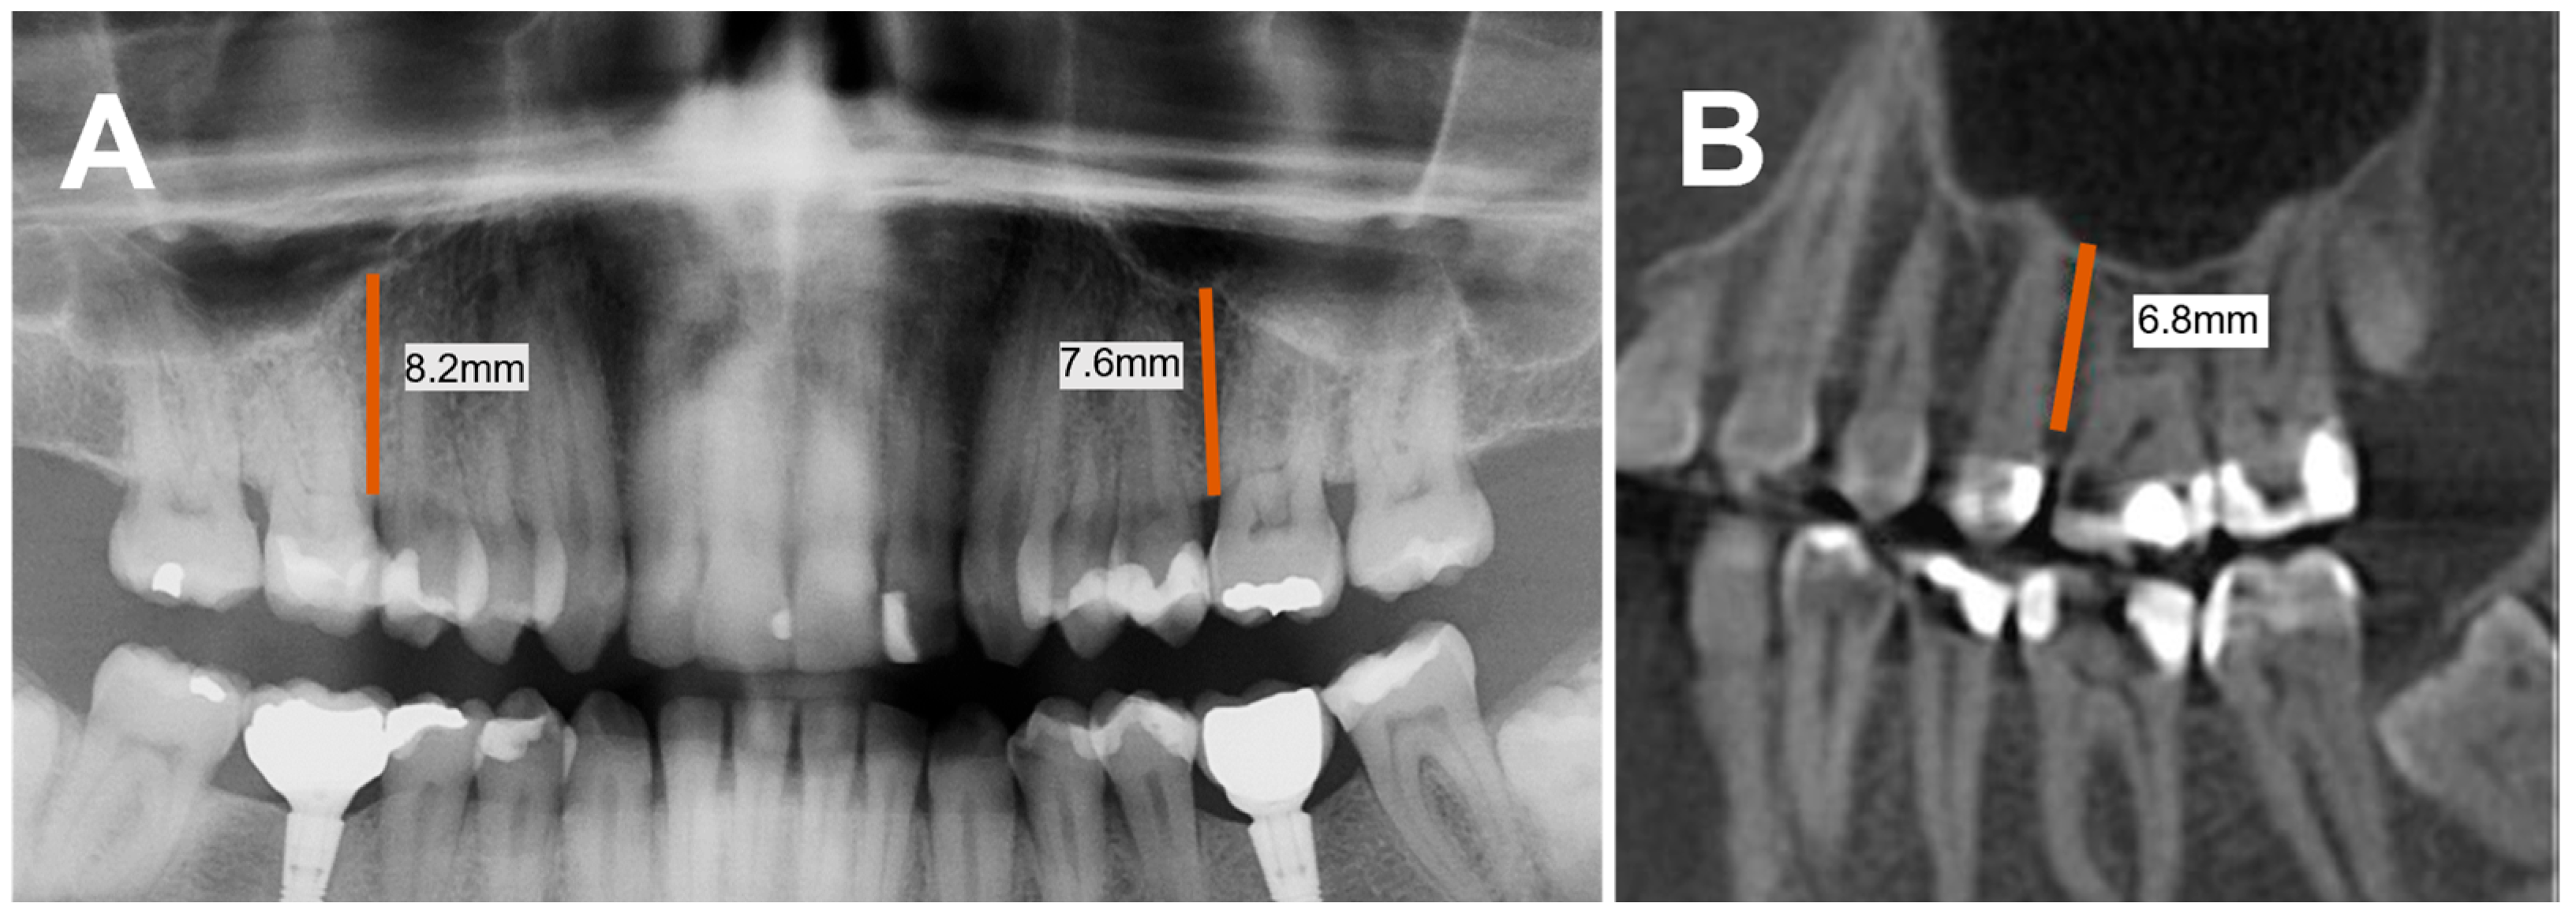
For study purposes, both PAN and CBCT images (Figure 3) displaying at least one corresponding half of the upper jaw were used. The device-specific magnification factor was determined immediately after installation of the X-ray equipment using comparison images of reference objects with known dimensions, such as calibration spheres and titanium cylinders. Based on these reference measurements, a factor of 1.25 was calculated, which was used in this study to correct the panoramic radiographic images. Annual and regular maintenance and calibration checks were performed to ensure the quality of the measurements. At the time of the study, X-ray images of 549 patients were available from the patient records of the dental practice in Stuttgart. Sixty-four of these images had been taken externally. In over 70% of these images, calibration objects of known size (e.g., titanium cylinders, calibration spheres) were used. Therefore, these images were also used in the study.
This approach also allowed for the inclusion of PAN images where no measuring body was available.
First, the vertical distance between the mesial bone crest of the first molar (M1) and the floor of the maxillary sinus was measured (Figure 3). If a measurement in region M1 was not possible, the measurement was performed at another suitable region in the posterior maxilla (M2).
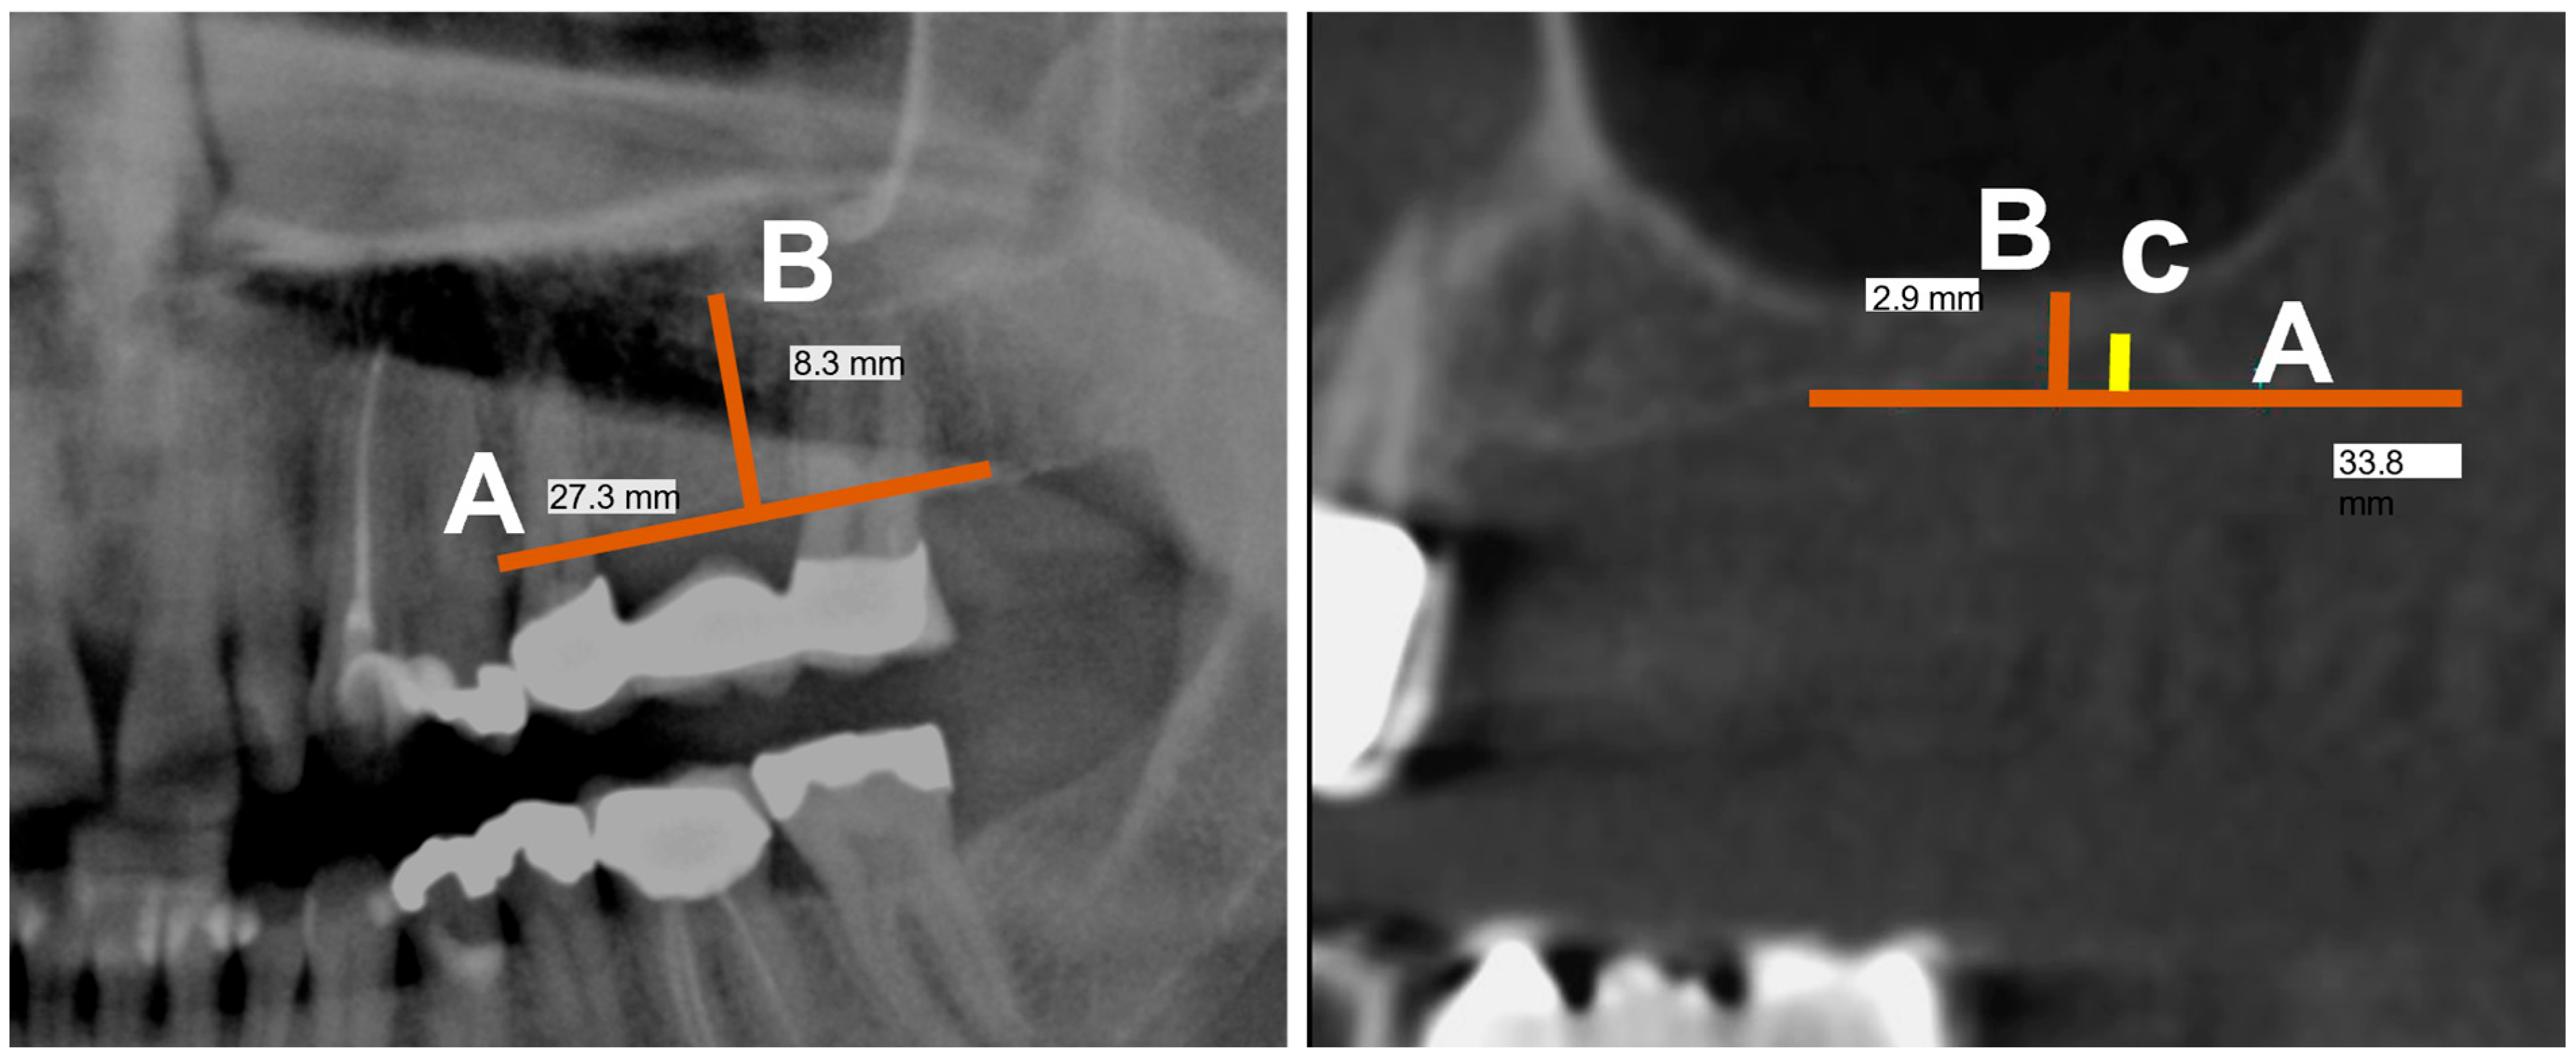
The following procedure was chosen for patients who were either completely edentulous or edentulous only in the defined area and had no vertical bony defects. In these cases, an auxiliary line was formed that was spanned by two reproducible points on the alveolar ridge. The measuring distance was determined using a geometrically constructed vertical distance, defined as the perpendicular distance between the auxiliary line and the sinus floor (Figure 4, left). This method improves both reproducibility and error susceptibility.
In the case of vertical defects in the defined area, the procedure was similar. Here, in addition to the previously described measuring section, the defect height that can occur after tooth extraction was measured as a geometrically constructed vertical distance between the auxiliary line and the defect roof (Figure 4, right).
The inclusion criteria for measurements were as follows:
-
Images taken between February 2010 and January 2017;
-
Images with correct patient positioning;
-
Clear reference points were visible and well reproducible in both images.
Participants were excluded if, in the measurement area on one or both image modalities, the following conditions were met:
-
Apical lesions, extractions, augmentations or implantations were detected;
-
No matching dental status in PAN/CBCT was available;
-
Deviation of alveolar bone morphology or the maxillary sinus floor was detected;
-
Periodontal defects were visible;
-
Artefacts (e.g., metal restorations of the crestal alveolar process) were present.
The first step was to establish a diagnosis based on the PAN images, followed by a diagnostic analysis of the corresponding regions on CBCT images. This procedure ensured that the PAN imaging measurements did not influence the CBCT measurements. Examinations were performed by an examiner who had acquired the necessary qualifications and competency from an expert in the field of dental radiography before study commencement. To verify the reliability of the radiological measurements, multiple measurements were performed on images from 25 randomly selected patients (25 CBCTs and 25 PANs). Inter-rater reliability was determined by comparing the results between the examiner and the expert, and intra-rater reliability was calculated by examining all images a second time by the same examiner after 2 weeks.
The collected data were entered into study-specific software and statistically evaluated by MediStat GmbH (SPSS Statistics 25, IBM Corporation, Armonk, NY, USA).
The results for explorative and descriptive characteristics are expressed as absolute values.
A paired samples test was conducted to assess intra-rater reliability by comparing measurements taken at time 1 with measurements taken at time 2. To test the hypothesis, a two-sided paired samples test was conducted to assess the relationship between PAN and CBCT measurements in both directions. In addition, the paired sample effect sizes of the calculated p-values were quantified using Cohen’s d. The strength of the correlation between PAN and CBCT measurements was described using the Bravais–Pearson correlation coefficient. In cases where the measured values showed a large scatter and did not follow a normal distribution, the Wilcoxon test for paired differences was performed.
A p-value of ≤0.05 indicates the presence of a significant difference.

3. Results

A total of 204 patients met the inclusion criteria, comprising 111 females and 93 males. The average ages of female and male patients were 55.9 and 52.9 years, respectively. The inter-observer reliability and accuracy were 99.4%.
For the intra-rater reliability, vertical measurements were taken at two different time points and compared using a paired samples test. “T-PAN” describes the differences between the vertical distance measurements on the PAN (N = 37), and “T-CBCT” describes the differences between the CBCT measurements (N = 37). The mean paired differences for T-PAN and T-CBCT were −0.140 mm and 0.023 mm, respectively. No significant differences (p ≥ 0.05) were found between the two measurement times, with a two-sided p-value of p = 0.179 for T-PAN and p = 0.334 for T-CBCT.
A total of 341 (n = 341) corresponding measurements were obtained on PAN and CBCT, consisting of 175 in the right maxilla (n = 175) and 166 in the left maxilla (n = 166).
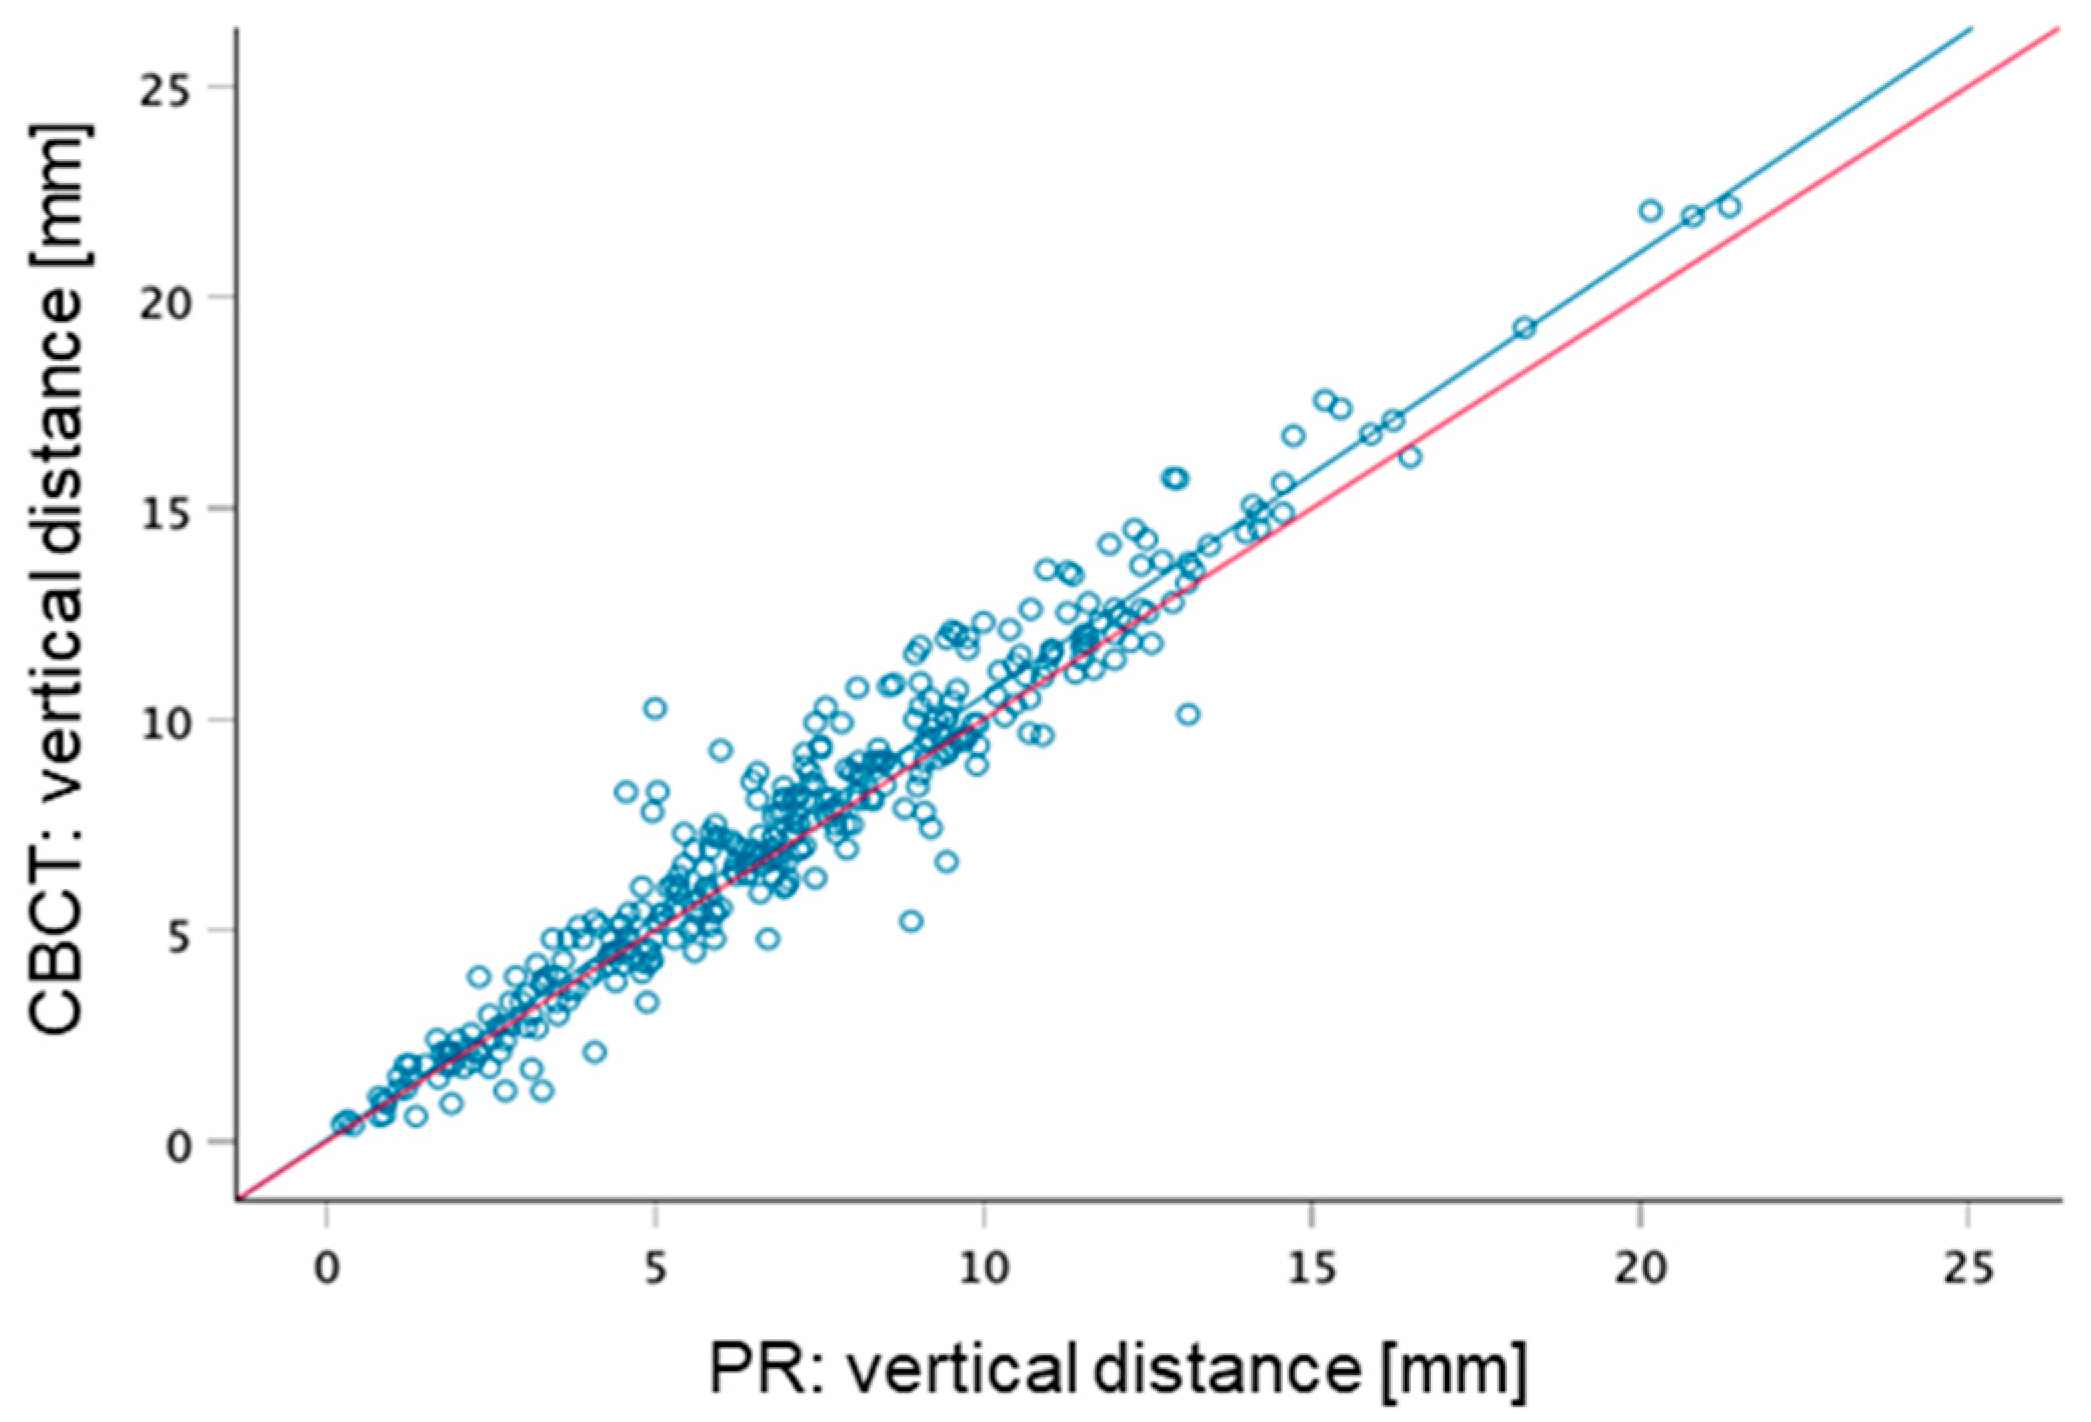
The results of the vertical measurements are illustrated in scatterplots in Figure 5. These plots show the relationship between the vertical distances measured in the panoramic radiograph (PAN) and the corresponding vertical distances in the CBCT scan. The line of agreement (in red) represents the ideal scenario of perfect agreement, where the values on both axes are identical (y = x). The regression line (in blue) graphically depicts the relationship between the two sets of measurements from the PAN and CBCT. As shown in the figure, the regression line for all data points lies above the line of agreement.
In the right maxilla, the mean value was 7.45 ± 3.77 mm on the PAN and 7.93 ± 4.16 mm on the CBCT. In the left maxilla, the mean value was 6.95 ± 3.71 mm on the PAN and 7.30 ± 3.94 mm on the CBCT. The mean value for all measurements was 7.21 ± 3.74 mm on the PAN and 7.62 ± 4.06 mm on the CBCT. The standard deviation, minimum, maximum, and percentiles are shown in Table 1.
To evaluate the relationship between PAN and CBCT measurements, a two-sided paired-samples t-test was performed. The average difference between the compared pairs of measurements, in which the CBCT measurement was subtracted from the PAN measurement in each case, was −0.48 ± 1.07 mm for the right maxilla and −0.35 ± 0.98 mm for the left maxilla. The average difference for all pairs of measurements was −0.41 ± 1.03 mm. Furthermore, the differences between PAN and CBCT were significant, with a p-value of <0.0001 for the right and left maxilla and total measurements (Table 2).
Because the p-value only indicates whether a statistically measurable effect exists, effect sizes or paired-sample effect sizes were also determined (Table 3). Effect size can be quantified using Cohen’s d, where a value of 0.2 indicates a small effect, 0.5 a medium effect, and 0.8 a large or strong effect. The average differences (point estimate) between PAN and CBCT were considered weak-to-moderate effects: right maxilla, d = 0.445; left maxilla, d = 0.355; and total measurements, d = 0.402.
The Bravais–Pearson correlation coefficient describes the strength of the correlation between measurements, where |R| ≤ 0.2 indicates no correlation, 0.2 < |R| ≤ 0.5 indicates a weak-to-moderate correlation, 0.5 < |R| ≤ 0.8 indicates a clear-to-strong correlation, and 0.8 < |R| ≤ 1.0 indicates a high or perfect correlation. The correlation between the vertical measurements on the CBCT and PAN was high to perfect (maxilla right, 0.968; maxilla left, 0.969; total, 0.969) and significant (p = 0.0001).

Vertical Measurements with Defects

Defects were detected in 58 of the 341 measurements (17%). Of these, 33 defects (58.6%) were located in the right maxilla, corresponding to 10% of the total measurements, and 25 were located in the left maxilla, which corresponds to 41.4% of the defects and a total share of 7%.
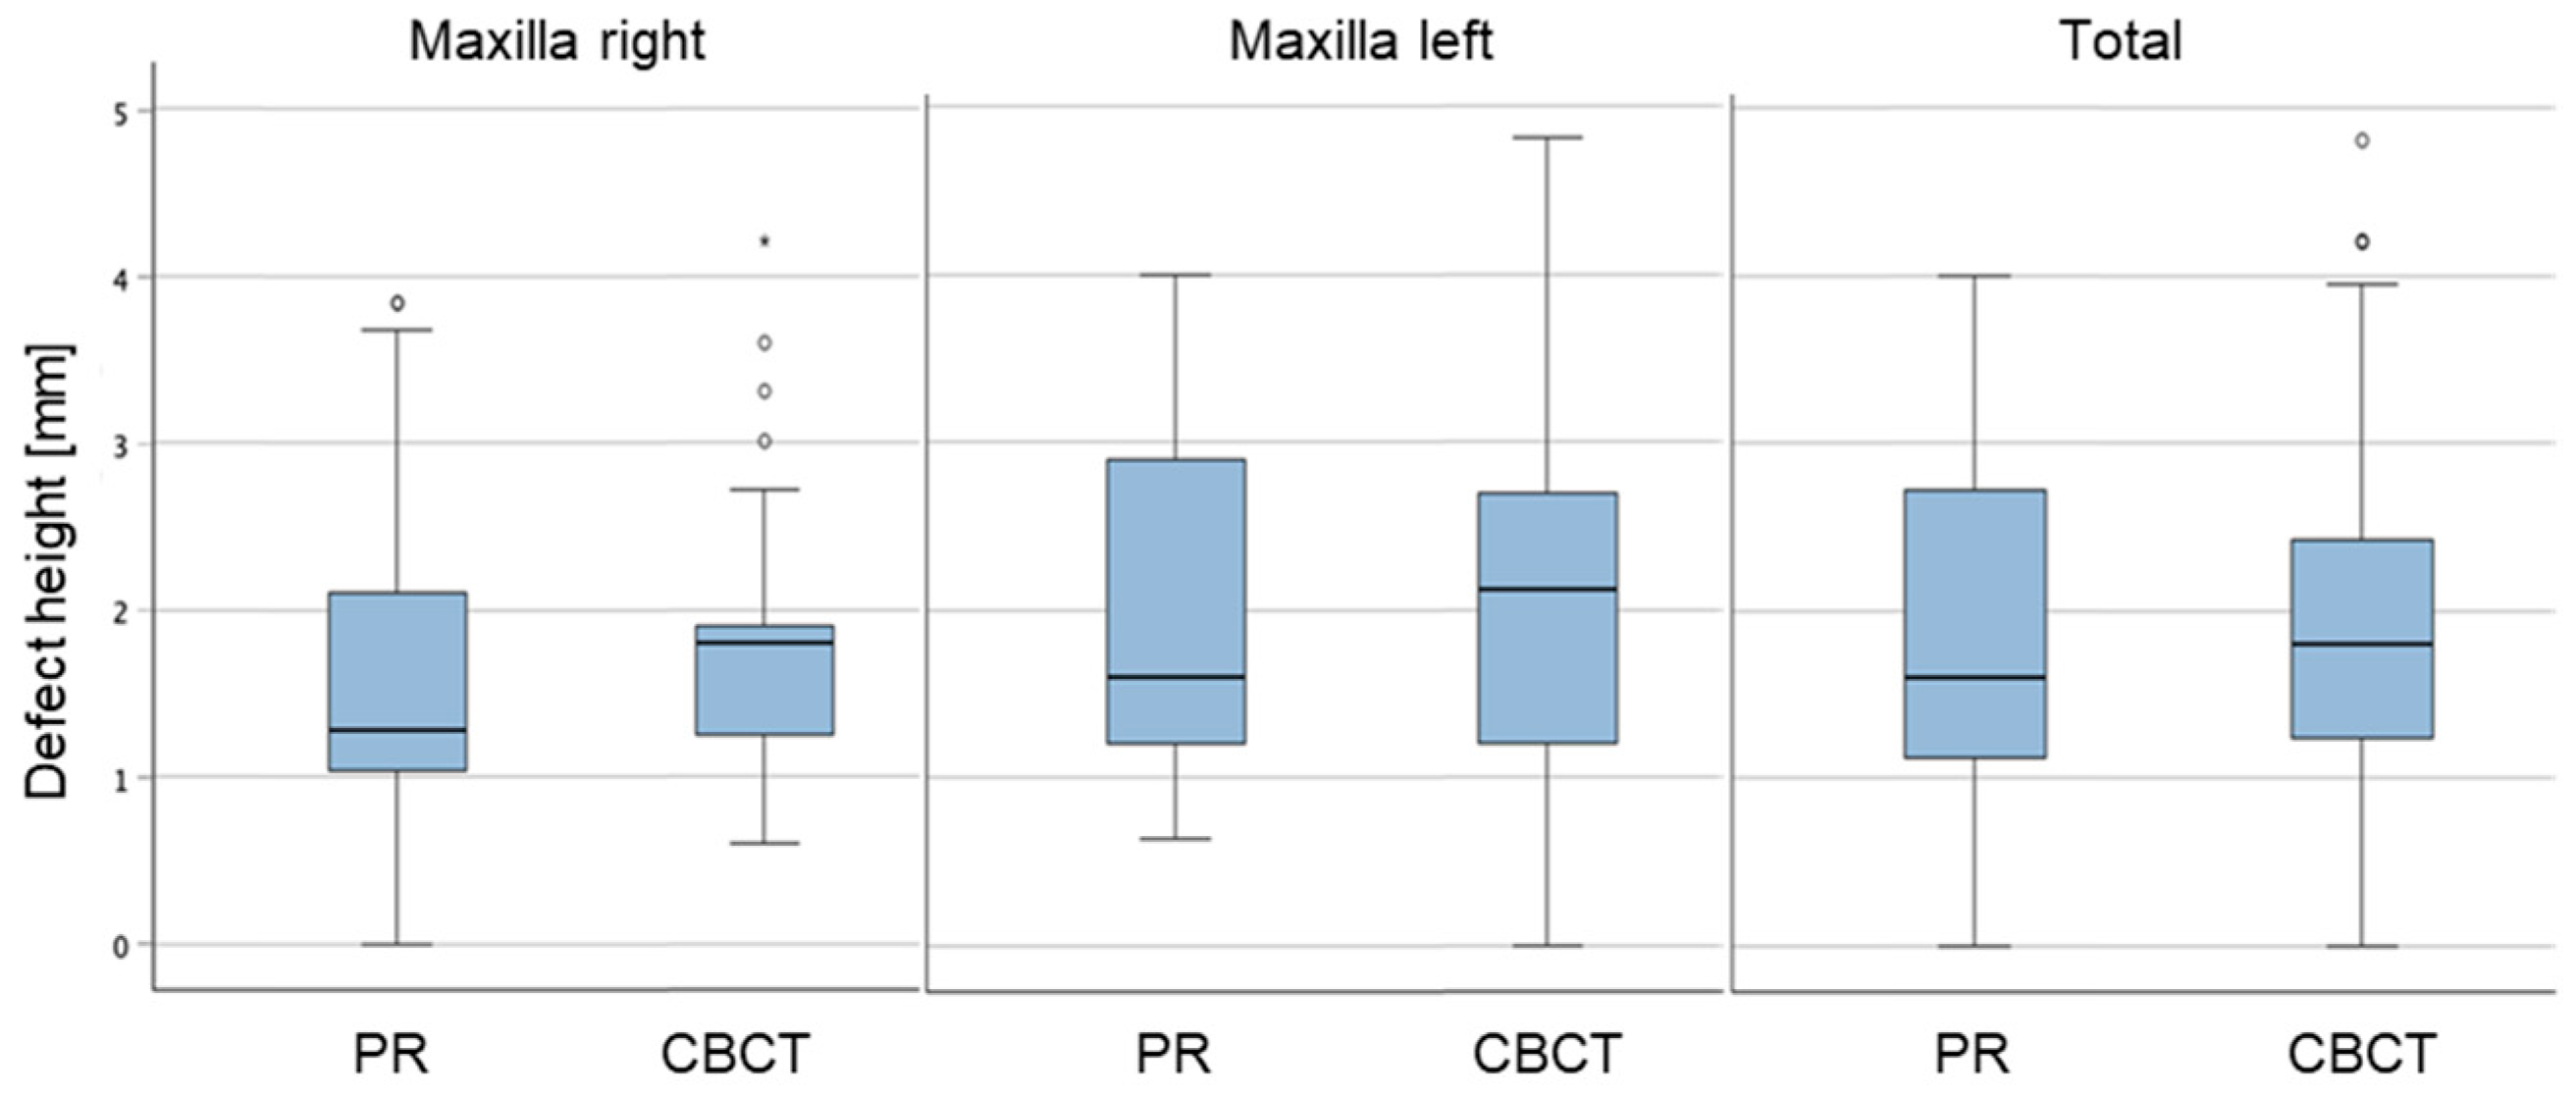
The average measured height of bone defects in the right maxilla was 1.73 ± 1.03 mm on PAN and 1.85 ± 0.82 mm on CBCT. In the left maxilla, the same average height was 1.99 ± 1.09 mm on PAN and 2.20 ± 1.19 mm on CBCT (Table 4). For all measurements, the average measured defect height was 1.85 ± 1.05 mm on PAN and 1.99 ± 1.00 mm on CBCT. The standard deviation, minimum, maximum, and percentiles, including the distribution of measurements in percentiles, are shown in Table 4. It can be seen that the CBCT measurement values were slightly higher than those obtained with PAN. In addition, the 25th percentile showed heights ranging between 1.04 and 1.20 mm on PAN, and between 1.20 and 1.25 mm on CBCT. In the 50th percentile, the values ranged between 1.28 and 1.60 mm on PAN, and between 1.80 and 2.12 mm on CBCT. In the 75th percentile, the depths were 2.41 to 2.93 mm for PAN and 2.00 to 2.85 mm for CBCT.
The boxplot diagram in Figure 6 makes it easier to see at first glance that the defect values for the left maxilla are slightly higher than those for the right and left maxilla. The significant spacing of the whiskers in the boxplot indicates a large scatter of the values, which in this case do not follow a normal distribution. For this reason, the Wilcoxon paired difference test was performed.
Because the distribution of the values was not normal, significance was calculated asymptotically. No significant differences were found between PAN and CBCT, with p = 0.228 for the right maxilla, p = 0.119 for the left maxilla and p = 0.052 for the total values.

4. Discussion

The aim of the present comparative study was to investigate whether the measurement of the vertical distance between the bone crest of the first molar and the maxillary floor is comparable using corresponding PAN or CBCT. Similarly, vertical distances were measured in edentulous jaw segments. Furthermore, vertical defect depths were measured in edentulous segments, if present.
None of the aspects investigated in this study has been sufficiently investigated in previous research using many relevant panoramic and CBCT images. Therefore, this study represents an innovative approach that may be valuable in decision-making for planning implant-supported prosthetic restorations.
Long-term successful implant restoration requires prosthetically oriented three-dimensional planning [23,24]. Both PAN and CBCT are available for diagnosis and planning before dental procedures [16,17]. Due to the size and distribution of anatomical structures, not every area of interest can be clearly visualised on PAN images and can therefore be negatively influenced by various structures [25].
The literature reports the superiority of CBCT over PAN for detecting anatomical structures in the maxilla [19,20,21]. Furthermore, CBCT images appear to enable an examiner-independent assessment of anatomical structures, as they leave little room for interpretation of the findings [26]. Therefore, some authors suggest a thorough three-dimensional radiographic examination of the sinus prior to surgery [20,21,27]. This seems to be particularly important when extensive augmentations are necessary before implantation in the maxillary sinus area. Complications can occur in connection with sinus lift augmentations [6,14,15,28,29], and these procedures are subject to an increased complication rate in the presence of septa [30].
Limited studies exist on vertical discrepancies between CBCT and PAN [26,28]. In their study, Wolff et al. [28] stated that although CBCT images provided more relevant information, they did not influence the treatment plan, which was based on an existing panoramic image. These results support the findings of our study. The interpretation of findings from PAN images appears to depend on examiner experience. Özalp et al. [31] investigated the accuracy of vertical measurements between panoramic radiographs (PAN) and cone-beam computed tomography (CBCT) in a study with a similar design to the one presented here, using a magnification factor of 1.2. In contrast to the results of Özalp’s study, in which the PAN measurements were, on average, larger than those of the CBCT (0.36–0.8 mm larger), our results show that PAN values were smaller (0.35–0.48 mm) than CBCT values. Given the differences in equipment and magnification factors, as well as the high correlation between the two measurement methods in both studies, it is plausible that the magnification factor plays a significant role in the observed differences in results.
In their retrospective study, Anitua et al. [7] evaluated the success rate of extra-short implants (≤6.5 mm length) in 15 screw-retained complete dentures in the maxilla and the mandible. No failures were observed for either the extra-short implants or the dentures during the follow-up period of 27.2 ± 15.4 months. Therefore, the authors recommend the use of extra-short implants as an equivalent option to long-implant restorations.
In their narrative review, Thoma et al. [8] compared short and longer implants in augmented bone with a follow-up period of up to 18 months after loading with definitive reconstructions. Based on the studies included in the review, a mean implant survival rate of 99.0% for short and 99.5% for long implants in the augmented sinus was reported, with similar survival rates for the superstructure. However, the rate of surgical complications is notable: 33% for short implants compared with 100% for longer implants undergoing sinus lift procedures.
The results of a randomised pilot study suggested that short implants may achieve better results than longer implants in augmented bone [9]. After 1 year, a statistically significant difference in peri-implant bone loss was observed (p < 0.001), with an average of 1.02 mm for 6 mm implants versus 1.09 mm for implants at least 10 mm in length.
Storelli et al. reported similar long-term results for survival and success rates over 10 years [32]. Marginal bone loss after 10 years was not statistically significant (p = 0.22), although decementation of the superstructure was more frequently observed with 6 mm implants.
Therefore, especially in the posterior maxilla, the exact vertical height of the jaw is very important for deciding whether a sinus lift is necessary or whether short implants should be considered.
This aspect was investigated in our study to determine whether PAN measurements are accurate enough or whether a CBCT is necessary. Although the results showed significant findings for CBCT, the differences between the two imaging techniques were very small and clinically acceptable: 0.48 mm for the right maxilla and 0.35 mm for the left. The difference in vertical measurements between the two methods was less than 2 mm, which is significant, as a safety margin of 2 mm is generally required in implantology. Therefore, the risk of damaging the maxillary sinus floor when planning treatment based on panoramic radiographs can be considered rather low.
In summary, both methods provide sufficient accuracy within the 2 mm safety margin, as demonstrated by the comparison of their results. Therefore, a panoramic X-ray can be used in clinical practice to determine whether there is sufficient bone height for a short implant or whether bone augmentation is necessary.
Healing processes of the alveolar bone after tooth extraction often lead to deformities of the alveolar ridge [33,34,35]. Resorption of hard tissue ultimately leads to soft tissue resorption, which impairs the treatment outcome regarding aesthetics and biocompatibility [1]. In addition, bone resorption also leads to soft tissue degradation, resulting in three-dimensional defects that are difficult to repair [13].
The above-mentioned studies highlight the importance of assessing the presence and extent of defects in the edentulous alveolar ridge regions prior to implant prosthetic treatment.
Vertical defects of the alveolar ridge were detected in 58 (17%) of the 341 measurements, representing a relatively high proportion of edentulous areas that must be considered in preoperative diagnostics. Table 4 shows that the defect values for CBCT were, on average, slightly higher than for PAN. However, the differences were very small and not significant (p = 0.052). Thus, PAN is also suitable as a diagnostic tool for assessing the height of a vertical defect in the edentulous jaw area.
In principle, CBCT is clearly superior to PAN for detecting anatomical structures. One reason for this is that, due to the technique, only structures that lie within the tomographic plane are clearly visible on PAN images. Objects that are behind the tomographic plane appear wider, and those in front appear narrower [18,25]. Horizontal and vertical distortions can be observed outside the tomographic plane. These biases are the reasons why measurements on PAN are unreliable. Incorrect positioning of the head can also lead to distortion of the anatomical structures. Incorrect positioning of the head relative to the midline causes horizontal errors, so that anatomical structures in the posterior region appear wider or narrower. Incorrect positioning of the head relative to the horizontal plane causes vertical errors, making structures appear longer or shorter [18]. Moreover, CBCT allows for fewer interpretations, and the findings are less dependent on the examiner [27]. At this point, it must be critically noted that the assumed 25% distortion for PAN images could influence the results. However, this influence is expected to be very minor, as any distortion was minimised through regular quality control measures, including maintenance and calibration using objects of known size. This also applies to the images taken externally. In over 70% of these images, objects of known size were present, suggesting that good calibration of the images was achieved. However, CBCT also has some disadvantages, such as the presence of artefacts, especially when metal or root canal fillings are in the area of interest [36]. Another typical problem with CBCT is artefacts that arise from head movements resulting from insufficient fixation of the head. The time required to produce a CBCT can also be a possible cause. Therefore, because larger FOVs take longer to produce, CBCTs with small FOVs focusing on the region of interest are more advantageous [37].
In this study, one researcher initially evaluated the panoramic images and then assessed the CBCT images after a minimum of 2 weeks. A higher statistical significance may have been obtained had several examiners been involved in the study. However, the high intra- and inter-rater reliability observed in the preliminary step of the study supports the reliability of the results.
Measurements in the PAN images were performed while considering a standardised magnification factor (1.25), a consistently defined measurement area and the use of two identical reference points. Although a sufficiently large sample size reduces the likelihood that these factors would systematically lead to biassed results, they nevertheless remain potential sources of error. Because this was a retrospective study, these influences could not be controlled. Furthermore, the calculated value (1.25) can be found in the scientific literature, where it is recommended as both a typical scaling factor for PAN and a reference value for calibrations [38].
The concerns about PAN appear to have played a minor role in our study. The small differences in measurements between PAN and CBCT images may also be due to the selection of correctly acquired PAN images (see inclusion criteria).
Because CBCT scans use higher levels of ionising radiation than panoramic radiographs, CBCT should only be used in situations where the potential benefits to the patient outweigh the risks associated with the increased radiation exposure. This approach is in line with the ALARA principle (As Low As Reasonably Achievable) [39]. The higher cost of CBCT scans should also be considered. Furthermore, panoramic radiography equipment is more widely available than CBCT equipment. These factors also support the use of panoramic radiography as a reliable method for vertical measurements in the posterior maxilla [40].
Regarding the initial hypothesis that the measurement of VD and DH occurs equally on CBCT and PAN images, this hypothesis is rejected. However, the results show that the differences between the two imaging techniques are very small and within the clinically acceptable range.
The purpose of this study was not to investigate the available space for an implant, but rather to compare PAN and CBCT using vertical measurements. Further studies could address this topic and examine both the vertical and horizontal space required for implant placement. The measurement of defects in this study did not reveal any statistically significant differences. However, this result should be interpreted with caution due to the small sample size and lack of standardisation. For future studies, it would be advisable to use a larger number of X-ray images.

5. Conclusions

Low alveolar ridge height and alveolar ridge defects are recognised as the most important limiting factors for posterior maxillary reconstruction, highlighting the need for accurate measurement of the vertical distance below the floor of the maxillary sinus.
Based on the presented data, the authors conclude that the differences in PAN and CBCT measurements of the vertical distance between the alveolar ridge and the floor of the maxillary sinus are minimal. Therefore, PAN can be used as a reliable method for diagnosis and assessment of vertical height in the posterior maxilla.

Author Contributions

A.-R.K. contributed to study conception and methodology, supervision of participants, data acquisition, and preparation of the original draft, including revisions and approval of the final version of the manuscript. S.H. contributed to the preparation of the original draft, as well as revision. L.S. contributed to the methodology and revision. S.K. contributed to the methodology and revision. A.P. contributed to the methodology and revision. J.S. contributed to project planning and supervision, data curation and revisions, as well as statistical evaluation. All authors have read and agreed to the published version of the manuscript.

Funding

This research received no external funding.

Institutional Review Board Statement

The analysis was undertaken in accordance with the Declaration of Helsinki and was approved by the Institutional Review Board. Ethical approval was sought and approved by the Medical Council of Baden–Württemberg, Germany (reg. no. F-2014-006-z).

Informed Consent Statement

Not applicable.

Data Availability Statement

The original datasets analysed in the current study are available on reasonable request from correspondence author.

Conflicts of Interest

The authors declare no conflicts of interest.

Abbreviations

CBCTcone-beam computed tomography
cmcentimetre
DHdefect height
FOVfield of view
kVkilovolt
M1first molar mesial
M2first molar distal
mAmilliampere
mmmillimetre
PANpanoramic radiography
SDstandard deviation
secsecond
SLsinus lifting
VDvertical distance

References

  1. Buser, D.; Chappuis, V.; Belser, U.C.; Chen, S. Implant placement post extraction in esthetic single tooth sites: When immediate, when early, when late? Periodontol. 2000 2017, 73, 84–102. [Google Scholar] [CrossRef] [PubMed]
  2. Tonetti, M.S.; Hämmerle, C.H. European Workshop on Periodontology Group C. Advances in bone augmentation to enable dental implant placement: Consensus Report of the Sixth European Workshop on Periodontology. J. Clin. Periodontol. 2008, 35 (Suppl. S8), 168–172. [Google Scholar] [CrossRef] [PubMed]
  3. Aghaloo, T.L.; Moy, P.K. Which hard tissue augmentation techniques are the most successful in furnishing bony support for implant placement? Int. J. Oral Maxillofac. Implant. 2007, 22, 49–70, Erratum in Int. J. Oral Maxillofac. Implant. 2008, 23, 56. [Google Scholar] [PubMed]
  4. Khoury, F.; Schmidt, C.; Jackowski, J. The influence of suturing and or gluing of perforated Schneiderian membrane during sinuslift procedure on the outcome: A retrospective study. Int. J. Implant. Dent. 2024, 10, 48. [Google Scholar] [CrossRef] [PubMed] [PubMed Central]
  5. Pjetursson, B.E.; Tan, W.C.; Zwahlen, M.; Lang, N.P. A systematic review of the success of sinus floor elevation and survival of implants inserted in combination with sinus floor elevation. J. Clin. Periodontol. 2008, 35 (Suppl. S8), 216–240. [Google Scholar] [CrossRef] [PubMed]
  6. Zijderveld, S.A.; van den Bergh, J.P.; Schulten, E.A.; ten Bruggenkate, C.M. Anatomical and surgical findings and complications in 100 consecutive maxillary sinus floor elevation procedures. J. Oral Maxillofac. Surg. 2008, 66, 1426–1438. [Google Scholar] [CrossRef] [PubMed]
  7. Anitua, E.; Eguia, A.; Alkhraisat, M.H. Extra-short implants (≤6.5 mm in length) in atrophic and non-atrophic sites to support screw-retained full-arch restoration: A retrospective clinical study. Int. J. Implant. Dent. 2023, 9, 29. [Google Scholar] [CrossRef] [PubMed] [PubMed Central]
  8. Thoma, D.S.; Haas, R.; Sporniak-Tutak, K.; Garcia, A.; Taylor, T.D.; Tutak, M.; Pohl, V.; Hämmerle, C.H.F. Randomized controlled multi-centre study comparing shorter dental implants (6 mm) to longer dental implants (11–15 mm) in combination with sinus floor elevation procedures: 10-year data. J. Clin. Periodontol. 2024, 51, 499–509. [Google Scholar] [CrossRef] [PubMed]
  9. Pistilli, R.; Felice, P.; Cannizzaro, G.; Piatelli, M.; Corvino, V.; Barausse, C.; Buti, J.; Soardi, E.; Esposito, M. Posterior atrophic jaws rehabilitated with prostheses supported by 6 mm long 4 mm wide implants or by longer implants in augmented bone. One-year post-loading results from a pilot randomised controlled trial. Eur. J. Oral Implantol. 2013, 6, 359–372. [Google Scholar] [PubMed]
  10. Esquivel, J.; Meda, R.G.; Blatz, M.B. The Impact of 3D Implant Position on Emergence Profile Design. Int. J. Periodontics Restor. Dent. 2021, 41, 79–86. [Google Scholar] [CrossRef] [PubMed]
  11. Pelekos, G.; Chin, B.; Wu, X.; Fok, M.R.; Shi, J.; Tonetti, M.S. Association of crown emergence angle and profile with dental plaque and inflammation at dental implants. Clin. Oral Implants Res. 2023, 34, 1047–1057. [Google Scholar] [CrossRef] [PubMed]
  12. Jose, E.P.; Paul, P.; Reche, A. Soft Tissue Management Around the Dental Implant: A Comprehensive Review. Cureus 2023, 15, e48042. [Google Scholar] [CrossRef] [PubMed] [PubMed Central]
  13. Puisys, A.; Janda, M.; Auzbikaviciute, V.; Gallucci, G.O.; Mattheos, N. Contour angle and peri-implant tissue height: Two interrelated features of the implant supracrestal complex. Clin. Exp. Dent. Res. 2023, 9, 418–424. [Google Scholar] [CrossRef] [PubMed] [PubMed Central]
  14. Fayek, M.M.; Amer, M.E.; Bakry, A.M. Evaluation of the posterior superior alveolar artery canal by cone-beam computed tomography in a sample of the Egyptian population. Imaging Sci. Dent. 2021, 51, 35–40. [Google Scholar] [CrossRef] [PubMed] [PubMed Central]
  15. Hung, K.; Montalvao, C.; Yeung, A.W.K.; Li, G.; Bornstein, M.M. Frequency, location, and morphology of accessory maxillary sinus ostia: A retrospective study using cone beam computed tomography (CBCT). Surg. Radiol. Anat. 2020, 42, 219–228. [Google Scholar] [CrossRef] [PubMed]
  16. Kämmerer, P.W.; Thiem, D.; Eisenbeiß, C.; Dau, M.; Schulze, R.K.; Al-Nawas, B.; Draenert, F.G. Surgical evaluation of panoramic radiography and cone beam computed tomography for therapy planning of bisphosphonate-related osteonecrosis of the jaws. Oral Surg. Oral Med. Oral Pathol. Oral Radiol. 2016, 121, 419–424. [Google Scholar] [CrossRef] [PubMed]
  17. Friedland, B.; Metson, R. A guide to recognizing maxillary sinus pathology and for deciding on further preoperative assessment prior to maxillary sinus augmentation. Int. J. Periodontics Restor. Dent. 2014, 34, 807–815. [Google Scholar] [CrossRef] [PubMed]
  18. Lurie, A.G. Panoramic Imaging. In Oral Radiology: Principles and Interpretation, 5th ed.; White, S.C., Pharoah, M.J., Eds.; Mosby: Shanghai, China, 2004; pp. 191–209. [Google Scholar]
  19. Crockett, B.; Broome, A.; Tawil, P.; Tyndall, D. Comparison of incidental findings on cone beam computed tomographic and 2-dimensional images. Gen. Dent. 2023, 71, 64–71. [Google Scholar] [PubMed]
  20. Fukuda, M.; Matsunaga, S.; Odaka, K.; Oomine, Y.; Kasahara, M.; Yamamoto, M.; Abe, S. Three-dimensional analysis of incisive canals in human dentulous and edentulous maxillary bones. Int. J. Implant. Dent. 2015, 1, 12. [Google Scholar] [CrossRef] [PubMed] [PubMed Central]
  21. Ketabi, A.R.; Hassfeld, S.; Lauer, H.C.; Piwowarczyk, A. The comparison of visibility of the maxillary sinus septa between cone-beam computed tomography scans and panoramic radiograph images as dependent on the cortical bone thickness: A retrospective comparative study. Int. J. Implant. Dent. 2024, 10, 23. [Google Scholar] [CrossRef] [PubMed] [PubMed Central]
  22. World Medical Association. World Medical Association Declaration of Helsinki: Ethical principles for medical research involving human subjects. JAMA 2013, 310, 2191–2194. [Google Scholar] [CrossRef]
  23. Chen, Z.; Li, J.; Sinjab, K.; Mendonca, G.; Yu, H.; Wang, H.L. Accuracy of flapless immediate implant placement in anterior maxilla using computer-assisted versus freehand surgery: A cadaver study. Clin. Oral Implants Res. 2018, 29, 1186–1194. [Google Scholar] [CrossRef] [PubMed]
  24. Cooper, L.F.; De Kok, I.J.; Thalji, G.; Bryington, M.S. Prosthodontic Management of Implant Therapy: Esthetic Complications. Dent. Clin. N. Am. 2019, 63, 199–216. [Google Scholar] [CrossRef] [PubMed]
  25. Shiki, K.; Tanaka, T.; Kito, S.; Wakasugi-Sato, N.; Matsumoto-Takeda, S.; Oda, M.; Nishimura, S.; Morimoto, Y. The significance of cone beam computed tomography for the visualization of anatomical variations and lesions in the maxillary sinus for patients hoping to have dental implant-supported maxillary restorations in a private dental office in Japan. Head. Face Med. 2014, 10, 20. [Google Scholar] [CrossRef] [PubMed] [PubMed Central]
  26. Malina-Altzinger, J.; Damerau, G.; Grätz, K.W.; Stadlinger, P.D. Evaluation of the maxillary sinus in panoramic radiography-a comparative study. Int. J. Implant. Dent. 2015, 1, 17. [Google Scholar] [CrossRef] [PubMed] [PubMed Central]
  27. Lana, J.P.; Carneiro, P.M.; Machado Vde, C.; de Souza, P.E.; Manzi, F.R.; Horta, M.C. Anatomic variations and lesions of the maxillary sinus detected in cone beam computed tomography for dental implants. Clin. Oral Implants Res. 2012, 23, 1398–1403. [Google Scholar] [CrossRef] [PubMed]
  28. Wolff, C.; Mücke, T.; Wagenpfeil, S.; Kanatas, A.; Bissinger, O.; Deppe, H. Do CBCT scans alter surgical treatment plans? Comparison of preoperative surgical diagnosis using panoramic versus cone-beam CT images. J. Craniomaxillofac. Surg. 2016, 44, 1700–1705. [Google Scholar] [CrossRef] [PubMed]
  29. Maridati, P.; Stoffella, E.; Speroni, S.; Cicciu, M.; Maiorana, C. Alveolar antral artery isolation during sinus lift procedure with the double window technique. Open Dent. J. 2014, 8, 95–103. [Google Scholar] [CrossRef] [PubMed] [PubMed Central]
  30. Wen, S.C.; Chan, H.L.; Wang, H.L. Classification and management of antral septa for maxillary sinus augmentation. Int. J. Periodontics Restor. Dent. 2013, 33, 509–517. [Google Scholar] [CrossRef] [PubMed]
  31. Özalp, Ö.; Tezerişener, H.A.; Kocabalkan, B.; Büyükkaplan, U.Ş.; Özarslan, M.M.; Şimşek Kaya, G.; Altay, M.A.; Sindel, A. Comparing the precision of panoramic radiography and cone-beam computed tomography in avoiding anatomical structures critical to dental implant surgery: A retrospective study. Imaging Sci. Dent. 2018, 48, 269–275. [Google Scholar] [CrossRef] [PubMed] [PubMed Central]
  32. Storelli, S.; Abbà, A.; Scanferla, M.; Botticelli, D.; Romeo, E. 6 mm vs 10 mm-long implants in the rehabilitation of posterior jaws: A 10-year follow-up of a randomised controlled trial. Eur. J. Oral Implantol. 2018, 11, 283–292. [Google Scholar] [PubMed]
  33. Mecall, R.A.; Rosenfeld, A.L. Influence of residual ridge resorption patterns on implant fixture placement and tooth position. 1. Int. J. Periodontics Restor. Dent. 1991, 11, 8–23. [Google Scholar] [PubMed]
  34. Thoma, D.S.; Mühlemann, S.; Jung, R.E. Critical soft-tissue dimensions with dental implants and treatment concepts. Periodontol. 2000 2014, 66, 106–118. [Google Scholar] [CrossRef] [PubMed]
  35. Couso-Queiruga, E.; Stuhr, S.; Tattan, M.; Chambrone, L.; Avila-Ortiz, G. Post-extraction dimensional changes: A systematic review and meta-analysis. J. Clin. Periodontol. 2021, 48, 126–144. [Google Scholar] [CrossRef] [PubMed]
  36. Suomalainen, A.; Pakbaznejad Esmaeili, E.; Robinson, S. Dentomaxillofacial imaging with panoramic views and cone beam CT. Insights Imaging 2015, 6, 1–16. [Google Scholar] [CrossRef] [PubMed] [PubMed Central]
  37. Schulze, R.; Heil, U.; Gross, D.; Bruellmann, D.D.; Dranischnikow, E.; Schwanecke, U.; Schoemer, E. Artefacts in CBCT: A review. Dentomaxillofac. Radiol. 2011, 40, 265–273. [Google Scholar] [CrossRef] [PubMed] [PubMed Central]
  38. Tronje, G.; Eliasson, S.; Julin, P.; Welander, U. Image distortion in rotational panoramic radiography. II. Vertical distances. Acta Radiol. Diagn. 1981, 22, 449–455. [Google Scholar] [CrossRef] [PubMed]
  39. ICRP Publication 105. Radiation protection in medicine. Ann. ICRP 2007, 37, 1–63. [Google Scholar] [CrossRef] [PubMed]
  40. Hayashi, T.; Arai, Y.; Chikui, T.; Hayashi-Sakai, S.; Honda, K.; Indo, H.; Kawai, T.; Kobayashi, K.; Murakami, S.; Nagasawa, M.; et al. Clinical guidelines for dental cone-beam computed tomography. Oral Radiol. 2018, 34, 89–104. [Google Scholar] [CrossRef] [PubMed]
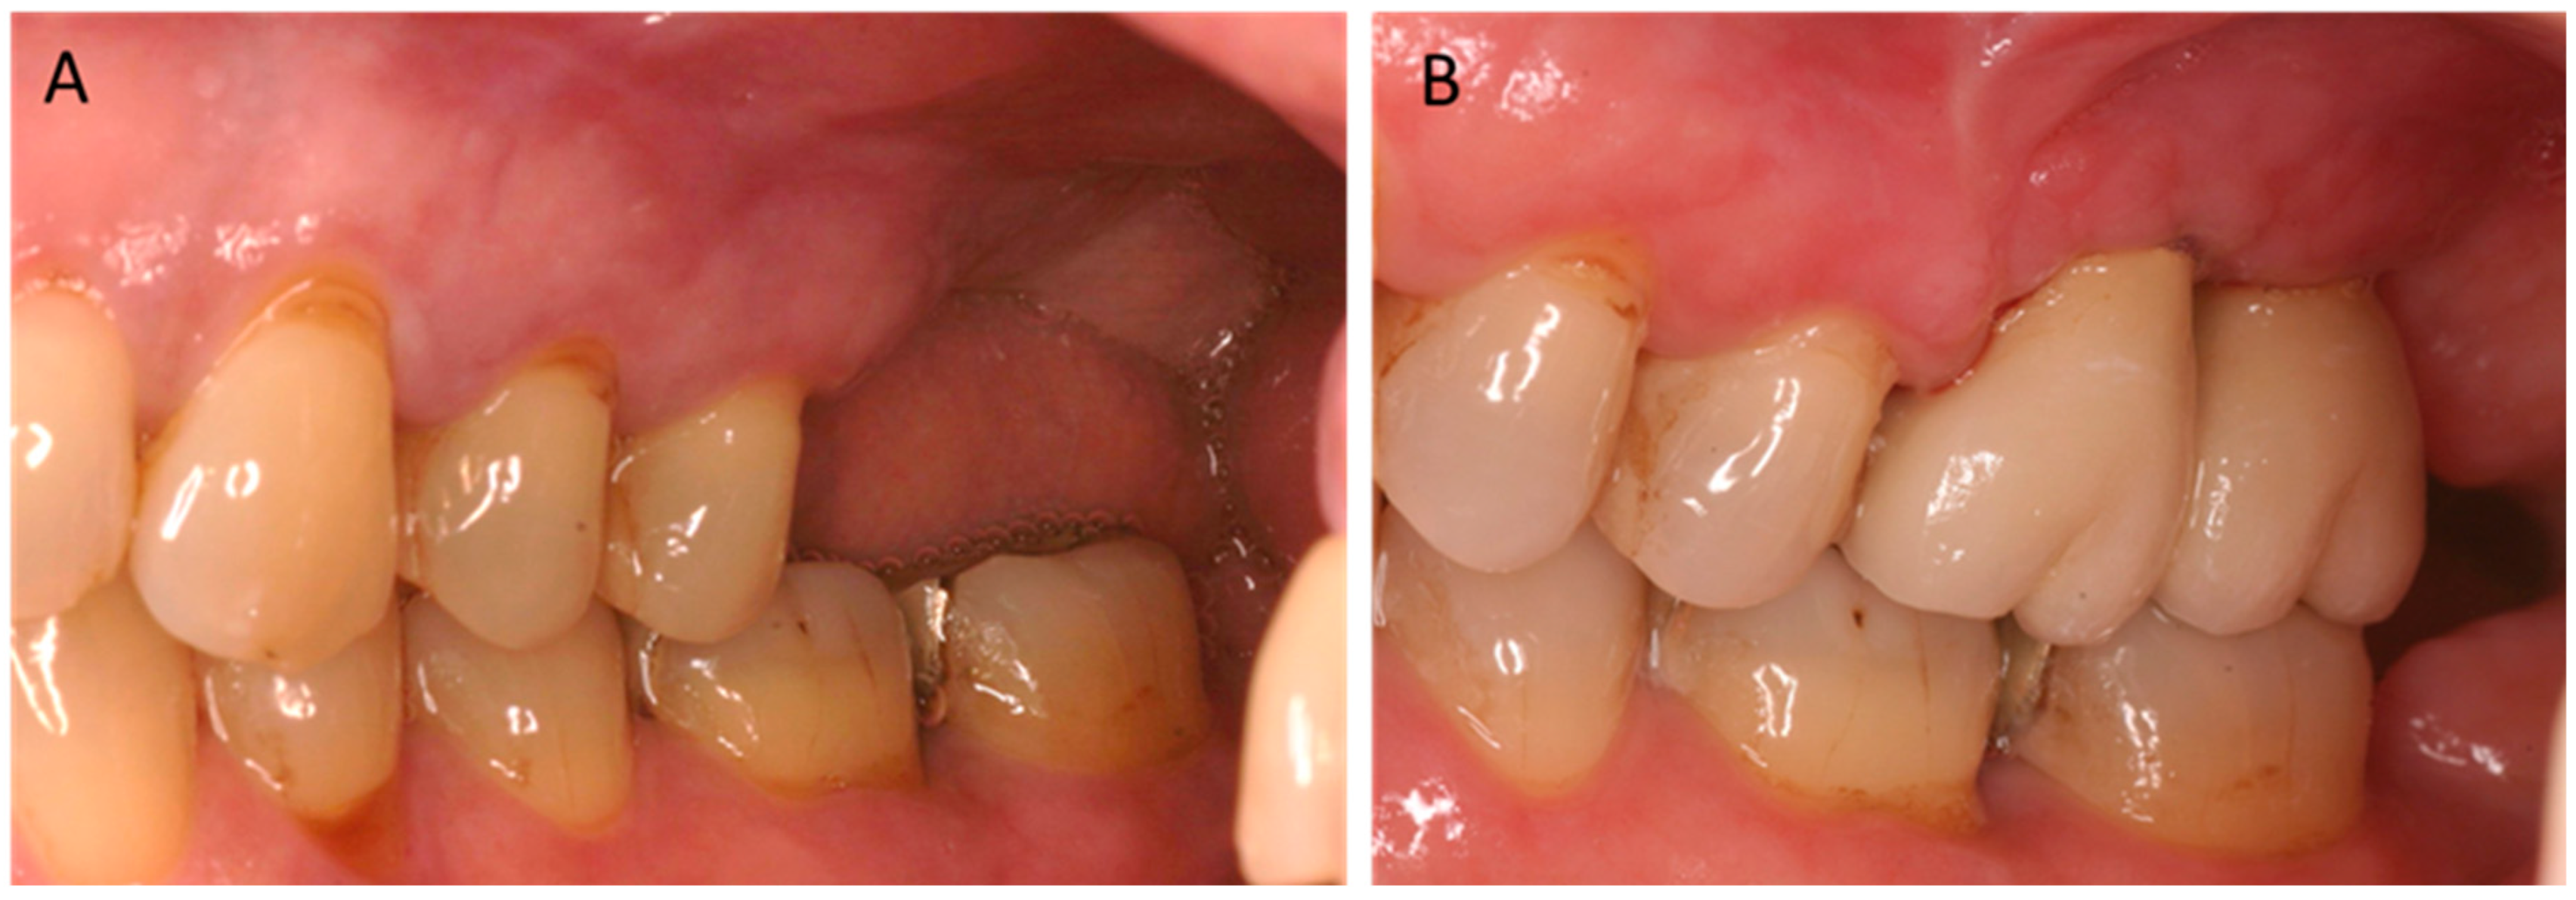
Figure 1. Clinical images showing vertical defects in edentulous jaw sections in regions 26–28 before (A) and after treatment (B).
Prosthesis 07 00131 g001
Figure 2. X-ray images of short implants in region 24 after prosthetic insertion (A) and 1 year after prosthetic restoration (B). Orange arrows mark the implant with adapted peri-implant bone.
Prosthesis 07 00131 g002
Figure 3. (A) PAN image of the maxilla showing vertical height measurements in region M1, right and left. (B) CBCT image of the maxilla with measurement on the sagittal slice. The orange bars show examples of the measuring points in PAN (left) and CBCT (right).
Prosthesis 07 00131 g003
Figure 4. (left) PAN image of the maxilla without vertical defects showing the measurement in the edentulous region of the auxiliary line (A) and the perpendicularly formed line (B) on this plane. (Right) CBCT image of the maxilla with vertical defects showing measurement of the auxiliary line (A) and the perpendicularly formed line (B) on this plane, as well as the defect height (C).
Prosthesis 07 00131 g004
Figure 5. Scatterplot showing the ratio of the vertical measurement distance on CBCT and PAN for the entire dataset (in mm).
Prosthesis 07 00131 g005
Figure 6. Boxplot diagram illustrating defect measurements. The circles (°) represent outliers, the star (*) represents extreme values.
Prosthesis 07 00131 g006
Table 1. Comparison of corresponding vertical measurements on PAN and CBCT. Mean, standard deviation (SD), maximum, and minimum are expressed in mm.
NMeanSDMinimumMaximumPercentiles
25th50th75th
Maxilla
right
PAN 1757.453.770.3220.164.807.129.52
CBCT 1757.934.160.5022.054.817.5110.31
Maxilla
left
PAN 1666.953.710.2421.364.386.849.44
CBCT 1667.303.940.3922.154.287.289.91
TotalPAN 3417.213.740.2421.364.566.969.44
CBCT 3417.624.060.3922.154.807.3510.07
Table 2. Paired-samples t-test comparing corresponding vertical measurements on PAN and CBCT. Mean, standard deviation (SD), and standard error mean (SEM) are expressed in mm; confidence interval (CI) is expressed in percentage.
RegionPaired DifferencestdfSignificance
MeanSDSEM95% Difference CI One-Sided pTwo-Sided p
LowerUpper
Maxilla rightPair 1PAN–CBCT −0.481.070.081−0.64−0.32−5.891740.00010.0001
Maxilla leftPair 1PAN–CBCT −0.350.980.076−0.50−0.20−4.571650.00010.0001
TotalPair 1PAN–CBCT −0.411.030.056−0.52−0.30−7.433400.00010.0001
Table 3. Comparison of paired-sample effect sizes for corresponding vertical measurements on PAN and CBCT.
Standardiser Point Estimate95% Confidence Interval
LowerUpper
Maxilla rightPair 1PAN–CBCTCohen’s d1.072−0.445−0.600−0.289
Hedges’ correction1.076−0.443−0.597−0.288
Maxilla leftPair 1PAN–CBCTCohen’s d0.979−0.355−0.511−0.197
Hedges’ correction0.983−0.353−0.509−0.196
TotalPair 1PAN–CBCTCohen’s d1.028−0.402−0.512−0.292
Hedges’ correction1.031−0.402−0.511−0.291
Table 4. Descriptive statistics of defect measurements. Mean, standard deviation (SD), maximum, and minimum are expressed in mm.
RegionNMeanSDMinimumMaximumPercentile
25th50th75th
Maxilla rightPAN defects 331.741.030.003.841.041.282.41
CBCT defects 331.850.820.604.211.251.802.00
Maxilla leftPAN defects 251.991.090.644.001.161.602.93
CBCT defects 252.201.190.004.811.202.122.85
TotalPAN defects 581.851.050.004.001.121.602.64
CBCT defects 581.991.000.004.811.241.802.42
Disclaimer/Publisher’s Note: The statements, opinions and data contained in all publications are solely those of the individual author(s) and contributor(s) and not of MDPI and/or the editor(s). MDPI and/or the editor(s) disclaim responsibility for any injury to people or property resulting from any ideas, methods, instructions or products referred to in the content.