Abstract
Background: This study compared performance-based function and self-report function in lower-limb prosthesis users. Methods: Twenty-two lower-limb prosthesis users (aged 52.1 ± 14.2) were administered the Orthotic Prosthetic User Survey (OPUS) Lower Extremity Functional Status (LEF), Satisfaction With Devices (SWD), alongside the Godin Leisure-Time Exercise Questionnaire (GLTQ), Timed Up and Go (TUG) test, two-minute walk test (2MWT), and six-minute walk test (6MWT). Body composition and standing postural sway displacement and velocity were also measured. Pearson’s Product Moment coefficients were used to assess relationships between the OPUS and other outcome variables. ANOVAs were used to identify differences in all outcome variables between lower unilateral (LU) and all other (AO) amputees. Results: There was a moderate correlation between LEF and center of pressure (CoP) path length with eyes open (r(19) = −0.43, p = 0.048) and eyes closed (r(19) = −0.43, p = 0.049). While the relationship between LEF and TUG was significant (r(20) = −0.49, p = 0.021), this was not so with SWD and TUG (r(20) = −0.17, p = 0.456). Both the 2MWT (r(20) = 0.48, p = 0.023) and 6MWT (r(20) = 0.47, p = 0.028) were moderately correlated with LEF. GLTQ was significantly correlated with LEF (r(20) = 0.70, p = 0.001). The LU group outperformed the AP group during the TUG and 6MWT (p < 0.05). LU group scored significantly higher on LEF compared to the AO group (p < 0.05). The reliability of LEF between the measurement on day 1 (54.3 ± 12.0) and day 2 (53.6 ± 12.8) was high (α = 0.94). Conclusions: This study provides an insight into associations of balance and self-reported function in lower limb prosthesis users. Future work can target rehabilitation strategies to address challenges faced by multiple limb prosthesis users.
1. Introduction
Obtaining an outcome measure of a rehabilitation therapy mandates assessment [1]. In the context of assessments, patient-reported outcome measures have the potential to give health care professionals a unique patient centered perspective on the effect a treatment has on a person’s life [2]. The importance of regular outcome measurement in prosthetics and orthotics is widely understood and has been expressed in the literature for some time now [3,4,5]. Assessment is cornerstone to the evaluation of health care services and encourages evidence-based practice [6]. Many outcome measures have been designed to assess functional performance during walking activities [7,8,9], as walking is an important outcome of prosthetic rehabilitation [10].
These types of assessments are necessary but often omit other important outcomes of holistic patient care. Recognizing the need to measure other variables such as barriers and participation [11], quality of life (QoL), and ability to perform activities of daily living (ADL) is equally important [12]. There are a number of domains in an individual’s life, the domain of participation can affect QoL [13], thus making the need to identify and use robust and comprehensive assessments important [14]. Numerous qualitative assessments have been used to assess a variety of prosthetic and orthotic interventions with regard to satisfaction, participation, and QoL [5,15,16,17]. The Orthotics and Prosthetics Users’ Survey (OPUS) is one self-reported questionnaire that has established reliability and validity for prosthetics and orthotics users [18,19].
Although the OPUS does well as a self-reported outcome measure of function, satisfaction and quality of life, its association with other measures of habitual physical activity, functional mobility, and body composition are still unknown. The purpose of this study was to examine the association between OPUS and a battery of patient reported and performance-based outcome measures in lower limb prosthesis users. It was hypothesized that functional and balance performances would be associated with better OPUS scores.
2. Materials and Methods
2.1. Participants
This study was approved by the institutional review board of Texas A&M University-San Antonio (Log#2021-38). Each participant signed an informed consent form prior to participating. Twenty-two persons with lower-limb prosthesis without major limb pathology or other major health conditions participated in the study (Table 1). Participants were habitual prosthesis users (0.5 to 60 years) with an ability to read and write in English. Exclusion criteria were individuals with prosthesis provision less than one-half year, presence of existing neurological or neuromuscular impairments, and walking aide use.

Table 1.
Participant characteristics.
2.2. Measures
Participants reported to the lab two times. On the first session they responded to two self-report instruments: The Orthotic Prosthetic User Survey (OPUS), which comprises the Lower Extremity Functional status (LEF) and Satisfaction With Devices (SWD) scales, as well as the Godin Leisure-Time Questionnaire (GLTQ). Participants then had body composition measured using the BODPOD (Cosmed, Rome, Italy), after which standing balance was assessed for Center of Pressure (CoP) variables with eyes opened and closed. Participants performed a timed 8-foot up and go (TUG) and performed either the two-minute walk test (2MWT) or the six-minute walk test (6MWT). On the second session, participants simply completed the OPUS again and then performed either the 2MWT or 6MWT, whichever they did not complete in the first session.
2.3. Procedures
Self-report Instruments: Participants were provided a paper copy of each instrument and given an explanation on how to complete them. Investigators sat with participants during this process in case any questions arose.
Body Composition: The BODPOD was calibrated according to manufacturer’s instructions. Participants were measured with their prostheses, one layer of skin-tight clothing, and wearing a head cap to compress hair. All jewelry, watches, and glasses were removed. The Siri equation was used to estimate body composition from body volume determined by the BODPOD. Body mass (kg) was recorded using the interfaced scale and height was measured using a stadiometer (Seca 213, Hamburg, Germany).
Balance: Participants were fitted with inertial measurement units (IMU) (Opals, APDM Wearable Technologies, Portland, OR, USA) on the right and left wrists and feet, around the waist at the fifth lumbar, and around the chest at the sternum (Figure 1). Participants stood with arms at their sides and feet in a natural position 150 cm from a wall. They were then asked to focus on a small square (approximately 5 × 5 cm) while maintaining balance for 30 s. After a short rest, participants again balanced for 30 s in the same position but with eyes closed. Mobility Lab software by APDM (version 2.0.0.202206161544) was used to assess CoP path length with eyes open (PLEO) and closed (PLEC), as well as CoP velocity with eyes open (VEO) and eyes closed (VEC).
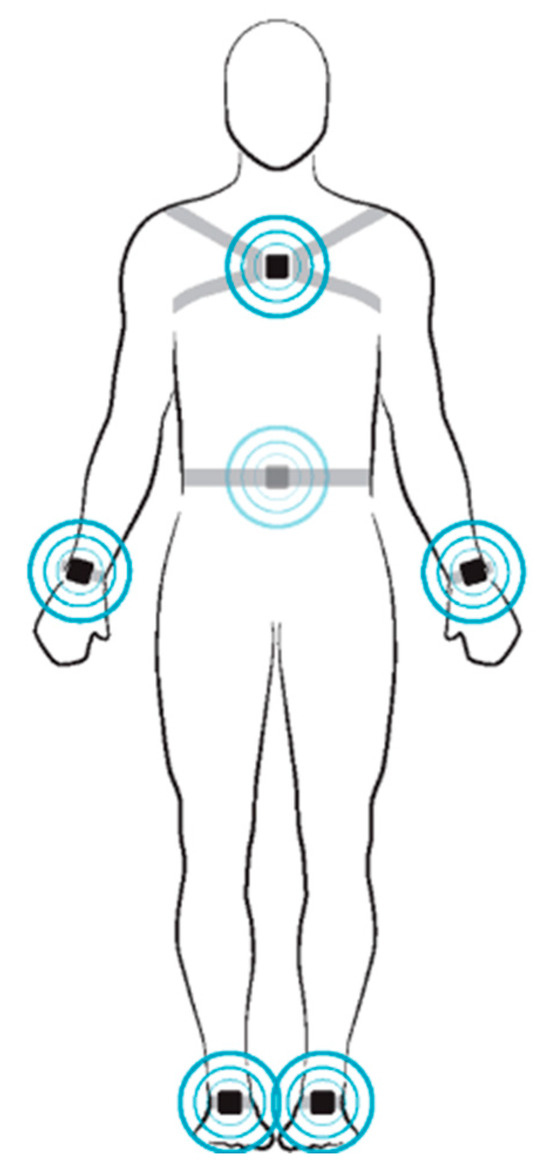
Figure 1.
Fitting of the APDM Opal inertial measurement units for assessment of balance.
Timed 8-foot up and go: Participants sat in a chair against a fixed surface facing a cone eight feet in front of them. Participants were told to get up from the chair, walk as quickly and safely as possible to and around the cone, then sit back down. After a practice trial, participants were given the command “go”, at which time the watch was started. Once the participant was fully seated, the watch was stopped.
Walk Tests: Walk tests were counterbalanced, so that half of the participants engaged in the 2MWT first and the other half the 6MWT first. Participants walked along a rectangular indoor hallway with four right turns and were instructed to walk as quickly and safely as possible. On the command “go”, the watch was started and participants began walking. During the walk, no verbal encouragement or time signaling was given, and investigators walked behind participants with a standard digital measuring wheel so as to not influence pacing. Participants were given a countdown of “5, 4, 3, 2, 1… stop,” at which time the watch was stopped and the distance was recorded.
2.4. Statistical Analysis
All analyses were run using IBM SPSS v29 (Chicago, IL, USA). Pearson’s Product Moment coefficients were used to assess relationships between the OPUS and the other outcome variables (GLTQ, balance, body composition, TUG, 2 and walk tests). ANOVAs were used to identify differences in all outcome variables between lower uniliateral (LU) and all other (AO) amputees. Moderation analysis was used to determine whether the effect of the level of amputation (LU and AO) on outcome variables was dependent on OPUS (moderator). In other words, it indicated whether the effect of level of amputation (group) on outcome variables differed by level of OPUS, such that if significant, the relationship between group and outcome variables depends on OPUS. Moderation was applied only if there was a significant difference in OPUS scores (either LEF or SWD) between groups, and any of the other outcome variables between groups. Cronbach’s Alpha was used to assess stability reliability of the OPUS. Alpha was set at 0.05 for all tests.
3. Results
There was a moderate correlation between path length and LEF for both eyes open (r(19) = −0.43, p = 0.048) and eyes closed (r(19) = −0.43, p = 0.049); however, there was no significant relationship between velocity for both eyes open (r(19) = −0.41, p = 0.069) and eyes closed (r(19) = −0.17, p = 0.439). There was no relationship between LEF and between SWD with percent body fat (r(20) = 0.01, p = 0.969 and r(20) = 0.08, p = 0.727, respectively). While the relationship between LEF and TUG was significant (r(20) = −0.49, p = 0.021), this was not so with SWD and TUG (r(20) = −0.17, p = 0.456). Both the 2MWT (r(20) = 0.48, p = 0.023) and 6MWT (r(20) = 0.47, p = 0.028) were moderately correlated with LEF,; however, neither 2MWT nor 6MWT were correlated with SWD (r(20) = −0.05, p = 0.807 and r(20) = −0.12, p = 0.584, respectively). Similarly, the GLTQ was significantly correlated with LEF (r(20) = 0.70, p = 0.001) but not SWD (r(20) = 0.17, p = 0.452). Illustrations of these correlations can be seen in Figure 2.
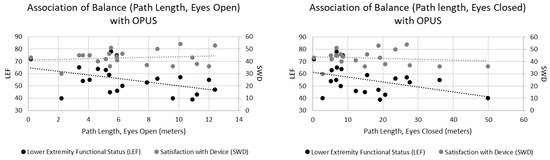
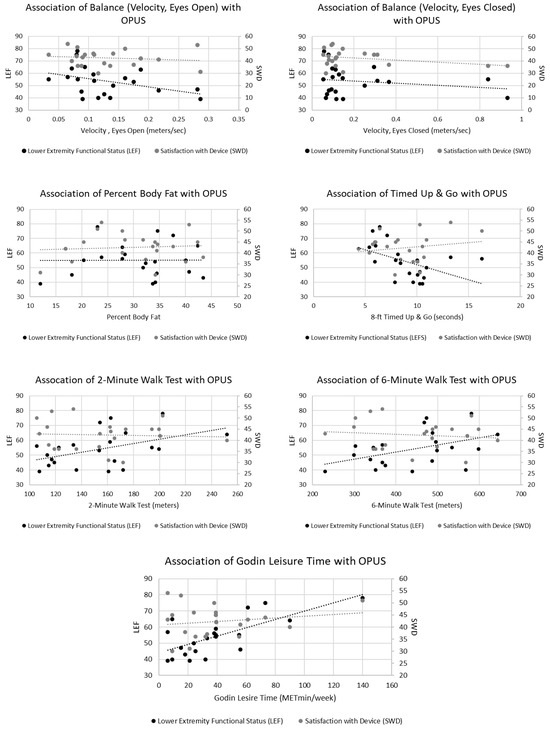
Figure 2.
Significant relationships occurred with Lower Extremity Functional Status (LEF) between timed up and go, 2 min walk, 6 min walk, and Godin Leisure Time (p < 0.05).
While no significant differences existed between groups for percent body fat, 2MWT, GLTQ, or SWD, the LU group outperformed the AP group during the TUG and 6MWT (p < 0.05). Furthermore, the LU group scored significantly higher on LEF compared to the AO group (p < 0.05), Table 2.
Table 2.
Differences in outcome variables between groups.
There was a significant moderating effect of LEF on the relationship between group and time to complete the TUG (p = 0.027). This effect was significant with LEF scores of 48.1 and higher, which represented 63.6% of participants. There was no moderating effect, however, of LEF on the relationship between group and distance walked during the 6MWT (p = 0.827), nor PLEC (p = 0.919), Figure 3.
Figure 3.
The moderating effect of LEF is evident during the TUG (p = 0.027), but not during the 6MWT (p = 0.827) or PLEC (p = 0.919).
Finally, the stability reliability of LEF between the measurement on day 1 (54.3 ± 12.0) and day 2 (53.6 ± 12.8), was high (α = 0.94), as was SWD on day 1 (42.4 ± 6.8) and day 2 (43.6 ± 7.1), (α = 0.87), Figure 4.
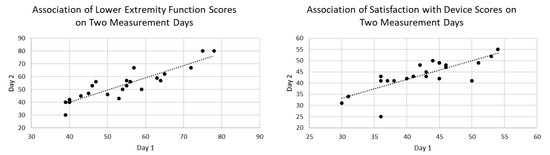
Figure 4.
Reliability was high between two measurements days for both LEF and SWD.
4. Discussion
This study identified that in persons wearing prosthesis, there was an association of longer CoP path length during both conditions and LEF of the OPUS. However, this association was not observed for CoP velocity. The moderate correlation between CoP displacement and LEF in lower limb prosthesis users, but lack of correlation with CoP velocity, can be explained by considering the biomechanical and functional significance of these measures, as well as the nature of the LEF as a patient-reported outcome. CoP displacement reflects the extent of postural sway or the range of movement of the body’s center of pressure during standing or functional tasks. Larger CoP displacement in our participants may indicate challenges in maintaining balance, compensating for prosthetic limb limitations, [20] or reduced confidence in weight-bearing on the prosthetic side [21]. However, these variables were not evaluated in the current study. The LEF assesses perceived functional ability in activities like walking, stair climbing, and standing, which are directly influenced by balance and stability. We observed moderate scores of LEF of 58.6 and 48.0 for LU and AO participants, respectively. Others have observed scores of 45.7 [22], 55.1 ± 4.4, [23], and 51.53 [24]. Taken together, these results suggest a trend of moderate self-reported functional mobility in lower limb prosthesis users.
Since CoP displacement is a direct measure of balance control, it aligns closely with the functional tasks reported in the LEF. For example, individuals with greater sway (higher CoP displacement) have reported more difficulty with activities requiring stability, [25] which may lead to lower perceived function. There is limited data evaluating both perceived balance and actual balance in prothesis users, [26]; however, our correlation suggests that CoP displacement captures a biomechanical aspect of balance relevant to the patient’s perceived functional limitations. CoP velocity measures the speed of CoP movement, which is often associated with the rate of postural adjustments or neuromuscular control to maintain balance [27]. Higher CoP velocity may reflect rapid corrections to maintain stability, which is present in highly functional and less functional prosthesis users [28]. However, perturbation responses were not evaluated in the present study. Unlike CoP displacement, CoP velocity may not directly correspond to the functional tasks or difficulties reported in the LEF. For instance, high CoP velocity could indicate agile, effective postural corrections in some prosthesis users who report high LEF scores (good function).
Conversely, it may also reflect compensatory, erratic movements in those with poor balance control. Variability may reduce the likelihood of a consistent correlation with LEF, as velocity alone may not discriminate between functional and dysfunctional movement strategies. Additionally, the LEF focuses on perceived difficulty in tasks, which may be more closely tied to the outcome of balance rather than the dynamics of balance control.
Prosthesis users may adapt their movement strategies to compensate for sensory and motor deficits. CoP displacement is a more direct reflection of the effectiveness of these strategies in maintaining a stable posture, which aligns with functional tasks in the LEF. CoP velocity, however, may be influenced by factors like muscle strength, proprioception, or prosthetic alignment, which are not necessarily captured in the LEF.
Limitations in our study are low sample size, varying amputation levels, possible influence of prosthetic knee or suspension, and device usage on outcomes. Moreover, as a limitation, we assessed CoP velocity during static balance, which may be less relevant to the LEF items (e.g., quiet standing rather than walking), and thus may not reflect the functional challenges reported by patients. An additional limitation is that the LEF relies on subjective reporting, which may emphasize perceived stability or task difficulty over the speed of postural adjustments. Patients may not consciously perceive or report issues related to CoP velocity, even if it reflects underlying neuromuscular control challenges.
High scores on the LEF were associated with shorter time to complete the TUG. We observed a negative correlation of r = −0.49 for TUG and LEF, which is similar to that seen by others r = −0.70 [24]. Moreover, both 2 and 6MWT were moderately correlated with LEF, with further distance being associated with higher LEF scores. This association was not observed with SWD. The LU group did better during the AO in TUG and 6MWT. The LU group also scored higher on LEF than AO. The GLTQ was correlated with LEF meaning that physically active users also tended to have better functional mobility. A potential limitation is that we did not measure actual physical activity and instead assessed self-report physical activity. Self-reported activity may be biased and suffer from recall issues.
5. Conclusions
In conclusion, this study highlights associations of balance and self-report function in individuals wearing lower limb prostheses. Significant correlations between CoP displacement and velocity, and LEF scores were observed. The findings underscore the challenges faced by prosthesis users in maintaining stability during functional tasks, particularly under conditions of increased difficulty or sensory perturbation. While higher CoP velocity may reflect adaptive strategies to maintain balance, it also indicates a potential reliance on rapid corrections that could compromise long-term stability. These insights emphasize the need for targeted rehabilitation strategies that address both biomechanical and neuromuscular impairments, potentially through enhanced prosthetic design, sensory feedback integration, or tailored training programs to improve balance confidence and functional mobility. They also underscore the utility of patient-reported outcome measurement in lower limb prosthesis users.
Author Contributions
Conceptualization, G.G. and J.D.S.; methodology, J.D.S. and G.G.; software, J.D.S. and G.G.; validation, J.D.S. and G.G.; formal analysis, J.D.S. and G.G.; investigation, G.G. and J.D.S.; resources, J.D.S. and G.G.; data curation, J.D.S. and G.G.; writing—original draft preparation, G.G. and J.D.S.; writing—review and editing, G.G. and J.D.S.; visualization, J.D.S. and G.G.; supervision, J.D.S. and G.G.; project administration, J.D.S. and G.G.; funding acquisition, J.D.S. and G.G. All authors have read and agreed to the published version of the manuscript.
Funding
This research received no external funding.
Institutional Review Board Statement
The study was conducted in accordance with the Declaration of Helsinki and approved by the Institutional Review Board of Texas A&M University-San Antonio (Log#2021-38) 8 March 2021.
Informed Consent Statement
Informed consent was obtained from all subjects involved in the study. Written informed consent has been obtained from the participants to publish this paper.
Data Availability Statement
Data is available upon reasonable request to authors.
Conflicts of Interest
The authors declare no conflicts of interest.
Abbreviations
The following abbreviations are used in this manuscript:
| OPUS | Orthotic Prosthetic User Survey |
| LEF | Lower Extremity Functional Status |
| SWD | Satisfaction With Devices |
| GLTQ | Godin Leisure-Time Exercise Questionnaire |
| TUG test | Timed Up and Go test |
| 2MWT | Two-minute walk test |
| 6MWT | Six-minute walk test |
| LU | Lower unilateral |
| AO | All other |
| CoP | Center or Pressure |
| QoL | Quality of Life |
| ADL | Activities of Daily Living |
| IMU | Inertial Measurement Units |
| PLEO | Path length with eyes open |
| PLEC | Path length eyes closed |
| VEO | Velocity eyes open |
| VEC | Velocity eyes closed |
| OPUS | Orthotic Prosthetic User Survey |
References
- Küçükdeveci, A.A.; Tennant, A.; Grimby, G.; Franchignoni, F. Strategies for assessment and outcome measurement in physical and rehabilitation medicine: An educational review. J. Rehabil. Med. 2011, 43, 661–672. [Google Scholar] [CrossRef] [PubMed]
- Heinemann, A.W.; Ehrlich-Jones, L.; Connelly, L.; Semik, P.; Fatone, S. Enhancing quality of prosthetic services with process and outcome information. Prosthet. Orthot. Int. 2017, 41, 164–170. [Google Scholar] [CrossRef]
- Condie, E.; Scott, H.; Treweek, S. Lower Limb Prosthetic Outcome Measures: A Review of the Literature 1995 to 2005. JPO J. Prosthet. Orthot. 2006, 18, P13–P45. [Google Scholar] [CrossRef]
- Schack, J.; Mirtaheri, P.; Steen, H.; Gjøvaag, T. Assessing mobility for persons with lower limb amputation: The Figure-of-Eight Walk Test with the inclusion of two novel conditions. Disabil. Rehabil. 2021, 43, 1323–1332. [Google Scholar] [CrossRef] [PubMed]
- Heinemann, A.W.; Connelly, L.; Ehrlich-Jones, L.; Fatone, S. Outcome Instruments for Prosthetics. Phys. Med. Rehabil. Clin. N. Am. 2014, 25, 179–198. [Google Scholar] [CrossRef]
- Ramstrand, N.; Brodtkorb, T.-H. Considerations for developing an evidenced-based practice in orthotics and prosthetics. Prosthet. Orthot. Int. 2008, 32, 93–102. [Google Scholar] [CrossRef]
- Gailey, R.S.; Gaunaurd, I.; Agrawal, V.; Finnieston, A.; Otoole, C.; Tolchin, R. Application of self-report and performance-based outcome measures to determine functional differences between four categories of prosthetic feet. J. Rehabil. Res. Dev. 2012, 49, 597–612. [Google Scholar] [CrossRef]
- Deathe, A.B.; Wolfe, D.L.; Devlin, M.; Hebert, J.S.; Miller, W.C.; Pallaveshi, L. Selection of outcome measures in lower extremity amputation rehabilitation: ICF activities. Disabil. Rehabil. 2009, 31, 1455–1473. [Google Scholar] [CrossRef]
- Brehm, M.; A Bus, S.; Harlaar, J.; Nollet, F. A candidate core set of outcome measures based on the international classification of functioning, disability and health for clinical studies on lower limb orthoses. Prosthet. Orthot. Int. 2011, 35, 269–277. [Google Scholar] [CrossRef]
- Wurdeman, S.R.; Stevens, P.M.; Campbell, J.H. Mobility Analysis of AmpuTees (MAAT 6): Mobility, Satisfaction, and Quality of Life among Long-Term Dysvascular/Diabetic Prosthesis Users-Results of a Cross-Sectional Analysis. J. Prosthet. Orthot. 2021, 33, 161–167. [Google Scholar] [CrossRef]
- Fogelberg, D.J.P.; Allyn, K.J.L.; Smersh, M.B.; Maitland, M.E. What People Want in a Prosthetic Foot: A Focus Group Study. JPO J. Prosthet. Orthot. 2016, 28, 145–151. [Google Scholar] [CrossRef]
- Asano, M.; Rushton, P.; Miller, W.C.; Deathe, B.A. Predictors of quality of life among individuals who have a lower limb amputation. Prosthet. Orthot. Int. 2008, 32, 231–243. [Google Scholar] [CrossRef]
- Levasseur, M.; Desrosiers, J.; Noreau, L. Is social participation associated with quality of life of older adults with physical disabilities? Disabil. Rehabil. 2004, 26, 1206–1213. [Google Scholar] [CrossRef]
- Dijkers, M.P. Individualization in quality of life measurement: Instruments and approaches. Arch. Phys. Med. Rehabil. 2003, 84, S3–S14. [Google Scholar] [CrossRef]
- Bettoni, E.; Ferriero, G.; Bakhsh, H.; Bravini, E.; Massazza, G.; Franchignoni, F. A systematic review of questionnaires to assess patient satisfaction with limb orthoses. Prosthet. Orthot. Int. 2016, 40, 158–169. [Google Scholar] [CrossRef]
- Magnusson, L.; Ramstrand, N.; Fransson, E.; Ahlstrãm, G. Mobility and satisfaction with lower-limb prostheses and orthoses among users in Sierra Leone: A cross-sectional study. J. Rehabil. Med. 2014, 46, 438–446. [Google Scholar] [CrossRef]
- Funk, L.; Thiessen, D.; Wright, V.; Andrysek, J.; Rispin, K. Reliability and validity of the Lower Limb Function Questionnaire when completed by young adult orthotic and prosthetic device users. Disabil. Rehabil. Assist. Technol. 2017, 12, 262–271. [Google Scholar] [CrossRef]
- Heinemann, A.W.; Bode, R.K.; O’Reilly, C. Development and measurement properties of the Orthotics and Prosthetics Users’ Survey (OPUS): A comprehensive set of clinical outcome instruments. Prosthet. Orthot. Int. 2003, 27, 191–206. [Google Scholar] [CrossRef]
- Burger, H.; Giordano, A.; Mlakar, M.; Albensi, C.; Brezovar, D.; Franchignoni, F. Cross-cultural adaptation and Rasch validation of the Slovene version of the Orthotics and Prosthetics Users’ Survey (OPUS) Client Satisfaction with Device (CSD) in upper-limb prosthesis users. Ann. Phys. Rehabil. Med. 2019, 62, 168–173. [Google Scholar] [CrossRef]
- Schmid, M.; Beltrami, G.; Zambarbieri, D.; Verni, G. Centre of pressure displacements in trans-femoral amputees during gait. Gait Posture 2005, 21, 255–262. [Google Scholar] [CrossRef]
- Cikajlo, I.; Mitić, J.; Burger, H. The effect of weight-bearing training with visual feedback on balance and prosthetic loading in trans-tibial amputees following vascular disease—A pilot randomized control trial. Ann. Med. 2025, 57, 2447408. [Google Scholar] [CrossRef]
- Eskridge, S.L.; Clouser, M.C.; McCabe, C.T.; Watrous, J.R.; Galarneau, M.R. Self-reported Functional Status in US Service Members After Combat-Related Amputation. Am. J. Phys. Med. Rehabil. 2019, 98, 631–635. [Google Scholar] [CrossRef] [PubMed]
- Amira Adlan, N.; Arifin, N.; Azuan Abu Osman, N.; Hasbollah, H.R.; Yatim, S.M.; Yusof, Y.M. Lower Extremity Functional And Mobility Status In Transfemoral Amputees In Malaysia: A Preliminary Study. Sys. Rev. Pharm. 2020, 11, 1661–1667. [Google Scholar]
- DadeMatthews, O.; Roper, J.A.; Vazquez, A.; Shannon, D.; Sefton, J.M. Virtual Assessment of Functional Mobility in Lower Extremity Prosthesis Clients: An Exploratory Study. Arch. Rehabil. Res. Clin. Transl. 2024, 6, 100355. [Google Scholar] [CrossRef]
- Seth, M.; Horne, J.R.; Pohlig, R.T.; Sions, J.M. Pain, Balance-Confidence, Functional Mobility, and Reach Are Associated With Risk of Recurrent Falls Among Adults With Lower-Limb Amputation. Arch. Rehabil. Res. Clin. Transl. 2023, 5, 100309. [Google Scholar] [CrossRef] [PubMed]
- Ku, P.X.; Abu Osman, N.A.; Wan Abas, W.A.B. Balance control in lower extremity amputees during quiet standing: A systematic review. Gait Posture 2014, 39, 672–682. [Google Scholar] [CrossRef]
- Carpenter, M.G.; Frank, J.S.; Silcher, C.P.; Peysar, G.W. The influence of postural threat on the control of upright stance. Exp. Brain Res. 2001, 138, 210–218. [Google Scholar] [CrossRef]
- Sions, J.M.; Beisheim, E.H.; Manal, T.J.; Smith, S.C.; Horne, J.R.; Sarlo, F.B. Differences in Physical Performance Measures Among Patients with Unilateral Lower-Limb Amputations Classified as Functional Level K3 Versus K4. Arch. Phys. Med. Rehabil. 2018, 99, 1333–1341. [Google Scholar] [CrossRef]
Disclaimer/Publisher’s Note: The statements, opinions and data contained in all publications are solely those of the individual author(s) and contributor(s) and not of MDPI and/or the editor(s). MDPI and/or the editor(s) disclaim responsibility for any injury to people or property resulting from any ideas, methods, instructions or products referred to in the content. |
© 2025 by the authors. Licensee MDPI, Basel, Switzerland. This article is an open access article distributed under the terms and conditions of the Creative Commons Attribution (CC BY) license (https://creativecommons.org/licenses/by/4.0/).