Article

Using Bioimpedance Analysis as a Clinical Predictive Tool for the Assessment of Limb Fluid Volume Fluctuation: An Initial Investigation of Transtibial Prosthesis Users

1
Department of Bioengineering, University of Washington, Seattle, WA 98195, USA
2
Department of Rehabilitation Medicine, University of Washington, Seattle, WA 98195, USA
*
Author to whom correspondence should be addressed.
Prosthesis 2025, 7(3), 53; https://doi.org/10.3390/prosthesis7030053
Submission received: 20 March 2025 / Revised: 2 May 2025 / Accepted: 7 May 2025 / Published: 16 May 2025

Abstract

Background/Objective: Changes in limb volume affect prosthetic socket fit and limb health, which in turn affects the comfort, stability, and usability of a prosthesis. The objective of this research was to identify and evaluate residual limb fluid volume metrics that could be used to identify the need for a prosthetic socket modification or replacement. Methods: A prospective observational study was conducted with transtibial prosthesis users undergoing socket modification or replacement. Participants performed a morning and afternoon 20 min structured activity protocol and self-reported their average socket comfort and other health outcomes before and after their socket was modified or replaced. Limb fluid volume changes across the protocol were recorded using bioimpedance analysis. Results: Anterior region residual limb fluid volume loss was low when the socket comfort score was high. Participants with ESCSave increases of ≥2 points pre- to post-modification experienced less limb fluid volume loss post-modification minus pre-modification (mean +0.6%) compared to participants with ESCSave increases of <2 points (mean −0.9%) (p = 0.0002). Conclusions: The percentage of fluid volume in the anterior limb may be a useful quantitative metric to explore for the application of bioimpedance monitoring in clinical care, helping to identify when sufficient change has occurred such that a new socket is warranted.

1. Introduction

Residual limb volume fluctuation is an ongoing challenge faced by people who use lower limb prostheses. Changes in limb volume affect prosthetic socket fit and limb health, which in turn affects the comfort, stability, and usability of the prosthesis. Studies reported in the literature have shown that socket fit is the single most important issue faced by people with limb amputation [1,2].
Clinical investigations monitoring transtibial prosthesis users’ residual limb volume have been conducted. Consistent with clinical expectations, most participants lost limb volume over the day [3,4,5,6]. However, there was considerable variability across participants as to the amount of volume change, and that may have depended on their health, activity, and socket fit. Studies conducted using a monitoring technique called bioimpedance analysis [7,8] identified trends in how different activities affected limb fluid volume fluctuation. Participants without co-morbidities generally gained limb fluid volume during walking [9,10,11] and gained more fluid volume during high activity (walking and standing with little sitting) than during low activity (sitting and standing with little walking) [5]. Plaster casting 5 s after sitting and doffing resulted in an increased cast size compared with casting 20 min after sitting and doffing [12]. Those with co-morbidities, particularly peripheral arterial disease (PAD), typically lost limb fluid volume during high activity [3]. Standing still with equal or full weight-bearing consistently reduced limb fluid volume across participants, particularly in the posterior region of the residual limb [5,9,10,11]. Sitting with the prosthesis donned caused some, but not all, participants to gain fluid volume [5,11].
Socket size has been shown an important variable affecting residual limb fluid volume [13,14,15,16,17,18,19,20,21]. In a study on 12 transtibial participants, compared with a nominal size socket, use of an oversized socket induced larger morning-to-afternoon limb fluid volume change in the anterior and anterior distal residual limb regions: effect sizes were −0.593 and −0.580, respectively [13]. Interestingly, effect sizes in the posterior and posterior distal regions were much lower in absolute magnitude: 0.093 and 0.206, respectively. Accommodation strategies that changed the socket size were shown to have an immediate impact on limb volume [14,15,16,17,18,19,20,21]. Adding a sock immediately decreased limb fluid volume in 22 of 28 participants [21]. However, removing the sock increased limb fluid volume in only 18 participants and decreased it in 10 participants. Participants with secondary co-morbidities, particularly those with PAD and those who smoked, did not recover fluid volume well after the sock was removed. Their counterparts without secondary co-morbidities and nonsmokers recovered fluid volume more effectively after the sock was removed. Releasing liquid from a bladder that was embedded within an elastomeric liner caused an increase in limb fluid volume during sitting but that fluid was not well retained upon subsequent walking [15]. Results from studies sequentially increasing the volume of liquid in flexible bladders, ambulating, and then removing the liquid during a rest showed similar results [14]. Participants did not return to their prior limb fluid volume, even though all the bladder liquid was removed. Dynamically adjusting socket size, where socket panels were moved inward and outward in small increments (approximately a 0.3% socket volume change), while the person walked did not demonstrate this irreversible limb fluid volume loss [16,17,19,20]. This may have been in part because the socket volume changes were so small. Additionally, unlike liquid-filled inserts, the paneled sockets were designed to achieve approximately the same socket shape at a panel position setting. The findings from limb volume monitoring research are helpful in providing an understanding of general trends in how participant and environmental variables affect limb fluid volume. It is important to continue this avenue of research.
The present study used limb fluid volume monitoring to study participants undergoing socket replacement and modification. The long-term goal is to use bioimpedance analysis as a diagnostic tool to help determine when socket replacement is needed and as a quantitative information tool during the socket design process. Our objective here was to investigate whether limb fluid volume responses from before the socket was changed to after the socket was changed were consistent with participant self-report. A prospective observational study on a group of transtibial prosthesis users is described. We hypothesized that limb fluid volume loss would be less after socket modification or replacement than before for participants who meaningfully increase their socket comfort rating (≥2 points). Results from this research will help determine whether limb fluid volume monitoring may be an effective diagnostic tool for lower limb prosthesis users.

2. Materials and Methods

An observational study was conducted. Residual limb extracellular fluid volume and socket comfort scores were recorded before and after socket replacement or modification in a group of participants with transtibial amputation.

2.1. Participants

People with a transtibial amputation were included in this study if they and their practitioner were planning an imminent socket modification or replacement because of limb volume fluctuation issues that impacted socket fit. Participants were required to have had their amputation at least 18 mo prior, and their residual limb length was at least 9.0 cm from the mid-patellar tendon to the distal end (necessary for using the bioimpedance analysis instrument). Other inclusion criteria were a Medicare Functional Classification Level (MFCL) of 2 or higher (i.e., the ability or potential to traverse low level environmental barriers such as curbs, stairs, or uneven surfaces) [22] and self-report walking at least 7 h/week. People were excluded from the study if they were unable to ambulate continuously on a level walkway or were currently experiencing skin breakdown.
Participants were recruited with flyers posted in local prosthetist offices and events where people with limb amputation were present (e.g., support group meetings). A contact e-mail and phone number were provided on the flyer. We also recruited from a list of participants from prior studies who agreed to be contacted for future research. In addition to recruiting participants locally, we also recruited participants from northern Illinois and the San Francisco Bay Area. Research staff traveled to these locations for those data collection sessions. We strove for a total of 20 participants, a sample size typical of studies assessing prosthetic componentry.

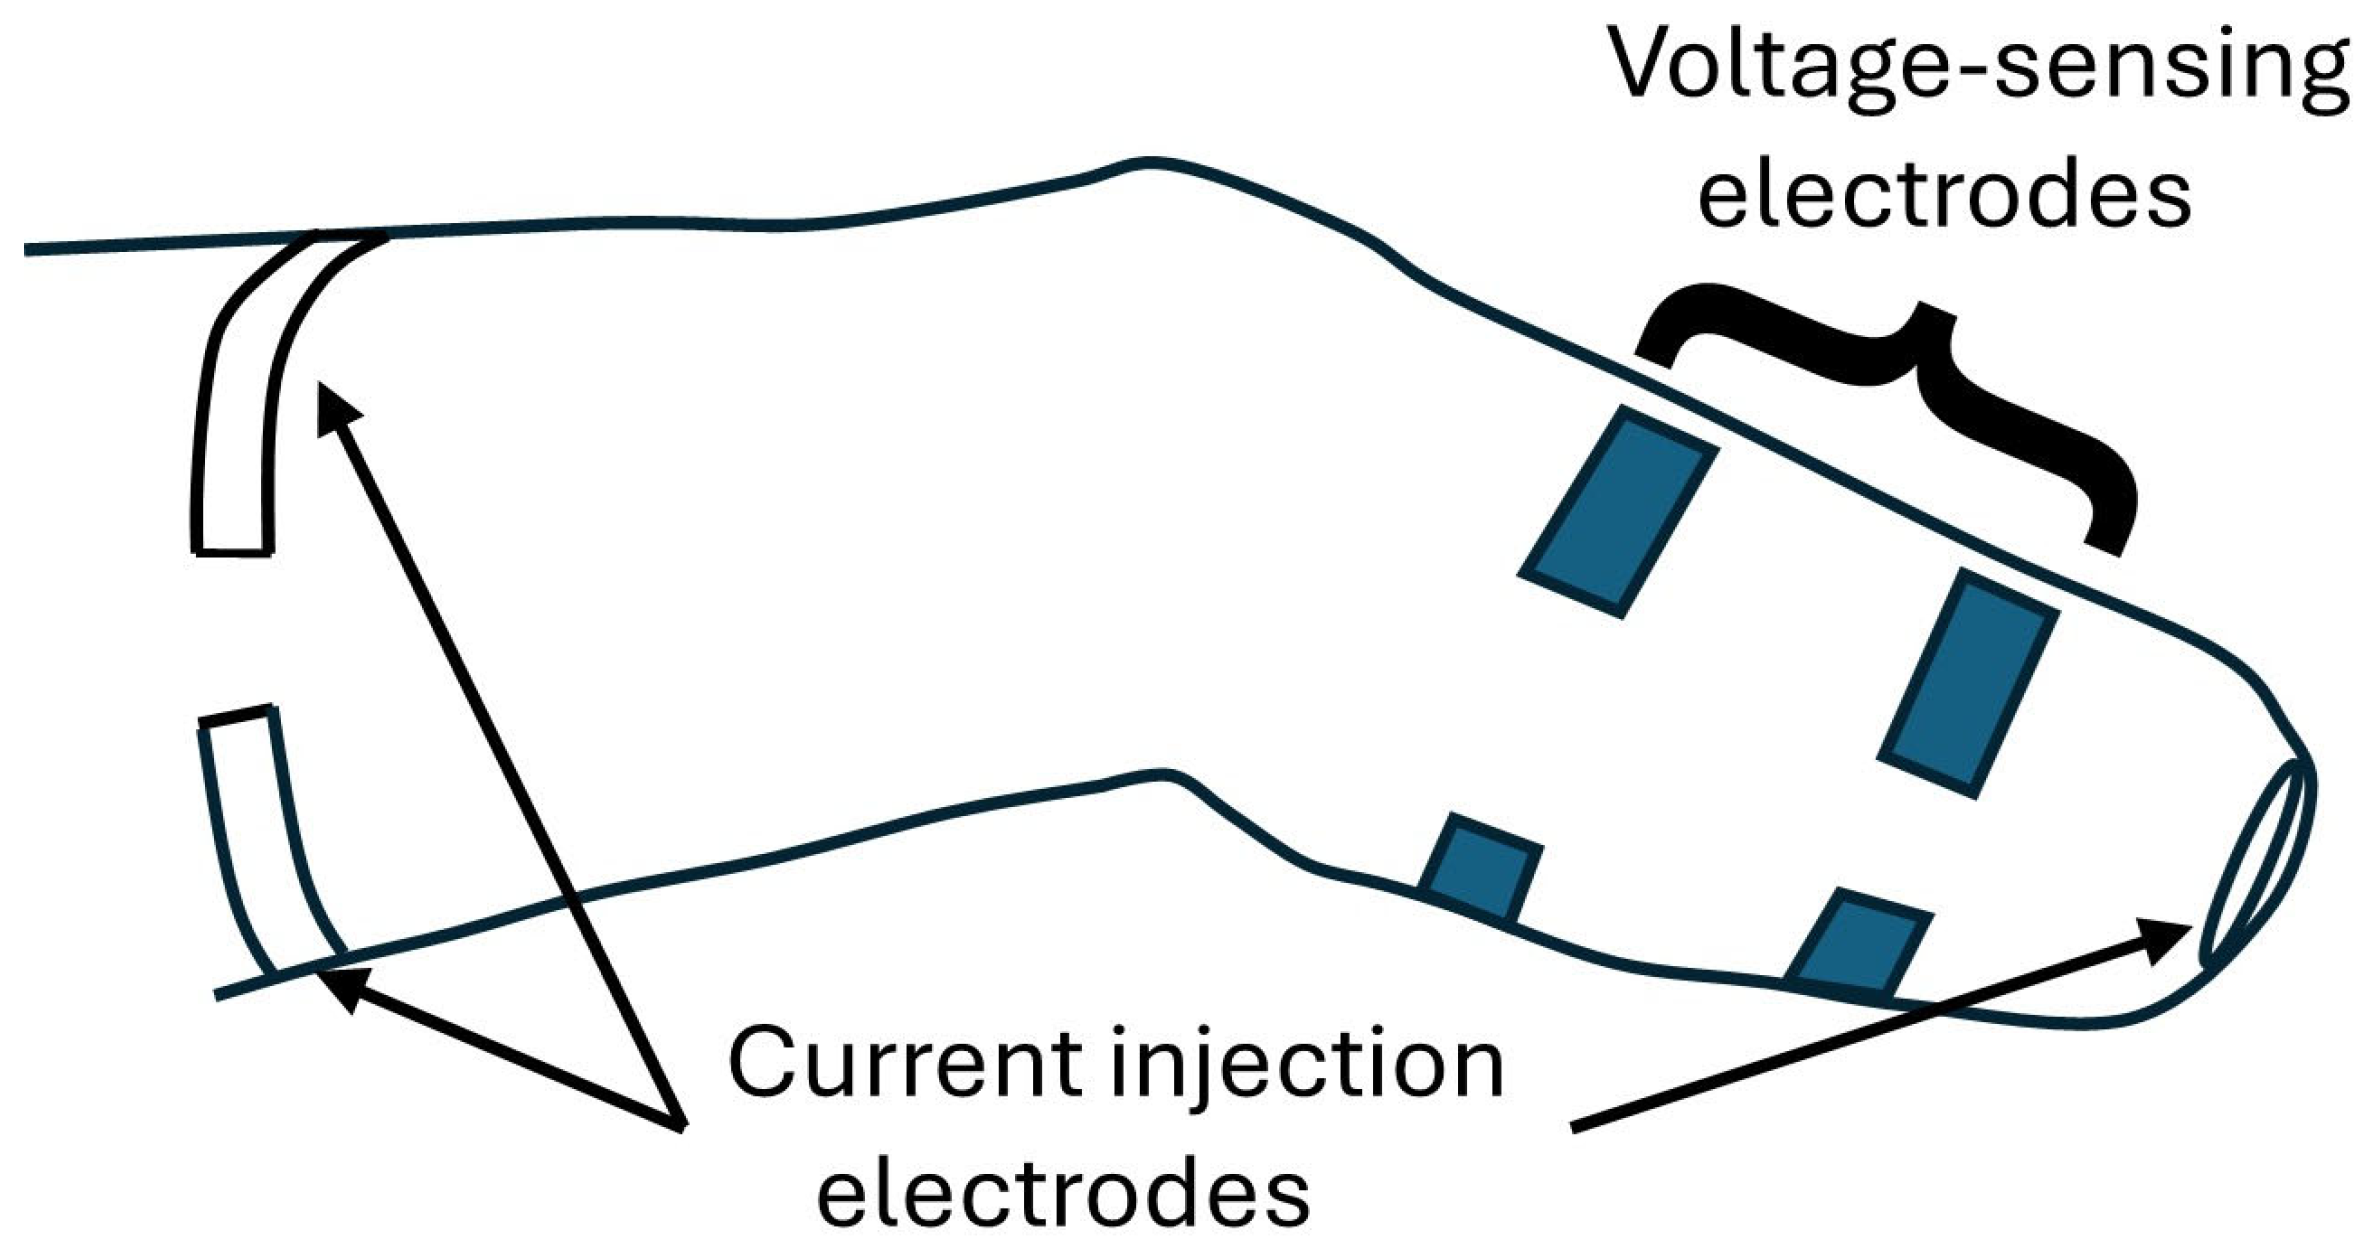
2.2. Limb Fluid Volume Monitor

To measure limb fluid volume, we used a custom, portable multi-frequency bioimpedance analysis system described in our prior work [8]. Measurements were taken from the anterior lateral and posterior mid-limb regions at a sampling rate of 30 Hz. The system applied bursts of electrical current (<300 mA peak-to-peak between 3 kHz and 1 MHz) between current injection electrodes positioned on the proximal thigh and the distal end of the residual limb (Figure 1). Voltage changes were measured using voltage-sensing electrodes, one pair over the anterior lateral region and another pair over the posterior region of the residual limb. The pairs of voltage-sensing electrodes were placed at the level of the patellar tendon distal to the fibular head and at the level of the distal tibia. Fluid volume through the limb cross section between the proximal and distal electrode levels was monitored. Since current travels through the cross section along the limb longitudinal axis, the interosseous membrane and the thick muscle fascia enveloping large muscle groups helps to delineate signals from the anterior and posterior regions, as demonstrated previously [7]. We minimized measurement error by custom designing the bioimpedance system to minimize timing errors and minimize noise at the initiation of each new burst within a tone. We optimized the number of cycles, intermission interval, and sampling delay in the stimulus profile, custom designed the electrodes and lead wires to minimize mechanical strain at the connection during prosthesis use, and optimized the electrode size, spacing, coupling agent, and adhesive to minimize noise and crosstalk [7]. The mean root-mean-square error for the extracellular fluid resistance measurement was 0.07% [8]. Current and voltage data were demodulated and stored on an SD card.
The electrodes were made of thin electrically conductive tape (ARCare 8881, Adhesives Research Incorporated, Glen Rock, PA, USA), constructed as described in Appendix A. A hydrogel (9880, 3M, St. Paul, MN, USA) was placed between the conductive tape and the skin.

2.3. Protocol

Each participant attended three test sessions: a preliminary session, a pre-modification session, and a post-modification session (Figure 2). The pre-modification session was scheduled at least two weeks after the preliminary session, and the post-modification session was completed after the participant’s socket was modified or replaced by their practitioner.

2.3.1. Preliminary Session

During the preliminary session, a certified prosthetist assessed the participant to ensure all inclusion criteria were met. Intake data, including age, time since amputation, height, weight, activities, general health, etiology, and tobacco use, as well as presence of diabetes, high blood pressure, and peripheral arterial disease, were collected by self-report. If the participant had not previously completed a limb fluid volume monitoring session in our lab, then their residual limb was instrumented with electrodes and a 20 min bioimpedance test was conducted. This was carried out, in part, to accustom the user to the test equipment, but also to determine if there were any issues (e.g., excessive scar tissue) that might prohibit bioimpedance monitoring. Five cycles of sitting, standing, and walking (90 s each) were performed. After the session, the electrodes were removed and the participant’s prosthesis and liner were instrumented with two accelerometers (Actilife ActiGraph GR3X+, Pensacola, FL, USA) to monitor their customary activity. Activity was monitored for two weeks so that the participant’s intersession activity could be properly selected. Two accelerometers were used so that sitting could be distinguished from standing [23]. One accelerometer was fastened to the pylon, and the other was affixed to the anterior proximal part of a prosthetic liner that was the same make and model as the participant’s regular liner (methods described in Appendix B). In a prior investigation [23], we showed that two accelerometers configured in this manner accurately detected durations of standing, sitting, and walking. The algorithm described by Redfield et al. [24], which implemented a signal magnitude area threshold method, was used for doff detection. The code resampled and synchronized data between the two accelerometers to account for clock drift between them.

2.3.2. Pre-Modification Session

For the pre-modification session, participants were asked to arrive at the lab mid-morning. They first sat for at least 10 min with their prosthesis donned to achieve a homeostatic condition, during which time the participant and the research prosthetist completed a medical history survey, an intake form, select subsections (i.e., satisfaction, ambulation, residual limb health, utility, and well-being) from the Prosthesis Evaluation Questionnaire (PEQ) [25], select questions (i.e., current and average comfort) from the Expanded Socket Comfort Score (ESCS) [26], and an activity form. The PEQ questions were modified to reflect self-report over the past 7 days rather than the past 4 weeks in order to align with the ESCS. The participant’s residual limb was instrumented with electrodes for bioimpedance monitoring, and data collection was initiated.
The test was in three sections: a morning structed protocol (about 20 min); an intersession semi-structured protocol (about 5 h); and an afternoon structed protocol (about 20 min) (Figure 3). During the morning and afternoon structured protocols, five cycles of sitting, standing, and walking (each activity for 90 s) were performed. Walking was performed on a treadmill at the participant’s preferred walking speed, established during the preliminary session and maintained for all treadmill tests in the study. During standing, the weight borne on the prosthetic leg was monitored with a scale to ensure equal weight-bearing was maintained. If the weight on the scale deviated by more than 5% of the participant’s body weight, then the participant was instructed by the research prosthetist to shift his or her weight to the appropriate leg to achieve equal weight-bearing. During sitting, the participant sat in a relaxed bodily position with his or her thighs horizontal, knees positioned at roughly the same level as the hips, and feet touching the floor, such that knee flexion was approximately 100 degrees.
During the intersession part of the protocol, participants were instructed to conduct their usual activities (e.g., walk, stand, and/or sit as they chose). However, in initial testing we found that some participants chose to sit in the lobby of the laboratory building for the duration of the intersession instead of leaving the building to conduct activity. This was in part due to their unfamiliarity with the geographical area. We therefore developed a semi-structured intersession protocol to ensure that all participants maintained a degree of activity reflective of their typical day. The amount of walking included in the intersession protocol was based on activity recorded during the two-week period between the preliminary session and the pre-modification session (Table 1). If activity data were not collected because of sensor function issues, then self-reported results from the activity form were used instead. Accompanied by a researcher who directed the intersession protocol, participants conducted three cycles of low activity (primarily sitting and standing), high activity (primarily standing and walking), and rest (primarily sitting). Upon returning to the lab, participants conducted the afternoon structured protocol test (identical procedure as the morning test), i.e., five cycles of sitting, standing, and walking on the treadmill. The full protocol took 4.5 to 6.0 h to complete.
While the electrodes were being removed, the participants’ sockets were scanned using a high-resolution coordinate measurement machine (FaroArm Platinum, FARO Technologies, Lake Mary, FL, USA) so that the volume of the socket could be calculated. Participants left the lab, and the planned prosthetic socket modification or replacement was made by their regular prosthetist during the subsequent weeks. Once the participant and their prosthetist considered the modification or replacement completed, the participant returned to the lab for a post-modification session. We initially required that the time between the pre-modification and post-modification test session be less than 4 weeks. However, this constraint was relaxed later in the study because it was not achievable for most participants and their prosthetists.

2.3.3. Post-Modification Session

The post-modification session was identical to the pre-modification session, except that only the PEQ and ESCS surveys and not the other forms were completed in the morning session. The prosthesis components that were modified and the changes made by the practitioner as part of treatment were recorded only during the morning session.

2.3.4. Data Analysis

Activity monitor data collected during the two weeks between the preliminary session and the pre-modification session were analyzed as illustrated in Appendix C. The sum time for each activity—sitting, standing, and walking—was calculated.
PEQ and ESCS data were processed by a method consistent with the developers’ instructions [25,26,27]. The ESCS items for average socket comfort over the past 7 days (ESCSave) and comfort at the moment (ESCSnow) were scored from 0 to 10, and each subsection of the PEQ (satisfaction, ambulation, residual limb health, utility, and well-being) was scored from 0 to 100. The difference in ESCSave (post-modification average minus pre-modification average) was used to rank-order the participants from those with the most improvement (highest difference) to those with the least improvement (lowest difference). The other ESCS and PEQ scores were plotted in this same order. The reason ESCSave was used to establish the rank order instead of one of the other measures was that it was expected to best reflect average socket fit.
Bioimpedance data were processed using de Lorenzo’s form of the Cole model [28] to determine extracellular fluid resistance. The resistances were converted to limb extracellular fluid volume using a limb segment model [29,30]. We use the term residual limb fluid volume to refer to the extracellular fluid volume calculated using this method. Extracellular fluid volume is investigated here because of its clinical relevance towards this application. Error in the extracellular fluid volume measurement using our custom bioimpedance analysis instrument was less than 0.1% limb fluid volume [8]. Intracellular fluid volume is notoriously difficult to measure [31] and our bench tests demonstrated unacceptably large error for this application [8]; thus, intracellular fluid volume was not extracted from the data in this study.
The percentage fluid volume change vs. time during each test day was plotted for each participant. Within the 5-cycle tests, we identified the fluid volume at the beginning and end of each 90 s stand and during the short stands after each walk after the signal had stabilized (example shown in Figure 4). Using the fluid volume at the end of the first sit–stand–walk cycle as a reference, we calculated the percentage fluid volume change during each activity. By summing the changes during all the rests, stands, and walks for cycles 2 to 5, we calculated the total fluid volume change during the last 4 cycles of each 5-cycle test. Because prior investigation indicated that day-to-day limb fluid volume data were more stable for tests run in the afternoon than in the morning [3], the data from the afternoon session was used in this analysis. The total fluid volume change during the last 4 cycles of the 5-cycle test for the pre-modification session was subtracted from that for the post-modification session. A positive number indicated less residual limb fluid volume loss post-modification than pre-modification.

3. Results

Twenty participants enrolled in the study, and fourteen of them completed the testing protocol. Participants who dropped out did so because of a failure to complete socket modification or replacement within the protocol time frame (before the time constraint was relaxed) (four participants), their decision not to continue in the study (one participant), or because the participant no longer met the inclusion criteria (one participant). Demographic information is provided in Table 2. More detailed information is provided in Table S1.
Of the fourteen participants in the study, nine received a new socket and five received modification to their existing socket (Table 3). Some participants’ sockets were not able to be scanned (volume data unavailable) because they had limited time available during the testing session.
The ESCSave results, rank-ordered from most improved to least improved socket fit, are shown in Figure 5a. One participant showed a post-modification minus pre-modification score of 3 points, four showed a change of 2 points, six a change of 1 point, two showed no difference, and one a change of −1 point.
The other self-report metrics, including ESCSnow and the subsections of the PEQ (satisfaction, ambulation, residual limb health, utility, and well-being) are shown in Figure S1. Results were expected to help reveal how different aspects of the socket modifications influenced participant ESCSave scores. However, we did not observe meaningful trends in those data.
Participants who underwent socket replacement, in general, had higher ESCSave scores post-modification than pre-modification compared to those who underwent socket modification (Figure 5a) (mean ESCSave increase 1.67(±0.71) units for replacement, 0.20(±0.84) units for modification, p = 0.01). All five participants who improved on ESCSave by 2 or 3 points and nine of eleven participants who improved on ESCSave by 1 or more points underwent socket replacement. No participant who improved on ESCSave by 2 or 3 points, only two of six who improved on ESCSave by 1 point, and all three who had no change or a negative change in ESCSave underwent socket modification. For participants who underwent socket replacement, we observed a trend of an improved ESCSave when the initial ESCSave was lower (Figure 5b).
The time between the pre-modification and post-modification sessions ranged from 24 to 105 d. Time between sessions was not significantly different among participants grouped by ESCSave difference (+3, +2, +1, 0, −1) (Figure 5a) using a one-way ANOVA assuming equal variance (p = 0.74).
The anterior region fluid volume loss was less post-modification than pre-modification for 4 of 5 participants with ESCSave increases of 2 or 3 points and one participant with a decrease of 1 point. The anterior region fluid volume loss was more post-modification than pre-modification for all participants with ESCSave increases of 0 or 1 point (Figure 6a). The posterior region did not show these trends (Figure 6b).
We arbitrarily separated participants into two groups: those with ≥2 points ESCSave difference pre-modification to post-modification (n = 5) and those with <2 points difference (n = 9). The mean increase in the anterior region limb fluid volume was 0.6% for the ≥2 points group and −0.9% for the <2 points group (p = 0.002) and the mean increase in the posterior region was −0.2% for both groups (p = 0.957) (Figure 6c).
Inspection of fluid volume changes during stand, walk, and rest (Figure 7a,b) demonstrated that no single one of these activities dominated the observed pre-modification to post-modification changes. All fluid volume changes in the posterior region during standing were negative, indicating a fluid volume loss.
We conducted an exploratory analysis to determine if inspection of the data plotted over the entire session combined with information about the prosthetist’s intent for the modification or replacement provided insight into how the socket changes affected the participant. An example is illustrated in Figure 8 for Participant 3, who underwent socket modification.
The socket modifications for Participant 3 included a tibial crest relief, fibular head relief, large posterior pad, and posterior trim line reduction. These modifications resulted in the participant reducing socks by one ply. Though these modifications were intended to improve the prosthetic fit, ESCS scores were unchanged and all PEQ scores (satisfaction, ambulation, residual limb health, utility, and well-being) were lower following the modification. This participant did not experience large daily volume changes either pre- or post-modification, though the post-modification data did show higher rates of loss anteriorly during the morning and afternoon sessions. Additionally, while six-day averages of activity were largely unchanged, the participant decreased weight-bearing time post-modification by about 5%. Overall, the modification strategy was not successful in that participant outcomes were not improved. The participant’s fluid volume profile was defined by loss of fluid volume during walking and standing and gain of fluid volume during resting. Speculating as to how the specific modifications may have impacted fluid volume results, we believe the tibial and fibular head relief removed pressure from the bony areas but redistributed it to soft tissue and perhaps were the cause of greater overall limb volume fluctuation. Additionally, introduction of the large posterior pad could have set the limb further anteriorly, causing the observed higher rates of fluid volume loss in that region. The insight gained from this analysis may be useful in the treatment of this patient and the treatment of other patients with similar limb qualities and pre-modification limb fluid volume profiles.

4. Discussion

The purpose of this research was to evaluate strategies for using limb fluid volume monitoring as a diagnostic tool for people with lower limb amputation. In planning for a subsequent randomized control trial, we sought to gain insight into how socket modification and replacement practices affect limb fluid volume and participants’ self-reported health outcomes. We also sought to identify logistical challenges in the execution of this study and to propose solutions to overcome those challenges.
The results from this study demonstrating a significant increase in the measured anterior residual limb post- minus pre-modification percent fluid volume (0.6%) for participants who reported at least a 2-unit increase in their socket comfort (ESCSave) compared with those who reported less than a 2-unit increase in their socket comfort (−0.9%) (p = 0.002) suggest that anterior limb percentage fluid volume may be a useful quantitative metric to explore for the application of the bioimpedance monitoring tool in clinical care. Post-study analysis showed that the participants who increased their ESCSave by at least 2 points (five leftmost participants in Figure 6a) had high magnitudes in Figure 6a because they experienced a combination of relatively high anterior fluid volume loss pre-modification and relatively low anterior fluid volume loss post-modification (Figure S2). Use of only pre-modification data may facilitate delineating those who will benefit from socket replacement from those who will not, the anterior pre-modification plot (Figure S2, top left panel) shows this trend, but it may not provide as definitive a result as when the degree of improvement to be achieved by socket replacement is considered (Figure 6a). This finding suggests that to operate bioimpedance analysis as a diagnostic tool in clinical care, patients should serve as their own controls. Practitioners should collect limb fluid volume data regularly on their patients and monitor their change in within-session percent limb fluid volume loss over time. Results from the present study suggest that an optimum target for each patient should be established. This would be the anterior percentage fluid volume change measured from a test session when the prosthetist and patient consider the socket fit stable and at an optimum, based on the patient’s highest socket comfort score, for example. When subsequent regular testing shows that the patient’s within-session anterior percent limb fluid volume change decreases by more than 0.6% (on average) from their optimum target, socket modification or replacement should be considered. A thorough scientific investigation in a large clinical trial would be needed to verify or tune the 0.6% fluid volume threshold decrease accordingly. Possibly, results would demonstrate that different patient groups, based on etiology or another characteristic, for example, have different threshold decreases. It is also relevant to determine how often limb fluid volume assessments should be conducted and to what degree variables that were controlled in our study affect the results, namely consistency in the time of day of the test, and consistency in test day prior activity and diet before the 20 min test. Furthermore, it is worth noting that we developed a custom biompedance monitoring system to execute this study, overcoming challenges specific to in-socket limb fluid volume monitoring [7,8]. The low measurement error of our system, <0.1% limb fluid volume, may have been an important capability in this study.
The result of an improved anterior limb fluid volume is consistent with results from another bioimpedance analysis study. In a study comparing morning-to-afternoon limb fluid volume change in over- and nominally sized sockets, we similarly found meaningful fluid volume differences in the anterior and anterior distal regions [13]. A greater reduction in anterior fluid volume over time was observed for oversized sockets accommodated with socks compared to properly sized sockets. A possible explanation for why the anterior region showed change in both studies is that there is little soft tissue anteriorly over the tibia compared with elsewhere in the residual limb. As a result, when the socket is loose and the residual limb during ambulation cyclically translates and rotates in the sagittal plane, stresses may concentrate locally on the anterior surface. Concentrated stress may accentuate pain and residual limb volume loss compared to if the load were distributed within a large region of soft tissue, though no study has definitively demonstrated this result. Limb cyclic rotation in the sagittal plane may also increase. These explanations are conjecture and would need to be tested through rigorous scientific investigation.
Morgan et al. reported that the minimal detectable changes (MDCs) for the ESCSnow and ESCSave are 2.82 and 2.31, respectively [26]. In other words, a score change of at least 3 is necessary to exceed day-to-day variability in either scale. In the present study, thirteen of the fourteen participants showed changes from 2 to −1, which were within the MDCs of the ESCS scales (Figure 5b). Part of the reason the changes were low may have been because more than half of the participants in the study started with a relatively high pre-modification ESCSave; four had pre-modification scores of 8 and three had pre-modification scores of 7. Those with scores of 8 were not capable of achieving an improvement outside of the day-to-day ESCSave variability of 3 units, while those with scores of 7 would have required “the best possible fit [they] could imagine,” a post-modification score of 10 [27]. Mean ESCSave scores in Morgan et al.’s study [26] were 6.9 (±2.5). Improvement is needed to either reduce the day-to-day variability in the metric or to create a new metric that is more sensitive.
Part of the challenge for a prosthetist when considering making a change to a patient’s socket is that socket fit deterioration resulting from limb maturation or other physiologic changes is a gradual process. Identifying when sufficient change has occurred such that a new socket is warranted may therefore be challenging. The results here point to the need for a clearer definition of sufficient change because patients who do not receive a new socket but instead a modification seem to experience greater limb fluid volume loss and reduced socket comfort than those who do. This may be because modification is typically intended to correct a localized socket shape issue, while replacement considers and adjusts the whole socket.
There were noteworthy protocol challenges identified in this study to remedy in future investigations where pre- and post- socket replacement conditions are to be compared, no matter whether limb fluid volume or a different variable is assessed. For participants undergoing socket replacement, accomplishing timely execution of the post-modification session would have been better achieved if we had waited until the practitioner casted (or scanned) the participant before conducting the pre-modification session. Furthermore, the practice of regular communication between our research prosthetist and the participants from the outset of the study was beneficial later on when scheduling data collection sessions. Participants remained invested and motivated to continue the study and hear the outcome.
Our initial assumption during pilot testing that participants would conduct their normal level of activity between the morning and afternoon test sessions was not always accurate, necessitating the change to a semi-structured activity protocol between the sessions to simulate participants’ normal routines. While the total time of walking, sitting, and standing executed during the semi-structured intersession protocol was more in line with participants’ activity data collected during the two weeks, the bout durations, weight shifts, and doff intervals were different than their normal routines. It is unknown if and to what degree the differences between the semi-structured intersession protocol and participants’ normal routines affected the results. A more effective means for developing an intersession protocol may be to conduct a more detailed analysis of the 2-week data. For example, it may be helpful to quantify participants’ weight shifts (≤1 step of motion) relative to their walking bouts [33,34], since participants’ energy expenditure would be expected higher for walk bouts than weight shifts [35]. The semi-structured intersession protocol could then be adjusted accordingly to better reflect those actions. Another possible methodology to set the intersession protocol variables would be to conduct a physiologic test that indicated what the participant was capable of achieving rather than what they normally do. A method used in the exercise physiology field where a patient’s physical condition is assessed by quantifying relationships between treadmill speed and active heartrate and normalizing the result to age [36] has recently been adapted to prosthetics [37]. A metric that considered the participants’ regular activity, physiological capabilities, and effort may facilitate the design of an intersession structured protocol better matched to the individual participant. This improvement may enhance the quality of the intersession data such that it provides additional diagnostic insight towards clinical care.
The visual data display shown in Figure 8 may be an effective means of informing prosthetists about an individual patient’s limb fluid volume profile. Bioimpedance provides quantitative information that prosthetists do not normally have. They may be interested in combining this new information with their clinical evaluation (i.e., visual inspection and palpation of the limb) and feedback from the patient about their sock use, activity, and socket comfort. In short, prosthetists may ascertain how to best use bioimpedance data through their own experience. By combining information from this diagnostic tool with clinical experience and information obtained directly from the patient, we expect that prosthetists will be better positioned to identify and address socket fit issues before they become problematic to the user.
A strength of the study is that the results suggesting that the short (20 min) clinical test introduced here for monitoring residual limb fluid volume may provide insight relevant to practitioner decision making about socket modification. A quick convenient assessment would increase the clinical use of this tool. However, the short clinical test may also be a limitation because the degree of day-to-day change in percentage limb fluid volume test data and whether that variability needs to be considered in interpretation are both unknown. Our study design was intended to minimize variability within and among participants by controlling their activities for approximately 5.5 h before the 20 min test session. Systematic investigations are needed to establish how strictly the time of day of the test and the activity and diet before the test need to be controlled. More extensive investigations studying relationships between limb fluid volume and socket fit, comfort, skin integrity, gait efficiency, and patient satisfaction would further facilitate the development of bioimpedance analysis as a diagnostic tool for clinical care.
It is not known if the results from this investigation are applicable to thigh amputees. Appropriate scientific investigations using a biompedance analysis system customized to thigh amputee testing would need to be conducted.
Our prior studies suggest that activity intensity affects limb fluid volume change [9,10,11,12]. We believe that a study design that keeps the activity scenarios consistent across participants, even if it were different from that executed here, may demonstrate meaningful results in identifying participants in need or not in need of treatment. However, this is conjecture and would need to be tested through rigorous scientific investigation.

5. Conclusions

Anterior limb percent fluid volume may be a useful quantitative metric to explore for the application of bioimpedance monitoring in clinical care, helping to identify when sufficient change has occurred such that a new prosthetic socket is warranted. Results from the present study may benefit the planning of a randomized control trial towards this objective. Practical solutions identified in this study could be executed in future studies, including conducting the pre-modification session after the participant’s limb has been casted (or scanned) by the prosthetist, and using a semi-structured intersession protocol well-matched to participants’ regular activities or capabilities. The results from this investigation point to the need for and encourage further work for a clearer definition of the residual limb change necessary for prosthetic socket replacement.

Supplementary Materials

The following supporting information can be downloaded at: https://www.mdpi.com/article/10.3390/prosthesis7030053/s1, Datasheet S1 for Figure 5, Figure 6, and Figure 7, Table S1 Participant characteristics, Figure S1 Additional self-reported outcome results. Figure S2 Pre-modification and post-modification percent fluid volume data.

Author Contributions

Conceptualization, A.C.V., J.E.S. and J.L.F.; methodology, A.C.V., R.T.Y., K.J.A. and J.E.S.; formal analysis, R.T.Y. and C.R.L.; investigation, A.C.V., R.T.Y., K.J.A. and J.L.F.; data curation, A.C.V., R.T.Y. and C.R.L.; writing—original draft preparation, C.R.L. and J.E.S.; writing—review and editing, A.C.V., C.R.L., K.J.A., J.L.F. and J.E.S.; project administration, A.C.V. and J.E.S.; funding acquisition, J.E.S. and J.L.F. All authors have read and agreed to the published version of the manuscript.

Funding

This work was supported by the Office of the Assistant Secretary of Defense for Health Affairs, through the Peer Reviewed Medical Research Program, under Award No. W81XWH-16-1-0585. The opinions, interpretations, conclusions, and recommendations are those of the author and are not necessarily endorsed by the Department of Defense.

Institutional Review Board Statement

The study was conducted in accordance with the Declaration of Helsinki, and the protocol was approved by the Institutional Review Board (or Ethics Committee) of the University of Washington (STUDY00000969, 3/13/2017).

Informed Consent Statement

Written informed consent was obtained from all subjects involved in the study.

Data Availability Statement

Data from this study are available in Datasheet S1.

Acknowledgments

The authors thank Geoff Balkman for the description of how to apply the ActiGraph monitors (Appendix B) and Nick McCarthy and Paul Fallon for assistance with manuscript preparation.

Conflicts of Interest

The authors declare no conflicts of interest.

Abbreviations

The following abbreviations are used in this manuscript:
BMIBody Mass Index
ESCSExpanded Socket Comfort Score
MDCsMinimal Detectable Changes
MFCLMedicare Functional Classification Level
PEQProsthesis Evaluation Questionnaire
PTBPatellar Tendon Bearing
TSBTotal Surface Bearing
USBUniversal Serial Bus

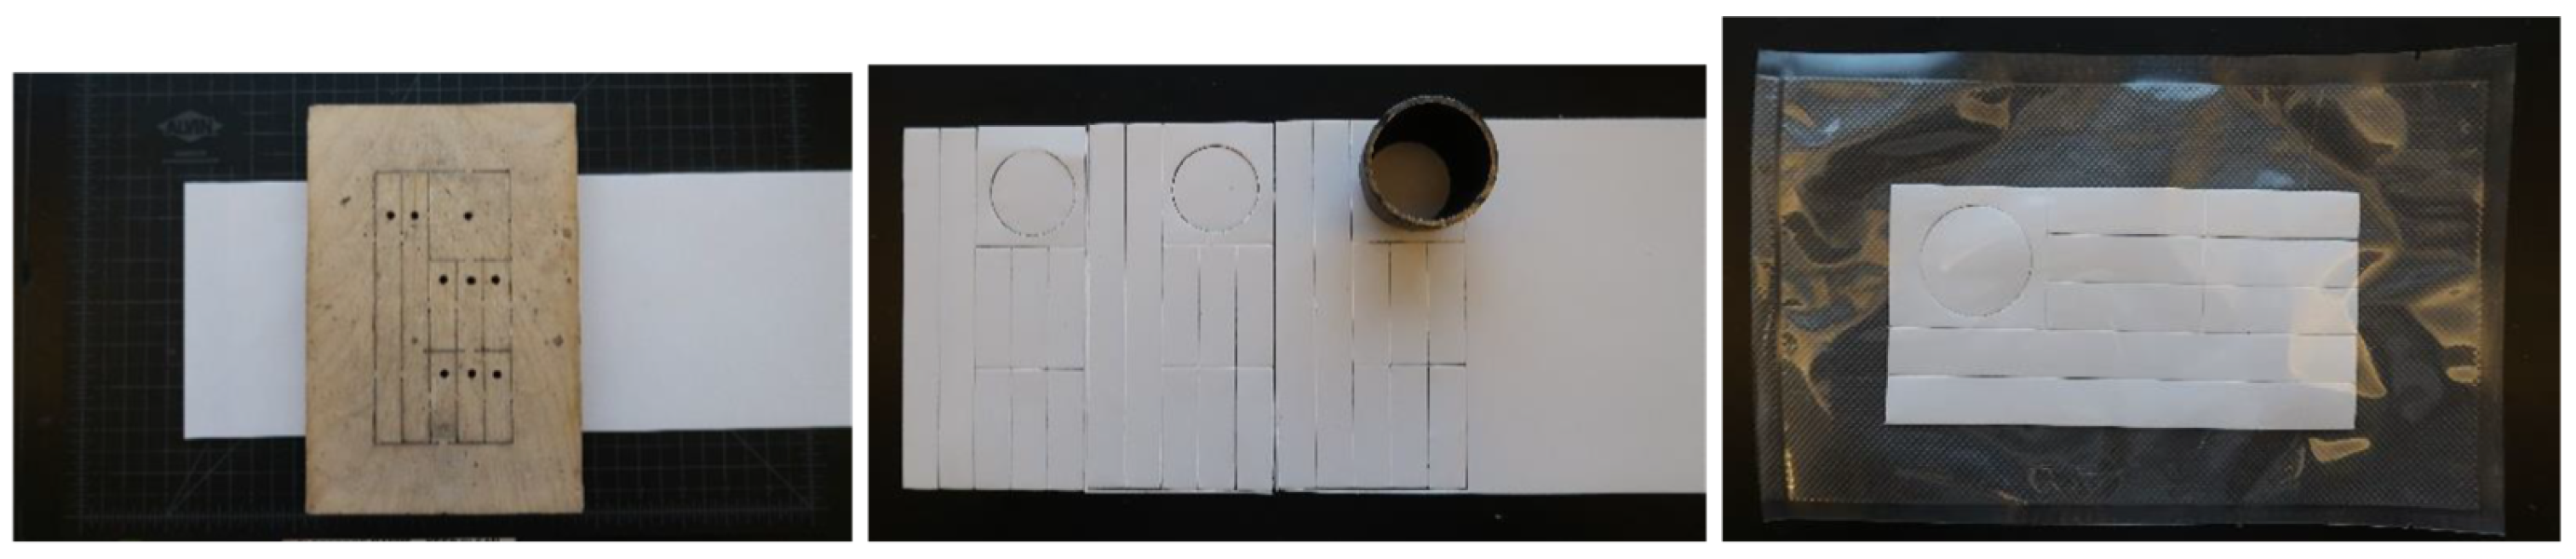
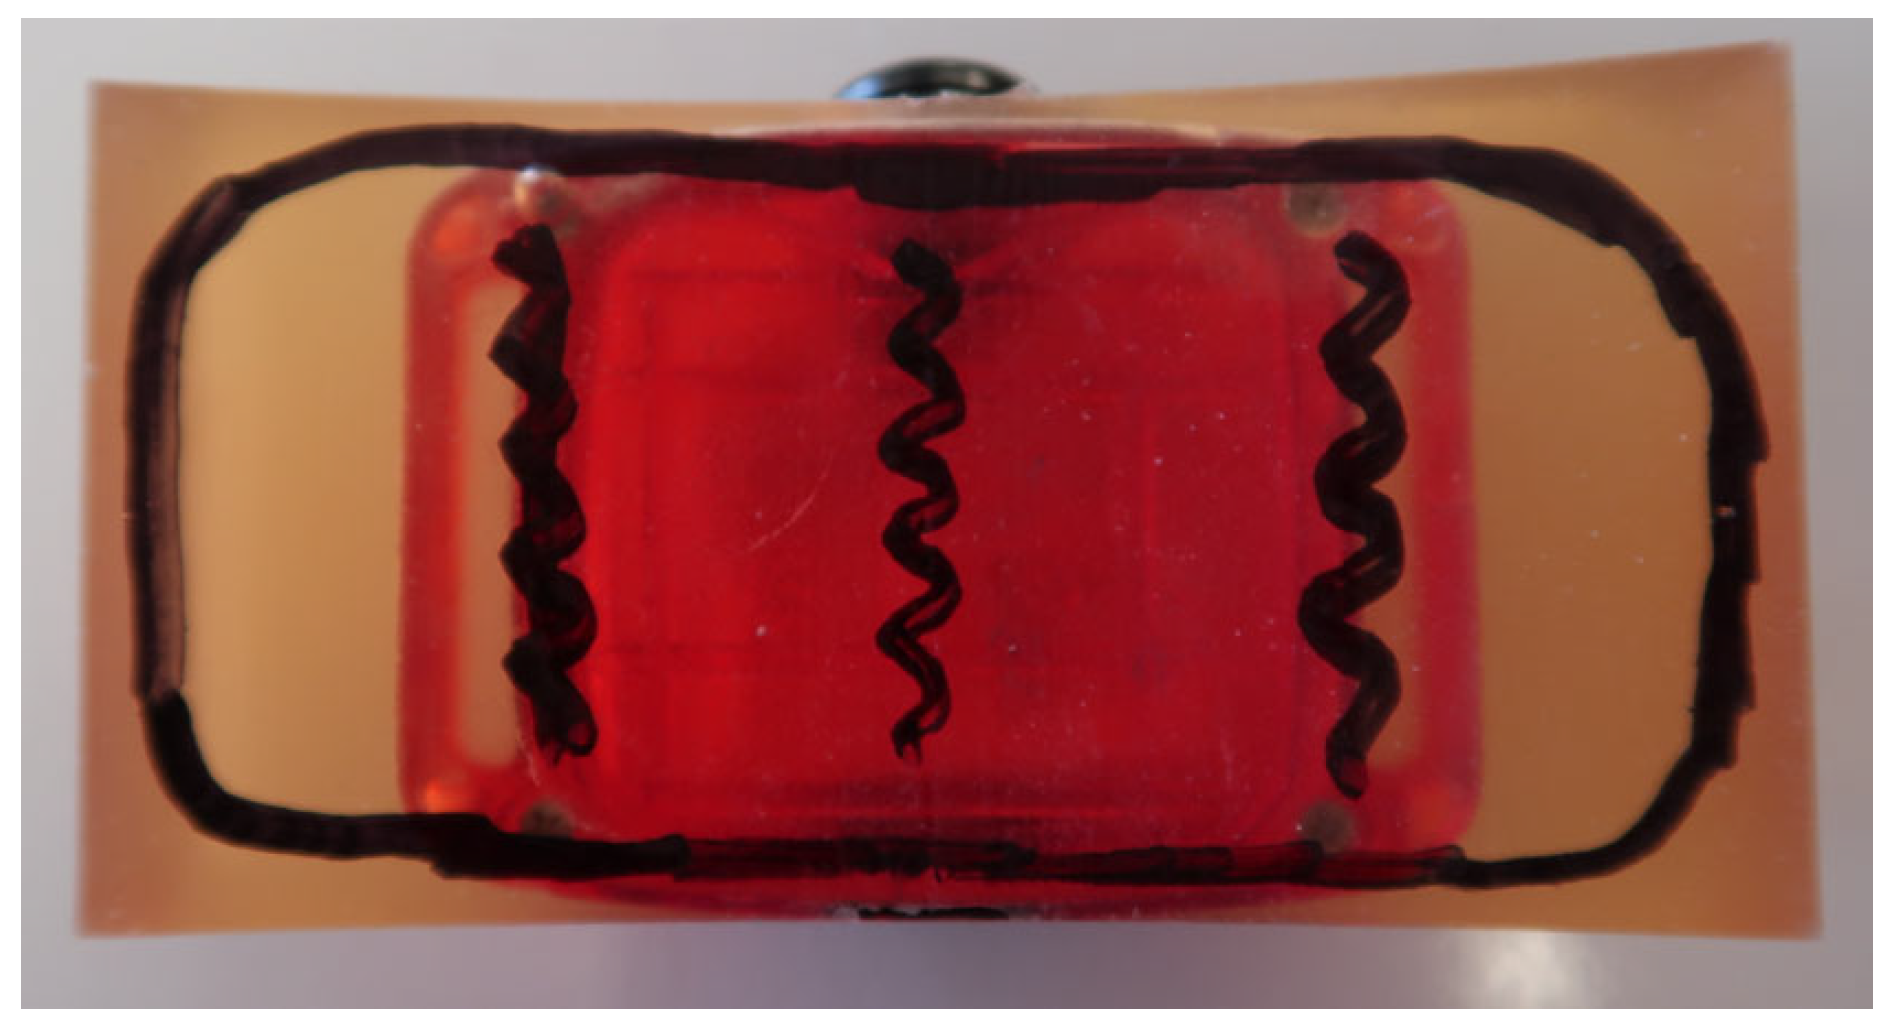
Appendix A. Electrode Fabrication

Sheets of the conductive polymer material used to make electrodes were cut to a width of 8.0 cm and placed on a flat rubber mat. Multiple sets of electrodes were then punched using custom rectangular and circular dies, shown in Figure A1 below. Electrodes of dimensions 1.5 cm × 15.0 cm (proximal current-injecting), 3.5 cm diameter (distal current-injecting), and 1.5 cm × 5.0 cm (voltage-sensing), were cut. These electrodes were stored in individual sealed packages then attached to lead wires in custom-designed harnesses before a test session. Assembly of the harness plugs and wires was sourced to an outside vendor using specifications determined from previous assembly protocols that we developed in our lab. Harnesses were shipped to us ready to be connected to electrodes.
Figure A1. Fabrication of electrodes. Left: Die used to cut electrodes. The electrode conductive polymer material is under the die. Center: Three sets of electrodes after being cut. Right: Single set of electrodes ready for harness lead wire attachment.
Prosthesis 07 00053 g0a1

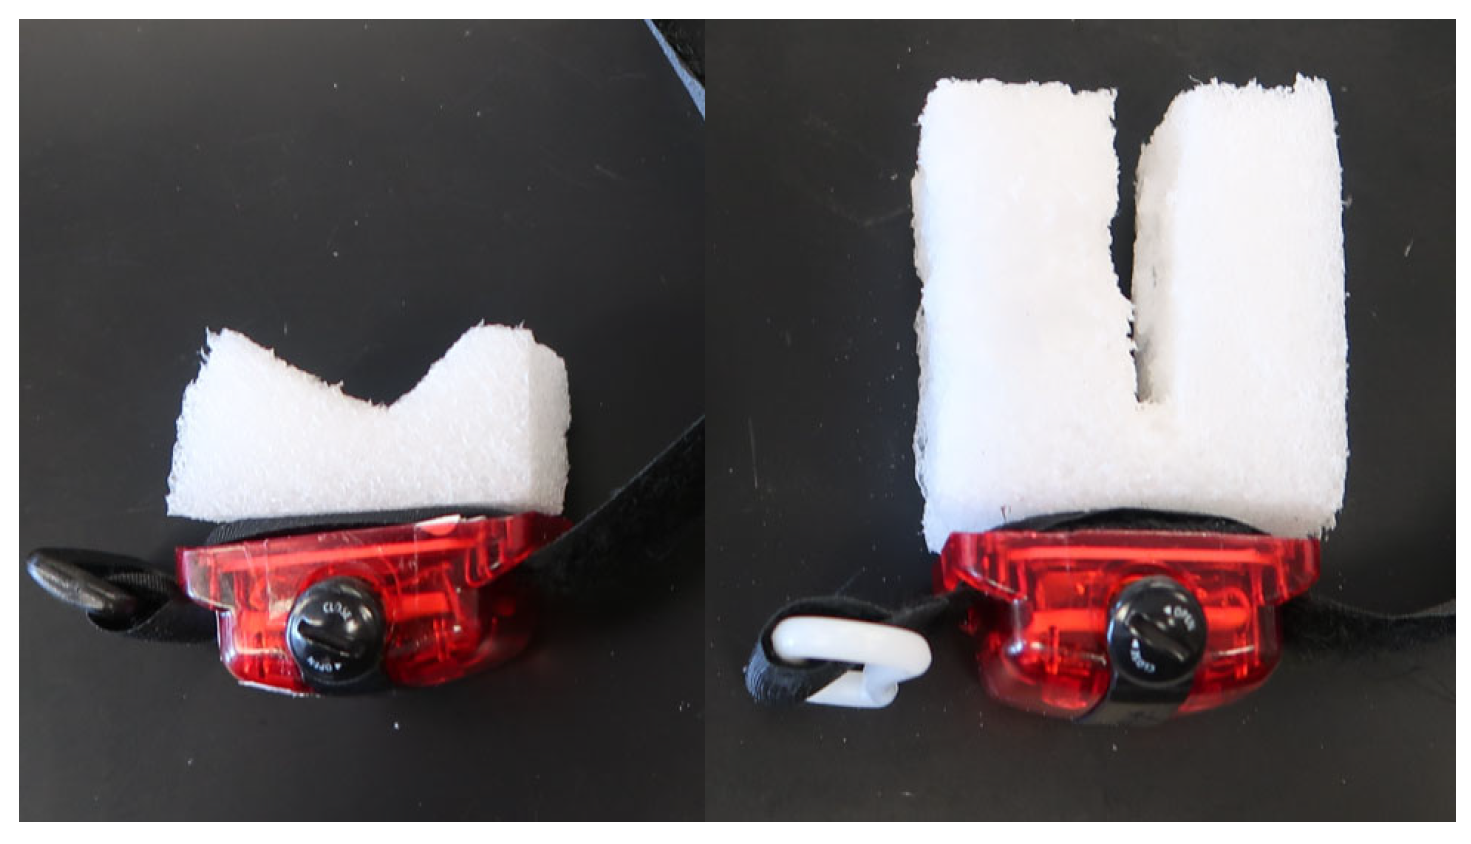
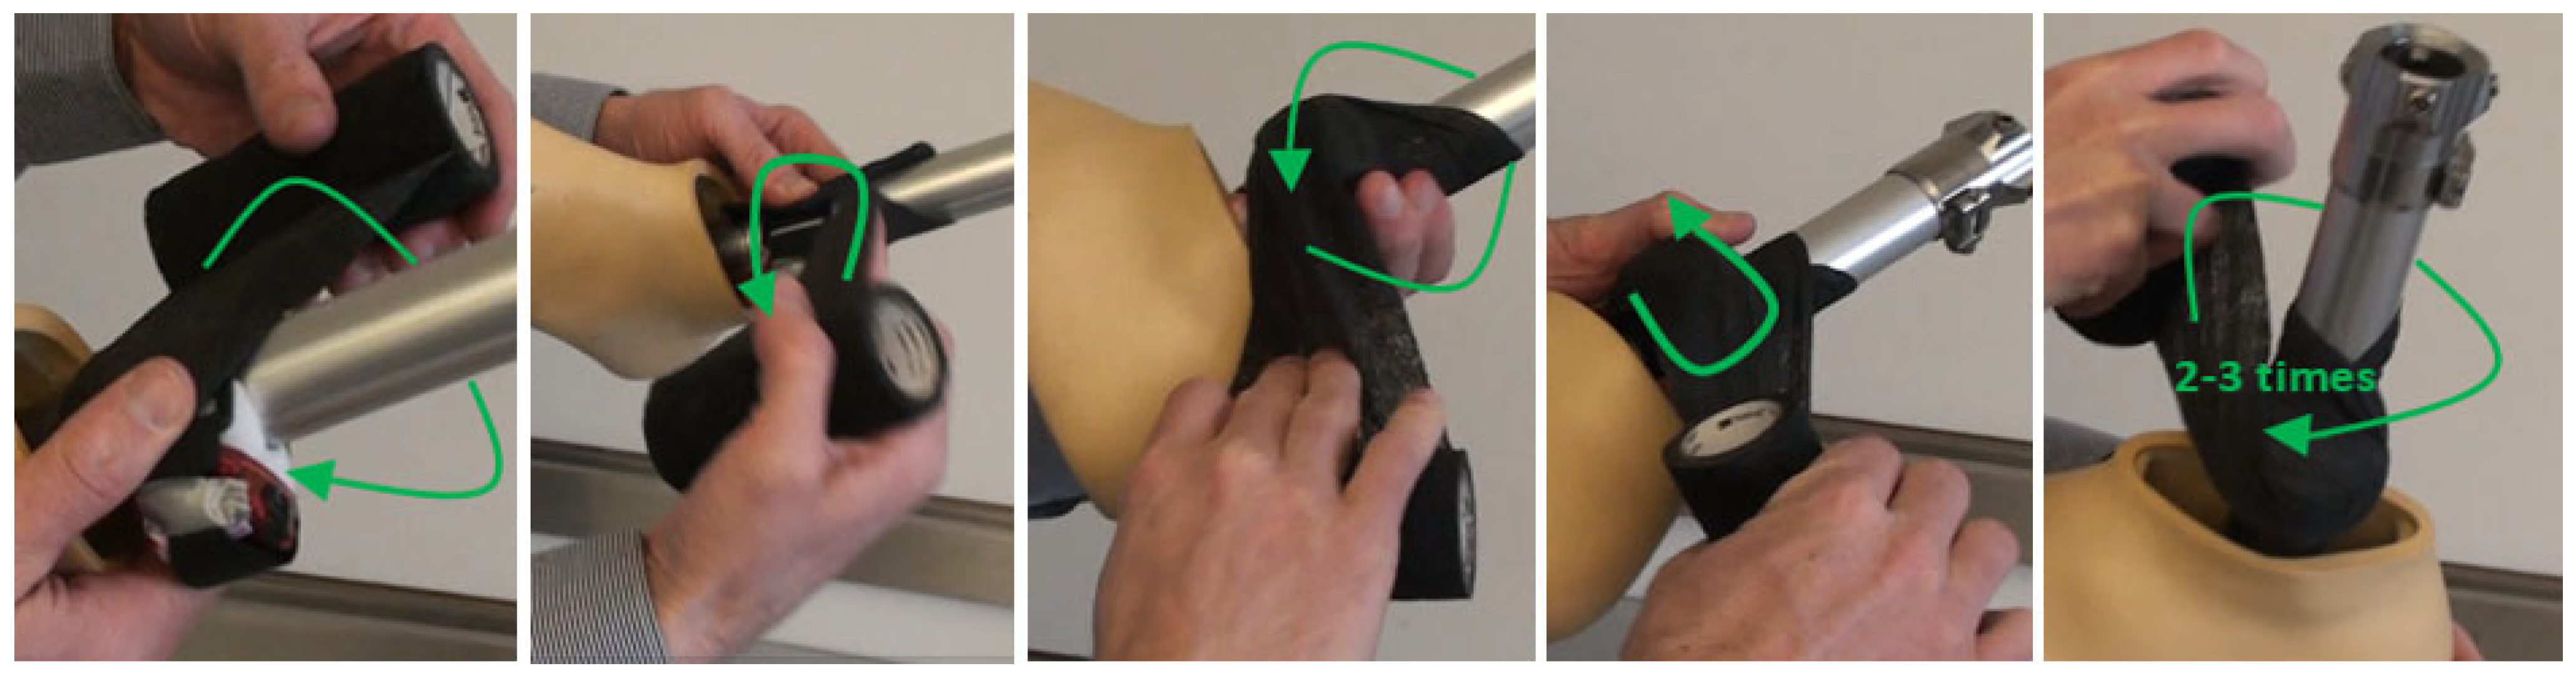
Appendix B. Attaching the Activity Monitor to the Liner

One Actilife Actigraph GR3X+ 3-axis accelerometer is potted in a flexible polymer that is then adhered to the proximal aspect of the participant’s liner. The other Actigraph is fastened to the prosthetic ankle. These procedures are described below.
We considered several potting materials, including Dragonskin 30 (a silicone), Vytaflex 10 (a low rigidity polyurethane), Vytaflex 50 (a high rigidity polyurethane), and PMC121/30 Dry (a medium rigidity polyurethane compound). The PMC121/30 Dry material outperformed the others and thus was used for potting.
To affix the Actigraphs, the researcher asks the participant to doff his or her prosthesis and liner/sleeve. The ActiGraph device is shown to the participant, and it is confirmed that the person is comfortable with this instrument being adhered to their liner/sleeve. It is also communicated that the device is not waterproof, only water resistant; when used properly, the ActiGraph is designed to be submersible in 1 m of water for up to 30 min. Still, the participant should avoid submerging it and exposing it directly to a stream of water. Normal daily activities are fine, but participants should avoid bathing with the liner/sleeve on, they should never submerge it if they clean the liner/sleeve, and they cannot swim with it. The following steps are completed in the order written.

Appendix B.1. Liner/Sleeve ActiGraph Attachment

The ActiGraph is attached to the anterior, proximal aspect of the prosthetic liner/sleeve and embedded in soft rubber in order to decrease the risk of damage to the liner/sleeves while improving comfort for the participant. Nitrile gloves should be worn during this process. Loctite 454 will quickly bond to the skin and is extremely difficult to remove. Also, the ActiGraph’s USB cap should be opened since it can be difficult to open once adhered to the liner/sleeve/prosthesis. The process is conducted as follows:
1. A cylindrical positive is inserted into the upper portion of the final fitted liner/sleeve. This is necessary for the liner/sleeve ActiGraph to maintain its contoured shape as the adhesive dries. This also helps the ActiGraph rest more comfortably on the participant’s thigh.
2. The site of attachment for the ActiGraph is located. The top of the ActiGraph should be about 2.54 cm from the top of the liner/sleeve, resting on the anterior aspect of the thigh and not over the knee. The site of attachment is outlined with marker and the location confirmed. Figure A2 demonstrates appropriate positioning and orientation.
3. The ActiGraph is oriented so that the USB port/black cap of the device is in the direction of the proximal end of the liner/sleeve.
4. Loctite adhesive is dispensed onto the bottom of the rubber that encases the ActiGraph. See Figure A3 for an ideal surface pattern. It is important to not apply excessive Loctite, as large pieces of the hardened glue can be uncomfortable and possibly damage the liner/sleeve.
5. In one confident motion, the Actigraph is pressed into the site of attachment. The cap of the ActiGraph should be oriented in the proximal direction. There is only one chance for this step, since the glue sticks instantly and is nearly impossible to remove. The Loctite is held for 2 min. While Loctite is an “instant” adhesive and physically bonds in seconds, additional time is necessary for the chemical bond to develop.
6. Loctite adhesive is applied to the free edges of a smooth glide fabric patch around the base of the ActiGraph (leaving 2.54 cm free on the center of the proximal side). Press each edge down with the tongue depressor for 30 s to ensure adequate bonding. If it is difficult to make the fabric patch adhere, more Loctite may need to be applied.
Figure A2. Correctly identified position for the liner/sleeve ActiGraph – about one inch below the anterior, proximal edge of the liner/sleeve.
Prosthesis 07 00053 g0a2
Figure A3. Loctite 454 glue pattern demonstrated with marker on the underside of the liner/sleeve ActiGraph. The rounded edges reduce risk of sharp glue edges damaging the liner/sleeve.
Prosthesis 07 00053 g0a3

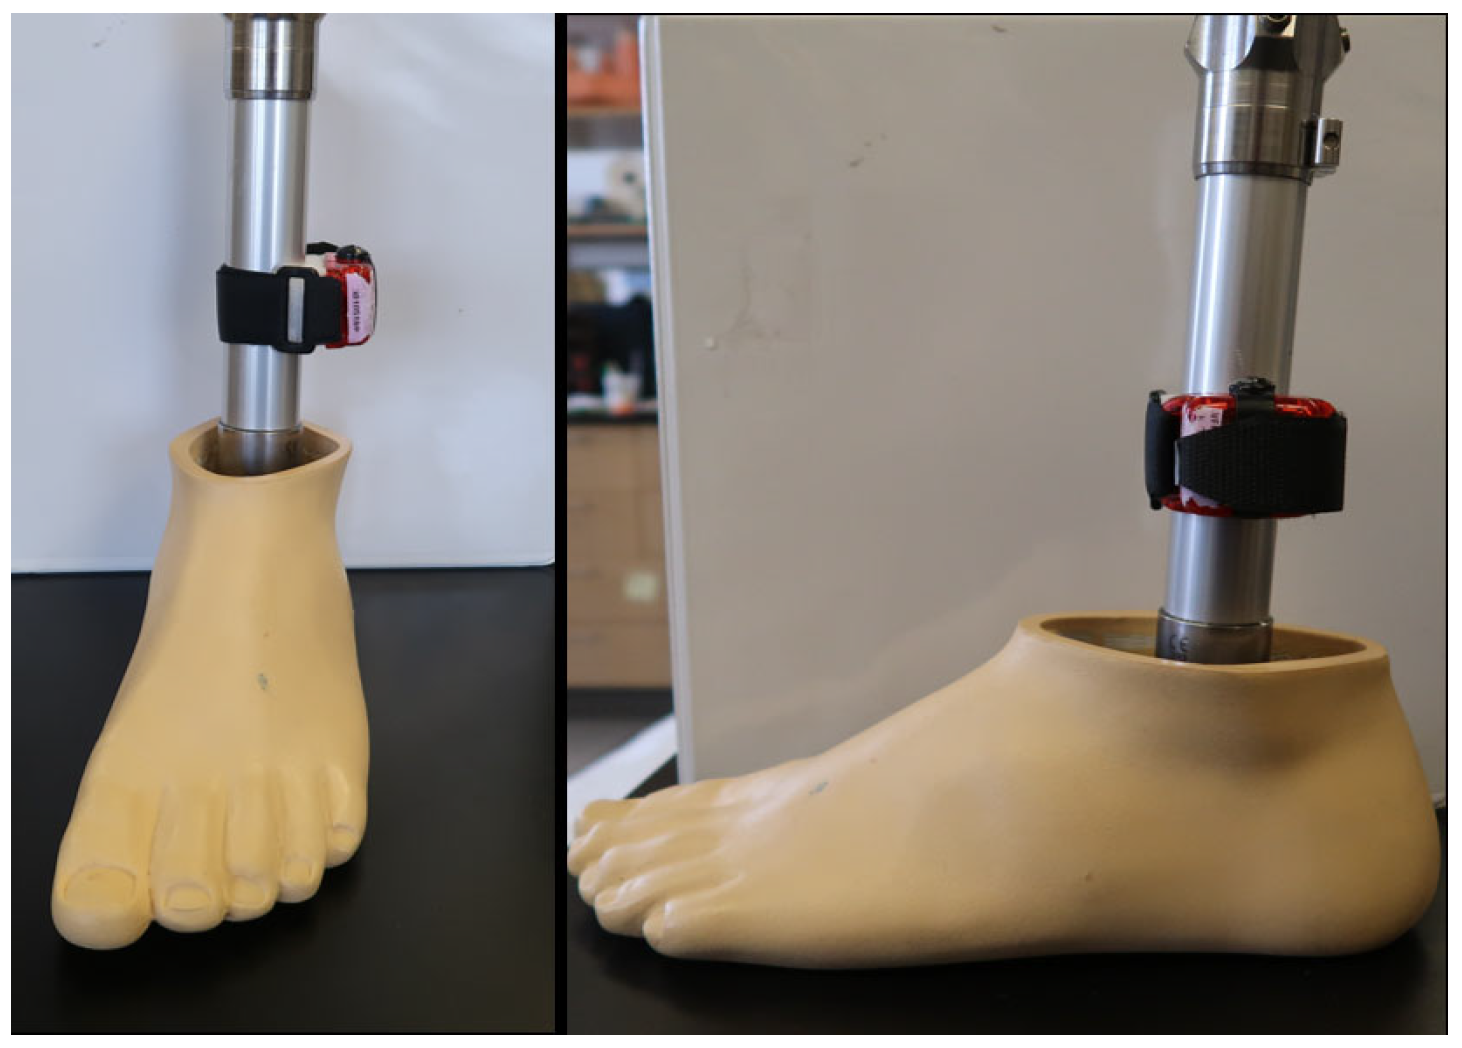
Appendix B.2. Ankle ActiGraph Attachment

1. The type of ankle pylon is identified. An ActiGraph is attached to the foam block that corresponds to the participant’s ankle type (Figure A4) using the FastCap adhesive.
2. The 3M Foam tape (3M 4016) is placed around the ankle pylon, and then the backing is peeled off.
3. The lateral aspect of the prosthetic ankle is located. The Actigraph must be upright (with the black cap proximal). Positioning and orientation are important—see Figure A5. The ActiGraph and foam padding are pressed into the adhesive tape.
Figure A4. ActiGraphs shown with different foam padding for cylindrical ankle pylons (left) and blade style prostheses (right).
Prosthesis 07 00053 g0a4
Figure A5. Ankle ActiGraph correct position for a left leg below-knee amputee cylindrical ankle pylon.
Prosthesis 07 00053 g0a5
4. The Velcro strap is wrapped tightly around the ankle, through the plastic slot on the opposite side of the ActiGraph, and then back over itself, securing it. It may need to be wrapped around an extra time.
5. The ActiGraph and pylon are wrapped with medical wrap, beginning adjacent to the ActiGraph (Figure A6), then going around the prosthetic pylon. The medical wrap should be looped around the ActiGraph, re-wrapping in the opposite direction from the start. The same process is repeated. Having crossed back twice, the medical wrap is wrapped around a few more times, then cut and pressed once until it is adequately secured.
6. With the ActiGraph operating, the reference position for the ankle ActiGraph is established. The entire prosthesis is picked up rotated 360° along the longitudinal axis, then set back down so it is standing vertically (Figure A5). After 20 s, this process is repeated twice more. The reference position is quantified as part of the data processing.
7. The prosthesis and liner/sleeve are returned to the participant.
Figure A6. Sequential steps to wrap ankle pylon (left to right). Wrap very tightly in order to secure it. If the ActiGraph rotates about the pylon during the study, it can affect the quality of the activity data.
Prosthesis 07 00053 g0a6

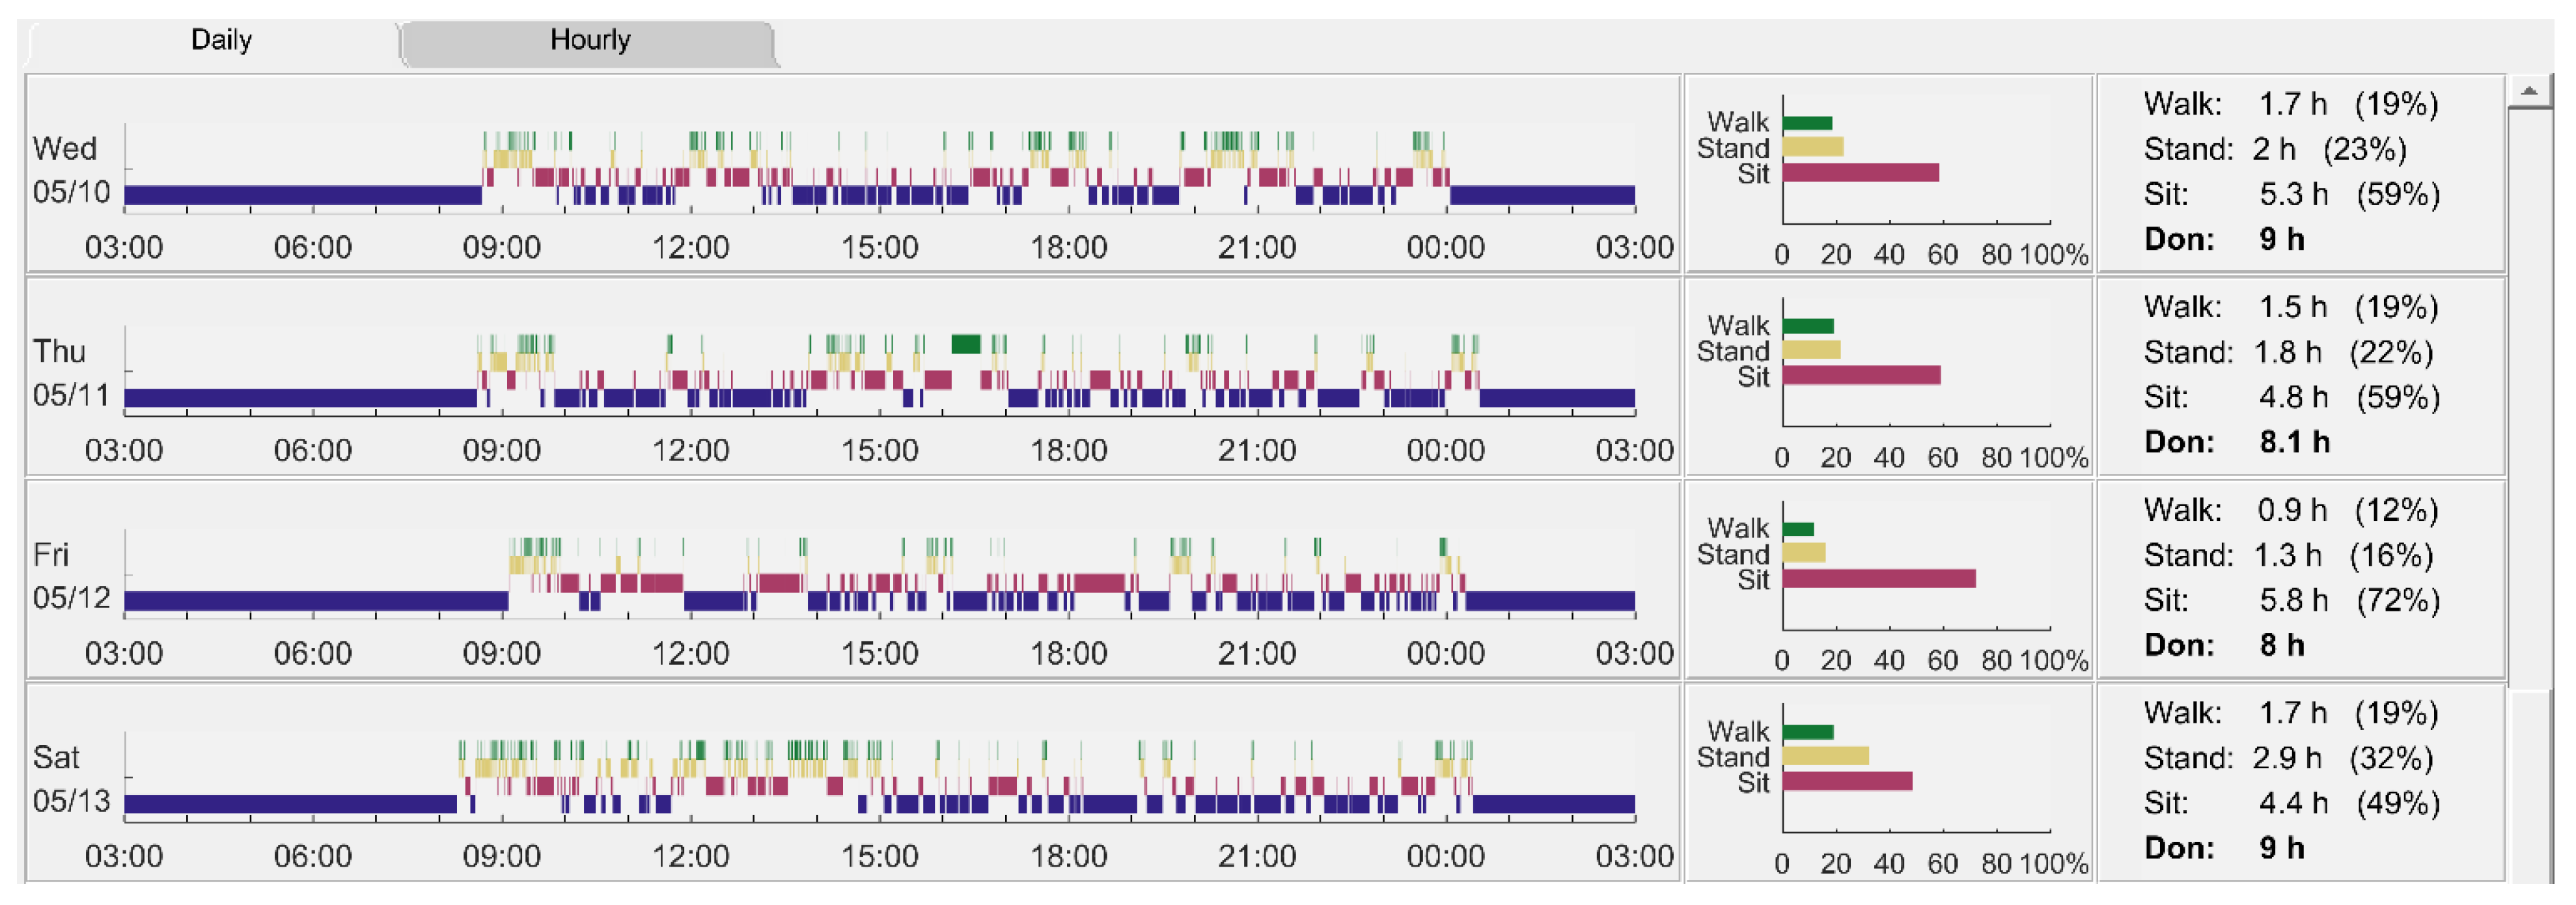
Appendix C. Example Visual Display of Activity Data

Figure A7. Example activity data from four days of prosthesis use. The left panel shows walk (green), stand (yellow), and sit (red) activity over time. The middle panel horizontal bar graphs show the percentage of prosthesis day time spent conducting the different activities.
Prosthesis 07 00053 g0a7

References

  1. Legro, M.W.; Reiber, G.; del Aguila, M.; Ajax, M.J.; Boone, D.A.; Larsen, J.A.; Smith, D.G.; Sangeorzan, B. Issues of importance reported by persons with lower limb amputations and prostheses. J. Rehabil. Res. Dev. 1999, 36, 155–163. [Google Scholar]
  2. Turner, S.; Gregor, A.H. Perceived effect of socket fit on major lower limb prosthetic rehabilitation: A clinician and amputee perspective. Arch. Rehabil. Res. Clin. Transl. 2020, 2, 100059. [Google Scholar] [CrossRef] [PubMed]
  3. Sanders, J.E.; Allyn, K.J.; Harrison, D.S.; Myers, T.R.; Ciol, M.A.; Tsai, E.C. Preliminary investigation of residual-limb fluid volume changes within one day. J. Rehabil. Res. Dev. 2012, 49, 1467–1478. [Google Scholar] [CrossRef] [PubMed]
  4. Sanders, J.E.; Youngblood, R.T.; Hafner, B.J.; Ciol, M.A.; Allyn, K.J.; Gardner, D.; Cagle, J.C.; Redd, C.B.; Dietrich, C.R. Residual limb fluid volume change and volume accommodation: Relationships to activity and self-report outcomes in people with trans-tibial amputation. Prosthet. Orthot. Int. 2018, 42, 415–427. [Google Scholar] [CrossRef]
  5. Youngblood, R.T.; Hafner, B.J.; Allyn, K.J.; Cagle, J.C.; Hinrichs, P.; Redd, C.; Vamos, A.C.; Ciol, M.A.; Bean, N.; Sanders, J.E. Effects of activity intensity, time, and intermittent doffing on daily limb fluid volume change in people with transtibial amputation. Prosthet. Orthot. Int. 2019, 43, 28–38. [Google Scholar] [CrossRef]
  6. Díaz, N.; Galván Duque, C.; Zavaleta, J.; Moreno, J. Impact of residual limb volume loss on socket internal pressures: A preliminary study. J. Prosthet. Orthot. 2023, 35, 106–113. [Google Scholar] [CrossRef]
  7. Sanders, J.E.; Moehring, M.A.; Rothlisberger, T.M.; Phillips, R.H.; Hartley, T.; Dietrich, C.R.; Redd, C.B.; Gardner, D.W.; Cagle, J.C. A bioimpedance analysis platform for amputee residual limb assessment. IEEE Trans. Biomed. Eng. 2016, 63, 1760–1770. [Google Scholar] [CrossRef]
  8. Hinrichs, P.; Cagle, J.C.; Sanders, J.E. A portable bioimpedance instrument for monitoring residual limb fluid volume in people with transtibial limb loss: A technical note. Med. Eng. Phys. 2019, 68, 101–107. [Google Scholar] [CrossRef]
  9. Sanders, J.E.; Rogers, E.L.; Abrahamson, D.C. Assessment of residual-limb volume change using bioimpedence. J. Rehabil. Res. Dev. 2007, 44, 525–535. [Google Scholar] [CrossRef]
  10. Joan, E.S.; Timothy, R.M.; Katheryn, J.A.; Daniel, S.H. Clinical utility of in-socket residual limb volume change measurement: Case study results. Prosthet. Orthot. Int. 2009, 33, 378–390. [Google Scholar]
  11. Sanders, J.E.; Cagle, J.C.; Allyn, K.J.; Harrison, D.S.; Ciol, M.A. How do walking, standing, and resting influence transtibial amputee residual limb fluid volume? J. Rehabil. Res. Dev. 2014, 51, 201–212. [Google Scholar] [CrossRef] [PubMed]
  12. Sanders, J.E.; Severance, M.R.; Swartzendruber, D.L.; Allyn, K.J.; Ciol, M.A. Influence of prior activity on residual limb volume and shape measured using plaster casting: Results from individuals with transtibial limb loss. J. Rehabil. Res. Dev. 2013, 50, 1007–1016. [Google Scholar] [CrossRef]
  13. McLean, J.B.; Redd, C.B.; Larsen, B.G.; Garbini, J.L.; Brzostowski, J.T.; Hafner, B.J.; Sanders, J.E. Effects of socket size on metrics of socket fit in trans-tibial prosthesis users. Med. Eng. Phys. 2017, 44, 32–43. [Google Scholar]
  14. Larsen, B.G.; McLean, J.B.; Allyn, K.J.; Brzostowski, J.T.; Garbini, J.L.; Sanders, J.E. How does adding and removing liquid from socket bladders affect residual-limb fluid volume? J. Rehabil. Res. Dev. 2013, 50, 845–860. [Google Scholar]
  15. Sanders, J.E.; Redd, C.B.; Cagle, J.C.; Hafner, B.J.; Gardner, D.; Allyn, K.J.; Harrison, D.S.; Ciol, M.A. Preliminary evaluation of a novel bladder-liner for facilitating residual limb fluid volume recovery without doffing. J. Rehabil. Res. Dev. 2016, 53, 1107–1120. [Google Scholar] [CrossRef]
  16. McLean, J.B.; Redd, C.B.; Larsen, B.G.; Garbini, J.L.; Brzostowski, J.T.; Hafner, B.J.; Sanders, J.E. Socket size adjustments in people with transtibial amputation: Effects on residual limb fluid volume and limb-socket distance. Clin. Biomech. 2019, 63, 161–171. [Google Scholar] [CrossRef]
  17. Larsen, B.G.; McLean, J.B.; Allyn, K.J.; Brzostowski, J.T.; Garbini, J.L.; Sanders, J.E. How do transtibial residual limbs adjust to intermittent incremental socket volume changes? Prosthet. Orthot. Int. 2019, 43, 528–539. [Google Scholar] [CrossRef]
  18. Ballesteros, D.; Youngblood, R.T.; Vamos, A.C.; Garbini, J.L.; Allyn, K.J.; Hafner, B.J.; Larsen, B.G.; Ciol, M.A.; Friedly, J.L.; Sanders, J.E. Cyclic socket enlargement and reduction during walking to minimize limb fluid volume loss in transtibial prosthesis users. Med. Eng. Phys. 2022, 103, 103787. [Google Scholar] [CrossRef]
  19. Weathersby, E.J.; Vamos, A.C.; Larsen, B.G.; McLean, J.B.; Carter, R.V.; Allyn, K.J.; Ballesteros, D.; Wang, H.; deGrasse, N.S.; Friedly, J.L.; et al. Performance of an auto-adjusting prosthetic socket during walking with intermittent socket release. J. Rehabil. Assist. Technol. 2022, 9, 20556683221093271. [Google Scholar] [CrossRef]
  20. Brian, L.; McLean, J.; Redd, C.; Brzostowski, J.; Allyn, K.; Sanders, J. How do socket size adjustments during ambulation affect residual limb fluid volume? Case study results. J. Prosthet. Orthot. 2019, 31, 58–66. [Google Scholar]
  21. Sanders, J.E.; Harrison, D.S.; Allyn, K.J.; Myers, T.R.; Ciol, M.A.; Tsai, E.C. How do sock ply changes affect residual-limb fluid volume in people with transtibial amputation? J. Rehabil. Res. Dev. 2012, 49, 241–256. [Google Scholar] [CrossRef] [PubMed]
  22. Medicare Region C Durable Medical Equipment Prosthetics Orthotic Supplier (DMEPOS) Manual; Palmetto GBA: Columbia, SC, USA, 2005; pp. 53.5–53.6.
  23. Gardner, D.W.; Redd, C.B.; Cagle, J.C.; Hafner, B.J.; Sanders, J.E. Monitoring prosthesis user activity and doffing using an activity monitor and proximity sensors. J. Prosthet. Orthot. 2016, 28, 68–77. [Google Scholar] [CrossRef]
  24. Redfield, M.T.; Cagle, J.C.; Hafner, B.J.; Sanders, J.E. Classifying prosthetic use via accelerometry in persons with transtibial amputations. J. Rehabil. Res. Dev. 2013, 50, 1201–1212. [Google Scholar] [CrossRef]
  25. Legro, M.W.; Reiber, G.D.; Smith, D.G.; Aguila, M.; Larsen, J.; Boone, D. Prosthesis evaluation questionnaire for persons with lower limb amputations: Assessing prosthesis-related quality of life. Arch. Phys. Med. Rehabil. 1998, 79, 931–938. [Google Scholar] [CrossRef]
  26. Morgan, S.J.; Askew, R.L.; Hafner, B.J. Measurements of best, worst, and average socket comfort are more reliable than current socket comfort in established lower limb prosthesis users. Arch. Phys. Med. Rehabil. 2022, 103, 1201–1204. [Google Scholar] [CrossRef]
  27. Hanspal, R.S.; Fisher, K.; Nieveen, R. Prosthetic socket fit comfort score. Disabil. Rehabil. 2003, 25, 1278–1280. [Google Scholar] [CrossRef]
  28. De Lorenzo, A.; Andreoli, A.; Matthie, J.; Withers, P. Predicting body cell mass with bioimpedance by using theoretical methods: A technological review. J. Appl. Physiol. 1997, 82, 1542–1558. [Google Scholar] [CrossRef]
  29. Fenech, M.; Jaffrin, M.Y. Extracellular and intracellular volume variations during postural change measured by segmental and wrist-ankle bioimpedance spectroscopy. IEEE Trans. Biomed. Eng. 2004, 51, 166–175. [Google Scholar] [CrossRef]
  30. Hanai, T. Electrical Properties of Emulsions; Sherman, P., Ed.; Academic Press: London, UK, 1968. [Google Scholar]
  31. Grimnes, S.; Martinsen, Ø.G. Bioimpedance and Bioelectricity Basics; Academic Press: San Diego, CA, USA, 2000; Available online: http://site.ebrary.com/id/10206346 (accessed on 10 January 2024).
  32. Amputee Coalition. About Body Mass Index (BMI). 2016. Available online: https://amputee-coalition.org/ (accessed on 21 April 2021).
  33. Mertens, J.C.; Brzostowski, J.T.; Vamos, A.; Allyn, K.J.; Hafner, B.J.; Friedly, J.L.; DeGrasse, N.S.; Ballesteros, D.; Krout, A.; Larsen, B.G.; et al. A novel portable sensor to monitor bodily positions and activities in transtibial prosthesis users. Clin. Biomech. 2022, 99, 105741. [Google Scholar] [CrossRef]
  34. DeGrasse, N.S.; Mertens, J.C.; Brzostowski, J.T.; Allyn, K.J.; Vamos, A.C.; Krout, A.J.; Hafner, B.J.; Garbini, J.L.; Sanders, J.E. Beyond step counts: Including wear time in prosthesis use assessment for lower-limb amputation. J. Rehabil. Assist. Technol. Eng. 2023, 10, 20556683231163337. [Google Scholar] [CrossRef]
  35. Levine, J.A.; Schleusner, S.J.; Jensen, M.D. Energy expenditure of nonexercise activity. Am. J. Clin. Nutr. 2000, 72, 1451–1454. [Google Scholar] [CrossRef] [PubMed]
  36. Fox, S.; Haskell, W. The exercise stress test: Needs for standardization. In Cardiology: Current Topics and Progress. 6; Academic Press: New York, NY, USA, 1970; pp. 149–154. [Google Scholar]
  37. Lanahan, C.R.; Coburn, K.A.; Hafner, B.J.; Ballesteros, D.; Allyn, K.J.; Friedly, J.L.; Carter, R.V.; Mertens, J.C.; Krout, A.J.; Sanders, J.E. Normalizing variance of self-selected effort. J. Prosthet. Orthot. 2025. submitted. [Google Scholar]
Figure 1. Diagram of a residual limb instrumented with electrodes ready for data collection. A proximal current injection electrode is positioned on the thigh, and two anterior voltage-sensing electrodes and two posterior voltage-sensing electrodes are placed on the residual limb. The distal current injection electrode is on the inferior aspect of the residual limb.
Prosthesis 07 00053 g001
Figure 2. Flow diagram of the study.
Prosthesis 07 00053 g002
Figure 3. Structured protocol. Activities conducted during the morning session, intersession, and afternoon session are shown.
Prosthesis 07 00053 g003
Figure 4. Example limb fluid volume data from one sit/stand/walk cycle during an in-laboratory test session. Sit, stand, and walk segments are shown. Rest is the difference in fluid volume during standing from before to after the sit (A–B).
Prosthesis 07 00053 g004
Figure 5. ESCSave scores for all participants. Dark bars indicate socket replacement. Light bars indicate socket modification. (a) ESCSave results sorted by post-treatment minus pre-treatment score difference, shown at the top of the figure. (b) ESCSave results sorted by initial score, shown at the top of the figure.
Prosthesis 07 00053 g005
Figure 6. Residual limb fluid volume change post- minus pre-modification. (a) Anterior region. (b) Posterior region. (c) Mean differences in fluid volume change for participants with an ESCSave post-pre difference ≥2 and participants with an ESCSave post-pre difference <2. Light-color bars indicate data from participants with a post-pre modification ESCSave ≥ 2. Dark-color bars indicate data from participants with a post-pre modification ESCSave < 2.
Prosthesis 07 00053 g006
Figure 7. Percentage limb fluid volume results. Pre- and post-treatment pairs for (a) the anterior region and (b) the posterior region. The first point of each pair shows pre-treatment data and the second point shows post-treatment data.
Prosthesis 07 00053 g007
Figure 8. Example limb fluid volume results for clinical visualization. Participant 3. Blue and green numbers above and below the data plots indicate percentage fluid volume change. Upper panel: Red arrows indicate an AM or PM session fluid volume loss. Green arrows indicate an AM or PM session fluid volume gain. * = prosthesis doffed. Lower panel: Arrows indicate direction of fluid volume change for Cycle 1 (yellow), Cycle 2 (blue), and Cycle 3 (green). Bottom three graphs: Percent fluid volume change by cycle for posterior and anterior regions, and percent fluid volume change by activity during the intersession.
Prosthesis 07 00053 g008
Table 1. Intersession active use protocol selections based on 2-week take-home monitoring data.
Mean Measured Active Use Time
per Prosthesis Day (Recorded for ~2 wk)
Active Use Time Implemented
During Intersession Testing Protocol
<11.0%5%
11.0–15.9%11%
16.0–20.9%16%
>21.0%21%
Table 2. Participant demographic information.
CharacteristicDescription of Sample
Gender12 Male, 2 Female
Age (y)Median 46, Range 26 to 70
Time since amputation (y)Median 7, Range 2 to 43
BMI [32]Median 29, Range 22 to 41
MFCL9 K3 (unlimited community ambulator), 5 K4 (active adult)
Residual Limb Length (cm)Median 15.6, Range 9.0 to 17.0
Etiology9 Trauma, 2 Infection following Trauma, 3 Non-Trauma Infection
Residual limb Shape11 Cylindrical, 1 Conical, 2 Bulbous
Co-Morbidities4 Diabetic, 7 High Blood Pressure, 3 Vascular Disease
Tobacco Products6 Users
Table 3. Prosthesis modifications. Socket ΔV is the difference in socket volume post-modification minus pre-modification. NA = not available. PTB = patellar tendon bearing. TSB = total surface bearing. Socket ΔV = Final—initial socket volume, as a percentage of the initial socket volume.
Participant #SocketDescription of Socket ModificationSocket ΔV
2NewChanged from PTB to Hybrid PTB/TSB, smaller socket, new liner (from Alpha hybrid to Alpha Classic M+)1.6%
3ModModified socket to reduce brim height and added more padding; ground out crest of tibia, fibular head; new pads in distal endNA
6ModChanged sock ply because of fit issues—no new socketNA
7NewSocket replaced. Old socket had a poor fit and a large posterior pad; new socket did not0.1%
9NewChanged from a PTB to a TSB socket—new socket has no PTB contours but no discernable TSB characteristics that indicated suction; both pylons (bilateral amputations) lengthened 6 cm13.2%
11NewChanged from a PTB socket with a flexible inner liner and pin-lock suspension to a TSB with a 1-way valve and sleeve. Changed from an Alpha Classic to an Alpha Hybrid Cushion M liner5.0%
12ModSocket shape changed by lowering posterior trimlines; new foot. Added a 1-way valve to a Seal-In V liner. Changed from a Cheetah foot to a Multiaxis Aeris Performance 2 footNA
13NewChanged from a TSB+PTB hybrid to a TSB with flexible inner liner. Added an Ossur Iceross Seal In to an Ossur Proflex Foot and mechanical vacuum−2.5%
14NewChanged to a smaller socket (about 8-ply reduction). Added a flexible inner liner−1.0%
15ModChanged from a SmartTemp Liner to an Alpha liner (ΔV= −2.3%)NA
16NewChanged from a TSB with flexible inner liner suction socket to a TSB with foam inner (supracondylar suspension). Changed from an Ossur Seal In X to no linerNA
17ModChanged socket. Medial brim trimmed because of irritation there. Changed from a Renegade Freedom Innovations foot to an Endolite Javelin foot0.4%
18NewChanged from a 1-way valve suspension, liner and sleeve, and energy storage and return foot to a locking pin socket with a modified Cheetah foot directly attached to a carbon-fiber socket1.5%
19NewChanged from a flexible inner socket suspension sleeve, cushion liner with locking pin and an Eschelon foot (Endolite) to a flexible inner socket, liner with locking pin suspension and a RUSH foot−5.6%
Disclaimer/Publisher’s Note: The statements, opinions and data contained in all publications are solely those of the individual author(s) and contributor(s) and not of MDPI and/or the editor(s). MDPI and/or the editor(s) disclaim responsibility for any injury to people or property resulting from any ideas, methods, instructions or products referred to in the content.

