Article

AI-Enhanced Analysis to Investigate the Feasibility of EMG Signals for Prosthetic Hand Force Control Incorporating Anthropometric Measures

1
Department of Mechanical Engineering, School of Engineering (SoE), Shiv Nadar Institution of Eminence, Deemed to Be University, Delhi 201314, India
2
HCL Technologies, Grandeur 8, Singapore 567747, Singapore
3
Amity Centre for Artificial Intelligence, Amity University, Noida 201301, India
*
Author to whom correspondence should be addressed.
Prosthesis 2024, 6(6), 1459-1478; https://doi.org/10.3390/prosthesis6060106
Submission received: 11 October 2024 / Revised: 15 November 2024 / Accepted: 27 November 2024 / Published: 2 December 2024

Abstract

Background/Objectives: The potential application of electromyography (EMG) as a method for precise force control in prosthetic devices is investigated, expanding on its traditional use in gesture detection. Variability in EMG signals among individuals is influenced by physiological factors such as muscle mass, body fat percentage, and subcutaneous fat, as well as demographic variables like age, gender, height, and weight. This study aims to evaluate how these factors impact EMG signal quality and force output. Methods: EMG data was normalized using the maximum voluntary contraction (MVC) method, recorded at 100%, 50%, and 25% of MVC with simultaneous grip force measurement. Physiological parameters, including fat percentage, subcutaneous fat, and muscle mass, were analyzed. An extreme gradient boosting algorithm was applied to model the relationship between EMG amplitude and grip force. Results: The findings demonstrated significant linear correlations, with r2 coefficients reaching up to 0.93 and 0.83 in most cases. Muscle mass and fat levels were identified as key determinants of EMG variability, with significance coefficients ranging from 0.36592 to 0.0856 for muscle mass and 0.281918 to 0.06001 for fat levels. Conclusions: These results underscore the potential of EMG to enhance force control in prosthetic limbs, particularly in tasks such as grasping, holding, and releasing objects. Incorporating body composition factors into EMG-based prediction algorithms offers a refined approach to improving the precision and functionality of prosthetic control systems for complex motor tasks.

1. Introduction

Electromyography or EMG is a technique for measuring and recording the electrical activity generated by skeletal muscles [1,2]. An EMG signal represents the electrical activity of the muscles and can be used to measure the degree of muscle activation [3]. In the decision-making process of prosthetic and robotic hands, EMG signals are used to sense the user’s intent to move their hand and to direct the movements of the prosthetic or robotic hand [4]. Surface EMG electrodes are placed on the skin over the muscles that coordinate the hand [5], and the electrical impulses are analyzed to identify the user’s envisaged motions. These neurological signals are then used to direct the motions of the prosthetic or robotic hand in a way that replicates the user’s natural hand movements [6]. The EMG-based control of prosthetic and artificial hands has the added attribute of being a non-invasive technique that does not necessitate surgery or the insertion of sensors in muscles [7]. However, because EMG signals are susceptible to noise and interference, methods for signal processing must be implemented to retrieve the desired information from the signals [8].
EMG is a vital tool within biomedical engineering and neuroscience, facilitating the measurement and analysis of skeletal muscle electrical activity [9]. This technique offers a deep understanding of muscle functionality, performance, and neuromuscular control mechanisms. The process involves the generation of electrical signals, known as action potentials, due to muscle fiber depolarization upon contraction [10]. These signals propagate along muscle fibers, leading to detectable electrical activity on the skin surface.
In practice, EMG predominantly employs electrodes positioned on the skin above the target muscle for measurement [11]. These electrodes capture the electrical signals produced by muscle fibers during contractions. Surface EMG electrodes, preferred for their non-invasiveness, have extensive applications in clinical and research settings [12]. Invasive EMG, which necessitates the insertion of needle electrodes directly into the muscle, offers more precise recordings but is generally reserved for specialized clinical investigations. The detected electrical activity reflects the summation of action potentials originating from motor units within the muscle, where each unit comprises a motor neuron and the associated muscle fibers [13]. The activation of motor neurons triggers muscle contraction, accompanied by measurable electrical activity recorded by EMG.
The utilization of EMG extends beyond mere analysis; it enables users to manipulate prosthetic or robotic hands through muscle signals, closely resembling natural limb control [14,15]. This feature enhances the user experience and the ease of adoption. EMG signals provide real-time feedback, facilitating the immediate and precise control of prosthetic or robotic hands based on user intent. Moreover, EMG-based control systems exhibit adaptability to changes in muscle activity and user preferences, furnishing personalized and flexible control interfaces. Furthermore, EMG-based control systems offer enhanced prosthetic and robotic hand functionalities, including individual finger control, grasp force modulation, and coordinated movements. These advancements significantly enhance the dexterity and utility of such devices, catering to diverse user needs and preferences.
EMG has been used for the control of prosthetic hands [16] and robotic hands [17]. Hand gestures can be distinguished with the help of pattern recognition [18]. There are multiple AI algorithms with high accuracy for the prediction and control of the motion of the prosthetic hand [19]. Multiple discoveries have been made for the motion control of the prosthetic hand, which has come a long way in the control direction [8]. When it comes to force control, there have been alternative methods like force feedback control within the prosthetic hand [20] and force myography [21]. A sensor based on the principle of force myography has been designed, which extracts the force information based on the contraction of the forearm muscles [22]. In force feedback control, the mechanical hand acts as a closed-loop control system in which it adjusts its grip according to the feedback either given by the contact sensor placed at the palm of the mechanical hand [23] or based on the current draw of the motor [24]. A strategy has been devised to calculate the stiffness of the grabbed object by calculating the current draw of the driving motor while opening and closing the hand [20].
The domain of force feedback control in prosthetic and robotic hands encounters numerous encumbrances. Utilizing the motor’s current draw as a feedback mechanism mandates precise calibration, involves potential latency, and exhibits variability. The integration of force sensors provides precise feedback but poses challenges in terms of the system integration, calibration, and complexity. Force myography (FMG), an alternative to EMG, poses challenges in signal interpretation, is prone to ambiguity, and requires adaptation to individual users’ needs. Also, in these cases, the user cannot directly control the force produced by the prosthetic hand. It gives rise to the two-brain concept in which the device makes solitary decisions where the user is not directly in the loop. EMG has not been used for the direct control of a prosthetic hand because of the multiple factors affecting the quality of surface EMG [25]. In earlier studies, the moderate value of the EMG signals was utilized as a reference. Still, for different people, the EMG value could vary based on the person’s body composition.
The research gaps based on prior research work can be summarized as the following:
(a)
A lack of direct user control: the current force control mechanism hinders natural interaction by not allowing users to exert direct control over the force.
(b)
Neglecting influential factors: omitting factors such as the fat level and muscle mass undermines the accuracy of EMG-based control mechanisms.
(c)
Maintenance and durability concerns: regular maintenance and wear and tear impact the longevity of force feedback components, including contact and non-contact sensors.
(d)
Subjectivity in force feedback: customizable control options are necessary to cater to individual variances in force intensity, timing, and sensory preferences.
(e)
Power demands and device weight: the integration of force feedback mechanisms imposes power requirements and increases the weight of prosthetic devices, posing challenges to battery life and practicality.
(f)
Insufficient fine motor control: the existing force feedback control in prosthetic hands may not deliver the required precision for delicate manipulation and fine motor control tasks.
Some key terms like maximum voluntary contraction, muscle palpation, bioelectrical impedance analysis (BIA), and XGBoost used in this study are explained below to make them accessible and familiar for an adequate understanding of the study conducted.
The maximum voluntary contraction (MVC) represents the highest force an individual can exert with a muscle or muscle group, measured through standardized protocols [26]. In this study, the MVC is used to normalize EMG data, allowing for an accurate comparison across individuals with diverse body compositions [27]. Muscle palpation, a technique involving gentle pressure to identify specific muscles, is essential for precise electrode placement and improves the reliability of EMG signal capture by ensuring electrodes target the muscle groups responsible for grip strength [28,29]. Bioelectrical impedance analysis (BIA) is employed as a non-invasive method to assess body composition, measuring the body fat percentage and lean mass through impedance to a low electrical current [30]. BIA replaces traditional measurement methods such as skinfold measurement and circumference measurement, minimizing manual errors and providing consistent data on the body composition’s influence on EMG variability [31]. XGBoost, short for eXtreme Gradient Boosting, an advanced machine learning algorithm, is used to build a regression model linking the EMG signal strength and grip force. By optimizing the predictive accuracy with its gradient boosting and regularization techniques, XGBoost aids in identifying key physiological features impacting EMG-based force control in prosthetic applications [32,33].
This study examines the relationship between the grip force and electromyographic (EMG) signals to understand how different force levels affect EMG properties in individuals. The main contributions of this study are summarized as follows:
(a)
This study thoroughly examines the influence of body composition factors—such as the fat level, muscle mass, and subcutaneous fat—on EMG signal quality, identifying these as crucial parameters for accurate EMG-based control. Through bio-impedance analysis (BIA) for body fat measurement, the research minimizes manual errors, ensuring reliable inputs for the model. A regression model is developed to explore the correlations between EMG data, the force, and additional recorded features, enabling the identification and assessment of key variables.
(b)
By using EMG as the primary control mechanism, the approach reduces dependence on external sensors, which enhances durability and minimizes maintenance. Additionally, the study demonstrates that optional sensors can be selectively integrated for safety or specific adjustments, ensuring flexibility in control systems for prosthetic applications.
(c)
The maximum voluntary contraction (MVC) is used as a baseline, enabling consistent force control across diverse individuals. By investigating the EMG output at varied grip force levels, including 25% of the MVC, the study illustrates that, with training, users can achieve refined motor control even at low force levels, supporting realistic and adaptive control for prosthetic use.
The paper is organized as follows: Section 2 describes the details of the experimental setup and the complete methodology for the execution of the present study. The experimental results with a discussion are given in Section 3. Section 4 and Section 5 summarize the findings of this study and explore the possibility of future works.

2. Materials and Methods

An overview of the experimental procedure is presented in Figure 1, illustrating how the experimentation was conducted. The study was initiated by meticulously measuring and documenting the subject’s physiological parameters. To ensure precise electrode placement, muscle palpation was conducted. Subsequently, the signal recording was repeated iteratively, ensuring reliable and robust data collection. Then, the feedback was obtained from the subject and documented. Following that, all data points underwent thorough processing for subsequent analysis. A sophisticated regression model was then methodically developed to quantify the extent of interdependence among the selected parameters.

2.1. Experimental Setup

Prior to commencing the experiment, some key components were required. Firstly, an EMG system was essential for recording and analyzing the EMG signals. Additionally, a sensitive dynamometer was employed to enable the simultaneous monitoring of the grip force, ensuring even minor changes could be detected. A weight scale could be used to obtain accurate body measurements, while a more precise method with minimal error was sought for measuring the fat and muscle mass. Additionally, an ECG recording system was required for the experiment to monitor the subjects’ heart rates, ensuring their sustained state of relaxation throughout the examination. The instruments used in this study were the Muscle Spiker Box pro by Backyard Brains (Ann Arbor, Michigan, United States) (Figure 2a), digital hand dynamometer by Jammer (Figure 2b), Actofit Smart scale pro by Oxstren wearable technologies, and Kardia 6L (AliveCor, Gurugram, India). The country of origin of all the instruments was the United States of America, except the Smart Scale Pro, which originated in India.
The Smart scale pro (Figure 2) works on the principle of BIA [34]. BIA estimates body parameters like the fat level, skeletal muscle mass, subcutaneous fat, etc. In this method, a weak electrical current passed through the whole body generated by the scale and the measured voltage is used for the calculation of the impedance of the body. The fat mass in the body has a higher impedance than muscle mass. The scale has 8 sensitive electrodes which can analyze up to 24 compositions of the body. The muscle spiker box pro [35] has two channels. The sampling rate is 10 k (2 ch), the frequency range is 70–2500 Hz, and the muscle SNR (signal to noise ratio) is 30 dB. The hand dynamometer has a precision electrode load cell that allows for the measurement of force in the range of 0 to 90 kg. The Kardia 6L is a medical-grade electrocardiogram (ECG) device that can record and monitor the heart rate. It can record a 6-lead ECG reading. It has two electrodes on top for the placement of the fingers of each hand and one at the bottom connected to the skin of the left leg.

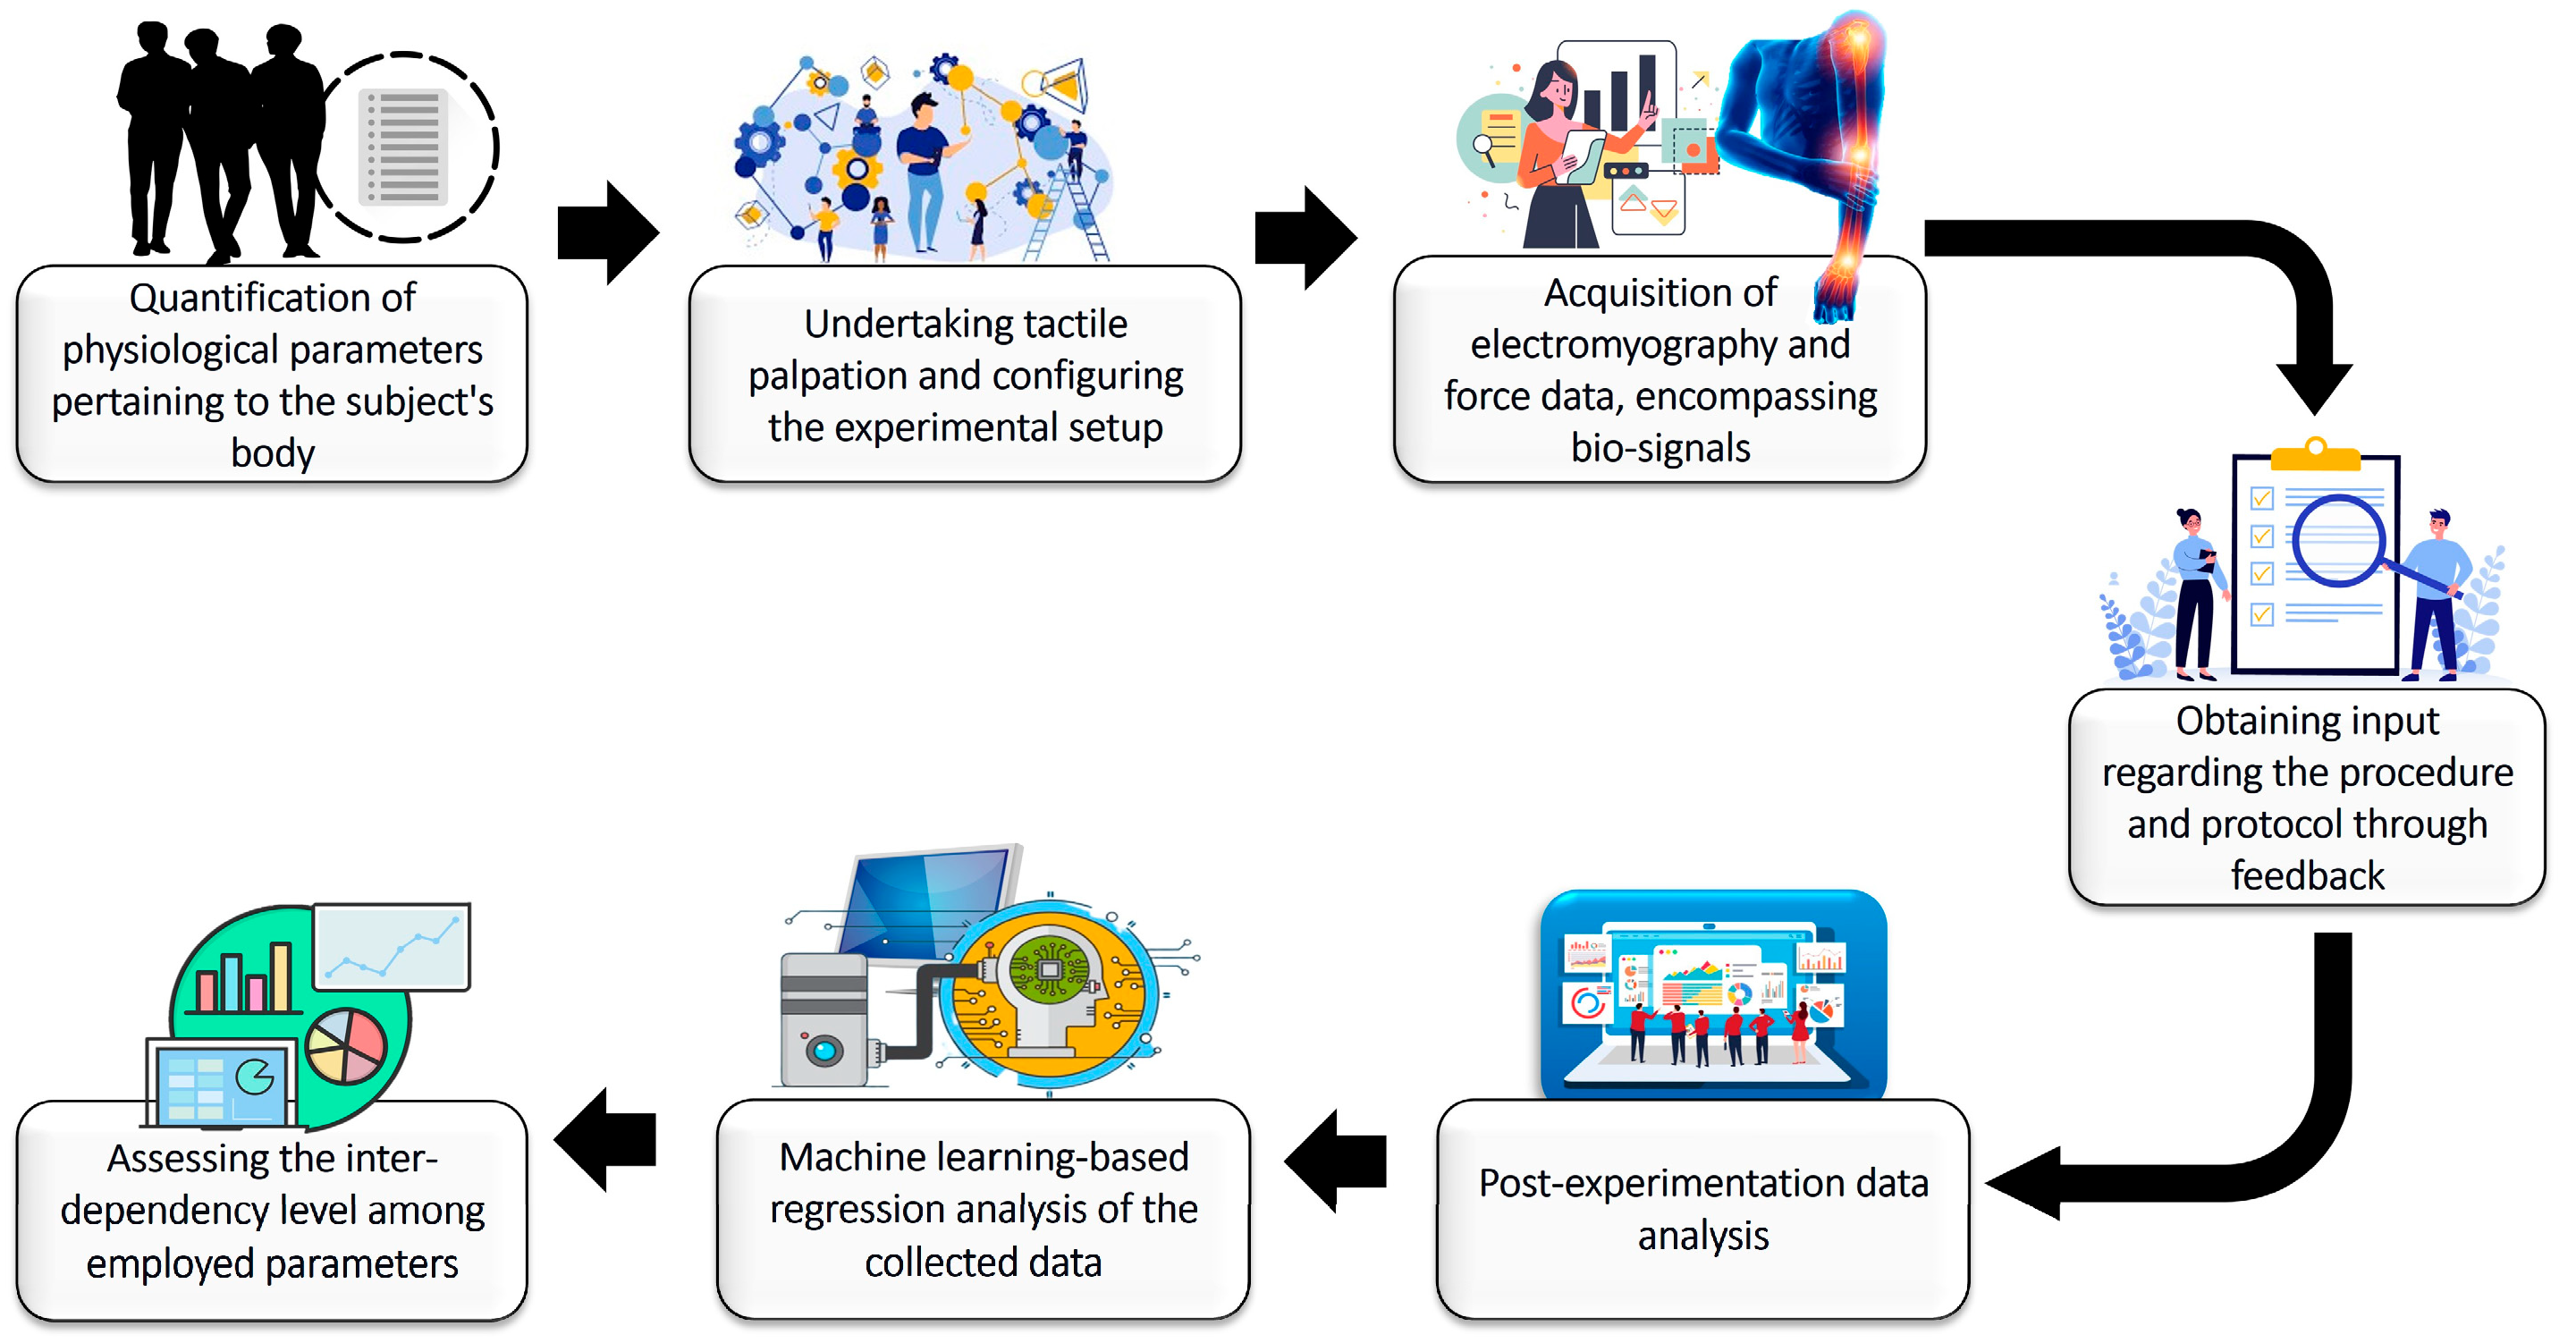
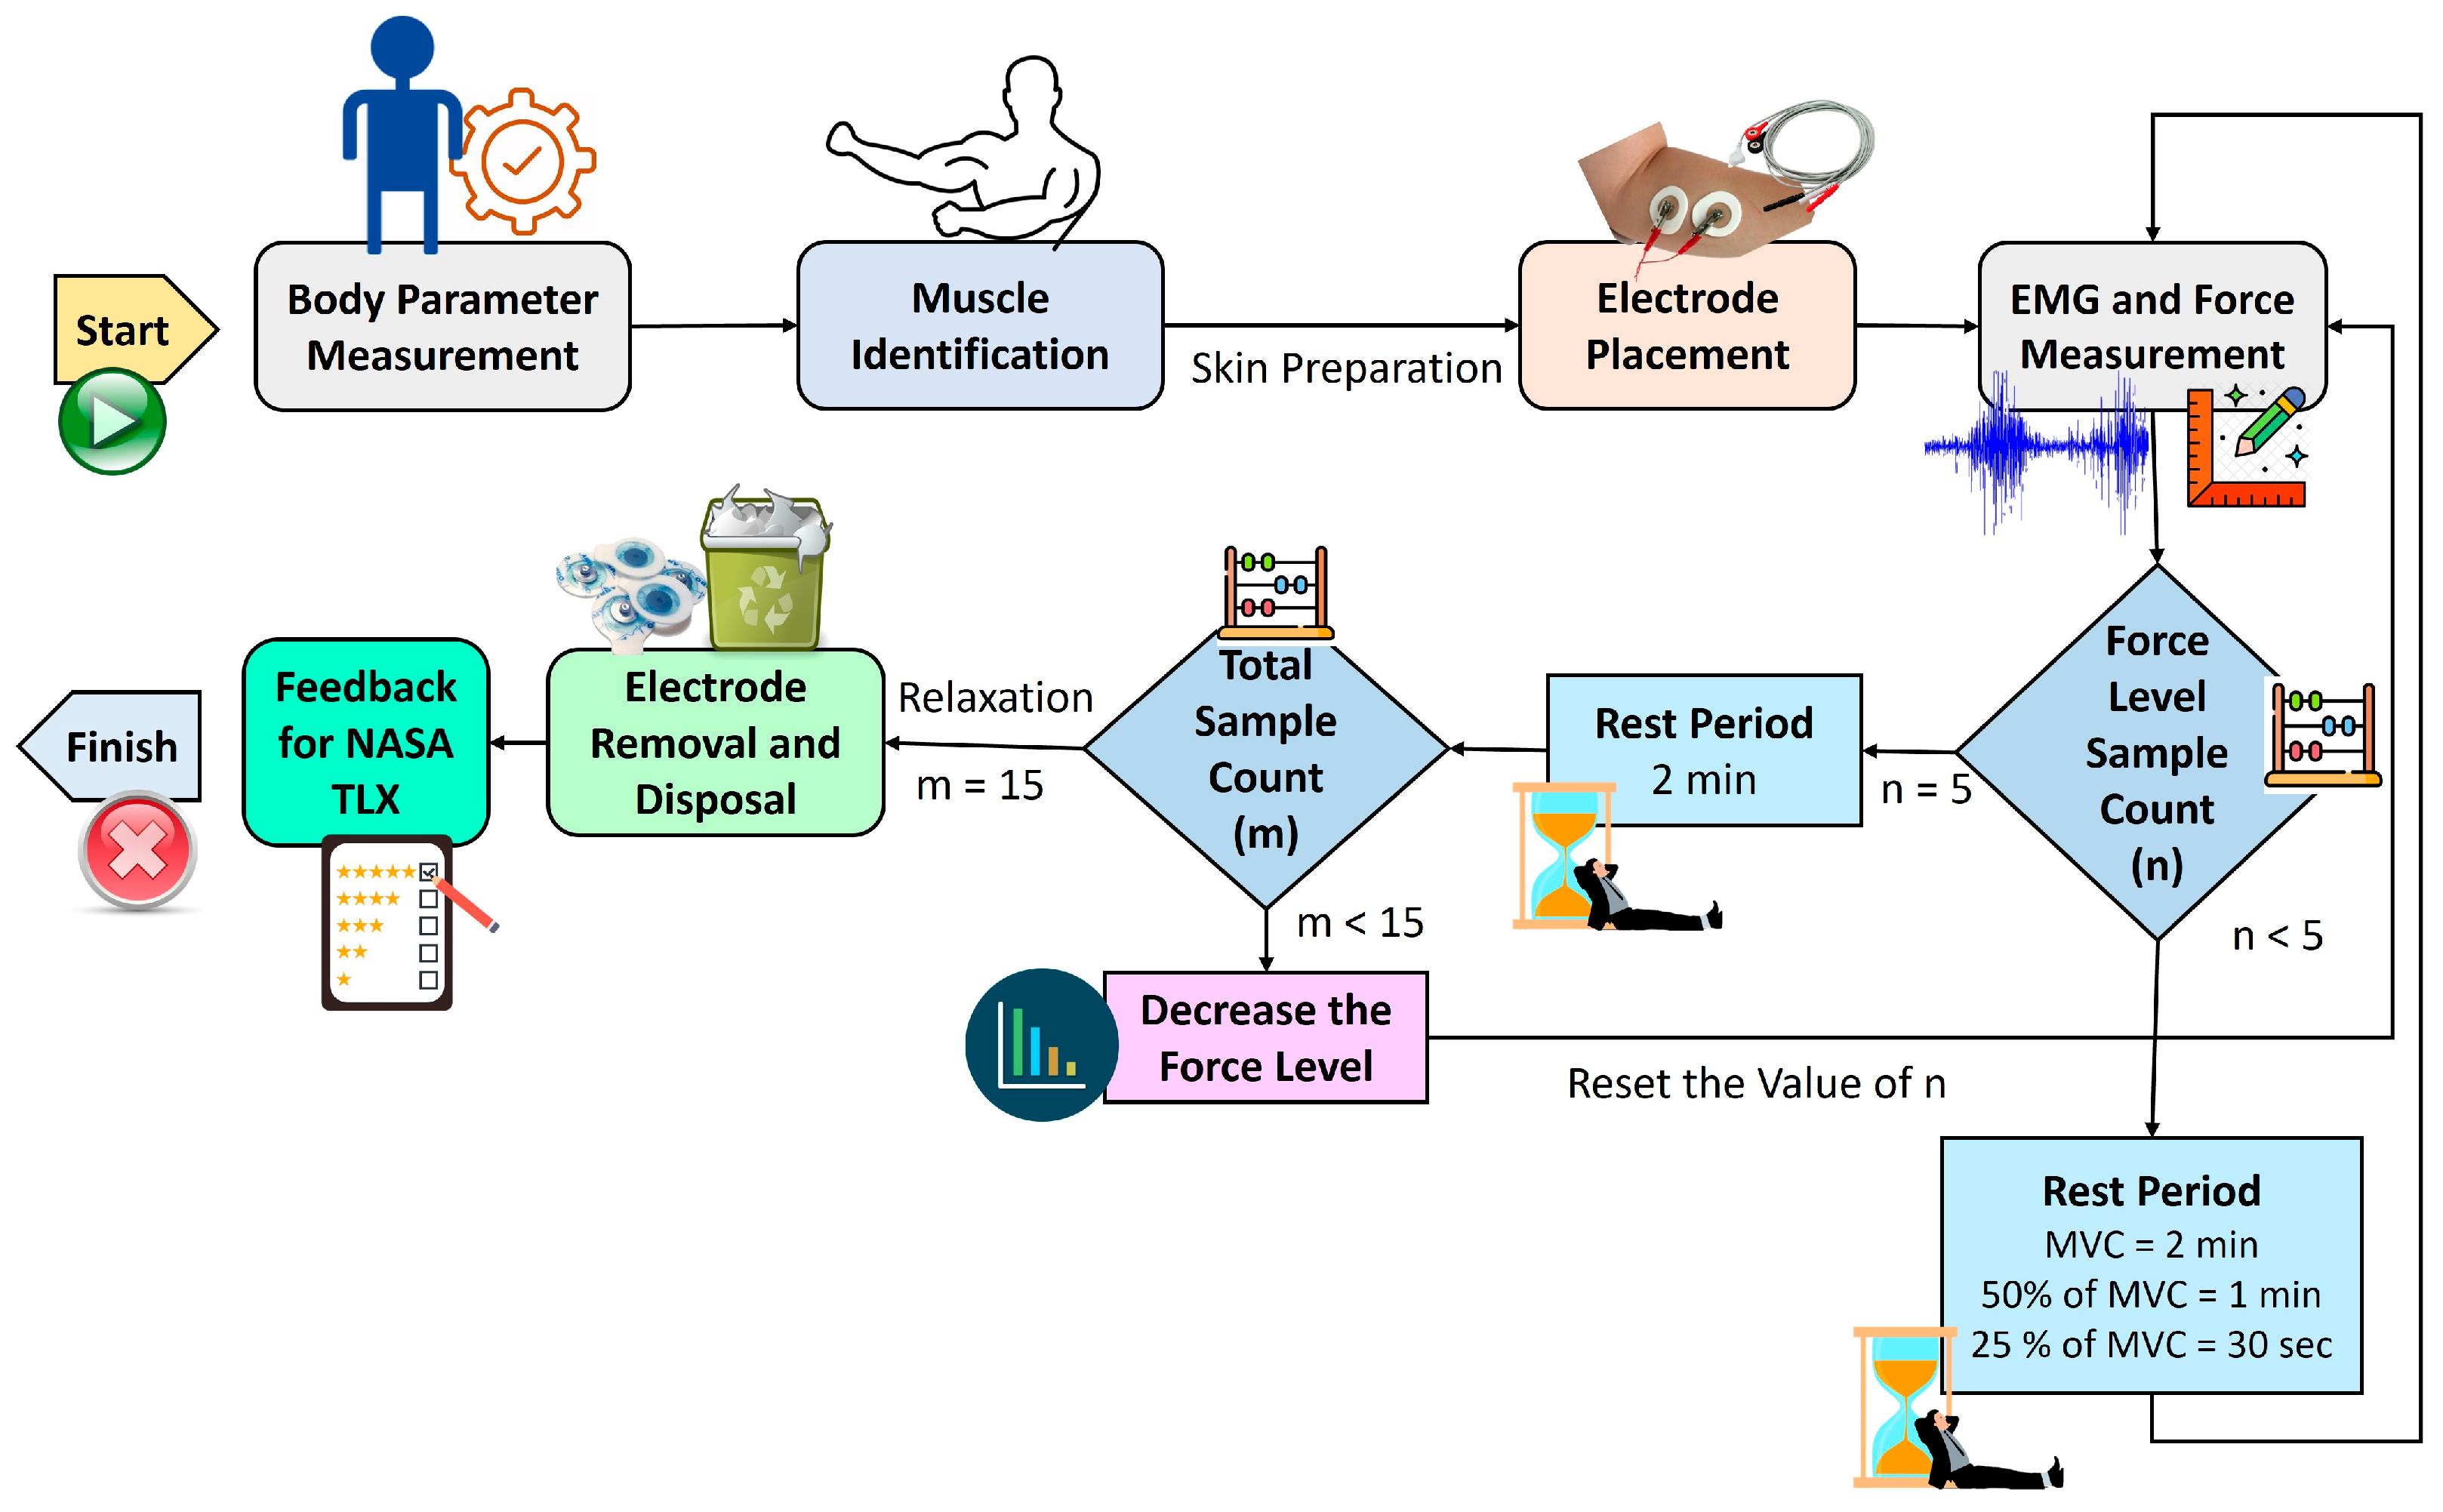
2.2. Proposed Methodology

The study was conducted over a period spanning from January 2023 to May 2024. In the initial part of the study, general information about the subjects was documented, including their age, medical history, and any past fractures or injuries in the dominant hand. Before conducting the experiment, written consent was obtained from each participant to record and use the data for research purposes. The experiments followed the guidelines of the Shiv Nadar University Institutional Ethics Committee (IEC) for Human Research, and the consent form was per the committee’s policies. The experimental methodology employed for data collection from the subjects is illustrated in Figure 3. This study involved 37 participants, comprising 25 males and 12 females. The age, height, and weight of the participants ranged from 21 to 50 years, 152 to 177 cm, and 46.2 to 97.7 Kg, respectively. The inclusion of participants across a wide range of ages, heights, and weights allowed for a more diverse dataset.
The selected participants for this study were carefully screened to ensure the absence of prior hand injuries, ailments impacting the hand grip force or overall hand function, and any historical or existing nerve conditions. Moreover, all participants were exclusively right-handed to ensure a valid basis for comparison. Age criteria were set between 18 and 50 years to ensure sufficient muscular development and to avoid including individuals with significantly weakened physical conditions due to age-related factors. During data collection, signal acquisition involved controlled force activities with interspersed rest periods to mitigate potential errors arising from muscle fatigue. Additionally, multiple readings were taken to identify and address any outliers within the dataset. Following the experimental session, the NASA Task Load Index test was administered to ascertain and mitigate any factors that might have influenced the accuracy or reliability of the recorded data [36].
During the data collection process, four distinct types of data were gathered:
(a)
General data: gender, age, height, and weight, with height and weight measured using a stadiometer and weight scale.
(b)
Body composition parameters: body fat level, muscle mass, and subcutaneous fat, assessed with a BIA scale according to specific protocols provided to the subjects.
(c)
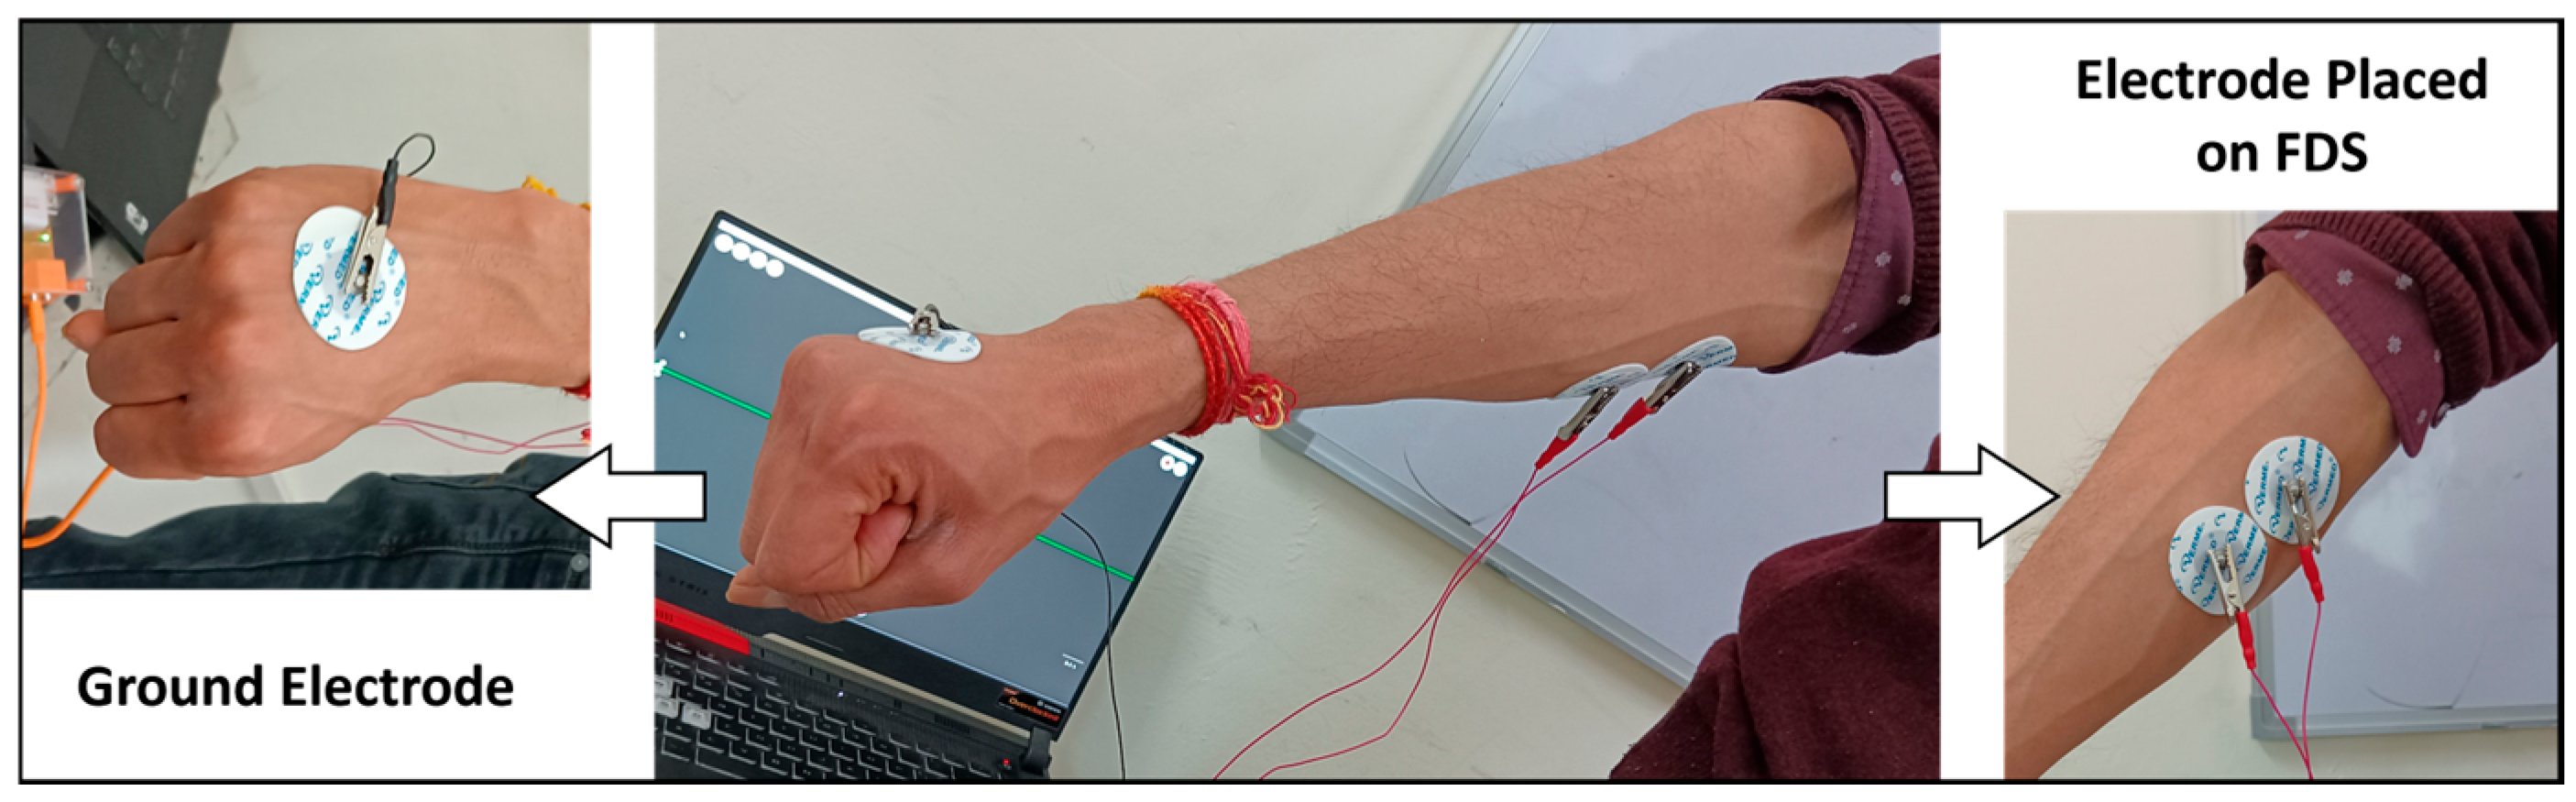
EMG data: Two electrodes were affixed to the skin over the FDS muscle, with another electrode serving as the ground. These electrodes were connected to the EMG setup, which was then linked to the data acquisition system.
(d)
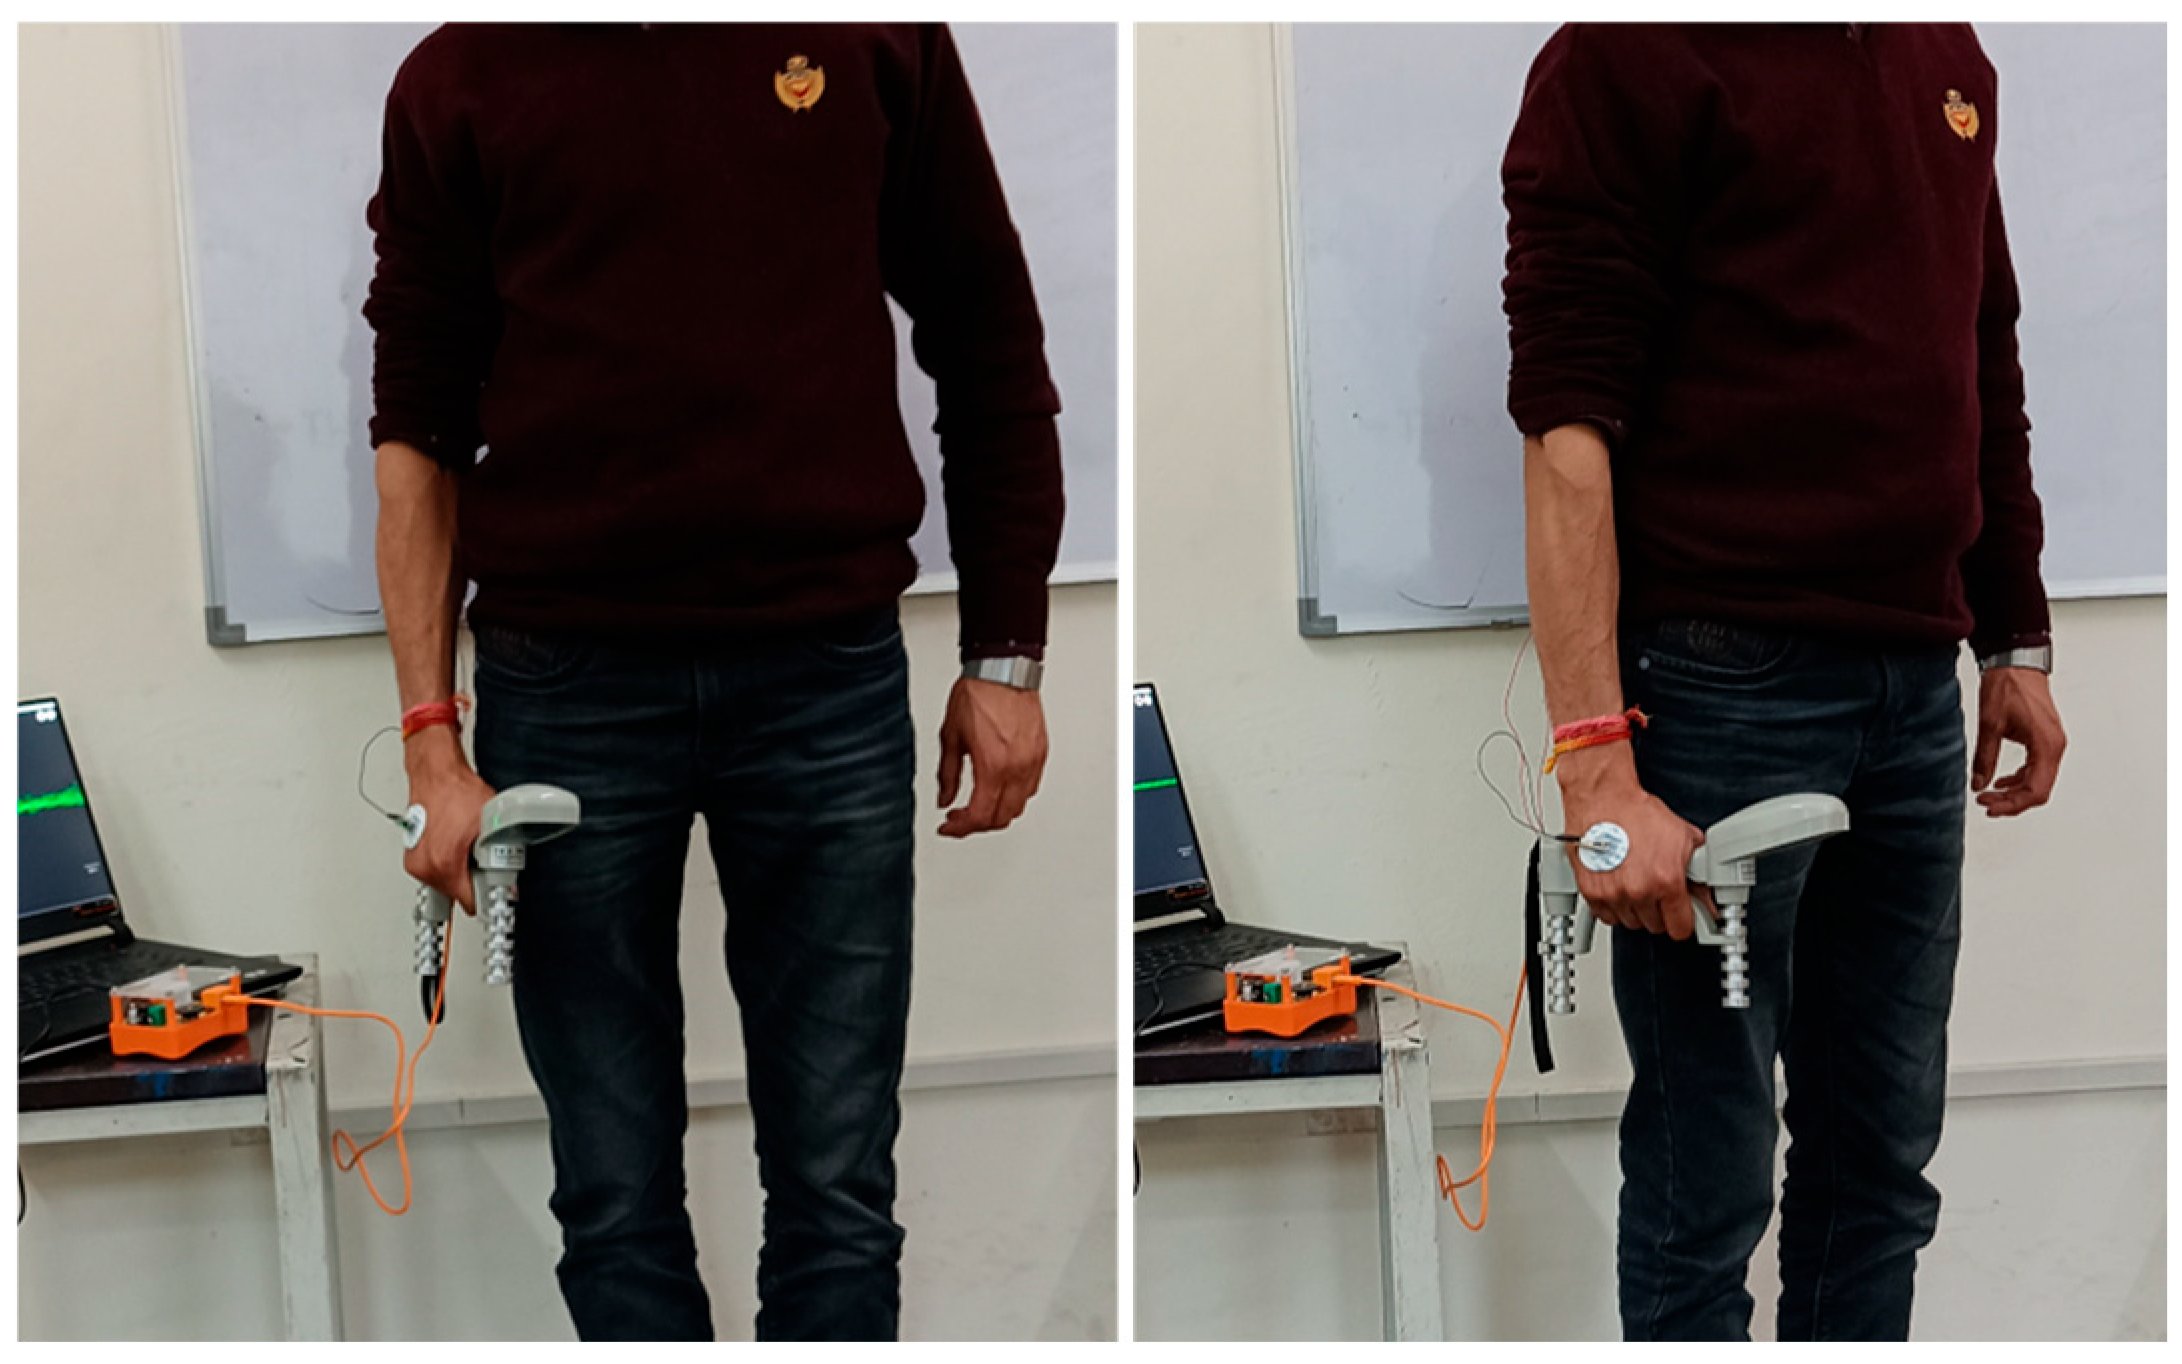
Force data: captured using a dynamometer, with subjects performing the MVC to determine the highest force achievable, which was then divided into 50% and 25% of the MVC.
The force and EMG data were collected simultaneously. Each force level was held for 6 s, followed by a 2 s return to the starting position. Data for each force level were recorded five times, with rest periods between trials:
(i)
2 min between MVC trials.
(ii)
1 min 30 s for 50% and 25% MVC trials.
Additionally, a 2 min rest period was enforced between each force level trial to mitigate fatigue effects.
These measures were implemented to ensure data integrity and eliminate potential sources of bias due to fatigue. The subsequent paragraphs will outline the complete step-by-step procedure for collecting the data.
The initial step in the procedure involved the acquisition of body parameter measurements. It started by measuring the height and weight. The other body parameters were measured with the help of the BIA scale (Figure 4). It measured the body fat level, skeletal muscle, and BMI index. It also measured the subcutaneous fat, which is the layer of fat underneath the skin. To ensure the study’s accuracy, the skin preparation process was performed to prevent contamination. Hairs on the forearm were removed, and the skin was thoroughly cleaned using alcohol swabs. The surface EMG electrodes used in the experiment were disposable and were used only once per subject to prevent any interference with the adhesion between the electrodes and skin. The distance between the center of the electrodes was kept at 2 cm for optimal signal quality [28], adhering to SENIAM guidelines to ensure reproducibility.
The location of the flexor digitorum superficialis (FDS) muscle was then determined through muscle palpation. The FDS muscle is located on the anterior side of the forearm and is easily identified by palpation [37,38]. It originates from the medial epicondyle of the humerus and inserts into the base of the proximal phalanges of the four fingers. It is responsible for flexing the fingers at the proximal interphalangeal joint. Once the muscle was located, EMG electrodes were placed there (Figure 5). Two electrodes were placed on the forearm to measure the potential difference, and one electrode at the back of the hand served as a ground.
The task was then explained to the subject regarding what they had to do during the experiment. Then, the subject assumed a standing position with their arm fully extended, aiming for a neutral orientation with minimal flexion, rotation (including pronation and supination), or deviation of the hand and wrist. To ensure the grip strength was primarily attributed to the muscles directly involved in the task, a fully extended, relaxed hand position was adopted to minimize interference from non-target muscles. Standardizing the standing position, with the hand and forearm in a neutral orientation, helped minimize variations due to individual body differences. While this posture deviated from more common grip positions, it was chosen specifically to minimize extraneous muscle activation. The force dynamometer was held in their hand. The body posture of the subject was chosen because when the subject was in the standing position, the hand’s supination position was considered to ensure the upper arm was relaxed and adjoined muscles were not in flexion mode (Figure 6). When the hand was fully extended in a downward position, the ability to exert the grip force was also maximized [39].
Participants were asked to exert their maximum force capacity at the MVC (maximum voluntary contraction) level in the experiment. The MVC force served as a standardizing factor because each person has a unique force exertion ability based on their body parameters [40,41]. Only a single motor unit is activated at low levels of force, but as the force increases, more motor units are recruited. If the same level of force was applied to all participants, it could produce inaccurate results due to varying motor unit recruitment based on individual physical characteristics. In the study, participants first reached their MVC, and then two force levels were calculated for each individual, which were 50% and 25% of their MVC. The characteristics of the data collected for all subjects are shown in Table 1. This ensured that each participant was exerting the same relative level of force, regardless of their individual strength.
After determining the range of high force levels through readings, a range of medium and low force levels was calculated, and the next step was for the subjects to attempt to maintain the force at a designated level. Feedback was provided if a subject was unable to reach the target level. Some participants initially struggled to perceive the force level accurately, but after undergoing a specific training regimen, they were able to perceive and apply the desired force effectively. After recording the data, the subjects were relaxed, and the electrodes were removed. Then, the feedback for the NASA TLX questionnaire was recorded. An ECG (electrocardiogram) was taken before and after the experiment to ensure that there was no stress or mental pressure present while they were performing the experiment.

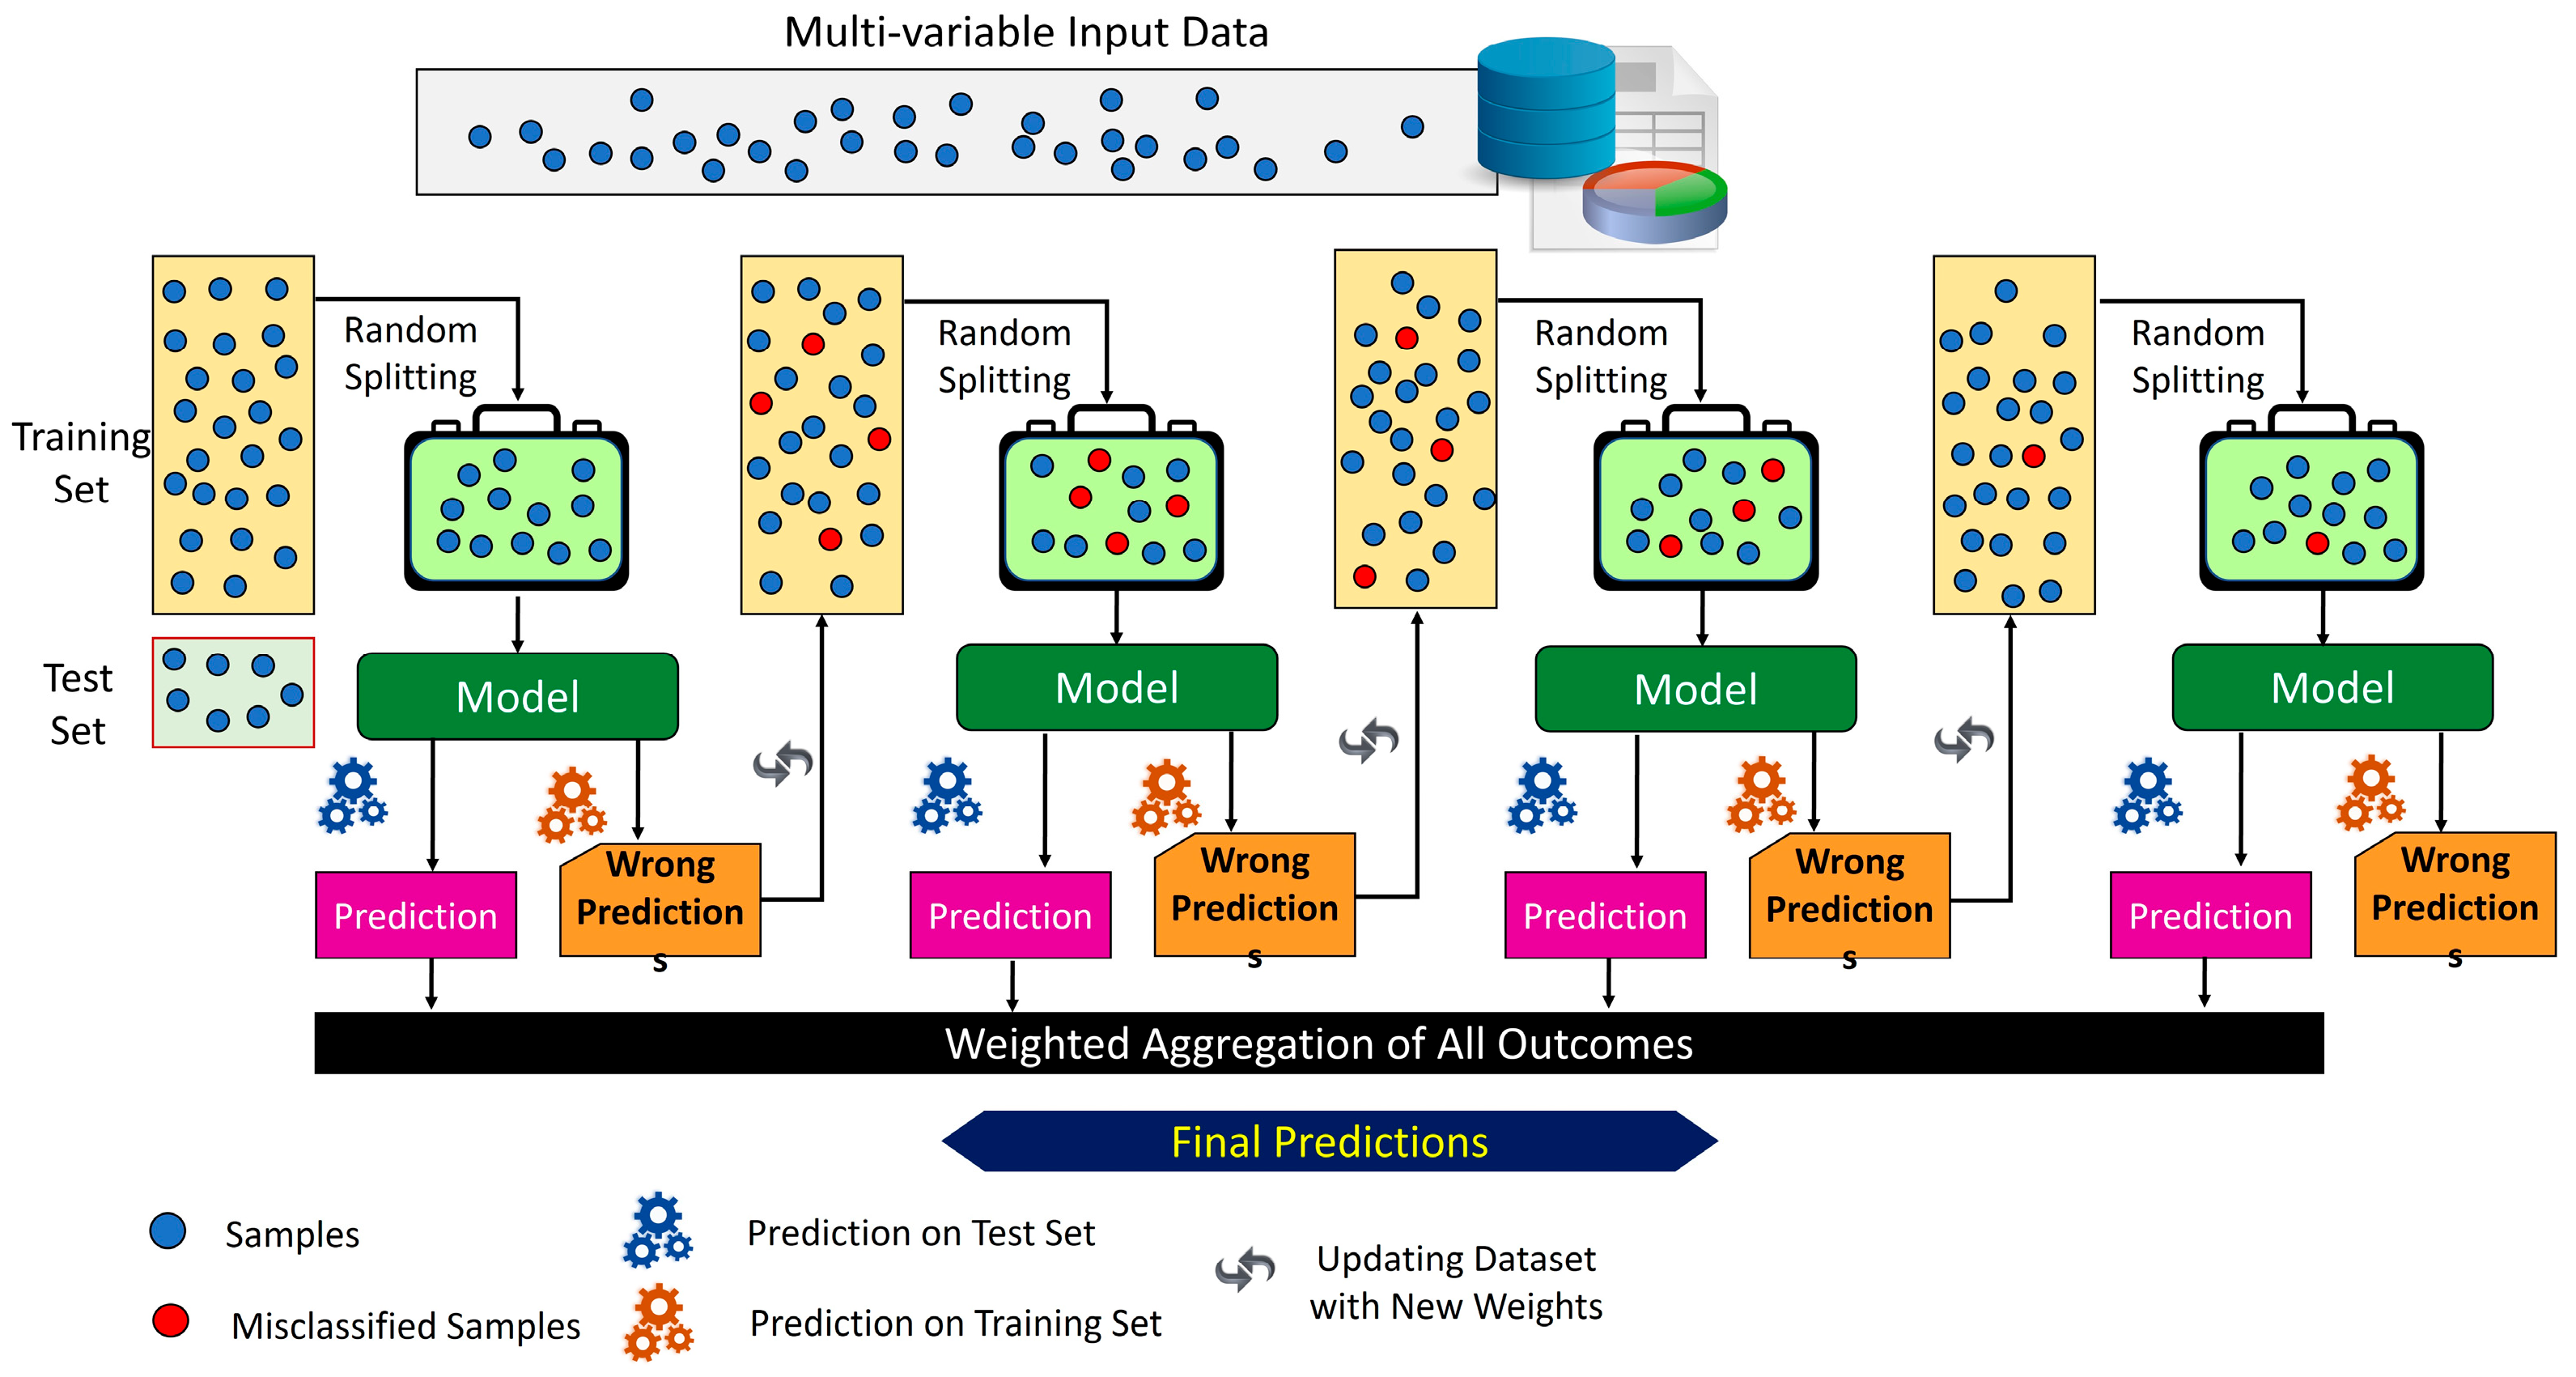
2.3. Machine Learning-Based Analysis to Investigate the Feasibility of EMG Signals for Prosthetic Hand Force Control

In this study, the machine learning model was equipped with mathematical features derived from the force exertion sequences. These features encompassed values collected across 15 different sequences of force exertion, spanning three distinct force levels. Each sequence comprised an 8 s time interval, consisting of 6 s of force exertion followed by 2 s for returning to the initial position. The average value of the 8 s interval was computed, taking into consideration the standard deviation, ensuring a robust representation of the data’s variability. This technique was applied to all data points accumulated from the 37 subjects. Subsequently, the dataset was judiciously partitioned into distinct training and testing sets, employing best practices to prevent overfitting and ensure model generalization. Finally, the meticulously curated dataset was deployed to train an XGBoost machine learning model due to its robust capabilities to derive meaningful understandings and predictions. XGBoost is a highly optimized variant of a gradient boosting machine that can handle the most complicated, high-dimensional datasets while minimizing overfitting. XGBoost was utilized to estimate EMG values by using correlated feature values, such as the body fat, muscle, and force. The effectiveness of the model was evaluated using repeated k-fold cross-validation, where the available data were partitioned into training and validation sets. This process was iterated multiple times, with the data automatically split into folds and the model trained and evaluated at each iteration. For the regression analysis, XGBoost with a mean absolute error (MAE) was employed as the evaluation metric.
It operates on the idea of boosting, a technique for transforming several weak models into strong models. The complete process is shown in Figure 7. Decision trees are used as weak models in the XGBoost regressor and are built sequentially to increase the precision of the results. The algorithm uses gradient boosting, a technique for reducing the difference between the target variable’s predicted values and actual values by incorporating new trees into the ensemble, adjusting the sample weights, and maximizing the learning rate. The XGBoost regressor essentially acts as an ensemble of decision trees that are sequentially added to the model, increasing the prediction accuracy at each stage.
Let D = { x i ,   y i } i = 1 N denote the dataset, where x i represents the feature vector and y i represents the corresponding target variable (EMG values).
The objective function of the XGBoost model can be written as in Equation (1):
O b j e c t i v e f = i = 1 N l ( y i ,   y ^ i ) + k = 1 K Ω f k ,
where y ^ i = f ( x i ) is the predicted output of the model for the i t h sample, l ( y i ,   y ^ i ) is the loss function measuring the discrepancy between the true and predicted values, Ω f k is the regularization term penalizing the complexity of the model, and K is the number of weak learners (decision trees) in the ensemble.
The XGBoost model is trained using gradient boosting, which updates the model iteratively to minimize the objective function. At each iteration, a new weak learner h k is added to the ensemble to correct the errors made by the existing ensemble, as shown in Equation (2):
y ^ i ( t ) = k = 1 t h k x i
where y ^ i ( t ) is the predicted output of the ensemble at iteration t .
The new weak learner h t is trained to minimize the following objective function:
O b j e c t i v e ( t ) = i = 1 N l y i ,   y ^ i ( t 1 ) + h t x i + Ω h t
The learning process continues for a predefined number of iterations or until the objective function converges. Finally, the predictions of all weak learners are combined to obtain the final prediction of the XGBoost model. The XGBoost regressor was trained on different hyper-parameters, which included a maximum depth of three, a learning rate of 0.1, 100 estimators, and L1 and L2 regularization terms of 0 and 1, respectively.
XGBoost’s ability to handle missing data, a common occurrence in real-world datasets, made it particularly suitable for this study. Its built-in regularization and pruning techniques help prevent overfitting, resulting in models that generalize well across diverse physiological and demographic variables. The model’s parallel computing capabilities also enable efficient training on large datasets, allowing for accurate predictions even with complex data. Additionally, XGBoost’s flexibility facilitates the implementation and tuning of complex machine learning models. The model’s performance was evaluated using the r2 score (coefficient of determination), which quantifies the proportion of variance in the dependent variable (EMG values) explained by the independent variables (body fat, muscle, and force), with values close to 1 indicating a strong fit to the data.

3. Results

Following the data collection process, the collected data points were consolidated and subjected to analysis to facilitate comparisons between various parameters, such as from EMG values to the force and other relevant physiological factors. Moreover, by executing the regression model multiple times, crucial parameters within the collected data were identified.

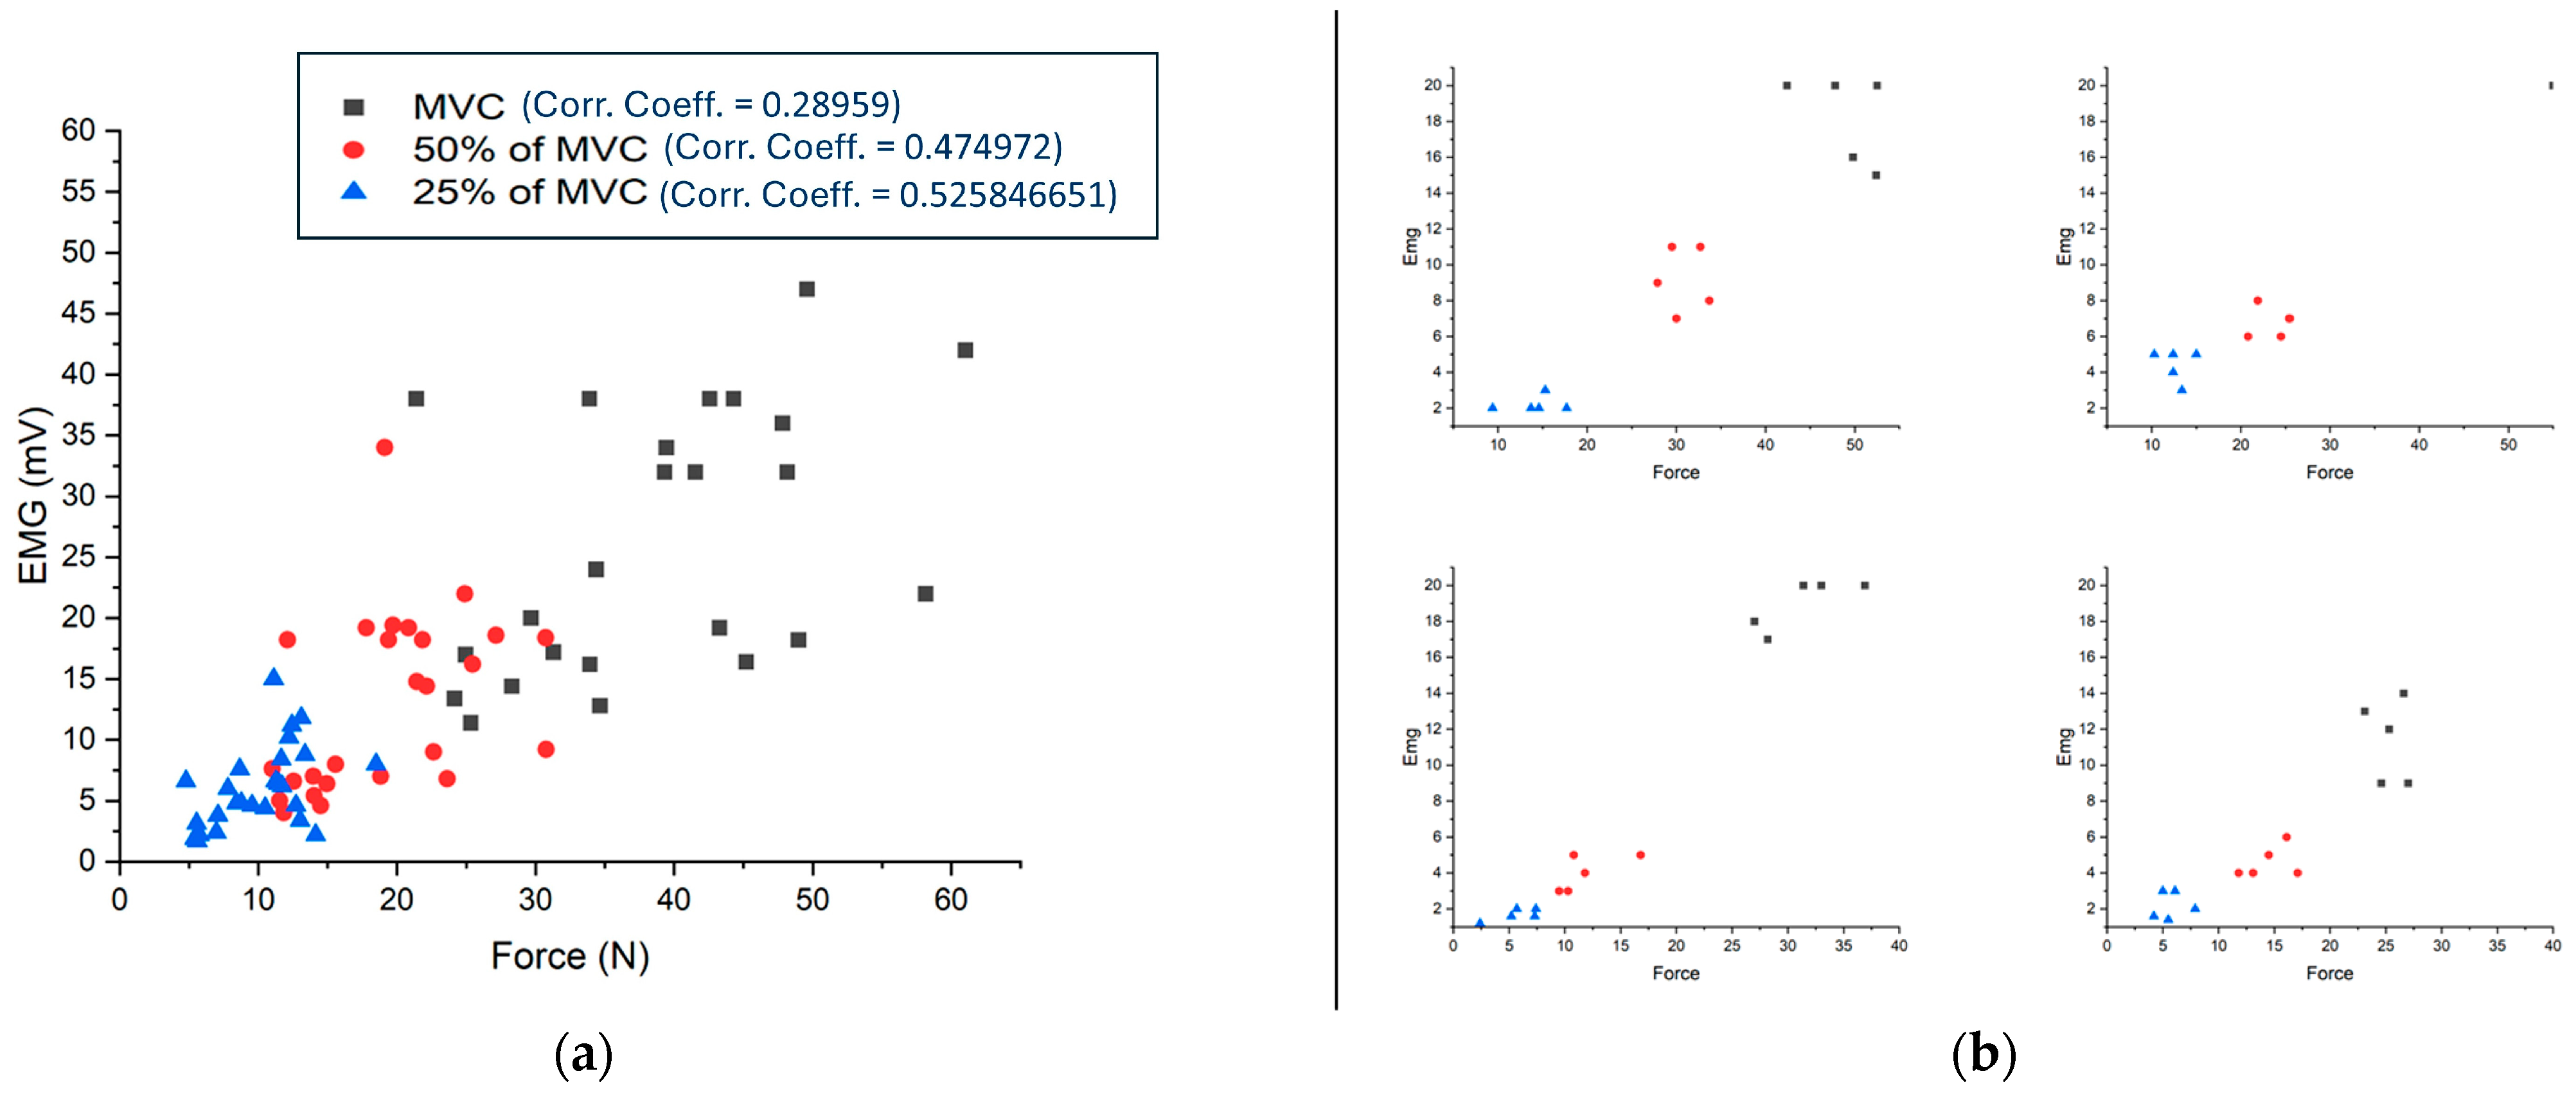
3.1. EMG Values vs. Force

The results show a correlation between the EMG values and the exerted grip force, with a higher grip force resulting in higher EMG values. The data are shown on a single graph (Figure 8a), all showing a positive correlation ranging from 0.28 to 0.52 for different force levels, but it can be seen that there is some overlap between data points. This variability can be attributed to the differences in the individual ability to exert force and the EMG data captured at the muscle location, as the human body is dynamic in nature.
However, when considering data points for individual subjects (Figure 8b), it is observed that three distinct EMG value ranges can be differentiated for three different levels of the grip force. The first range corresponds to the least exerted force, the second range corresponds to the medium exerted force, and the third range corresponds to the highest exerted force. The fluctuation in EMG readings during transitions between different force levels demonstrates a clear direct correlation. EMG values peak at the MVC and gradually decrease as the force exertion diminishes to 50 percent of the MVC, reaching their lowest levels at 25 percent of the MVC. These findings imply that EMG activity escalates with a rising grip force and diminishes as the grip intensity decreases.

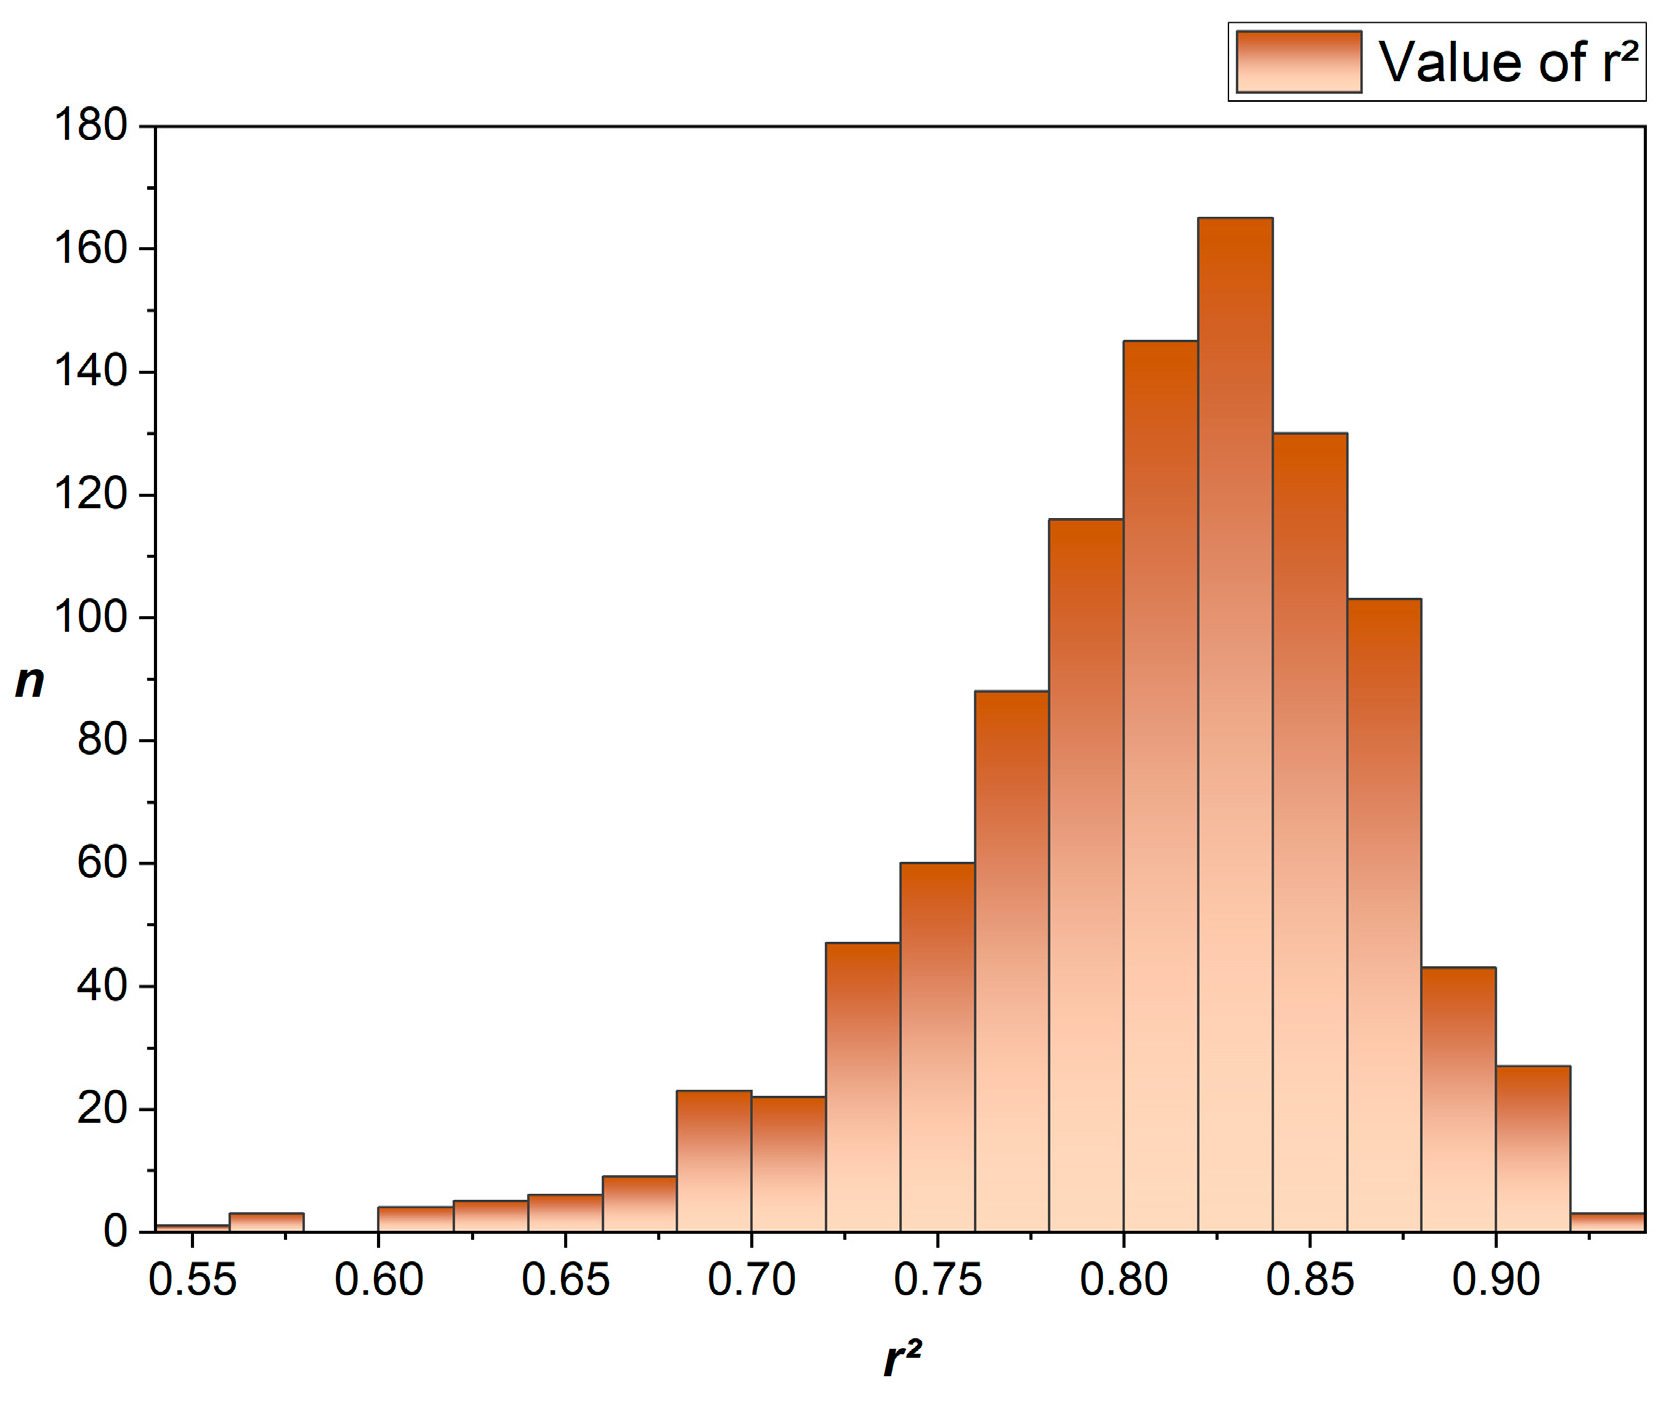
3.2. Machine Learning-Based Regression Model

The effectiveness of the model was evaluated using repeated k-fold cross-validation, where the available data were partitioned into training and validation sets. This process was iterated 1000 times, with the data automatically split into five folds and the model trained and evaluated at each iteration. The r2 values obtained for 1000 cases from 1000 different repeated k-fold cross-validations (k = 5) were utilized for assessing the correlation between the force and EMG values in Figure 9. When the top 200 instances were considered, the r2 values varied between 0.934372238 and 0.856767454. Given that the data are dynamic and biological in nature, the high r2 value implies a substantially linear relationship between the force and EMG values, implying their interdependence. This finding strengthens the potential of accurately estimating the grip force based on EMG measurements.

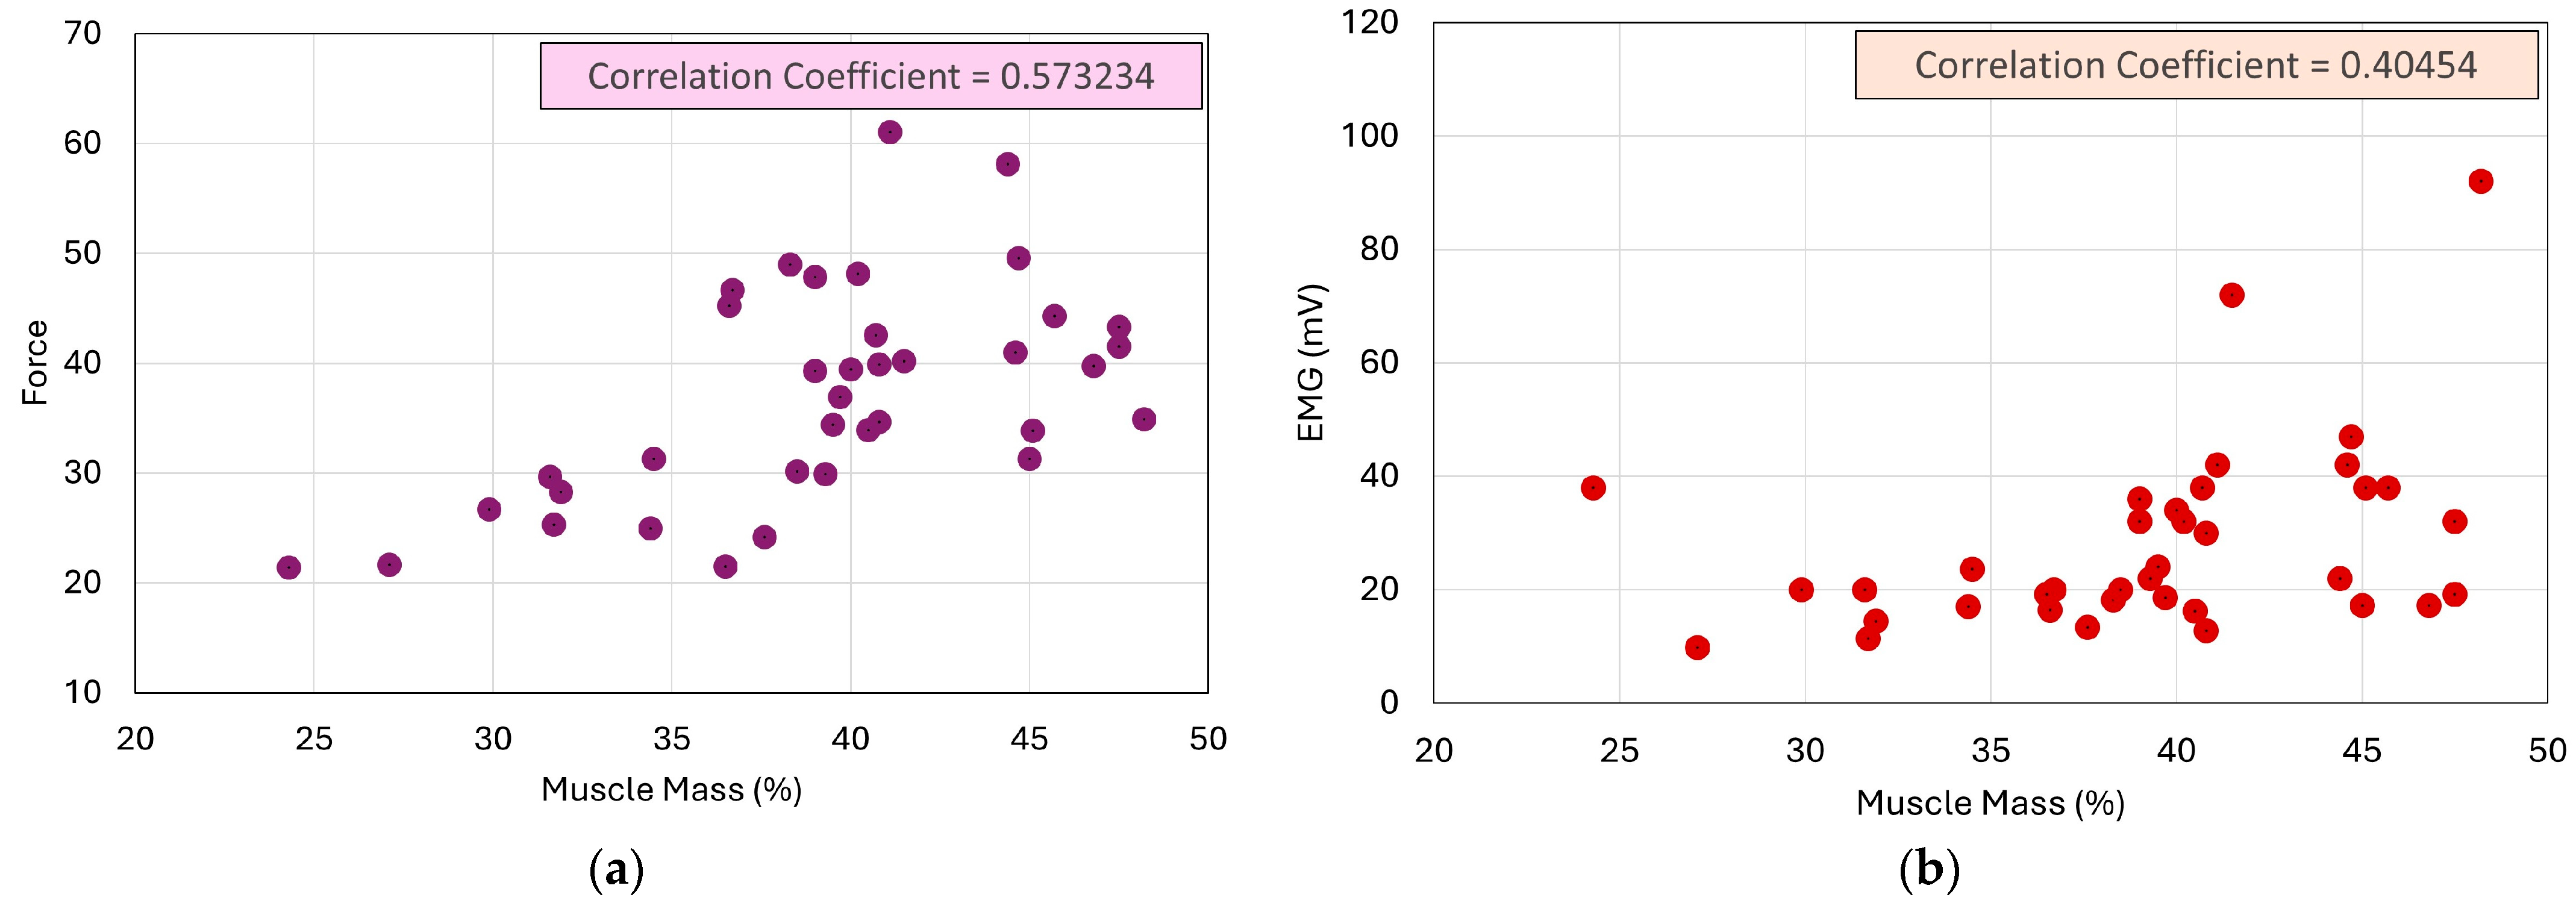
3.3. Impact of Body Parameters on EMG

The level of body fat and muscle mass significantly impacts the recording of surface electromyography. Studies indicate that when recording signals from individuals with high body fat levels, the distance between the muscle and the surface electrodes attached to the skin increases, leading to a decrease in EMG values [42,43,44,45]. This observation indicates that individuals with higher adipose tissue levels tend to exhibit lower detectable EMG signals on the skin due to increased impedance and a greater distance between the surface electrodes and the underlying muscle mass. Conversely, high levels of muscle mass result in higher EMG values. Therefore, the level of body fat is inversely proportional to EMG values and directly proportional to muscle mass. To account for these factors in the study, the body parameters of the subjects, such as their fat level and muscle mass, were compared to the EMG values (Figure 10). By doing so, the reliability of the recorded data could be analyzed and evaluated. It was also investigated to what degree these factors should be considered when dealing with surface EMG.
The graph results demonstrate an inversely proportional relationship between the fat level and EMG value, with an increase in the fat level leading to a decrease in the EMG value. A negative correlation coefficient of a magnitude of 0.40954 was obtained. Muscle mass is indicative of an individual’s ability to generate force, and as the muscle mass increases, so does their force-exerting capability (Figure 11a). The value of the correlation coefficient was obtained as 0.573234, showing a positive and strong correlation. Greater muscle mass provides individuals with the capacity to generate force more proportionally. This is also reflected in a directly proportional relationship between muscle mass and EMG values (Figure 11b). Thus, scrutinizing the relationship between muscle mass and EMG values makes it evident that it mirrors the correlation observed with the force exertion capability: the greater the muscle mass, the higher the EMG values. The value of the correlation coefficient was obtained as 0.40454, showing a positive correlation. The data suggest that both body parameters are essential and should be considered to reduce errors while recording the EMG data.
EMG assesses and records the electrical activity originating from skeletal muscles. The EMG signal reflects the collective action potentials muscle fibers generate within the recording area. Understanding the correlation between the EMG signal and both muscle mass and the fat level involves grasping the physiological processes governing muscle contraction and adipose tissue characteristics.
Muscle mass denotes the body’s total weight of skeletal muscle tissue, implying a higher number of muscle fibers available for contraction. During muscle contraction, motor neurons transmit electrical impulses to muscle fibers, prompting the release of calcium ions and the subsequent generation of action potentials. These action potentials propagate along the muscle fibers, instigating contraction. The direct proportionality between the EMG signal and muscle mass arises because a larger muscle mass entails a greater activation of muscle fibers during contraction, resulting in heightened electrical activity recorded by the EMG electrodes. Consequently, individuals with greater muscle mass may produce stronger EMG signals, which control systems can interpret as commands for an increased force output. Therefore, adjustments in EMG-based control mechanisms may be necessary to calibrate or scale the EMG signal according to individual differences in muscle mass to ensure precise force regulation.
Conversely, adipose tissue, or body fat, is an insulating barrier that impedes the conduction of electrical signals. Unlike muscle tissue, which exhibits high conductivity, fat tissue demonstrates poor electrical conductivity. When EMG electrodes are positioned on the skin surface, the signal must traverse through layers of adipose tissue before reaching the underlying muscle, attenuating and altering the EMG signal characteristics. Higher body fat levels contribute to more significant attenuation and distortion of the EMG signal, rendering it more challenging to capture muscle electrical activity accurately. This attenuation reduces the signal-to-noise ratio and compromises the accuracy of force estimation.
EMG-based control mechanisms often necessitate calibration and customization for each user to optimize performance. By accommodating differences in muscle mass and fat levels among individuals, these systems can be tailored to individual characteristics, enhancing effectiveness and usability. The interplay between the EMG signal, muscle mass, and fat level underscores the importance of considering individual physiological variances when designing EMG-based control mechanisms for force regulation. It also emphasizes the need for appropriate calibration and signal processing techniques to ensure a precise and reliable performance across diverse populations.
The present study incorporates several body parameters in its model, including gender, height, weight, body fat level, subcutaneous fat level, muscle mass, and grip force. After sorting the results by the top 200 r2 values, the impact of each parameter was observed to range between 0.03436 and 0.00106 for gender, 0.15697 and 0.06159 for height, 0.24388 and 0.05771 for weight, 0.21918 and 0.06001 for the body fat level, 0.51226 and 0.00565 for the subcutaneous fat level, 0.36592 and 0.08256 for muscle mass, and 0.33677 and 0.13282 for the grip force. The box plot in Figure 12 highlights that the most significant parameters for consideration are body fat and muscle mass, with the subcutaneous fat level having the highest value overall but also having a higher range of outliers, which may limit its reliability.
Furthermore, the results suggest that the ability to detect and discriminate between different levels of force is highly dependent on the amount of force produced. The experiments revealed that the ability to perceive force is at its peak when a person performs an MVC. However, as the force decreases, the perception capability also decreases. The lowest perception capability was observed when capturing the force at 25% of the MVC. The results indicate that more extended training is necessary to improve precision in perceiving lower levels of force.
Hybrid systems integrating EMG signals with complementary sensing modalities like inertial or pressure sensors have garnered attention in prior research endeavors. These systems are designed to amalgamate the advantages of various control mechanisms to enhance the overall performance and resilience [46,47]. Employing sensor-based approaches, such as force or inertial sensors integrated within prosthetic devices, facilitates the direct measurement of external forces or the device orientation, thereby enabling accurate force control and feedback. However, while sensors offer an understanding of external forces or the device orientation, they do not directly convey proprioceptive feedback to users, potentially restricting their ability to intuitively perceive and adjust the grip force [48]. Integrating sensors within prosthetic devices introduces complexity to the design and may escalate the device’s dimensions, weight, and cost. FMG involves assessing muscle deformation resulting from muscle contractions, presenting a non-invasive and potentially robust method for prosthetic control [49]. Nonetheless, FMG signals may lack the requisite specificity for the precise control of individual movements or force levels, particularly in contexts necessitating fine motor control [50]. Deciphering FMG signals into coherent control commands may encounter obstacles due to interindividual variations in muscle anatomy and contraction patterns.
The findings of this study demonstrate that utilizing EMG signals for prosthesis force control offers users direct EMG manipulation, facilitating the real-time and intuitive management of the prosthetic hand by directly interpreting the user’s muscular signals. Through muscle contractions, generating the EMG signals detectable on the skin, the users can manipulate the prosthetic hand, mirroring natural hand movements and enhancing the user experience and functionality. This approach eliminates the need for users to acquire complex control techniques or gestures, as they can rely on their innate muscle movements for control. Moreover, it enables the personalized mapping of muscle signals to specific hand movements or grips, accommodating individual users’ distinct capabilities and preferences. Such tailored customization contributes to heightened user satisfaction and improves the overall usability of the prosthetic device. Adopting direct EMG control can streamline the design and implementation of the prosthetic hand, thereby reducing the overall device complexity and cost.
The constraints associated with this method include potential limitations in signal resolution with EMG control, which can pose challenges in accurately interpreting subtle force adjustments. Moreover, extended reliance on muscle signals for control may induce muscle fatigue, thereby impacting the accuracy and consistency of control over prolonged periods. However, forthcoming progressions in signal processing methodologies, electrode technology, and hybrid control systems hold promise in mitigating these limitations and enhancing the efficacy and usability of prosthetic hand control via EMG.
Table 2 presents a comparative analysis between the current study and prior research conducted in the same domain. This research paper examines several body parameters, specifically the fat level, muscle mass, and subcutaneous fat, which play a crucial role in determining the quality and magnitude of EMG signals. These parameters have not been adequately considered in previous investigations of EMG changes related to variations in the grip force.
The study involved 37 participants who performed force exertions at three different force levels, with each level repeated five times, resulting in a diverse dataset comprising multiple data points. To ensure accurate electrode placement and minimize errors, muscle palpation was performed. The MVC was utilized as a normalization parameter, enabling comparisons across a wide range of body types. To augment the data analysis process, a machine learning-based regression methodology was implemented, encompassing the execution of multiple cases to enhance the depth of analysis. The results shed light on the crucial factors that should be taken into account when working with EMG force feedback control and provide an assessment of their significance.

4. Discussion

This study observed a proportional relationship between EMG values and the grip force at various force exertion levels, which aligns with previous research linking muscle activation levels to the grip force [57,58]. To assess this relationship, an XGBoost-based regression model was implemented, yielding robust r2 values as high as 0.93 and 0.83 in most model runs, indicating a reliable correlation between EMG activity and the grip force [59,60].
Additionally, this study investigated the influence of body composition, including the fat level and muscle mass, on EMG signal quality. An inverse relationship was observed between the fat level and EMG readings, while muscle mass showed a positive correlation, suggesting that body composition directly affects signal characteristics [61,62]. The regression model identified the fat level (with a feature importance ranging from 0.21918 to 0.06001) and muscle mass (0.36592 to 0.08256) as the most influential factors, supporting the significance of body composition in EMG applications [63]. The limited number of outliers reinforces the reliability of these features in interpreting EMG data [64].
This study controlled for a steady hand position to reduce variability, a common approach in EMG analysis to ensure consistency and accurate measurements [65]. However, future research should extend these findings by incorporating dynamic elbow positions, such as flexion and extension, to better simulate real-world scenarios [66]. Although the current model demonstrated promising accuracy, expanding the dataset and investigating additional force levels could further enhance its performance.
Hybrid systems that integrate EMG signals with additional sensing modalities may offer several advantages for advanced prosthetic control. Sensor-based systems typically provide precise force control but may lack the natural feedback that EMG systems inherently offer [67]. Force myography (FMG) has been explored as a non-invasive alternative for prosthetic control, but it may not match the specificity or intuitive nature of EMG in applications requiring delicate manipulation [68]. Direct EMG control allows users to modulate prosthetic actions intuitively without relying on complex gestures or control algorithms, facilitating a more user-friendly experience. However, potential limitations in EMG applications, including signal resolution challenges and muscle fatigue, should be addressed through improved signal processing techniques and electrode designs.
With EMG-based control, users can manage precise hand motions and grips for tasks requiring refined manipulation, such as typing or small-object grasping, which enhances the everyday functionality. However, variability in EMG signals due to factors such as the muscle structure, limb conditions, and amputation level can pose challenges in adapting these systems for general use. Continued advancements in EMG technology and signal processing could mitigate these challenges, increasing the accessibility and usability of prosthetic and robotic systems [69].
Body composition, particularly muscle mass and fat levels, significantly influences EMG signal quality, underscoring the need to consider these parameters in control models. While factors like gender, weight, height, and subcutaneous fat appear to have a lesser impact, gender indirectly affects EMG outcomes due to typical differences in body composition, with males often possessing higher muscle mass and females having higher fat levels [70,71]. Moreover, maintaining low force levels below 25% of the MVC can be challenging, necessitating extended training for users to effectively manage forces within this range. EMG remains a valuable input for prosthetic control models, with muscle mass and fat levels serving as essential parameters for a broader application across diverse user populations.

5. Conclusions

In order to evaluate EMG’s feasibility as an intuitive control mechanism for prosthetic devices, this study investigated the correlation between the grip force and EMG signals. The grip force and EMG signals were assessed simultaneously, while accounting for individual variances in body characteristics such as muscle mass and the fat percentage. An XGBoost-based machine learning model was employed to identify key physiological components influencing EMG-based control. The findings indicate that EMG can potentially serve as a direct force control mechanism for prosthetic or robotic devices. A proportional relationship between EMG values and the grip force was observed, with muscle mass positively correlated and the fat percentage negatively correlated with EMG values. The significance of body composition in EMG-based control models for prosthesis is underscored by these findings. Future work can be conducted to expand the dataset, incorporate dynamic movements, and explore factors like fatigue to enhance the model accuracy and real-world applicability.

Author Contributions

Conceptualization, D.C.J.; data curation, D.C.J.; formal analysis, D.C.J.; investigation, S.M.; methodology, D.C.J.; project administration, S.M.; resources, D.C.J.; software, P.K. and R.C.J.; supervision, P.K. and S.M.; validation, P.K. and S.M.; visualization, P.K.; writing—original draft, D.C.J.; writing—review and editing, P.K., R.C.J. and S.M. All authors have read and agreed to the published version of the manuscript.

Funding

This research received no external funding.

Institutional Review Board Statement

The study was conducted in accordance with the Declaration of Helsinki, and approved by the Institutional Review Board (or Ethics Committee) of Shiv Nadar Institution of Eminence, Greater Noida, India (Project No. SNoIE/IEC/2024/0014 titled “Bio-signal Analysis for Enhanced Prosthetic Control through Intuitive Interface”) for studies involving humans (Approval Date: 22 April 2024).

Informed Consent Statement

Informed consent was obtained from all subjects involved in the study.

Data Availability Statement

Data will be made available on reasonable request to the corresponding author.

Conflicts of Interest

The authors declare that they have no conflict of interest. Pankaj Kumar is employed by HCL Technologies, Singapore, but this affiliation has not influenced the research or the content of this paper in any way.

Correction Statement

This article has been republished with a minor correction to the Institutional Review Board Statement. This change does not affect the scientific content of the article.

References

  1. Enoka, R.M. Physiological validation of the decomposition of surface EMG signals. J. Electromyogr. Kinesiol. 2019, 46, 70–83. [Google Scholar] [CrossRef] [PubMed]
  2. Ramsey, K.A.; Rojer, A.G.; D’andrea, L.; Otten, R.H.; Heymans, M.W.; Trappenburg, M.C.; Verlaan, S.; Whittaker, A.C.; Meskers, C.G.; Maier, A.B. The association of objectively measured physical activity and sedentary behavior with skeletal muscle strength and muscle power in older adults: A systematic review and meta-analysis. Ageing Res. Rev. 2021, 67, 101266. [Google Scholar] [CrossRef] [PubMed]
  3. Wimalasena, L.N.; Braun, J.F.; Keshtkaran, M.R.; Hofmann, D.; Gallego, J.; Alessandro, C.; Tresch, M.C.; E Miller, L.; Pandarinath, C. Estimating muscle activation from EMG using deep learning-based dynamical systems models. J. Neural Eng. 2022, 19, 036013. [Google Scholar] [CrossRef] [PubMed]
  4. Subasi, A.; Qaisar, S.M. Surface EMG signal classification using TQWT, Bagging and Boosting for hand movement recognition. J. Ambient. Intell. Humaniz. Comput. 2022, 13, 3539–3554. [Google Scholar] [CrossRef]
  5. Mann, S.; Panduro, M.B.; Paarup, H.M.; Brandt, L.; Søgaard, K. Surface electromyography of forearm and shoulder muscles during violin playing. J. Electromyogr. Kinesiol. 2021, 56, 102491. [Google Scholar] [CrossRef]
  6. Sri-Iesaranusorn, P.; Chaiyaroj, A.; Buekban, C.; Dumnin, S.; Pongthornseri, R.; Thanawattano, C.; Surangsrirat, D. Classification of 41 Hand and Wrist Movements via Surface Electromyogram Using Deep Neural Network. Front. Bioeng. Biotechnol. 2021, 9, 548357. [Google Scholar] [CrossRef]
  7. Rubin, D.I. Needle electromyography: Basic concepts. Handb. Clin. Neurol. 2019, 160, 243–256. [Google Scholar] [CrossRef]
  8. Kumar, D.K.; Jelfs, B.; Sui, X.; Arjunan, S.P. Prosthetic hand control: A multidisciplinary review to identify strengths, shortcomings, and the future. Biomed. Signal Process. Control 2019, 53, 101588. [Google Scholar] [CrossRef]
  9. Enders, H.; Nigg, B.M. Measuring human locomotor control using EMG and EEG: Current knowledge, limitations and future considerations. Eur. J. Sport Sci. 2016, 16, 416–426. [Google Scholar] [CrossRef]
  10. Kimura, J.; Machida, M.; Ishida, T.; Yamada, T.; Rodnitzky, R.L.; Kudo, Y.; Suzuki, S. Relation between size of compound sensory or muscle action potentials, and length of nerve segment. Neurology 1986, 36, 647. [Google Scholar] [CrossRef]
  11. Kramer, M.; Schmid, I.; Sander, S.; Högel, J.; Eisele, R.; Kinzl, L.; Hartwig, E. Guidelines for the intramuscular positioning of EMG electrodes in the semispinalis capitis and cervicis muscles. J. Electromyogr. Kinesiol. 2003, 13, 289–295. [Google Scholar] [CrossRef] [PubMed]
  12. Campanini, I.; Disselhorst-Klug, C.; Rymer, W.Z.; Merletti, R. Surface EMG in Clinical Assessment and Neurorehabilitation: Barriers Limiting Its Use. Front. Neurol. 2020, 934, 11. [Google Scholar] [CrossRef] [PubMed]
  13. Tanzarella, S.; Muceli, S.; Santello, M.; Farina, D. Synergistic Organization of Neural Inputs from Spinal Motor Neurons to Extrinsic and Intrinsic Hand Muscles. J. Neurosci. 2021, 41, 6878–6891. [Google Scholar] [CrossRef] [PubMed]
  14. Castellini, C.; van der Smagt, P. Surface EMG in advanced hand prosthetics. Biol. Cybern. 2009, 100, 35–47. [Google Scholar] [CrossRef] [PubMed]
  15. Atzori, M.; Gijsberts, A.; Castellini, C.; Caputo, B.; Hager, A.-G.M.; Elsig, S.; Giatsidis, G.; Bassetto, F.; Müller, H. Electromyography data for non-invasive naturally-controlled robotic hand prostheses. Sci. Data 2014, 1, 140053. [Google Scholar] [CrossRef]
  16. Osborn, L.E.; Iskarous, M.M.; Thakor, N.V. Sensing and Control for Prosthetic Hands in Clinical and Research Applications. Wearable Robot. 2020, 1, 445–468. [Google Scholar] [CrossRef]
  17. Sánchez-Velasco, L.E.; Arias-Montiel, M.; Guzmán-Ramírez, E.; Lugo-González, E. A Low-Cost EMG-Controlled Anthropomorphic Robotic Hand for Power and Precision Grasp. Biocybern. Biomed. Eng. 2020, 40, 221–237. [Google Scholar] [CrossRef]
  18. Asogbon, M.G.; Samuel, O.W.; Geng, Y.; Oluwagbemi, O.; Ning, J.; Chen, S.; Ganesh, N.; Feng, P.; Li, G. Towards resolving the co-existing impacts of multiple dynamic factors on the performance of EMG-pattern recognition based prostheses. Comput. Methods Programs Biomed. 2020, 184, 105278. [Google Scholar] [CrossRef]
  19. Aly, H.; Youssef, S.M. Bio-signal based motion control system using deep learning models: A deep learning approach for motion classification using EEG and EMG signal fusion. J. Ambient. Intell. Humaniz. Comput. 2023, 14, 991–1002. [Google Scholar] [CrossRef]
  20. Deng, H.; Xu, X.; Zhuo, W.; Zhang, Y. Current-Sensor-Based Contact Stiffness Detection for Prosthetic Hands. IEEE Access 2020, 8, 29456–29466. [Google Scholar] [CrossRef]
  21. Jiang, X.; Merhi, L.-K.; Xiao, Z.G.; Menon, C. Exploration of Force Myography and surface Electromyography in hand gesture classification. Med. Eng. Phys. 2017, 41, 63–73. [Google Scholar] [CrossRef] [PubMed]
  22. Prakash, A.; Sahi, A.K.; Sharma, N.; Sharma, S. Force myography controlled multifunctional hand prosthesis for upper-limb amputees. Biomed. Signal Process. Control 2020, 62, 102122. [Google Scholar] [CrossRef]
  23. Gentile, C.; Cordella, F.; Rodrigues, C.R.; Zollo, L. Touch-and-slippage detection algorithm for prosthetic hands. Mechatronics 2020, 70, 102402. [Google Scholar] [CrossRef]
  24. Badawy, A.; Alfred, R. Myoelectric prosthetic hand with a proprioceptive feedback system. J. King Saud Univ. Eng. Sci. 2020, 32, 388–395. [Google Scholar] [CrossRef]
  25. Phinyomark, A.; Campbell, E.; Scheme, E. Surface Electromyography (EMG) Signal Processing, Classification, and Practical Considerations. In Biomedical Signal Processing; Springer: Berlin/Heidelberg, Germany, 2020; pp. 3–29. [Google Scholar] [CrossRef]
  26. Meldrum, D.; Cahalane, E.; Conroy, R.; Fitzgerald, D.; Hardiman, O. Maximum voluntary isometric contraction: Reference values and clinical application. Amyotroph. Lateral Scler. 2007, 8, 47–55. [Google Scholar] [CrossRef]
  27. Koral, J.; Oranchuk, D.J.; Wrightson, J.G.; Twomey, R.; Millet, G.Y. Mechanisms of neuromuscular fatigue and recovery in unilateral versus bilateral maximal voluntary contractions. J. Appl. Physiol. 2020, 128, 785–794. [Google Scholar] [CrossRef]
  28. Hermens, H.J.; Freriks, B.; Disselhorst-Klug, C.; Rau, G. Development of recommendations for SEMG sensors and sensor placement procedures. J. Electromyogr. Kinesiol. 2000, 10, 361–374. [Google Scholar] [CrossRef]
  29. Falla, D.; Dall’Alba, P.; Rainoldi, A.; Merletti, R.; Jull, G. Location of innervation zones of sternocleidomastoid and scalene muscles-a basis for clinical and research electromyography applications. Clin. Neurophysiol. 2002, 113, 57–63. [Google Scholar] [CrossRef]
  30. Schetz, M. Assessment of Volume Status. Crit. Care Nephrol. 2009, 95, 499–504. [Google Scholar] [CrossRef]
  31. Barry, D. Sarcopenia. In Textbook of Natural Medicine; Elsevier: Amsterdam, The Netherlands, 2020; pp. 1781–1803.e19. [Google Scholar] [CrossRef]
  32. He, B.; Armaghani, D.J.; Lai, S.H.; Mohamad, E.T. Application of an expert extreme gradient boosting model to predict blast-induced air-overpressure in quarry mines. In Applications of Artificial Intelligence in Mining, Geotechnical and Geoengineering; Elsevier: Amsterdam, The Netherlands, 2024; pp. 269–289. [Google Scholar] [CrossRef]
  33. Dev, V.A.; Eden, M.R. Gradient Boosted Decision Trees for Lithology Classification. In Computer Aided Chemical Engineering; Elsevier: Amsterdam, The Netherlands, 2019; pp. 113–118. [Google Scholar] [CrossRef]
  34. Di Vincenzo, O.; Marra, M.; Di Gregorio, A.; Pasanisi, F.; Scalfi, L. Bioelectrical impedance analysis (BIA) -derived phase angle in sarcopenia: A systematic review. Clin. Nutr. 2021, 40, 3052–3061. [Google Scholar] [CrossRef]
  35. Marzullo, T.C.; Gage, G.J. The SpikerBox: A Low Cost, Open-Source BioAmplifier for Increasing Public Participation in Neuroscience Inquiry. PLoS ONE 2012, 7, e30837. [Google Scholar] [CrossRef] [PubMed]
  36. Braarud, P.Ø. An efficient screening technique for acceptable mental workload based on the NASA Task Load Index—Development and application to control room validation. Int. J. Ind. Ergon. 2020, 76, 102904. [Google Scholar] [CrossRef]
  37. Blackwell, J.R.; Kornatz, K.W.; Heath, E.M. Effect of grip span on maximal grip force and fatigue of flexor digitorum superficialis. Appl. Ergon. 1999, 30, 401–405. [Google Scholar] [CrossRef] [PubMed]
  38. Madarshahian, S.; Letizi, J.; Latash, M.L. Synergic control of a single muscle: The example of flexor digitorum superficialis. J. Physiol. 2021, 599, 1261–1279. [Google Scholar] [CrossRef]
  39. Duque, J.; Masset, D.; Malchaire, J. Evaluation of handgrip force from EMG measurements. Appl. Ergon. 1995, 26, 61–66. [Google Scholar] [CrossRef]
  40. Lehman, G.J.; McGill, S.M. The importance of normalization in the interpretation of surface electromyography: A proof of principle. J. Manip. Physiol. Ther. 1999, 22, 444–446. [Google Scholar] [CrossRef]
  41. Maciukiewicz, J.M.; Lulic, T.; MacKay, K.L.; Meszaros, K.A.; Dickerson, C.R. The influence of posture variation on electromyographic signals in females obtained during maximum voluntary isometric contractions: A shoulder example. J. Electromyogr. Kinesiol. 2022, 62, 102319. [Google Scholar] [CrossRef]
  42. Nordander, C.; Willner, J.; Hansson, G.-A.; Larsson, B.; Unge, J.; Granquist, L.; Skerfving, S. Influence of the subcutaneous fat layer, as measured by ultrasound, skinfold calipers and BMI, on the EMG amplitude. Eur. J. Appl. Physiol. 2003, 89, 514–519. [Google Scholar] [CrossRef]
  43. Tarulli, A.; Chin, A.; Lee, K.; Rutkove, S.B. Impact of skin-subcutaneous fat layer thickness on electrical impedance myography measurements: An initial assessment. Clin. Neurophysiol. 2007, 118, 2393–2397. [Google Scholar] [CrossRef]
  44. Nojima, I.; Suwa, Y.; Sugiura, H.; Noguchi, T.; Tanabe, S.; Mima, T.; Watanabe, T. Smaller muscle mass is associated with increase in EMG–EMG coherence of the leg muscle during unipedal stance in elderly adults. Hum. Mov. Sci. 2020, 71, 102614. [Google Scholar] [CrossRef]
  45. Krings, B.M.; Shepherd, B.D.; Swain, J.C.; Turner, A.J.; Chander, H.; Waldman, H.S.; McAllister, M.J.; Knight, A.C.; Smith, J.W. Impact of Fat Grip Attachments on Muscular Strength and Neuromuscular Activation During Resistance Exercise. J. Strength Cond. Res. 2021, 35, S152–S157. [Google Scholar] [CrossRef] [PubMed]
  46. Abd, M.A.; Ingicco, J.; Hutchinson, D.T.; Tognoli, E.; Engeberg, E.D. Multichannel haptic feedback unlocks prosthetic hand dexterity. Sci. Rep. 2022, 12, 2323. [Google Scholar] [CrossRef] [PubMed]
  47. Kim, K.; Colgate, J.E. Haptic Feedback Enhances Grip Force Control of sEMG-Controlled Prosthetic Hands in Targeted Reinnervation Amputees. IEEE Trans. Neural Syst. Rehabil. Eng. 2012, 20, 798–805. [Google Scholar] [CrossRef] [PubMed]
  48. Dey, A.; Basumatary, H.; Hazarika, S.M. A Decade of Haptic Feedback for Upper Limb Prostheses. IEEE Trans. Med. Robot. Bionics 2023, 5, 793–810. [Google Scholar] [CrossRef]
  49. Jiang, S.; Gao, Q.; Liu, H.; Shull, P.B. A novel, co-located EMG-FMG-sensing wearable armband for hand gesture recognition. Sens. Actuators A Phys. 2020, 301, 111738. [Google Scholar] [CrossRef]
  50. Zheng, Z.; Wu, Z.; Zhao, R.; Ni, Y.; Jing, X.; Gao, S. A Review of EMG-, FMG-, and EIT-Based Biosensors and Relevant Human–Machine Interactivities and Biomedical Applications. Biosensors 2022, 12, 516. [Google Scholar] [CrossRef]
  51. Li, J.; Li, G.; Chen, Z.; Li, J. A Novel EMG-Based Variable Impedance Control Method for a Tele-Operation System Under an Unstructured Environment. IEEE Access 2022, 10, 89509–89518. [Google Scholar] [CrossRef]
  52. Borzelli, D.; D’Avella, A.; Gurgone, S.; Gastaldi, L. Unconstrained and constrained estimation of a linear EMG-to-force mapping during isometric force generation. In Proceedings of the 2022 IEEE International Symposium on Medical Measurements and Applications (MeMeA), Messina, Italy, 22–24 June 2022; pp. 1–6. [Google Scholar] [CrossRef]
  53. Ding, K.; Zhang, B.; Ling, Z.; Chen, J.; Guo, L.; Xiong, D.; Wang, J. Quantitative Evaluation System of Wrist Motor Function for Stroke Patients Based on Force Feedback. Sensors 2022, 22, 3368. [Google Scholar] [CrossRef]
  54. Li, J.; Zhu, Z.; Boyd, W.J.; Martinez-Luna, C.; Dai, C.; Wang, H.; Wang, H.; Huang, X.; Farrell, T.R.; Clancy, E.A. Virtual regression-based myoelectric hand-wrist prosthesis control and electrode site selection using no force feedback. Biomed Signal Process Control. 2023, 82, 104602. [Google Scholar] [CrossRef]
  55. Barontini, F.; Van Straaten, M.; Catalano, M.G.; Thoreson, A.; Lopez, C.; Lennon, R.; Bianchi, M.; Andrews, K.; Santello, M.; Bicchi, A.; et al. Evaluating the effect of non-invasive force feedback on prosthetic grasp force modulation in participants with and without limb loss. PLoS ONE 2023, 18, e0285081. [Google Scholar] [CrossRef]
  56. Choi, Y.; Lee, S.; Sung, M.; Park, J.; Kim, S.; Choi, Y. Development of EMG-FMG Based Prosthesis With PVDF-Film Vibrational Feedback Control. IEEE Sens. J. 2021, 21, 23597–23607. [Google Scholar] [CrossRef]
  57. Flanders, M.; Soechting, J.F. Arm muscle activation for static forces in three-dimensional space. J. Neurophysiol. 1990, 64, 1818–1837. [Google Scholar] [CrossRef] [PubMed]
  58. Siemionow, V.; Yue, G.H.; Ranganathan, V.K.; Liu, J.Z.; Sahgal, V. Relationship between motor activity-related cortical potential and voluntary muscle activation. Exp. Brain Res. 2000, 133, 303–311. [Google Scholar] [CrossRef] [PubMed]
  59. Gao, J.; Ma, C.; Wu, D.; Xu, X.; Wang, S.; Yao, J. Recognition of Human Motion Intentions Based on Bayesian-Optimized XGBOOST Algorithm. J. Sens. 2022, 2022, 3015645. [Google Scholar] [CrossRef]
  60. Cheng, S.; Wu, L.; Zhang, S.; Zhang, D.; Liu, F.; Wang, H.; Xie, P. A Model for Lumbar EMG Signal Recognition Based on Stacking Integration Learning. IEEE Sens. J. 2023, 23, 3766–3775. [Google Scholar] [CrossRef]
  61. Ptaszkowski, K.; Wlodarczyk, P.; Paprocka-Borowicz, M. The Relationship Between the Electromyographic Activity Of Rectus And Oblique Abdominal Muscles And Bioimpedance Body Composition Analysis-A Pilot Observational Study. Diabetes Metab. Syndr. Obes. 2019, 12, 2033–2040. [Google Scholar] [CrossRef]
  62. Gallón, V.M.; Vélez, S.M.; Ramírez, J.; Bolaños, F. Comparison of machine learning algorithms and feature extraction techniques for the automatic detection of surface EMG activation timing. Biomed. Signal Process. Control 2024, 94, 106266. [Google Scholar] [CrossRef]
  63. Larivière, C.; Arsenault, A.; Gravel, D.; Gagnon, D.; Loisel, P.; Vadeboncoeur, R. Electromyographic assessment of back muscle weakness and muscle composition: Reliability and validity issues. Arch. Phys. Med. Rehabil. 2002, 83, 1206–1214. [Google Scholar] [CrossRef]
  64. Jochumsen, M.; Waris, A.; Kamavuako, E.N. The effect of arm position on classification of hand gestures with intramuscular EMG. Biomed. Signal Process. Control 2018, 43, 1–8. [Google Scholar] [CrossRef]
  65. Funk, D.A.; An, K.N.; Morrey, B.F.; Daube, J.R. Electromyographic analysis of muscles across the elbow joint. J. Orthop. Res. 1987, 5, 529–538. [Google Scholar] [CrossRef]
  66. Doheny, E.P.; Lowery, M.M.; FitzPatrick, D.P.; O’malley, M.J. Effect of elbow joint angle on force–EMG relationships in human elbow flexor and extensor muscles. J. Electromyogr. Kinesiol. 2008, 18, 760–770. [Google Scholar] [CrossRef] [PubMed]
  67. Zhou, H.; Alici, G. Non-Invasive Human-Machine Interface (HMI) Systems with Hybrid On-Body Sensors for Controlling Upper-Limb Prosthesis: A Review. IEEE Sens. J. 2022, 22, 10292–10307. [Google Scholar] [CrossRef]
  68. Wolf, E.J.; Cruz, T.H.; Emondi, A.A.; Langhals, N.B.; Naufel, S.; Peng, G.C.Y.; Schulz, B.W.; Wolfson, M. Advanced technologies for intuitive control and sensation of prosthetics. Biomed. Eng. Lett. 2020, 10, 119–128. [Google Scholar] [CrossRef] [PubMed]
  69. Fleming, A.; Stafford, N.; Huang, S.; Hu, X.; Ferris, D.P.; Huang, H. Myoelectric control of robotic lower limb prostheses: A review of electromyography interfaces, control paradigms, challenges and future directions. J. Neural Eng. 2021, 18, 041004. [Google Scholar] [CrossRef]
  70. Pribis, P.; Burtnack, C.A.; Mckenzie, S.O.; Thayer, J. Trends in Body Fat, Body Mass Index and Physical Fitness Among Male and Female College Students. Nutrients 2010, 2, 1075–1085. [Google Scholar] [CrossRef]
  71. Aimé, J.; Simoneau, D.; Bouchard, C. Skeletal Muscle Metabolism and Body Fat Content in Men and Women. Obes. Res. 1995, 3, 23–29. [Google Scholar] [CrossRef]
Figure 1. Block diagram of the proposed methodology and step-by-step procedure.
Prosthesis 06 00106 g001
Figure 2. Experimental setup: (a) The surface EMG recording setup; (b) Hand dynamometer for measurement of the grip force; (c) The BIA scale for the body parameter measurement.
Prosthesis 06 00106 g002
Figure 3. Steps used while recording the data of the subjects. The data were recorded in three stages—the body parameters, EMG data, and force data—followed by the process of assessment in the form of feedback.
Prosthesis 06 00106 g003
Figure 4. The calculation of the weight and other body parameters with the help of the BIA approach.
Prosthesis 06 00106 g004
Figure 5. The placement of the surface electrodes on the skin surface just above the FDS muscle.
Prosthesis 06 00106 g005
Figure 6. The subject while the reading was taken. The body is in a standing position; the hand is in a rest state at full extension.
Prosthesis 06 00106 g006
Figure 7. Analysis of multi-variable input data using XGBoost regressor in proposed work.
Prosthesis 06 00106 g007
Figure 8. EMG values vs. the force: (a) the force vs. EMG data with all the subjects combined; (b) the individual force vs. EMG data at different force levels.
Prosthesis 06 00106 g008
Figure 9. The value of r2 demonstrates the relationship between the EMG values and the grip force, with 0.93 being the highest, and 0.83 being the value for the highest number of cases.
Prosthesis 06 00106 g009
Figure 10. The inversely proportional relationship between the body fat and the EMG signal.
Prosthesis 06 00106 g010
Figure 11. Impact of body parameters on EMG values: (a) the force exerting capabilities with respect to muscle mass; (b) the direct proportional relationship of the muscle mass with EMG values.
Prosthesis 06 00106 g011
Figure 12. The significance of the body parameters when recording an EMG signal.
Prosthesis 06 00106 g012
Table 1. Force and EMG readings at different force levels (Avg.: Average; St. D.: Standard Deviation).
SubjectForceEMG
MVC50% of MVC25% of MVCMVC50% of MVC25% of MVC
Avg.St. D.Avg.St. D.Avg.St. D.Avg.St. D.Avg.St. D.Avg.St. D.
131.303.531611.842.58975.601.818817.204.261540.89441.680.2993
225.321.407714.521.92715.741.246811.402.05914.60.80002.20.6812
348.983.726930.762.133214.142.716318.202.22719.21.60002.20.4000
434.882.554519.143.281811.101.472492.007.48333410.1980151.7889
539.302.977224.903.053511.461.540932.0011.6619224.00006.42.0591
642.561.051919.382.746913.101.360938.009.798018.22.400011.82.7129
748.161.625521.443.833311.660.833332.0011.661914.83.42938.40.4899
839.444.393021.843.157612.223.074034.008.000018.22.227110.23.3106
947.823.458027.145.92419.542.926836.0010.198018.65.74804.61.4967
1043.280.976520.841.813913.380.825819.201.600019.21.60008.80.7483
1140.200.576219.722.973512.421.064772.007.483319.41.200011.22.6382
1261.023.178330.741.241918.501.492742.004.000018.41.356581.5492
1324.961.419312.541.73517.081.114317.002.44956.61.35653.81.3267
1444.282.881222.161.880011.261.937638.004.000014.41.35656.61.9596
1558.142.392223.621.917712.701.531022.004.00006.80.74834.61.0198
1624.161.926211.542.39225.560.818813.402.154151.09553.141.8217
1749.582.182125.482.371811.722.102847.006.000016.23.12416.20.9798
1828.280.453411.020.56717.800.871814.403.26197.61.019860.8944
1945.201.502018.822.015310.481.513116.400.489970.63254.40.8000
2029.661.100214.022.68065.400.983920.000.00005.41.49671.880.1600
2134.382.163713.961.84248.781.119624.004.899070.00004.81.1662
2233.921.788214.943.50866.981.373216.201.83306.41.85472.40.4899
2334.641.121815.560.72288.420.519212.801.939180.89444.80.4000
2433.881.352617.801.06968.661.036538.007.483319.21.60007.60.8000
2521.400.761612.121.16864.780.240038.007.483318.22.22716.60.8000
2641.521.410522.662.178613.021.098032.009.798091.09553.40.8000
2739.881.367321.221.043814.420.897630.000.000016.41.019891.0955
2846.663.883620.081.449712.861.456920.000.00009.60.48997.20.9798
2930.141.048014.161.76938.141.478720.000.00007.41.019841.0955
3026.701.419915.440.53146.140.909120.000.000010.41.01984.80.9798
3121.521.903113.221.48927.960.811419.201.600013.61.74368.61.2000
3231.283.506816.822.65899.181.373223.605.27649.61.019841.2649
3321.672.305611.242.28797.020.98069.802.40004.60.48992.60.4899
3436.944.000820.162.019512.441.761418.601.9596160.63257.20.9798
3540.984.820025.301.986013.801.313042.009.798018.81.60009.41.3565
3629.922.970815.262.75946.561.763622.006.81188.61.356530.8944
3739.762.411322.322.793111.361.516117.203.48719.81.60003.80.9798
Table 2. The comparison between this study and previous studies conducted in the same domain.
ReferenceYear of StudyNumber of SubjectsMuscle of InterestBody ParametersNumber of Force StatesMachine LearningForce–EMG Relationship Characterization
[46]202212No2Concurrent application of two distinct amplitude forces via a robotic hand
[51]2022No3The implementation of a user impedance control strategy
[52]20225Upper limb muscle and OpenSim upper limb modelNoLinear MappingComparing force estimation between constrained and unconstrained environments
[53]202235Wrist motor muscleNoImplementation of force feedback for the purpose of post-stroke rehabilitation
[54]202315Site selection via calibration periodNoSelection of the ideal number of electrodes and optimal placement area
[55]202324Upper armNoThe application of force feedback using a wearable haptic device
[56]2021NoThe utilization of EMG as a command input for a vibration sensory methodology
Current Study202337Flexor digitorum superficialis (FDS)Fat level, muscle mass, subcutaneous fat3Incorporating physiological parameters, an examination of the relationship between force and EMG measurements
Disclaimer/Publisher’s Note: The statements, opinions and data contained in all publications are solely those of the individual author(s) and contributor(s) and not of MDPI and/or the editor(s). MDPI and/or the editor(s) disclaim responsibility for any injury to people or property resulting from any ideas, methods, instructions or products referred to in the content.

