1. Introduction
The transition toward decarbonized transport fuels is primarily driven by the mandates of Directive 2003/87/EC, Decision (EU) 2015/1814, and Regulation (EU) 2015/757 [
1]. These frameworks establish a comprehensive global strategy to mitigate anthropogenic global warming by 2050. Furthermore, recent legislative actions by various European Union (EU) member states, mandating that all new vehicles sold on the EU market must be zero-emission by 2035, represent a decisive commitment to intensifying research into alternative fuel technologies.
In the maritime sector, the vast majority of vessels continue to rely on fossil fuels. Currently, the fuel share is dominated by Heavy Fuel Oil (HFO) at 72%, followed by Marine Diesel Oil (MDO) at 26%, and Liquefied Natural Gas (LNG) at 2% [
2].
The escalating demands of global trade have resulted in the maritime industry consuming approximately 300 million tons of fossil fuels annually [
3]. Consequently, the combustion of these fuels in shipping accounts for roughly 1.056 billion tons of CO
2 emissions. Furthermore, the broader transportation and agricultural sectors collectively contribute more than 8 billion tons of CO
2 per year.
Within this framework, hydrogen and ammonia are poised to play a pivotal role in decarbonizing not only the transport industry [
4], encompassing terrestrial, maritime, and aerial modes, but also the energy sector and other industries that contribute significantly to anthropogenic greenhouse gas emissions [
5].
The primary vector for decarbonization involves electricity generated from renewable energy sources, subsequently stored as green hydrogen or ammonia. The adoption of these carriers as alternative fuels requires a rapid expansion of renewable power generation capacity [
6], projected to reach approximately 120,000 TWh by 2050, a four- to fivefold increase over current levels. Simultaneously, a substantial reduction in production costs is essential to ensure economic competitiveness and facilitate widespread implementation [
7].
Ammonia serves as an effective hydrogen carrier, offering a volumetric energy density approximately three times that of hydrogen [
8]. Furthermore, ammonia facilitates more straightforward storage, as it can be maintained in liquid phase at 298 K and 10 bar [
9]. Given that many countries already possess extensive infrastructure and technical expertise in the production, storage, and distribution of ammonia [
10], it represents a highly promising zero-carbon fuel across various industrial and transport sectors.
Despite its potential, utilizing ammonia in internal combustion engines (ICE) presents several technical challenges [
11,
12,
13]. These include a low heating value [
14], a low boiling point, and a reduced laminar burning velocity [
11,
15] (see
Table 1). Furthermore, ammonia exhibits a high auto-ignition temperature [
14], an elevated minimum ignition energy [
16], and a low adiabatic flame temperature [
11,
13]. Combined with a prolonged ignition delay [
13,
15], low radiation intensity, high latent heat of vaporization [
14], and narrow flammability limits [
13,
14], these characteristics complicate its use as a monofuel in ICE applications.
The physicochemical properties of various fuels for reciprocating internal combustion engines are summarized in
Table 1.
Combustion under fuel-rich conditions can mitigate the formation of NO
x emissions but produces higher quantities of unreacted ammonia. The equivalence ratio should be maintained at approximately 1.1 to limit NO
x emissions and residual ammonia levels [
17].
Nadimi et al. experimentally investigated ammonia/biodiesel dual-fuel operation on a single-cylinder, four-stroke Lifan C186F diesel engine. A maximum of 69.4% of the input energy was provided by ammonia under stable operating conditions. Results indicated that the brake thermal efficiency (BTE) decreased from 31.8% for pure biodiesel to 29.4% at the highest ammonia energy ratio under full load. As ammonia replaced biodiesel, CO
2, CO, and total unburnt hydrocarbon (THC) emissions decreased significantly; specifically, CO
2 decreased by 510 g/kWh and CO by 30.1 g/kWh. However, NO emissions increased with higher ammonia flow rates, attributed to the fuel-bound nitrogen in NH
3 [
18].
Salek et al. numerically studied the impact of adding 10% ammonia on engine performance and emissions across a wide range of engine speeds for a spark-ignition (SI) engine using AVL BOOST software. The results showed that a 10% ammonia injection reduces the peak in-cylinder temperature by 50 K, resulting in a significant 50% reduction in NO
x emissions throughout the investigated speed range. Furthermore, the minimum octane number required to avoid knock was decreased by the injection of 10% ammonia, indicating that ammonia enrichment can effectively mitigate knock-induced engine failure [
19].
Reiter and Kong investigated the impact of injecting gaseous ammonia into the intake manifold on the emissions and combustion characteristics of a compression-ignition (CI) engine. They tested different ammonia/diesel energy ratios at constant power output, focusing on an operating range of 40% to 60% ammonia energy share to achieve optimal fuel efficiency. Their experimental results demonstrated that when the ammonia energy contribution exceeded 60%, NO emissions increased significantly, whereas soot emissions decreased with higher ammonia ratios [
20].
The cited studies focused on researching internal combustion engines’ operation with various combinations of diesel and ammonia in different fractions. The present study offers experimental data for diesel engines operating with diesel–ammonia mixtures when ammonia is injected by port-fuel sequential mode, with different durations and timings, which is a novel research condition.
Ammonia has long been regarded as a potential candidate for power generation and has garnered significant interest in recent years. While technical challenges persist, ammonia is recognized as a promising alternative fuel for future power systems. Current research and an expanding body of work are accelerating the development of viable solutions, positioning ammonia as a vital component in the transition toward a sustainable energy sector [
21].
Recent advancements in the field have increasingly focused on pushing the boundaries of ammonia substitution, with modern literature demonstrating the feasibility of higher energy share ratios to further minimize carbon reliance [
22].
2. Test Bench Description
The research was conducted on a naturally aspirated, four-stroke UTB 2404055 tractor diesel engine. The engine features a compression ratio (CR) of 17.5, with a rated speed of 2400 rpm and a nominal power output of 48 kW. Detailed technical specifications for the engine are summarized in
Table 2.
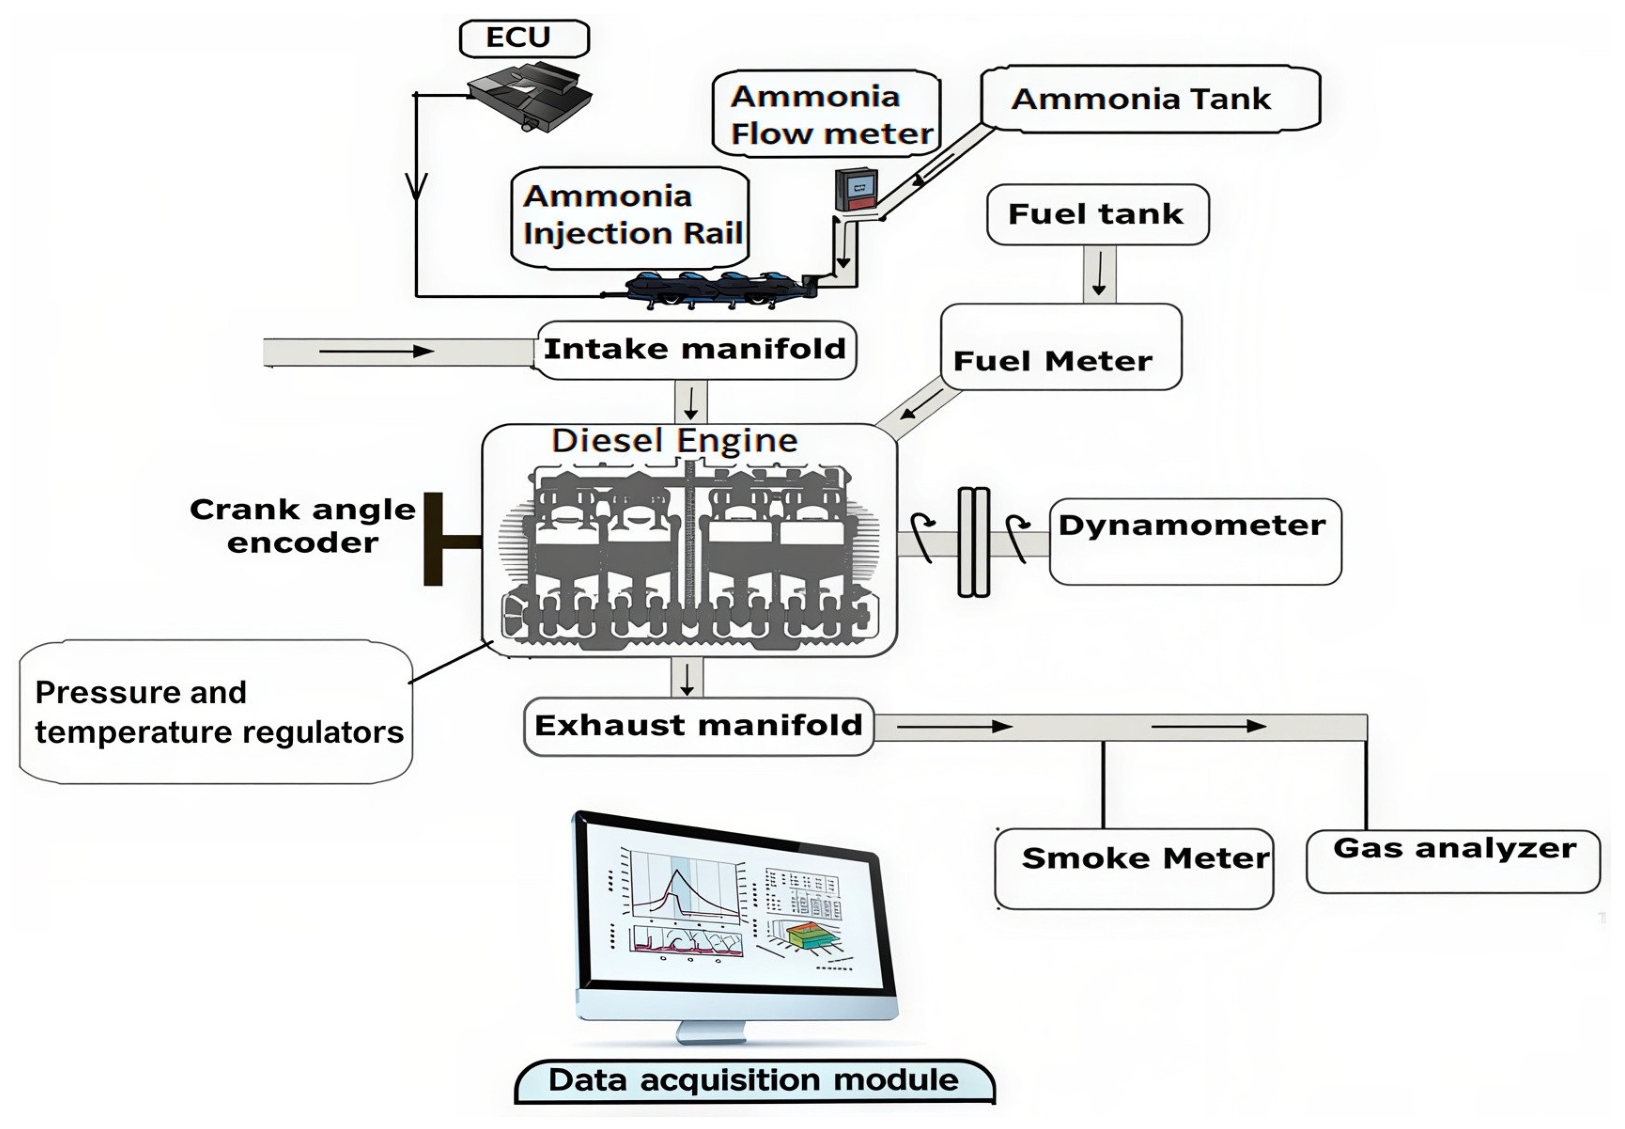
The engine was installed in a test cell equipped with the necessary instrumentation for experimental research (
Figure 1). An AVL Alpha 160 eddy current dynamometer was utilized to accurately measure instantaneous engine torque and speed. Control and monitoring of the test equipment were managed via an AVL EMCON 400 controller.
For exhaust emissions analysis and determination of the relative air–fuel ratio, a HORIBA Mexa 7170D gas analyzer was employed to measure CO
2, CO, NO
x, and THC emissions. Simultaneously, exhaust smoke opacity was quantified as Filter Smoke Number (FSN) using an AVL 415S smokemeter. For this experimental campaign, the ammonia slip was not measured due to the lack of a dedicated instrument.
Table 3 presents the measurement ranges and calculated error uncertainties of the emission testing instruments.
Various parameters, including the temperature and pressure of the exhaust gas, cooling water, intake air, and oil, as well as ambient conditions, were continuously monitored via dedicated sensors and recorded using the AVL Puma Open v1.4 system.
The ammonia fuel supply system was developed in collaboration with Liquid Ammonia Sustainable Technologies and FEV ECE Automotive. Operating on a principle similar to Liquefied Petroleum Gas (LPG) systems, ammonia was injected in its gaseous phase into the intake manifold. Landi Renzo supplied the ammonia injectors and injection rail, while a MegaSquirt 3 Engine Management System (EMS) served as the Electronic Control Unit (ECU). Parameter tuning and calibration were conducted using the TunerStudio MS v3.1.08 software.
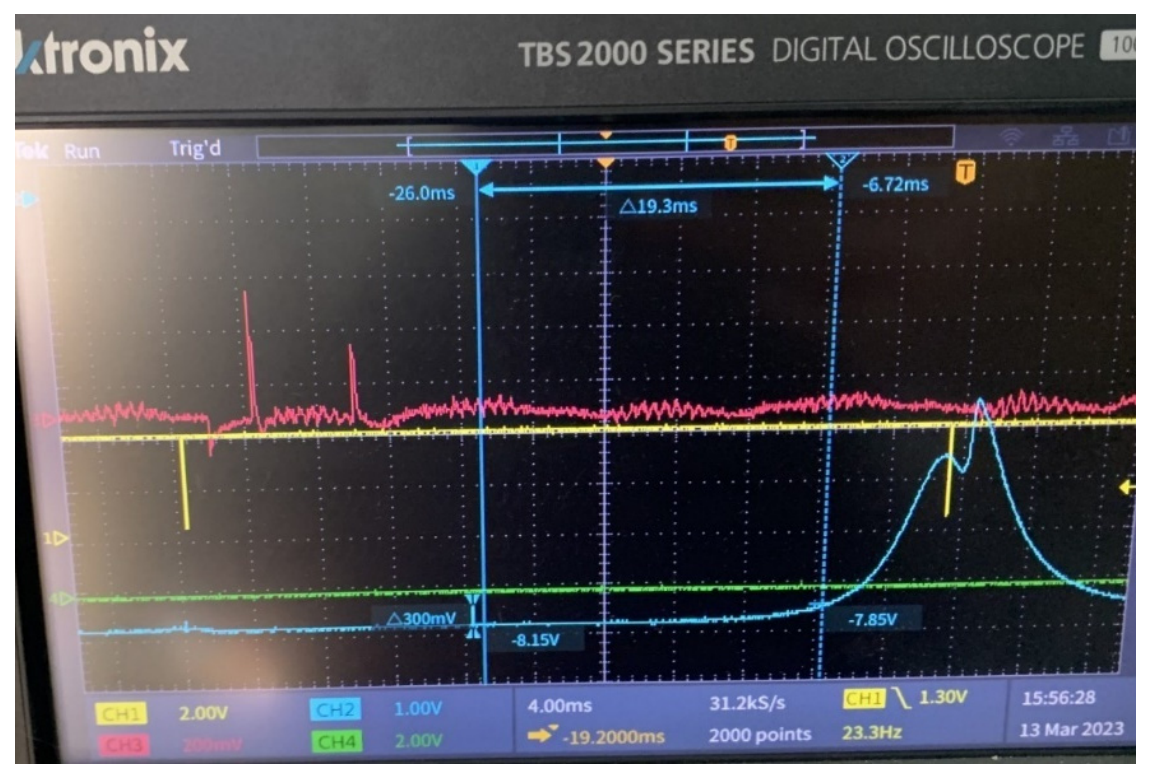
The ECU, guided by signals indicating the camshaft position and the top dead center (TDC) piston position, initiated injection events that were precisely synchronized with the intake valve position. This adjustment of the injection signal was accomplished through the control of both the crank angle timing and the signal duration. The injection duration (or signal length) was established within a range of 4 to 20 milliseconds and remained adjustable in 2-millisecond increments to ensure accurate control over the fueling parameters. The ammonia pressure was stabilized using a specific pressure regulator. The real-time ammonia injection parameters and combustion characteristics, evaluated using in-cylinder pressure traces captured via an oscilloscope, are illustrated in
Figure 2. These data, in conjunction with the primary engine operating conditions and the sequential fuel injection parameters detailed in
Table 4, constituted the baseline for the experimental control strategy.
A Hall-effect sensor was used to detect pulses from the flywheel, with one of the flywheel teeth being machined deeper to identify a complete crankshaft revolution. Simultaneously, a second Hall-effect sensor was employed to monitor the rocker arm during the intake valve lift to define the corresponding piston position within the engine cycle.
These data, alongside the engine speed-dependent intake valve characteristics (
Table 5), provided the foundation for defining the ammonia injection strategy and the calibration parameters for the wheel decoder.
To optimize the combustion process, the ammonia injection timing was accurately tuned. A range of specific values was experimentally evaluated, and the optimal timing was selected to provide the most favorable balance between engine performance and exhaust emission levels.
Table 6 illustrates an example of the injection timing table used in this study. The investigation was conducted across two distinct operating points, where the same injection advance was found to be optimal for both cases.
3. Results and Discussions
Different engine operating conditions, specifically the maximum torque speed of 1400 rpm across several loads, were considered for the tests in this study. The engine-dynamometer unit was configured for constant speed/constant torque operation; consequently, diesel fuel consumption was automatically adjusted via the throttle actuator controlled by the test bed computer. During this investigation, experimental data were gathered at engine loads of 40% and 60%, combined with four distinct levels of ammonia injection at optimal injection timing. The engine was initially operated on pure diesel (D100%) to establish a reference baseline and subsequently transitioned to dual-fuel mode using various diesel–ammonia mixtures (Diesel + ammonia).
For each experimental test point, at least three independent repetitions were conducted, with each test involving the acquisition of 200 consecutive engine cycles. The resulting datasets comprised cycle-by-cycle records, multi-cycle averages, and statistical metrics. The coefficient of variation (COV) for peak in-cylinder pressure was found to be less than 3%. Throughout the testing, the oil temperature was regulated at 85 ± 5 °C using a heat exchanger system equipped with two OMRON E5CN temperature controllers and solenoid valves.
The engine cooling water temperature was maintained within the range of 70 ± 5 °C.
Two partial loads, 132 Nm and 180 Nm, were established as the reference operating conditions for the tests conducted in this study. The resulting values for these reference conditions are summarized in
Table 7.
Subsequently, a series of tests was performed to establish the optimal ammonia injection timing. These experiments were conducted at loads of 132 Nm and 180 Nm (maintaining the constant speed of 1400 rpm). For these evaluations, the volumetric flow rate of ammonia was held constant by maintaining an injection duration of 8 ms (equivalent to 1.5 m
3/h). The injection timings were varied from 60 to −40 deg CA (degrees crank angle with positive values before gas exchange TDC and negative values after TDC) in 20 deg CA increments. Ammonia supply was regulated at 2 bar gauge pressure, while a dedicated thermal management system maintained the temperature of ammonia at 15 °C. Consistent with the baseline procedure, three trials were conducted for each point, and the resulting averaged data are summarized in
Table 8.
The mass and energy percentages of ammonia in the mixture are defined as
where
and
are the fuel consumptions for diesel and ammonia, and Q
D and
are their corresponding lower heating values.
To evaluate the brake fuel consumption (BSFC) and the brake thermal efficiency (BTE) for diesel–ammonia mixtures, an equivalent heating value (
) was calculated based on the individual lower heating values of each fuel component:
where %
D and %
NH3 are the mass fractions of diesel and ammonia.
Total fuel consumption for the mixture (
) is calculated as the sum of its individual components:
where
and
denote the mass flow rates (in kg/h) of diesel and ammonia respectively.
The following formulas were used to calculate the BTE and BSFC of the mixtures:
where P
e is the engine brake power.
For evaluation of the corrected relative air–fuel ratio, the stoichiometric air–fuel ratios for diesel and ammonia are defined as and .
The HORIBA gas analyzer calculates the relative air–fuel ratio by applying Brettschneider’s formula based only on what it can sense (diesel carbon and leftover oxygen). It does not take into account the stoichiometric air–fuel ratio of the mixture:
The evaluation of the corrected relative air–fuel ratio can be evaluated as:
where
is the relative air–fuel ratio from the HORIBA gas analyzer.
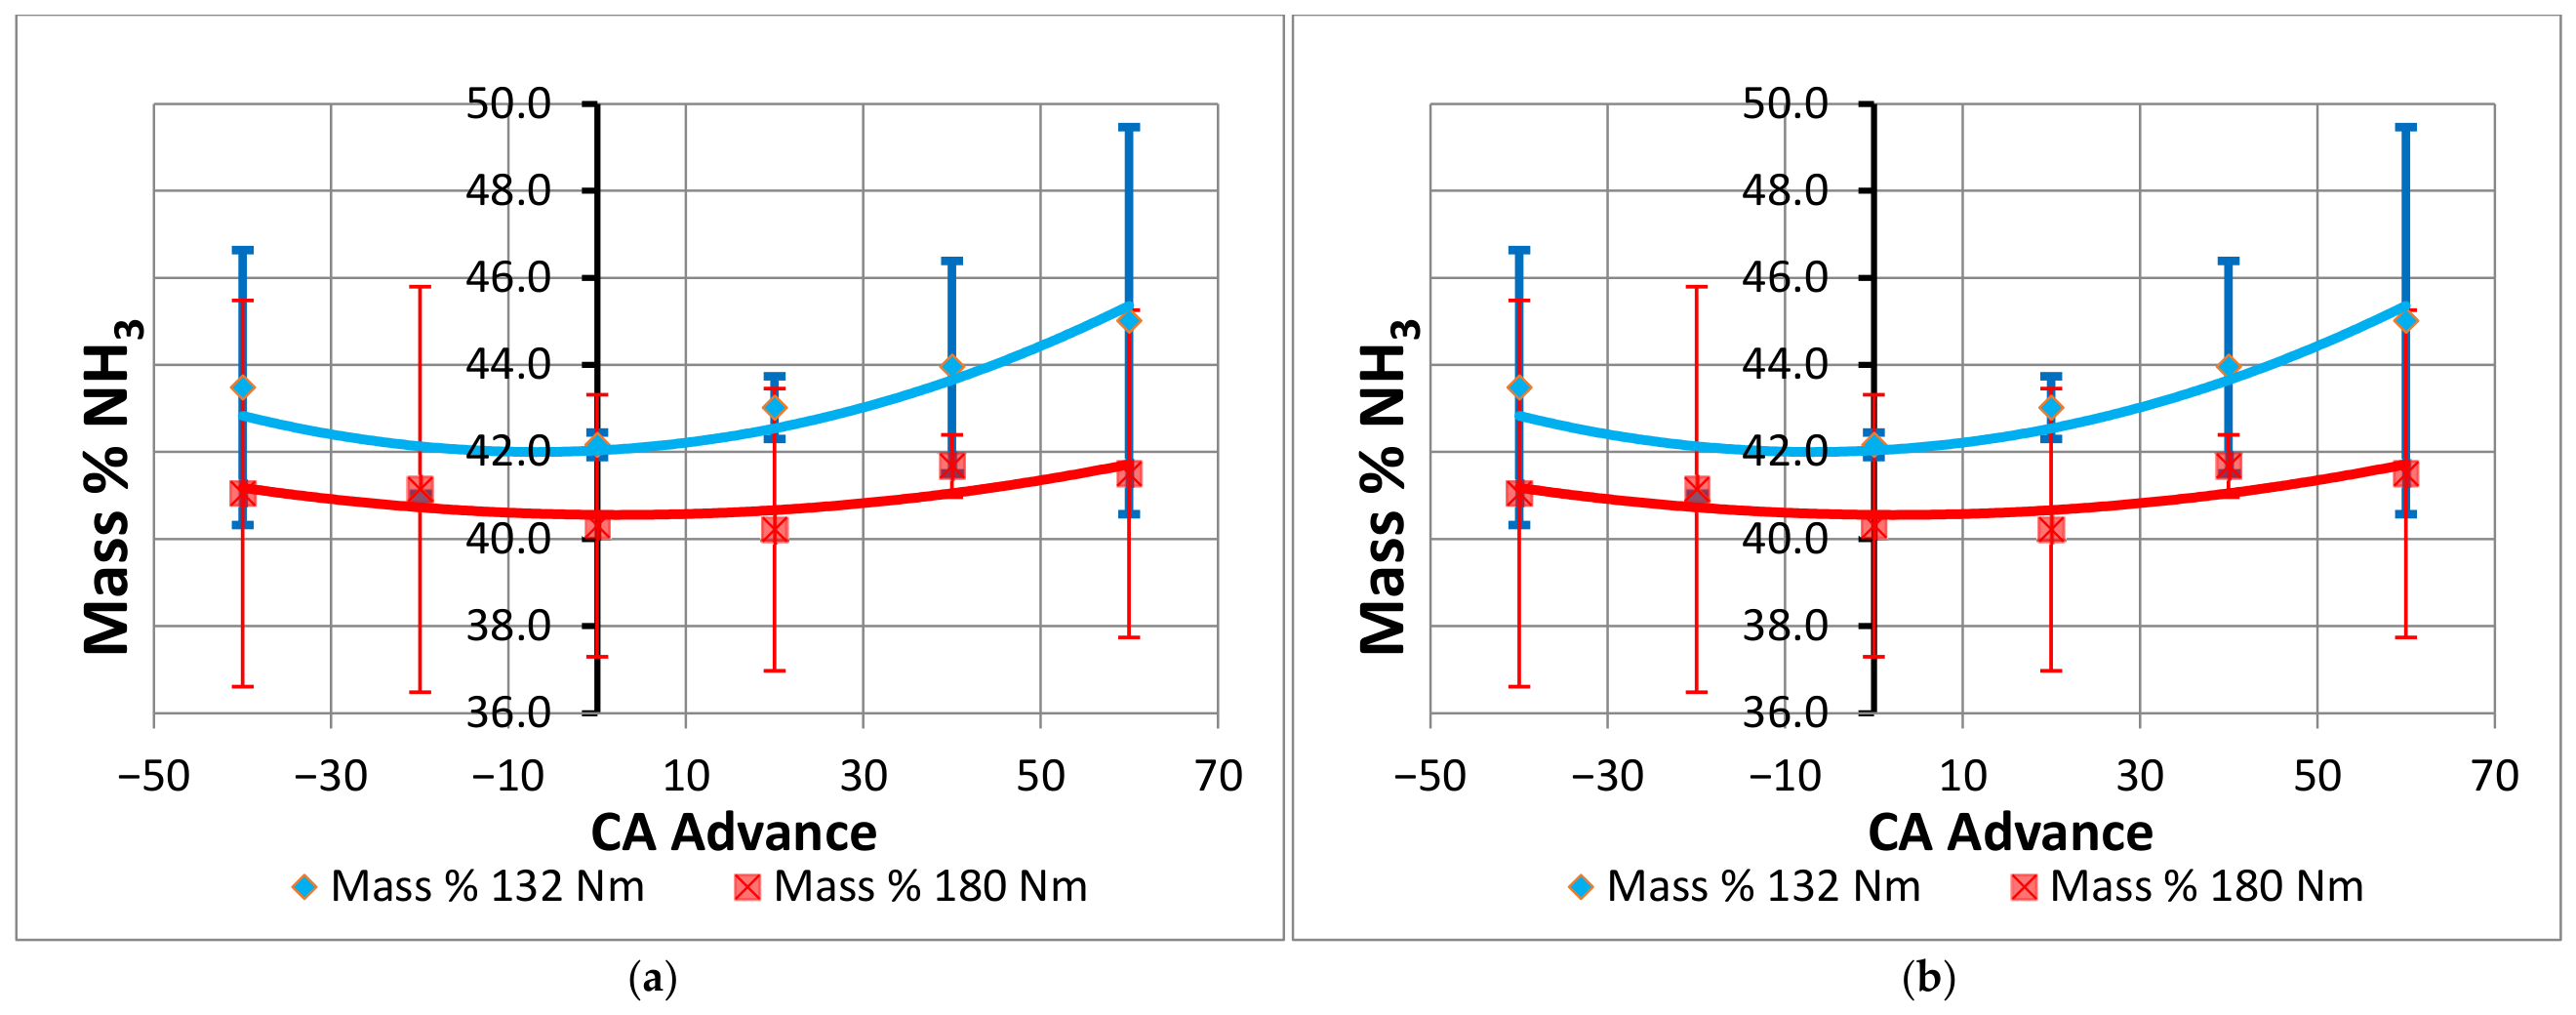
Figure 3 shows the variation in mass (a) and energy (b) percentages of ammonia relative to injection timing.
The effect of NH3 injection timing on mass and energy fractions is highly dependent on engine load. The mass percentage of NH3 increases at advanced injection timings for both evaluated loads. Advancing the injection timing beyond 20 deg CA enhances the energy share of NH3 at both a lower load (132 Nm) and a higher load (180 Nm), highlighting a trade-off in fuel utilization strategies across different operating regimes. As indicated by the error bars, the maximum percentage variations are limited to 4.4% for mass and 6.1% for energy.
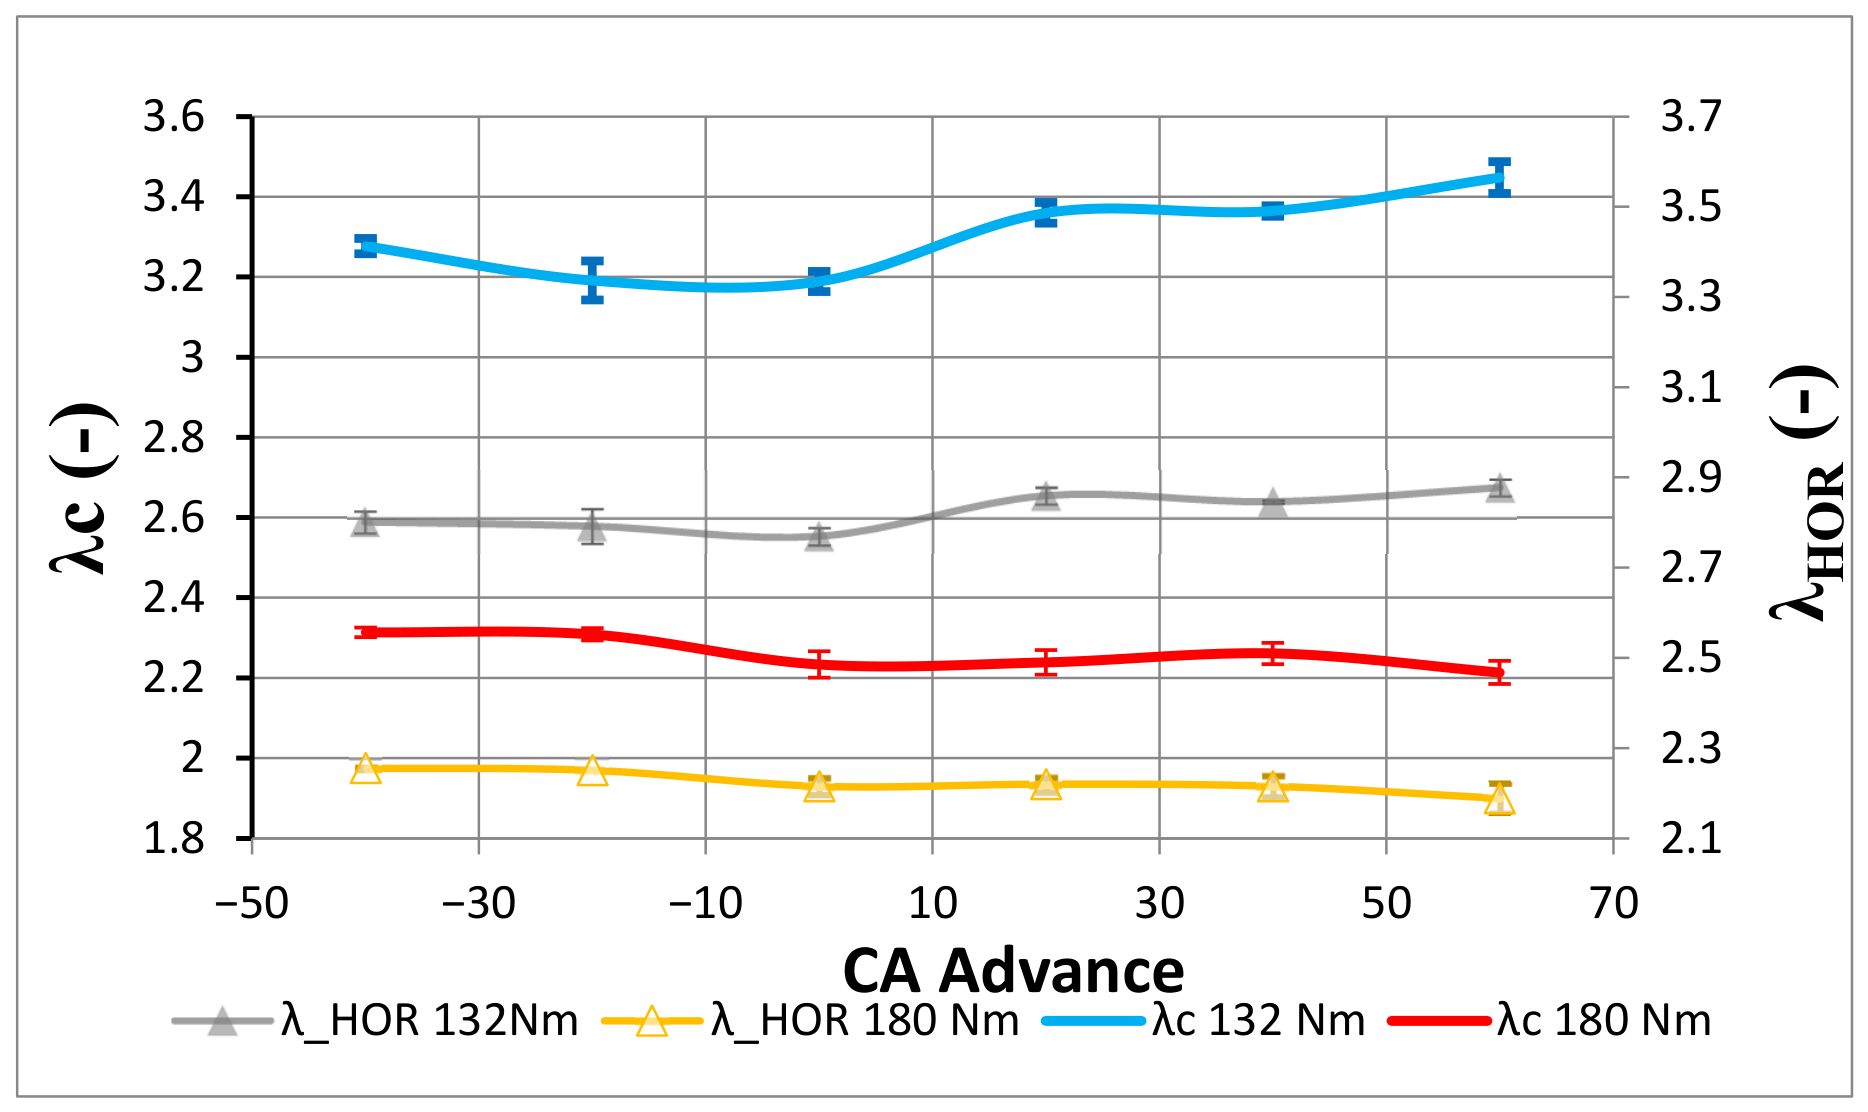
Figure 4 depicts the variation in the HORIBA analyzer relative air–fuel ratio and corrected relative air–fuel ratio versus the ammonia injection timing.
Ammonia possesses a significantly lower stoichiometric air–fuel ratio compared to conventional diesel fuel. Consequently, as the mass percentage of ammonia within the fuel blend increases, it exerts a downward pull on the overall mixture’s stoichiometric requirement. Because the blend requires less air for complete combustion per unit of fuel than pure diesel, operating under similar physical air supply conditions inherently shifts the corrected relative air–fuel ratio upward. This trend highlights the necessity of intake air management in ammonia–diesel dual-fuel engines.
Increasing the engine torque from 132 Nm to 180 Nm shifts both the apparent and corrected lambda curves downward. This behavior aligns with standard internal combustion physics; meeting the higher torque demand requires a higher total fuel mass flow rate, which inherently pushes the combustion environment into a richer zone. As indicated by the error bars, the maximum percentage variations are limited to 3% for λ analyzer and calculated.
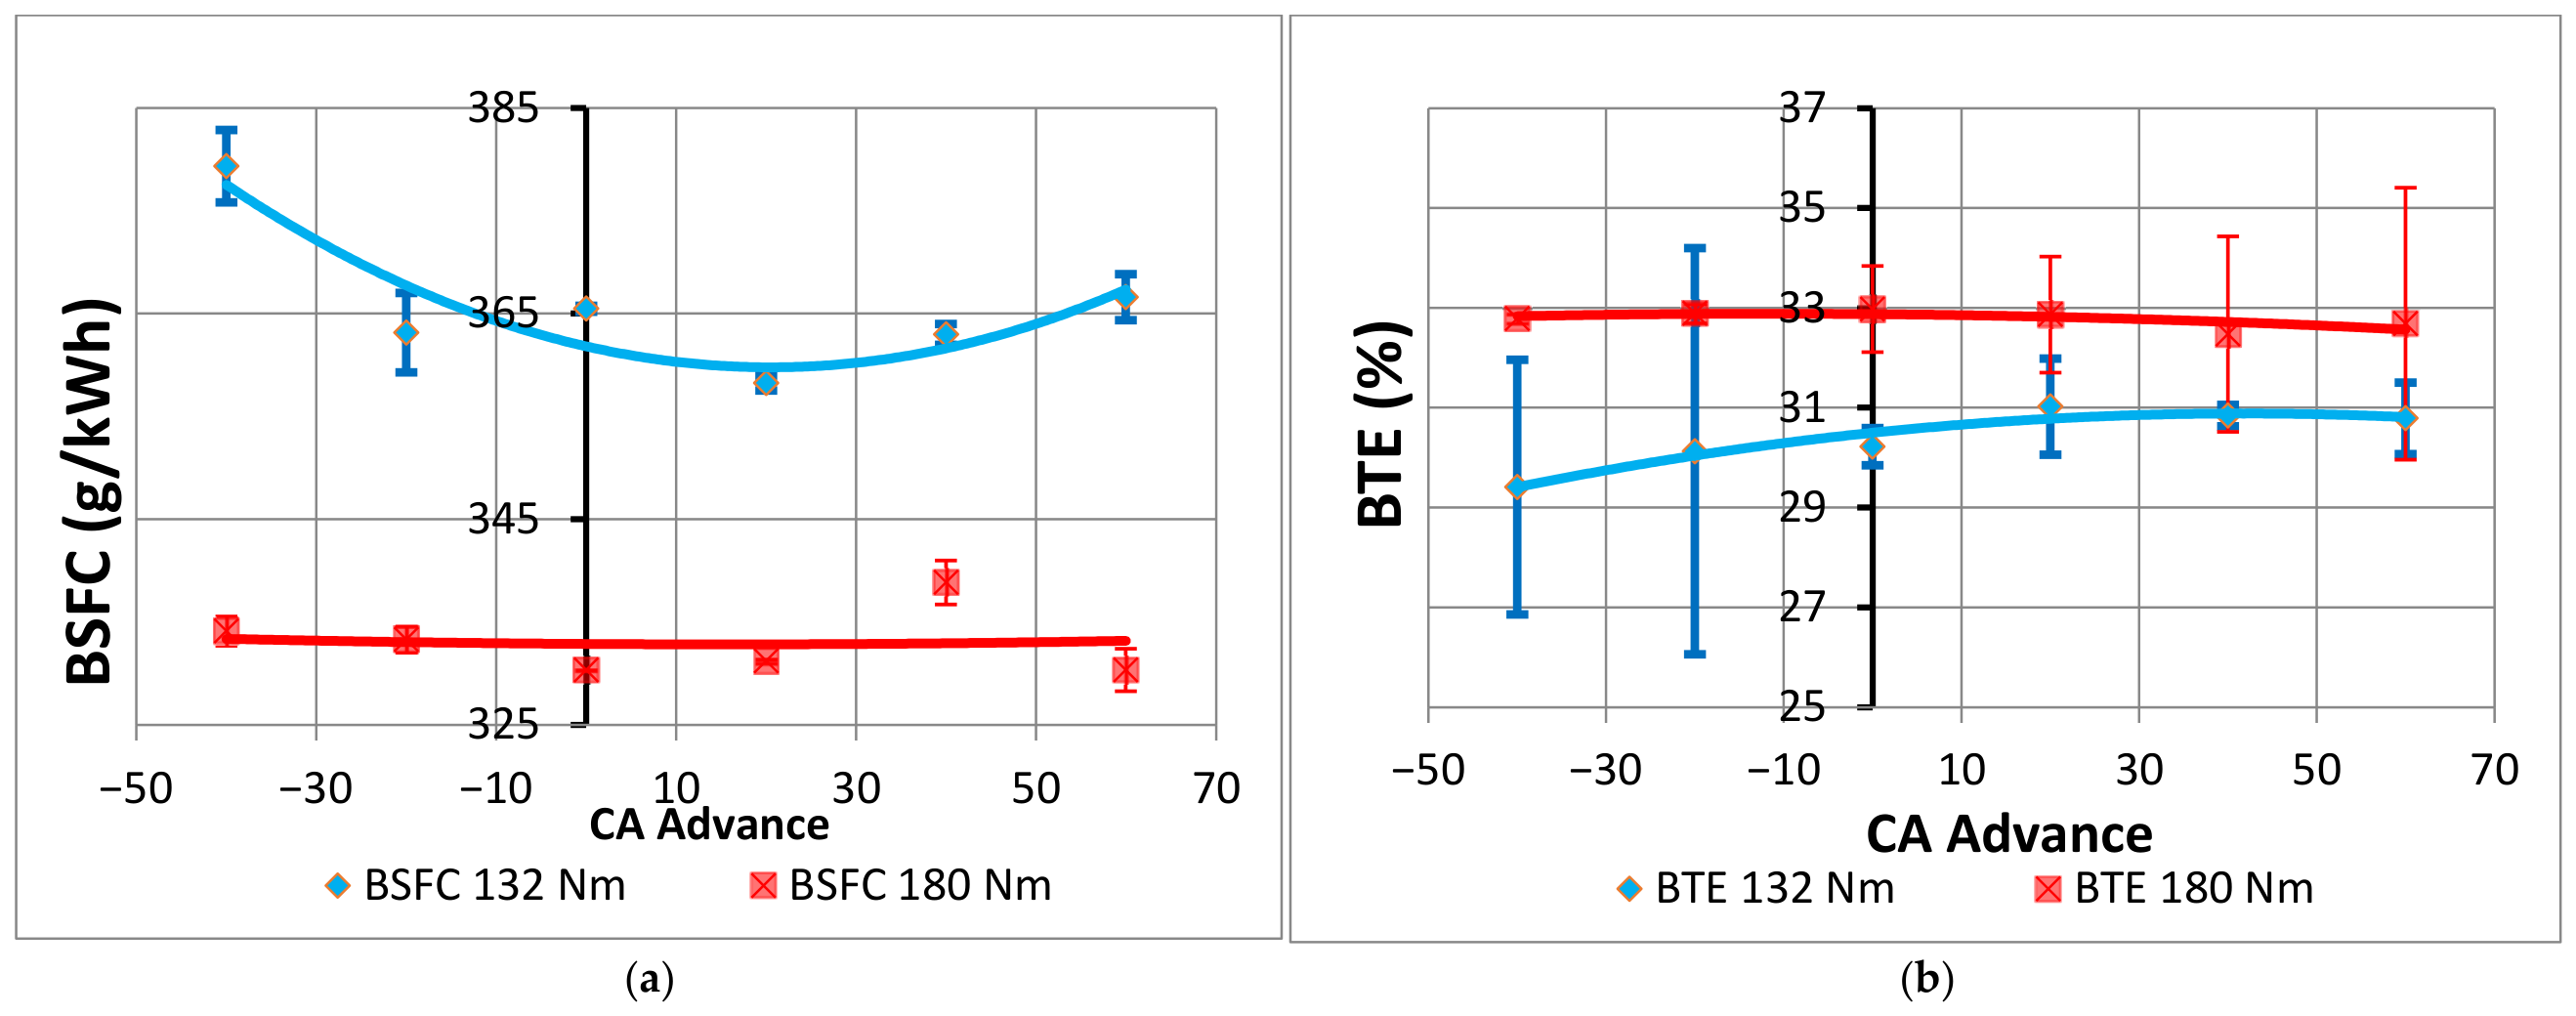
Figure 5 illustrates the variation in brake-specific fuel consumption (a) and brake thermal efficiency (b) as a function of ammonia injection timing.
At 132 Nm, the BSFC exhibits a sharp increase between 44.3% and 52.8%, remaining above 45% across the entire domain of ammonia injection timing. This increase corresponds to a clear efficiency drop compared to diesel, with the BTE ranging from 29.4% to 31.0% (compared to a baseline of 33.9%). The lower load environment requires a higher fuel mass flow to compensate for ammonia’s lower calorific value and less efficient combustion at these settings.
At 180 Nm, efficiency is more resilient with the BTE range rising to 32.5–33.2%, moving significantly closer to the 35.5% diesel baseline. The BSFC penalty also lessens, showing a smaller increase relative to the pure diesel baseline. This confirms that increased engine load supports more complete combustion and better thermal utilization of the ammonia–diesel mixture.
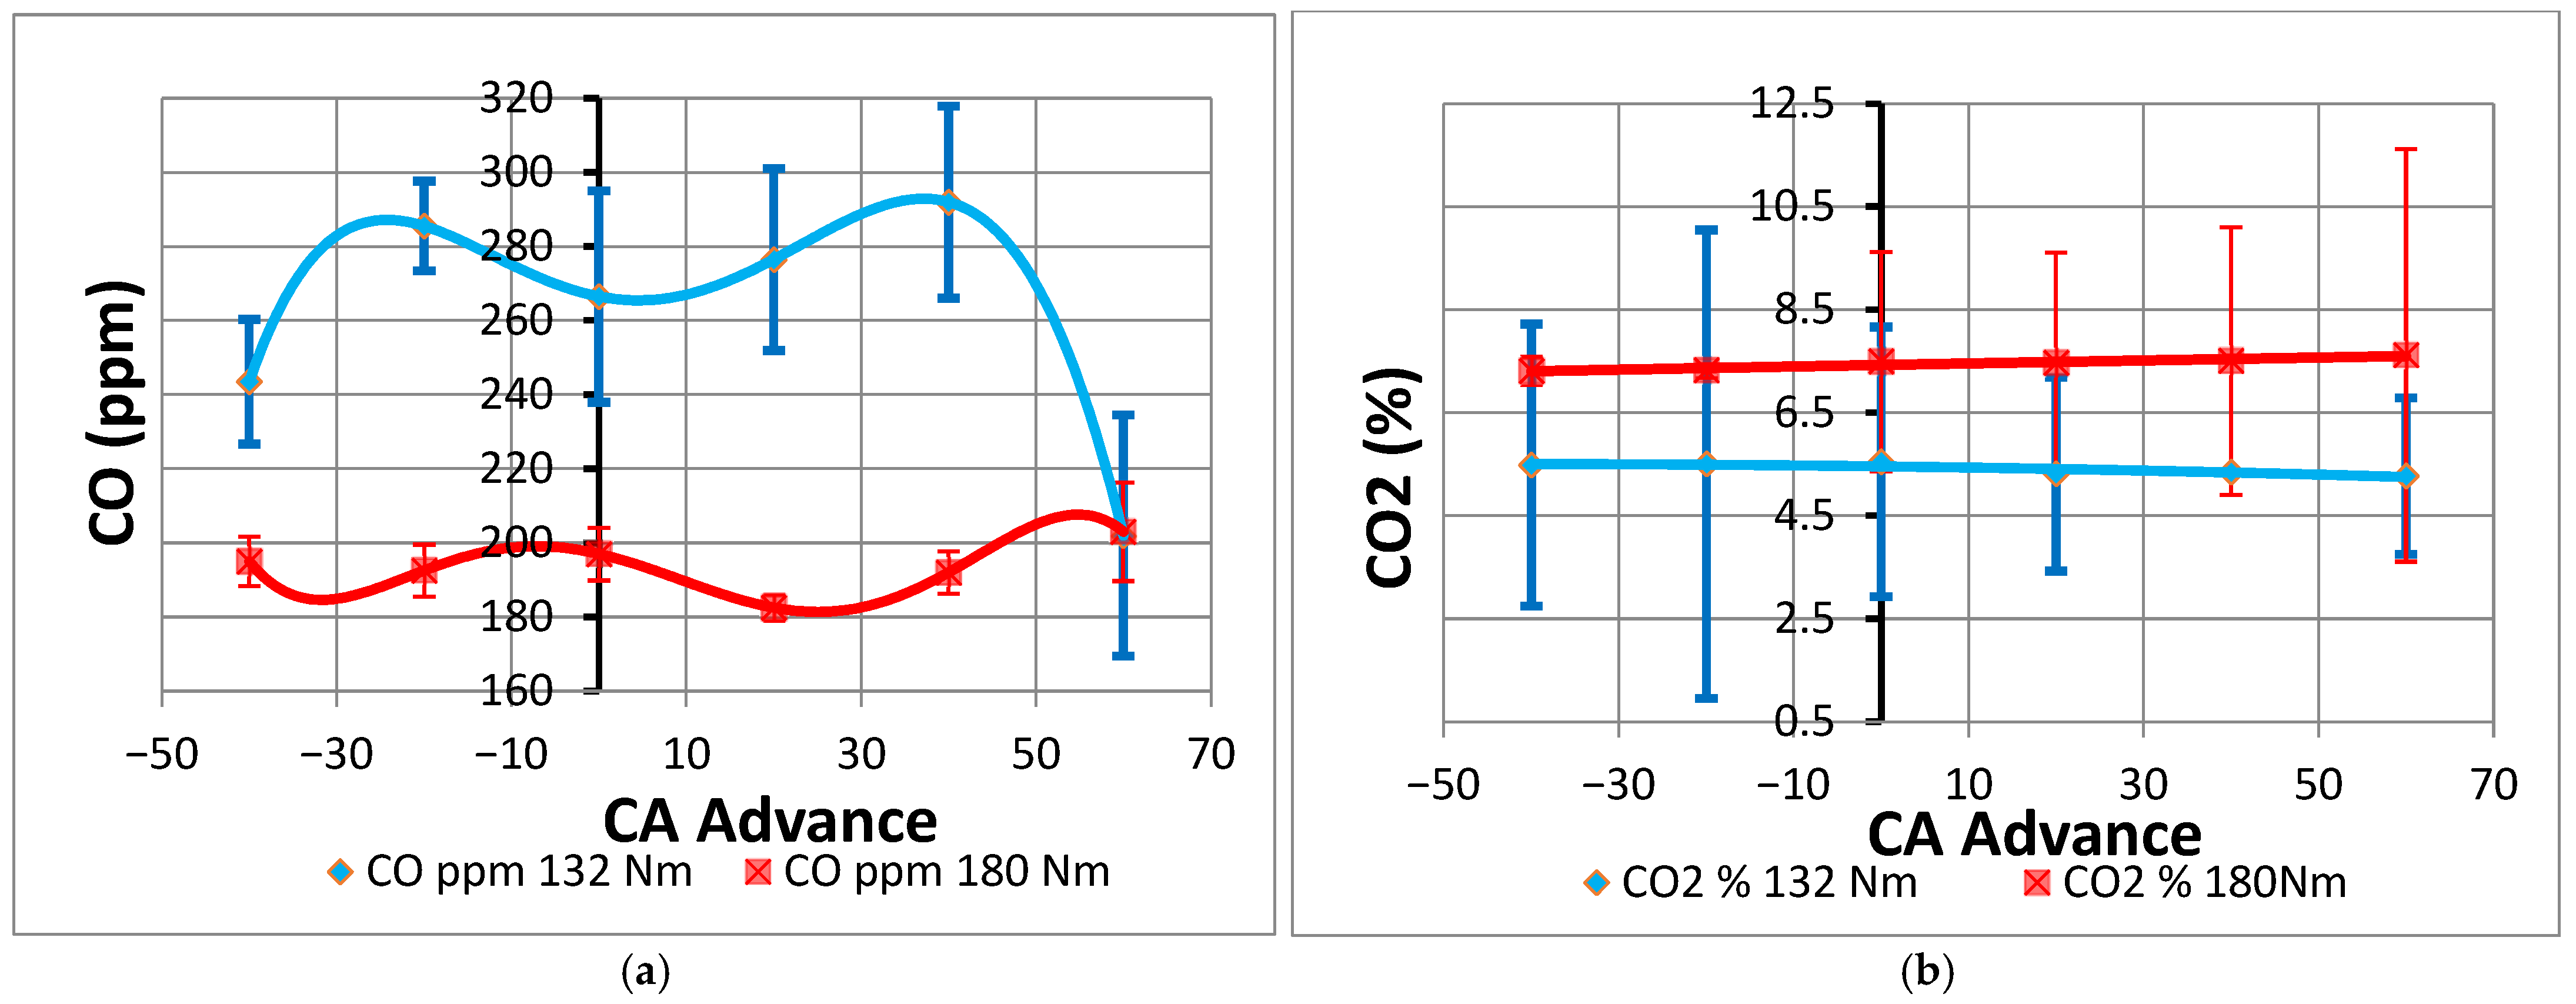
Figure 6 illustrates the concentrations of CO (a), CO
2 (b) and
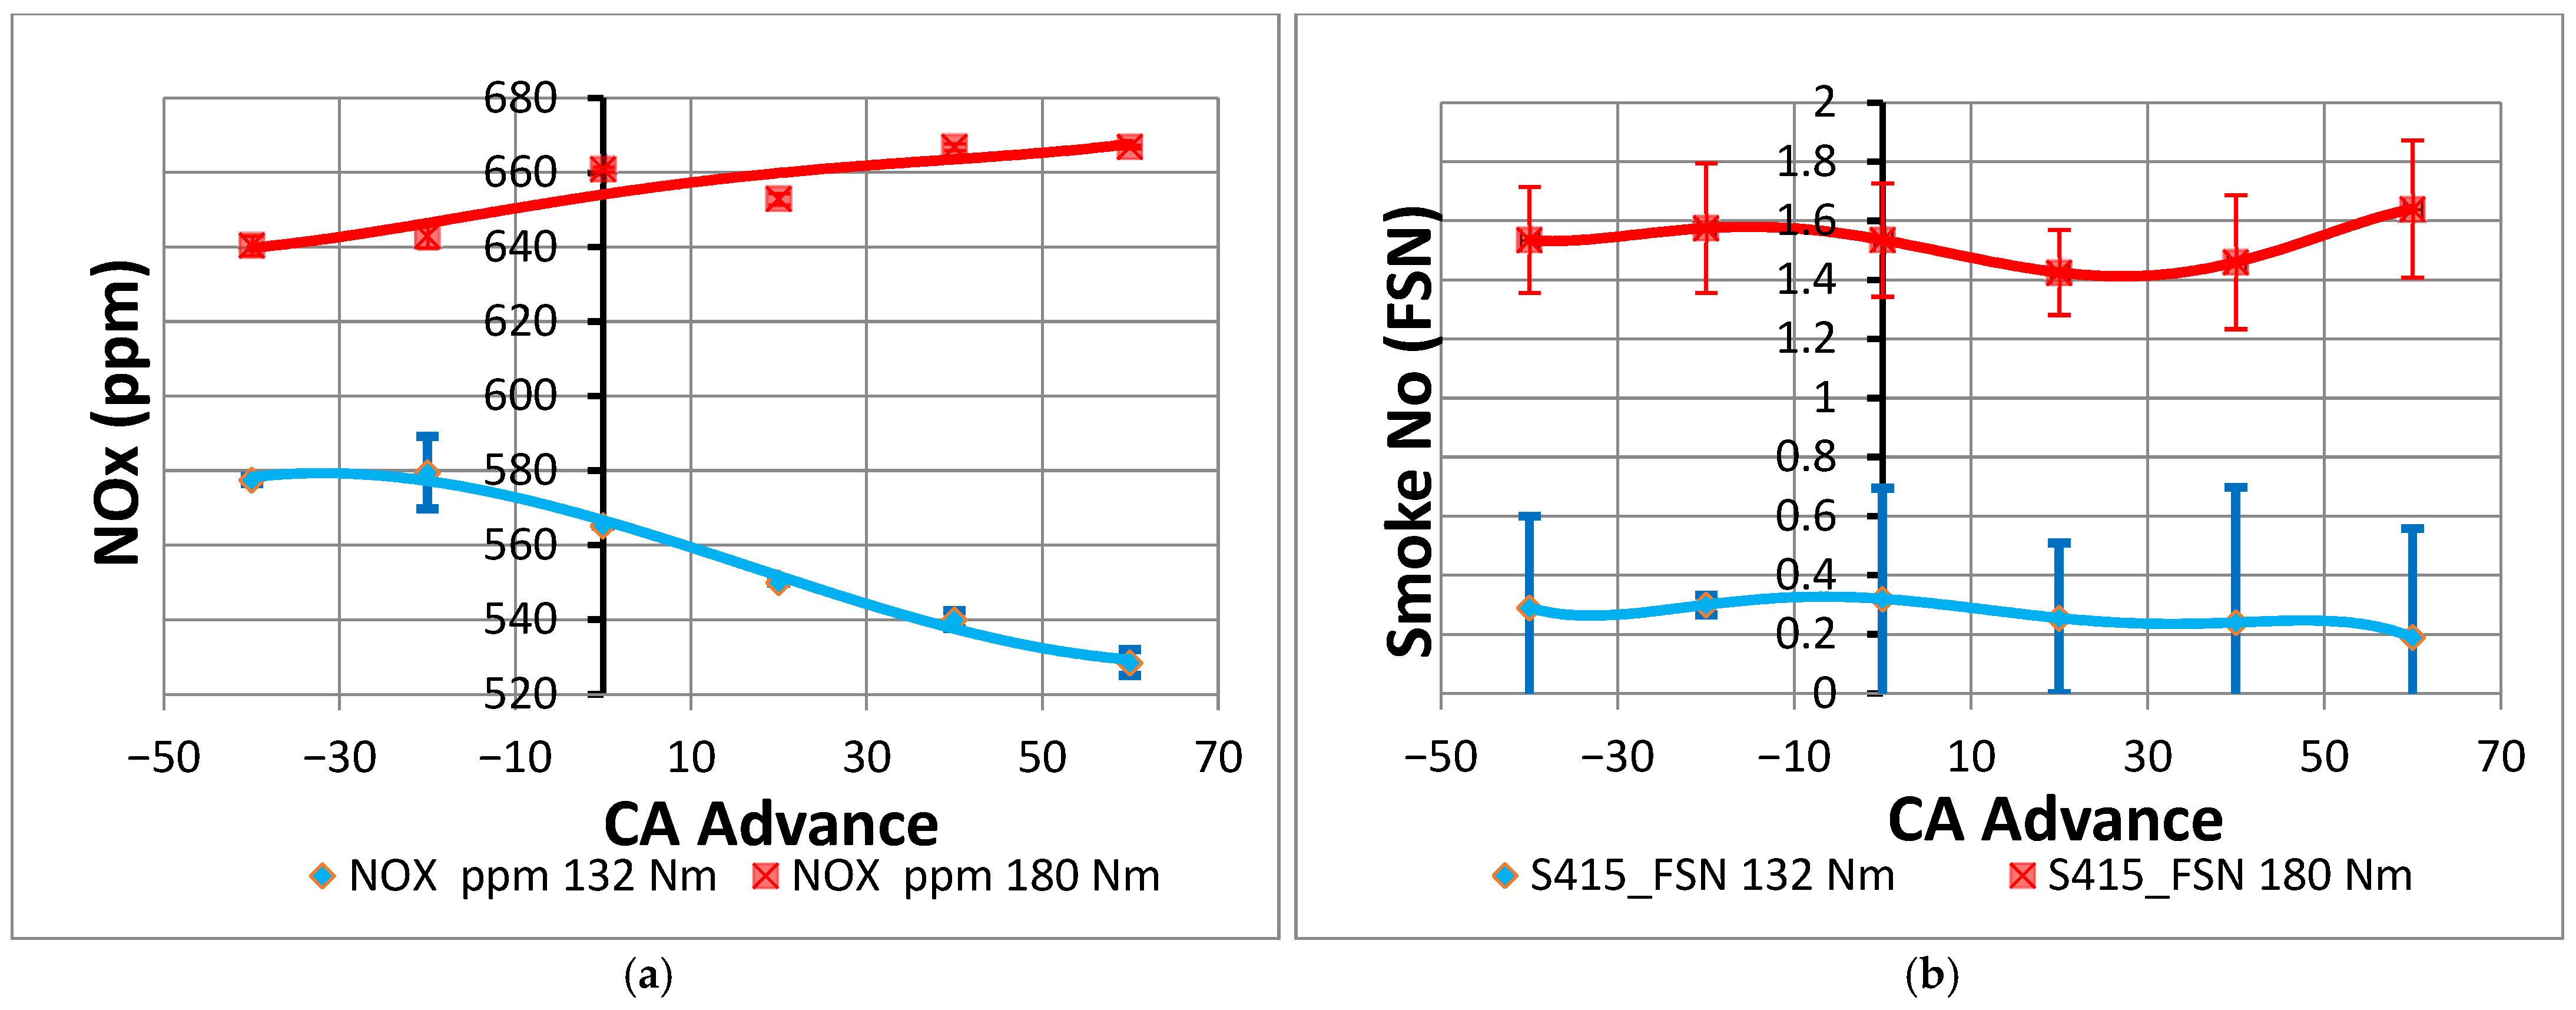
Figure 7, NO
x (a) and smoke emissions (b) variation as a function of ammonia injection timing relative to the TDC. While maintaining a constant ammonia dosage and engine power output, the injection timing was swept from 60 to −40 deg CA (where positive values denote timing before the gas exchange at TDC). Notably, the introduction of ammonia into the cylinder charge resulted in particular emission trends across both tested engine loads, suggesting a nonuniform response to injection timing variations regardless of the specific load point.
At 132 Nm load, the optimum point for reducing carbon emissions is at 60 deg CA injection advance (before TDC). At this setting, the CO2 concentration is 5.27%, which represents the highest percentage difference (reduction) of 15.75% compared to the pure diesel baseline. This significant drop in carbon output is achieved at a BTE percentage difference of 9.14% (a relative decrease from 33.9% to 30.8%).
At 180 Nm load, the optimum point for reducing carbon emissions occurs at −40 deg CA injection advance (after TDC). At this point, the CO2 concentration is 7.31%, which represents the highest percentage difference (reduction) of 15.64% compared to pure diesel. This significant reduction in carbon output is achieved at a BTE percentage difference of 7.61% (decreasing from 35.5% to 32.8%). As indicated by the error bars, the maximum percentage variations are limited to 13% for CO and 4% for CO2.
At 132 Nm load, the optimum point for minimizing the NOx increase typically associated with ammonia combustion is also found at 60 deg CA injection advance (before TDC). Here, the NOx level is 529 ppm, which is the lowest percentage difference (increase) of 9.30% compared to pure diesel. Compared to other advanced timings (which saw increases up to 19.8%), this point offers the best trade-off, operating at a relative BTE percentage difference of 9.14%.
At 180 Nm load, the optimum point for NOx control is found at −40 deg CA injection advance (after TDC). At this setting, the NOx level is 640.5 ppm, representing the lowest percentage difference (reduction) of 1.16% compared to the pure diesel baseline. This near-parity with diesel emissions is achieved while maintaining a BTE percentage difference of 7.32%.
At 132 Nm load, the optimum point for smoke number reduction occurs at 60 deg CA injection advance (before TDC), where the smoke number drops to 0.19. This represents the highest percentage difference (reduction) of 73.43% compared to pure diesel fuel. This drastic improvement in exhaust clarity is maintained with a BTE percentage difference of 9.14%.
At 180 Nm load, the optimum point for minimizing soot and smoke occurs at 20 deg CA injection advance (before TDC). Here, the smoke number is 1.425, which is the highest percentage difference (reduction) of 26.92% compared to pure diesel fuel. This improvement in exhaust quality is realized at a BTE percentage difference of 7.32%. As indicated by the error bars, the maximum percentage variations are limited to 3.1% for NOx and 23% for the smoke number.
These findings demonstrate a significant smoke reduction of up to 73.43% and CO
2 drops of approximately 15.7%, strongly aligning with earlier work [
23], providing evidence that ammonia effectively mitigates soot and carbon-based emissions. While the data presented in this study highlights how critical injection timing is for managing NO
x levels, it corroborates the conclusion of the earlier work that ammonia dual-fuel systems can achieve substantial pollutant reductions even at mass fractions up to 30%. In terms of performance, the observed BTE reductions of 7.32% to 9.14% in the present study are comparable to the reported 4.7% efficiency decrease at low loads of the earlier work, although it has been noted that efficiency can actually improve by 1.7% under heavy load conditions. Both studies reflect a shared trend where effective power and torque decrease due to ammonia’s lower calorific value and slower flame speed, with the earlier work recording power losses between 12.7% and 47.1% depending on the engine load.