Article

Enhancing Crash Severity Prediction Using Explainable Ensemble Machine Learning and Deep Learning Approaches: A Case Study of Qassim

Department of Civil Engineering, College of Engineering, Qassim University, Buraidah 51452, Saudi Arabia
*
Authors to whom correspondence should be addressed.
Vehicles 2026, 8(7), 151; https://doi.org/10.3390/vehicles8070151
Submission received: 17 May 2026 / Revised: 30 June 2026 / Accepted: 30 June 2026 / Published: 3 July 2026
(This article belongs to the Section Safety and Security in Vehicles)

Abstract

Traffic crash severity modeling is an important and promising aspect of road safety research. It aims to assess how key human-, vehicle-, roadway-, and environment-related factors interact to shape severity outcomes of crashes. Existing studies in this regard have predominantly relied on traditional statistical methods and simple machine learning approaches. While statistical analysis techniques are often based on unrealistic underlying assumptions, conventional machine learning models often suffer from interpretability issues. This study proposes an interpretable crash severity prediction framework that combines machine learning and deep learning models with post hoc explainability using SHAP. The research utilizes crash data from a rapidly developing region of Qassim in the Kingdom of Saudi Arabia. Crash severity was classified into three groups: fatal, injury, and property damage only (PDO). Four predictive models were developed and evaluated. These include: Random Forest (RF), Support Vector Machine (SVM), Feedforward Neural Network (FFNN), and Gradient-Boosting Machine (GBM). Various performance metrics, including accuracy, balanced accuracy, macro F1-score, and ROC–AUC, were used to assess the model. Descriptive statistical analysis showed that speeding, head-on collisions, wrong-way driving, blown-out tires, and driver fatigue are the major causes of fatal injuries. Empirical results revealed that the proposed prediction models achieved an accuracy ranging between 0.94 and 0.96 for the test data, with the RF model slightly outperforming the other models. Model interpretability analysis indicated that crash severity is significantly influenced by parameters such as crash cause, type, speed, and roadway type. The proposed framework demonstrated the effectiveness of machine learning (ML) and deep learning (DL) approaches for crash severity prediction and provides practical insights to support roadway safety interventions and policy development aimed at reducing severe and fatal crashes.

1. Introduction

Traffic crashes cause millions of injuries and fatalities annually around the world, thereby imposing enormous social and economic costs [1]. With the ongoing development and urbanization, vehicle ownership is increasing rapidly, as is the complexity of the transportation system. According to the World Health Organization (WHO 2023), approximately 1.19 million people die each year as a result of road traffic crashes, and between 20 and 50 million more people suffer non-fatal injuries, with many incurring a disability [2]. In addition, road traffic crashes cost most countries 3% of their gross domestic product (WHO 2023). Hence, understanding and managing the crash severity factors is of utmost importance for the modern world.
Traffic safety remains a critical socioeconomic concern in developing countries, including the Kingdom of Saudi Arabia (KSA). In the KSA, rapid expansion in road infrastructure has significantly altered the mobility system, intensifying the need for an effective system to reduce crash severity. Traffic crashes account for approximately 4.7% of total fatalities in the KSA, compared to below 2% in other developed countries like Australia, the UK, and the United States [3]. The annual cost of accidents in the Kingdom is estimated to be around SAR 21 billion [4]. Recent reports by the WHO stated that the KSA reduced road crash deaths by nearly 35% in five years. For instance, the year 2016 witnessed 9311 road traffic fatalities corresponding to a mortality rate of 28.8 deaths per 100,000 population. This highest number of fatalities and mortality rates alarmed the government and road safety agencies, which led to the development and implementation of different road safety practices and policies. Subsequently, the number of road traffic fatalities and the mortality rate were reduced to 6651 and 18.5 (deaths per 100,000 population) in the year 2021. However, despite sustained efforts to enhance road safety through infrastructure improvements and policy initiatives being in place, traffic accidents still result in substantial human and economic losses in the KSA. Prior research studies have reported that several factors, including speeding, aggressive driving, nonstandard road geometry, distracted and fatigued driving, and non-compliance with traffic rules, are among the key drivers of traffic crashes in the Kingdom [5,6,7,8,9,10].
Crash severity prediction constitutes an important research problem in road safety analysis. Generally, conventional statistical techniques are applied to predict and measure traffic crash severity. Nevertheless, these methods generate useful and insightful results but face certain limitations, such as complex nonlinear interactions, high dimensionality, and imbalanced crash datasets [11,12,13]. Therefore, in modern prediction and traffic safety protocols, their use is quite restricted. Recent developments in data science, particularly in the field of ML and DL, offer more flexible analytical tools with high accuracy, which overcome the challenges associated with traditional methods [14,15]. However, most of these techniques often pose issues of poor model interpretability. Model interpretability is important for practical safety improvement strategies and policy measures. The present study focuses on the need to develop a transparent and improved crash severity prediction framework for a rapidly developing context (Qassim region) in the KSA. The term “transparent prediction framework” is introduced because it combines predictive modeling with post hoc interpretability tools (SHAP), allowing not only enhanced prediction of crash injury severity but also explanation of the factors driving those predictions. The proposed framework compared the performance of the Feedforward Neural Network (FFNN) and Gradient-Boosting Machine (GBM) model with the Random Forest (RF) and Support Vector Machine (SVM). FFNN is adopted due to its suitability for high-dimensional large datasets compared to conventional ML algorithms [16,17]. The GBM technique creates a decision tree sequence, where errors in previous trees are corrected by the new tree, providing high accuracy, robustness, and strong generalization [15,18,19,20]. The contributions of this research work are threefold. The novelty of this research lies in combining predictive accuracy with interpretability through an integrated framework consisting of evaluating multiple different machine learning (ML) and deep learning models (DL) and identifying the influential predictors of crash severity outcomes via SHAP-based explainability analysis. Specifically, the main contributions of presents research are: (i) application of the proposed integrated framework to a localized crash dataset from Qassim, Saudi Arabia; (ii) comparative assessment of various conventional, ensemble and deep learning models such as RF, SVM, GBM, and FFNN for crash injury severity prediction; (iii) interpretable analysis of the most influential risk factors driving crash injury outcomes (PDO, injury and fatal); and (iv) practical insights and recommendations based on the study’s findings to support road safety policy and proactive interventions.

2. Literature Review

Previous research has shown that numerous factors can alter the likelihood and severity of crashes. It is concluded that these factors can greatly alter the associated risk of injury. Current research is increasingly shifting from traditional approaches toward advanced ML and DL techniques owing to their superior ability to model complex, nonlinear relationships in heterogeneous and imbalanced crash datasets.

2.1. Factors Influencing Crash Severity

An extensive literature review has been conducted to identify the key factors affecting traffic crash severity. The range of factors includes environmental, human, vehicle, and infrastructural territories. Driver speeding behavior is considered a detrimental factor that significantly increases the probability of fatal crashes [21,22]. Studies have also shown that drivers not wearing seat belts or engaging in dangerous crossing can result in severe crash accidents [23,24]. Natural and environmental factors, including adverse weather and lighting, can minimize vehicle visibility and traction, thus also contributing to crash severity [24,25]. Roadway characteristics, including speed limits, lane width and classification, play an important role in influencing crash risk. For instance, rural roads with high speed limits are associated with run-off-road accidents [26]. The type of collision greatly influences the crash severity, as certain collision types are linked with severe outcomes [27]. The type of vehicle is also an important factor in crash severity, as crashes involving motorcycles and heavy trucks result in more severe injuries [28]. Other factors like the gender and age of the driver also affect crash outcome. For example, younger and older people are more prone to severe crashes [28,29]. In addition, congested traffic environments can lead to more crashes, but their severity is lower due to lower vehicle speeds [30]. Recent innovations in ML and DL techniques enable researchers to analyze these factors, which, in turn, can improve the prediction of crash severity [31,32,33].

2.2. Existing Analytical Approaches

The conventional statistical models, such as logistic regression and Bayesian models, were previously applied for the prediction of crash severity due to their interpretability and simplicity. For instance, in prior research [34], the authors used logistic regression with loop detector data for freeway crash severity, while in another study [35], the authors analyzed traffic crash conditions by applying the Random Multinomial Logit (RML) model. Despite their widespread application, these statistical approaches lack linearity and face complications in complex and imbalanced data.
To cope with these limitations, ML techniques come into play, which provide more flexibility and can capture nonlinear and complex crash data. Common ML approaches include decision trees, Support Vector Machines (SVMs), Random Forests, and nearest-neighbor algorithms. For example, in another study [36], the authors reveal better prediction accuracy with SVM as compared to other statistical methods while analyzing expressway ramp traffic. In another study [37], the authors compared decision trees with neural networks for real-time incident detection and concluded that the decision tree performed better than the traditional method. Hybrid modeling frameworks have also been investigated, for example, integrating logistic regression with wavelet-based feature extraction for traffic crash severity [38]. Hybrid methods demonstrated superior capability within crash datasets and issues related to class imbalance and variable complexity. Nevertheless, ML models still face challenges, particularly regarding interpretability, across different geographic regions and traffic environments. Recently, a few studies have focused on the application of text and boosting methods for crash severity modeling. For instance, Shao et al. [39] combined Natural Language Processing (NLP), the frequent pattern (FP) growth algorithm and Extreme Gradient Boosting (XGBoost) to predict injury severity and investigate behavior cause relationships in automotive crashes. The study analyzed textual crash narratives to identify links between driver behaviors and crash causes, while SHAP was used to improve model interpretability. The approach achieved an accuracy of 0.79, outperforming traditional discrete choice models and performing competitively with several machine learning methods, including Support Vector Machine (SVM), Random Forest (RF), CatBoost, and LightGBM. In another study, Zhang et al. investigated the factors influencing accident severity using ensemble learning techniques, including XGBoost, LightGBM, and CatBoost [40]. To address class imbalance, the study used SMOTE-based sampling methods and TreeSHAP to interpret the relationship between accident severity and contributing factors. The results indicated that LightGBM achieved the most stable overall performance and higher computational efficiency, highlighting the potential of boosting-based ensemble learning methods for crash severity analysis.
In recent years, DL models have been extensively utilized for the prediction of traffic crashes due to their ability to model nonlinear, complex relationships and extract patterns from large crash datasets. These models have demonstrated notable improvements over traditional statistical and shallow ML methods, especially in prediction accuracy and the ability to process heterogeneous data sources. In [41], the authors introduced a spatiotemporal DL model that integrated multi-source traffic data to forecast short-term crash risk at the city level, showing that DL models effectively capture spatial and temporal dependencies. Similarly, in another study [42], the authors applied Convolutional Neural Networks (CNNs) to predict traffic accidents by identifying crash-prone traffic patterns, achieving higher accuracy than traditional neural network models through CNNs’ ability to capture complex relationships within traffic condition data.
Several studies have recently focused on enhancing prediction performance through customized DL architectures. In [25], the authors developed a deep learning model integrated with a multivariate regression layer using roadway and pavement data from Tennessee, reporting an improvement in prediction accuracy exceeding 84% compared to baseline models. In another study [27], the authors proposed a DL-based crash severity prediction framework using work zone crash data and demonstrated improved performance in predicting fatal and injury outcomes. In [30], the authors used social media data with a Bi-LSTM model integrated with FastText and presented high accuracy in detecting traffic crashes in real-time traffic monitoring applications. Similarly, in another recent study [31], the researchers demonstrated the deep learning models’ effectiveness over other approaches in highway crash detection by utilizing sensor-based data. However, despite their strong predictive performance, there are still some issues with deep learning models, such as class imbalance, underrepresentation of severe crash scenarios, and interpretability. To mitigate these concerns, numerous strategies such as data augmentation, weighted loss functions, and synthetic oversampling have been adopted. Furthermore, interpretability techniques such as SHAP and LIME have been employed to enhance model transparency and provide insights into how input variables influence crash severity predictions. Table 1 presents a summary of the existing literature on crash severity prediction employing different statistical and machine learning methods.

3. Methodology

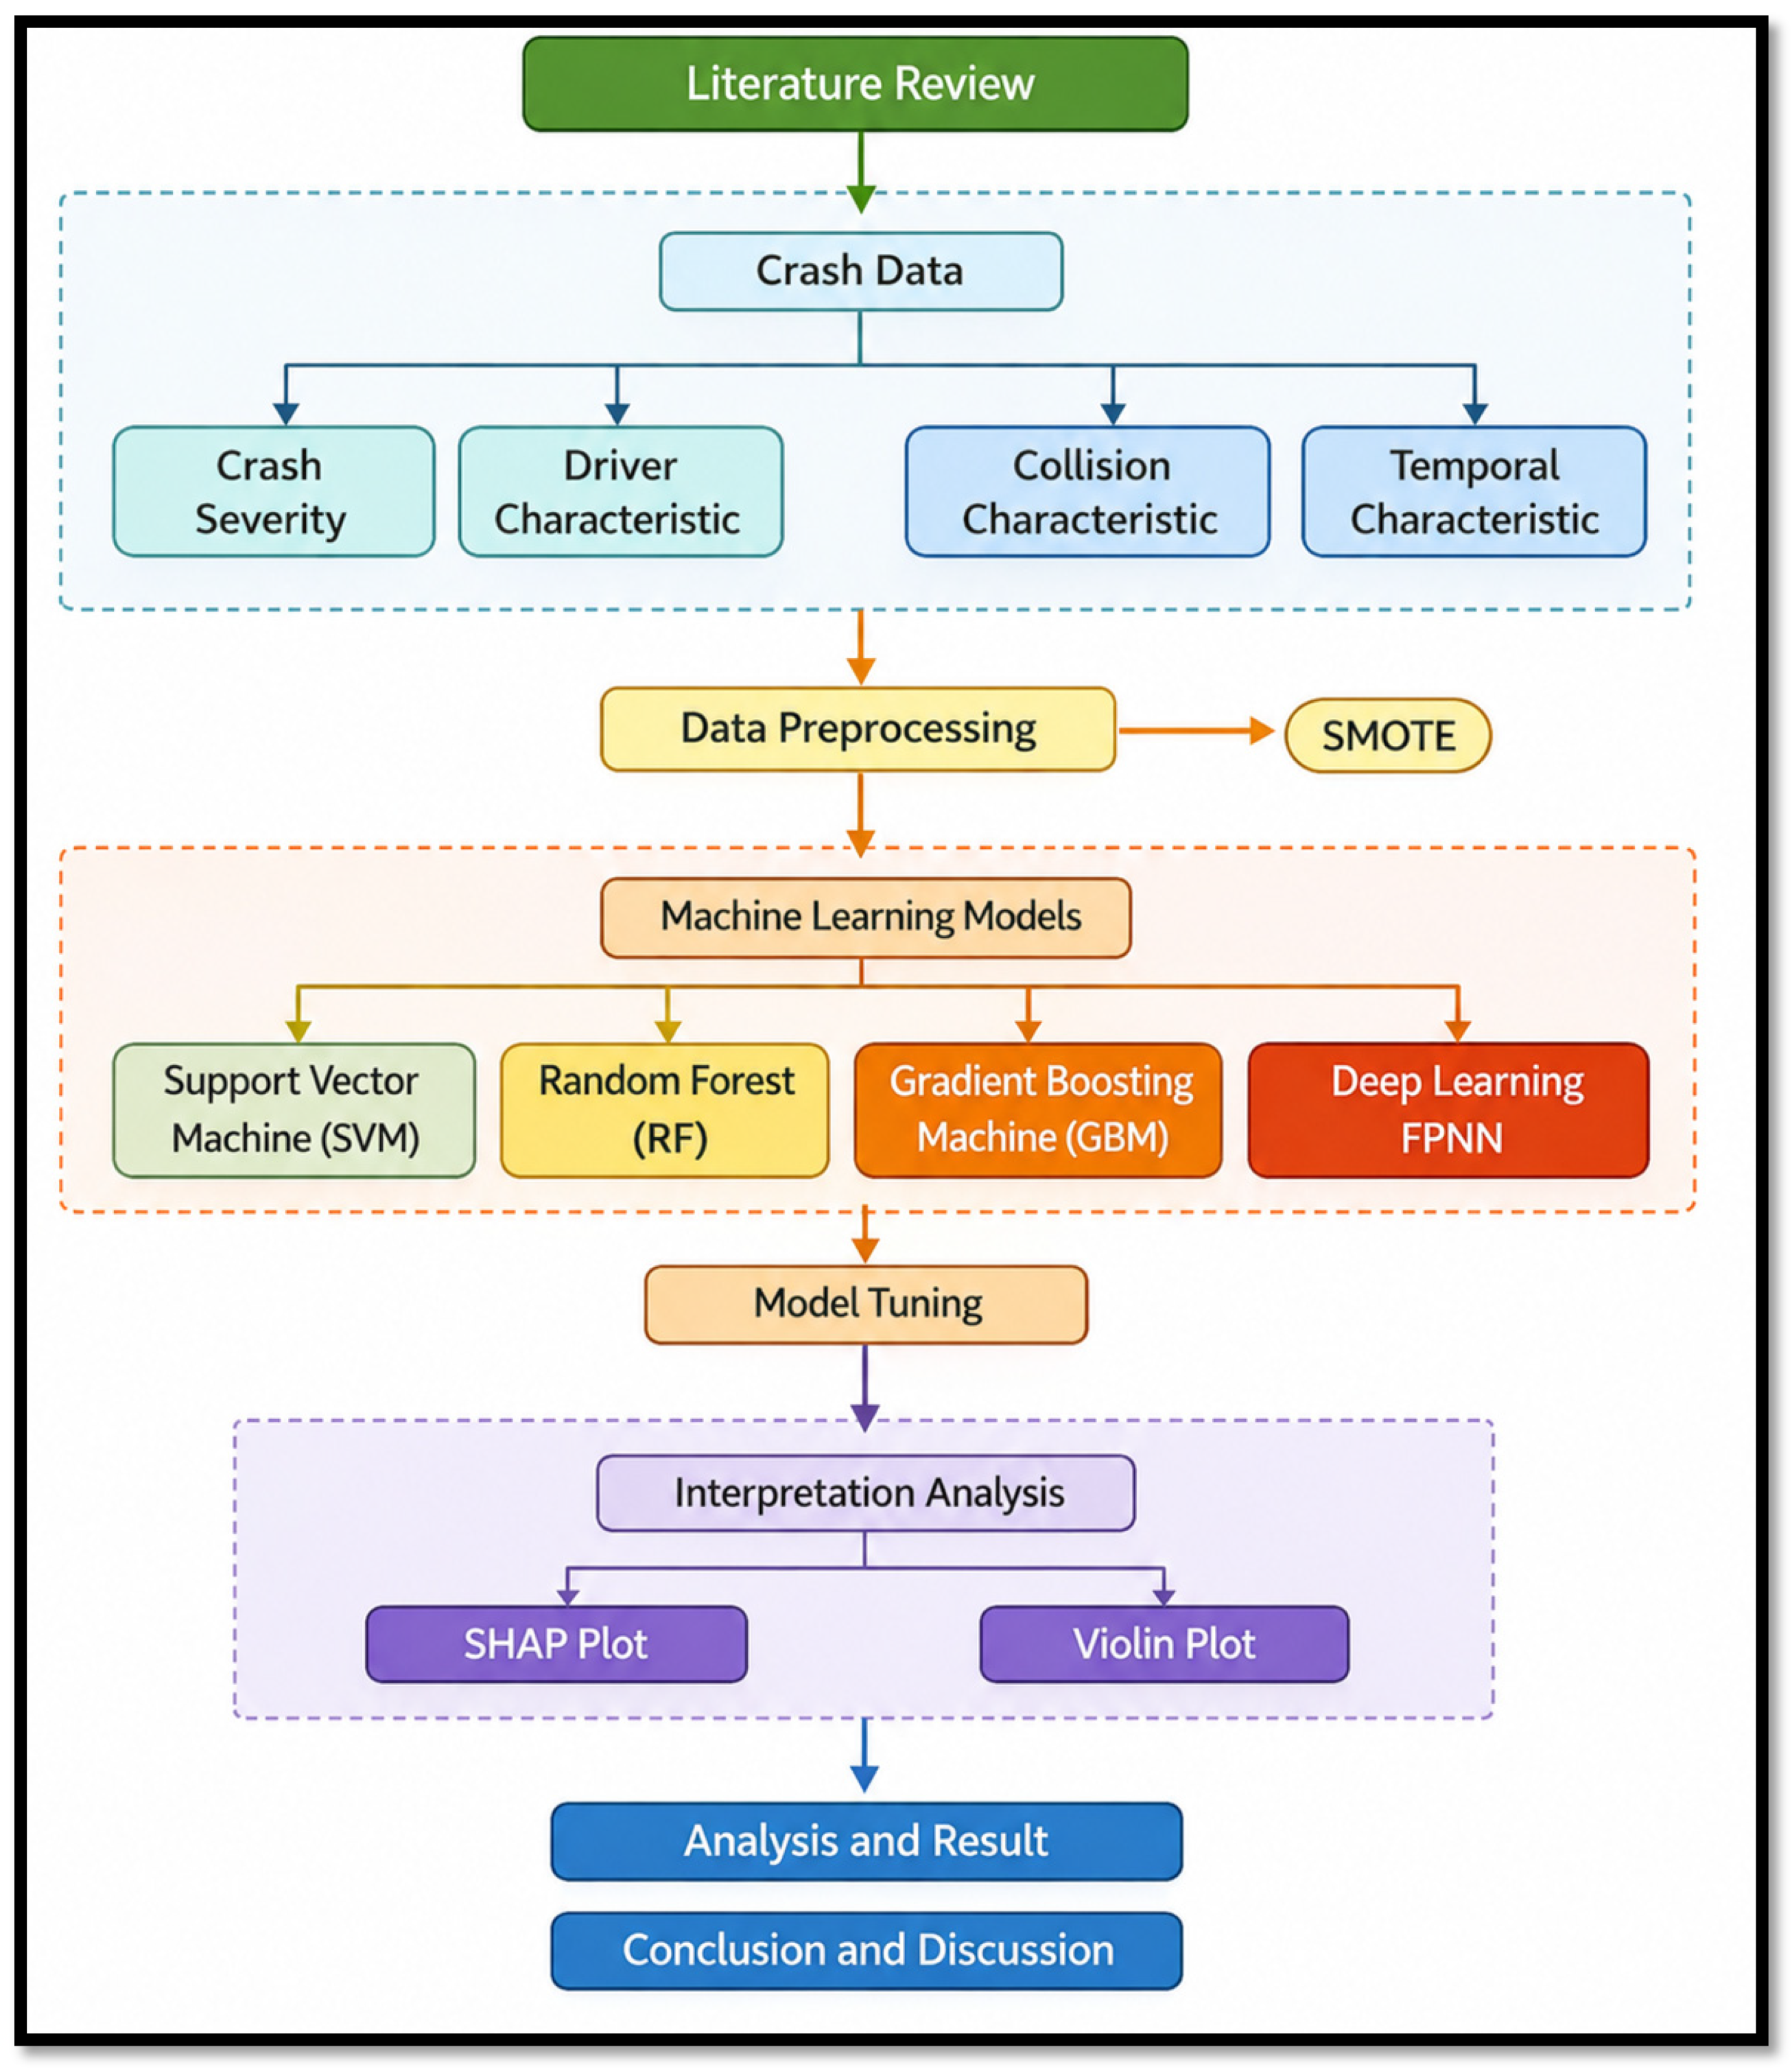
This study aims to predict the severity of traffic crashes using crash data from the Qassim region, Saudi Arabia, by employing a combination of advanced machine learning (ML) and deep learning (DL) models. The methodological framework consists of several stages: data collection and preprocessing, model development, evaluation, and interpretation, which is shown in Figure 1.

3.1. Data Description

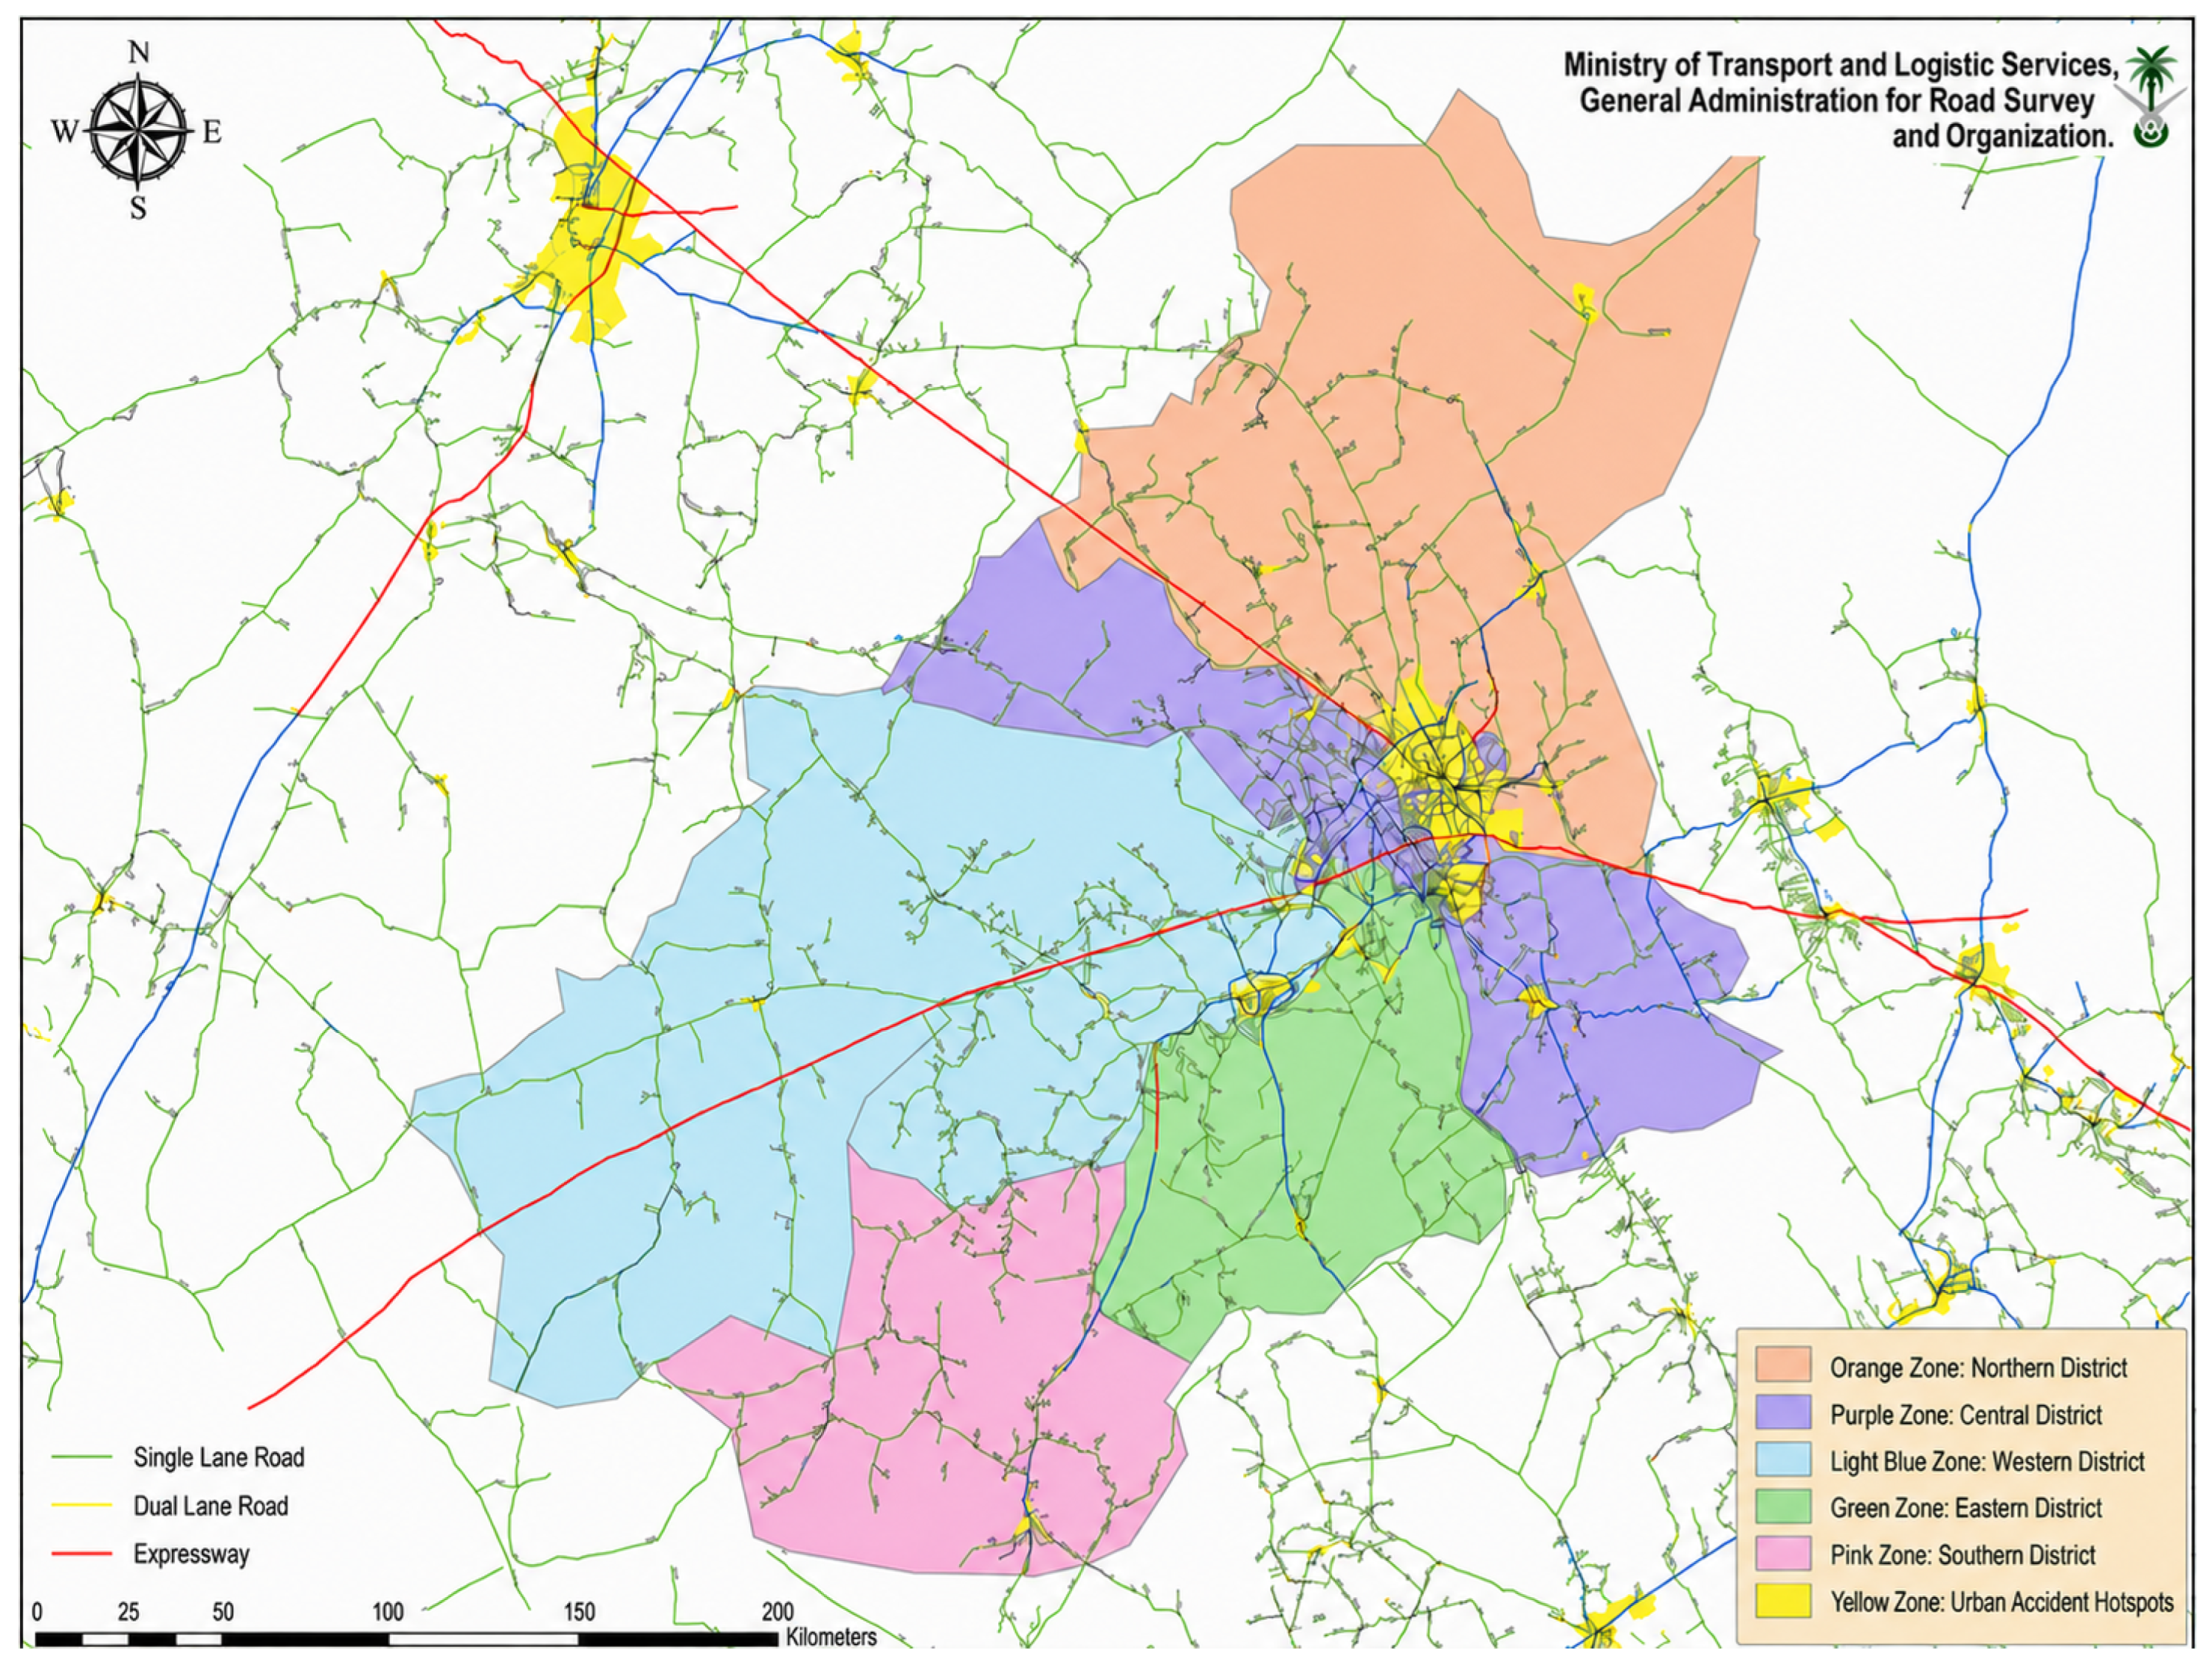
The available recent three years of crash data (2023–2025) used for this research was obtained from the Ministry of Transport (MOT) for the Qassim region of the Kingdom of Saudi Arabia. The dataset consists of 2453 recorded traffic crashes and associated information for crash-severity analysis, including date, time, and location, as well as road type, weather conditions, accident type, and contributing factors. The study area is shown in Figure 2. Table 2 reveals the crash severity level distribution, types of accident, and contributing factors by presenting their frequencies and percentages across the full dataset as well as within each severity class. This descriptive overview indicates class imbalance and highlights the most common crash patterns. These parameters are important considerations for model development and interpretation. Overall, the dataset provides a strong empirical basis for analyzing the determinants of crash severity in the Qassim region. Moreover, it also supports the development of predictive models focused on improving traffic safety and duly communicating regional transportation planning and policy-making.
Table 2 shows the key descriptive statistics of the target variable (crash severity outcomes) and various explanatory/predictor variables. The original dataset contained accident severity classified into five different categories, i.e., fatal injury, severe injury, minor injury, no injury, and property damage only (PDO). For model development, these severity classification labels were aggregated into the three main classes (PDO, injury, and fatal) to improve the predictive performance across various classes. Fatal injury was retained as fatal class, PDO remained as PDO, while severe and minor injury were grouped into a single injury class. A large number of PDO or minor-injury cases makes classifiers favor the majority class and weakens prediction of severe outcomes. The recent crash injury severity literature has also reported that fatal and severe crashes are minority classes and are often overwhelmed by the large number of PDO or minor-injury cases, which makes classifier predictions biased toward the majority class and weakens model performance in fatal and severe injury outcomes, and therefore recommends aggregation of multiple classes into two or three categories [17,45,46].
The descriptive statistics data for crashes showed that rear-end collisions are concluded to be the most common type of accident, accounting for 31% of all crashes. Collisions with fixed objects (21%) and vehicle rollovers (19%) also account for a considerable proportion of crashes. These types are particularly important because they are often associated with higher crash severity due to greater impact forces and loss of vehicle control. Sideswipe crashes account for 12% of all cases and are likely related to unsafe lane-changing behavior and insufficient spacing between vehicles. Although run-off-road accidents, collisions with objects, vehicle fires, animal-related crashes, head-on collisions, pedestrian collisions, and intersection collisions represent a smaller proportion of crashes, they should not be overlooked because they are generally associated with severe injuries and fatalities. Further, drivers’ inattention and distraction are the leading causes, accounting for 48% of all crashes. This indicates that a large proportion of accidents are associated with reduced driver awareness, mobile phone use, and delayed reaction times. Tire blowout (11%) and driver fatigue (9%) are the next most common causes, followed by speeding (6%) and electric or mechanical vehicle issues (5%). These causes highlight the critical requirement of driver behavior and the importance of vehicle conditions for road safety. Besides these major sources, other causes include sudden divergence, crashes involving an animal, manure spills, and road blocks. These causes also contribute to traffic crash severity in a smaller proportion. In addition, most accidents occurred on main highways (57.9%) at 140 kmh (57.5%) and clear weather conditions (97.7%). Similarly, at-fault private motor vehicles comprised a significant proportion (81%) of all recorded accidents.

3.2. Model Development

This section presents the machine learning and deep learning classification algorithms and discusses their application for crash severity prediction. These supervised learning techniques can manage high-dimensional datasets and are flexible, adaptable, and possess strong predictive performance. In this research work, the dependent variable is crash severity, which is in turn classified into three categories: injury, fatal, and PDO. Three ML algorithms, including SVM, RF, and GBM, in collaboration with one DL model, Feedforward Neural Network (FFNN), are implemented in this research. Python (version 3.14.4) analytical platforms are used to implement these models. Prior to model development, the original dataset was partitioned using a stratified train–test split, with 80% used for training and the remaining 20% used for validation/testing. This approach ensures preserving the class distribution across both subsets and is particularly essential and important when the outcome classes are imbalanced. The SMOTE technique was applied only after the train–test split and only to the training data subset, ensuring that the test set remains independent and avoiding the issue of data leakage. Further, prior to model implementation, hyperparameter tuning for each model was performed separately for each model using only the training data. Hyperparameter tuning was validated using 5-fold cross-validation on the training subset only. Candidate hyperparameter combinations were evaluated based on the average validation performance across the 5 folds. Subsequently, optimal settings were used to train the final models. The independent test set was exclusively reserved for final model evaluation to avoid data leakage. The grid search method was employed to test the candidate parameter values for various models, and finally, the optimal combination was selected for assessing the validation performance. It is important to mention that during this procedure, the test set was kept completely independent and was utilized for final evaluation of the models. This procedure was employed to ensure a fair and balanced comparison across all the selected models to avoid the problem of data leakage. Table 3 presents the hyperparameter search space and the optimized values selected for each model after tuning. Feature importance and sensitivity analysis were also performed to analyze the individual performance of crash severity factors. The detailed methodology is further discussed in the subsequent sections.

3.2.1. Support Vector Machine (SVM)

SVM is a supervised machine learning algorithm extensively utilized for classification problems, especially for complex and nonlinear datasets [47,48]. In current research, crash severity prediction depends on many nonlinear variables, such as vehicle speed, vehicle type, weather, and roadway geometry, which are too complex for simple statistical methods. Hence, to identify the optimal decision boundary between different crash types, SVM is the most suitable approach [49]. SVM determines a hyperplane that separates different classes by maximizing the margin between the nearest data points, which are also known as support vectors. Generally, overfitting is reduced, and classification performance on unseen observations is improved by using a larger-margin model. SVM employs radial basis function (RBF), sigmoid, or polynomial kernels to transform data into a high-dimensional feature space when crash severity data cannot be separated linearly [50,51]. SVM is selected for several reasons in this research work. Firstly, it works extremely well in high-dimensional datasets with many explanatory variables. Secondly, it can handle nonlinear relationships between severity outcomes and crash-related factors. Finally, SVM performs well when the datasets are imbalanced or relatively small, as in crash severity studies, fatal or severe crashes occur less frequently than minor accidents. Moreover, SVM focuses only on the support vectors rather than all observations, so it is less prone to overfitting [50,51]. SVM can be expressed mathematically as shown in Equation (1).
m i n   ( 1 2   w 2 + C i = 1 n ξ i ) ,   s u b j e c t   t o   y i   ( w T x i + b )   1 ξ i ,   ξ i 0
where w represents the weight vector of the hyperplane, b is the bias term, C represents the penalty parameter showing a trade-off between minimizing classification error and maximizing margin, and ξ i is the slack variables, representing some misclassified observations.

3.2.2. Random Forest (RF)

RF is a machine learning algorithm that generates accurate, stable predictions by combining the outputs of many decision trees [52]. The main goal of this approach is to improve model performance and minimize overfitting. The RF model works on two main principles: First, using random samples to train each tree from the original dataset. This process is known as bootstrap aggregating or bagging. Second, at each node of the tree, a random selection of subset variables is made. By doing so, the correlation among trees is minimized, thereby increasing the model’s diversity and generalization capability [52,53]. As discussed in Section 2, numerous interrelated factors are present in crash severity analysis. Henceforth, the RF model is suitable for these kinds of problems as it can model nonlinear and complex relationships among variables. In addition, it can efficiently handle high-dimensional datasets containing many explanatory variables. The Random Forest model was selected in this study for several reasons. First, it has a strong ability to achieve high predictive accuracy even when the relationships among variables are highly complex. Second, it is robust to noise as compared with other models. Finally, RF can be trained to evaluate the most critical crash factors such as roadway conditions, vehicle speed, and driver seat belt usage. Nevertheless, the RF model can be used for imbalanced datasets where severe and fatal injuries occur less than non-severe or minor injuries. The prediction process in RF can be mathematically presented as Equation (2):
y   ^ =   m o d e   ( h 1 ( x ) , h 2 ( x ) , , h k ( x ) )
where the predicted class is represented by y ^ , h k ( x ) presents a prediction made by k -th decision tree, and the total number of trees in the forest is represented by K . The class receiving the most votes in all trees is selected by majority voting. Moreover, in RF, each variable’s importance is quantified by evaluating model performance after removing or permuting the variables. This characteristic enhances the model’s interpretability and supports the identification of factors contributing to crash severity.

3.2.3. Gradient Boosting Machine (GBM)

GBM is a machine learning technique that creates a decision tree sequence; this sequentiality is the unique feature of GBM, which is missing in the RF model, where each tree is built independently. This iterative process gradually improves the model’s overall predictive performance. The working principle of GBM is to reduce the loss function by adding weak learners or shallow trees in a stage-wise manner. The model computes residual errors from the previous stage and fits a new tree to them at each iteration. The final output is thus the result of all the trees’ predictions. Therefore, GBM can capture and model complex nonlinear relationships and interactions among variables through its sequential learning process [20]. Crash severity prediction depends on many nonlinear variables, such as vehicle speed, weather, traffic volume, driver age, and roadway geometry. Hence, GBM is most suitable for this study, as it can effectively classify crash severity levels ranging from fatal to no injuries [18,54]. Many advanced GBM implementations are commonly used, including XGBoost, LightGBM, and CatBoost [18,55,56]. These methods further improve the basic GBM algorithm by enhancing computational efficiency, minimizing overfitting, and providing better handling of larger datasets. In this research work, GBM is selected due to its proven efficiency in crash severity analyses. GBM can be represented as in Equation (3).
L ( ϕ ) = i l ( y i , y ^ i ) + k Ω ( f k )
where L ( ϕ ) is the overall objective function, l ( y i , y ^ i ) represents the loss between the observed value y i and the predicted value y ^ i , and Ω ( f k ) is a regularization term applied to the k -th decision tree to control model complexity and reduce overfitting. GBM was employed in this research for several reasons. First, it generally provides higher classification accuracy than many conventional machine learning algorithms, especially when dealing with structured and heterogeneous datasets. Second, it is highly effective in identifying nonlinear effects and variable interactions that influence crash severity. Third, GBM can provide measures of feature importance, allowing the most influential crash-related factors to be identified and interpreted. Finally, the algorithm is sufficiently flexible to accommodate datasets with imbalanced severity classes, making it appropriate for transportation safety studies in which fatal and severe crashes occur less frequently than minor and no-injury crashes.

3.2.4. Feedforward Neural Networks (FFNNs)

A Feedforward Neural Network (FFNN) is a type of artificial neural network in which information flows in one direction only, from the input layer through one or more hidden layers to the output layer, without any feedback connections [57,58]. Each layer performs a weighted transformation of the input data followed by a nonlinear activation function, enabling the network to learn complex patterns within the dataset [59]. FFNN was used in this study because crash severity prediction involves complicated and nonlinear relationships among variables such as driver characteristics, vehicle type, roadway geometry, and environmental conditions. The model is capable of identifying these hidden relationships and improving the classification of crash severity levels, including fatal injury, severe injury, minor injury, and no injury. FFNN is more suitable for high-dimensional large datasets compared to conventional ML algorithms [60]. The network learns by adjusting its weights during training in order to minimize prediction error. The operation of a single layer in FFNN can be expressed as in Equation (4).
a l = σ   ( W l a l 1 + b l )  
where a l is the output of layer l , W l is the weight matrix, b l is the bias vector, and the activation function is represented by σ . Some general activation functions include ReLU, softmax, and sigmoid. They help model nonlinear relationships and construct class probabilities.

3.3. Model Evaluation

In this research, the performance of ML techniques is evaluated using several classification metrics, including accuracy, precision, F1-score, AUC, and recall. These metrics are obtained from the confusion matrix consisting of true positives (TP), true negatives (TN), false positives (FP), and false negatives (FN), as shown in Table 4. The overall proportion of classified samples is measured with accuracy as shown in Equation (7). The false predictions are minimized, and positive cases are accurately identified with precision and recall (Equations (5) and (6)). For imbalanced datasets, the measure for precision and recall is provided by the F1-score, as shown in Equation (8). Finally, AUC (Equation (9)) represents area under the Receiver Operating Characteristic curve and measures a model’s overall ability to distinguish between positive and negative classes across all classification thresholds.
P r e c i s i o n = T P T P + F P
R e c a l l = T P T P + F N
A c c u r a c y = T P + T N T P + T N + F P + F N
F 1 s c o r e = 2 × P r e c i s i o n × R e c a l l P r e c i s i o n + R e c a l l
A U C = 0 1 T P R ( F P R )   d F P R  

3.4. Model Interpretation

SHapley Additive exPlanations (SHAP) is used to interpret predictions for complex models such as DNN. This approach provides useful insight into the decision-making process for crash severity levels. Each decision is decomposed, and a nonlinear relationship between the model’s input and output variables is captured. As a result, the model transparency, robustness, and assessment are significantly improved, especially for traffic safety applications. In the SHAP model, each feature and baseline prediction sum up to calculate the prediction of an instance, as shown in Equation (10).
f ( x ) = ϕ 0 + i = 1 M ϕ i
where the prediction of an instance is denoted by f ( x ) , the baseline output is ϕ 0 , the input features are M , and the SHAP value in correspondence to the feature i is ϕ i . It shows the importance of features for moving away from the baseline.

4. Results

4.1. Comparative Assessment of Model Performance

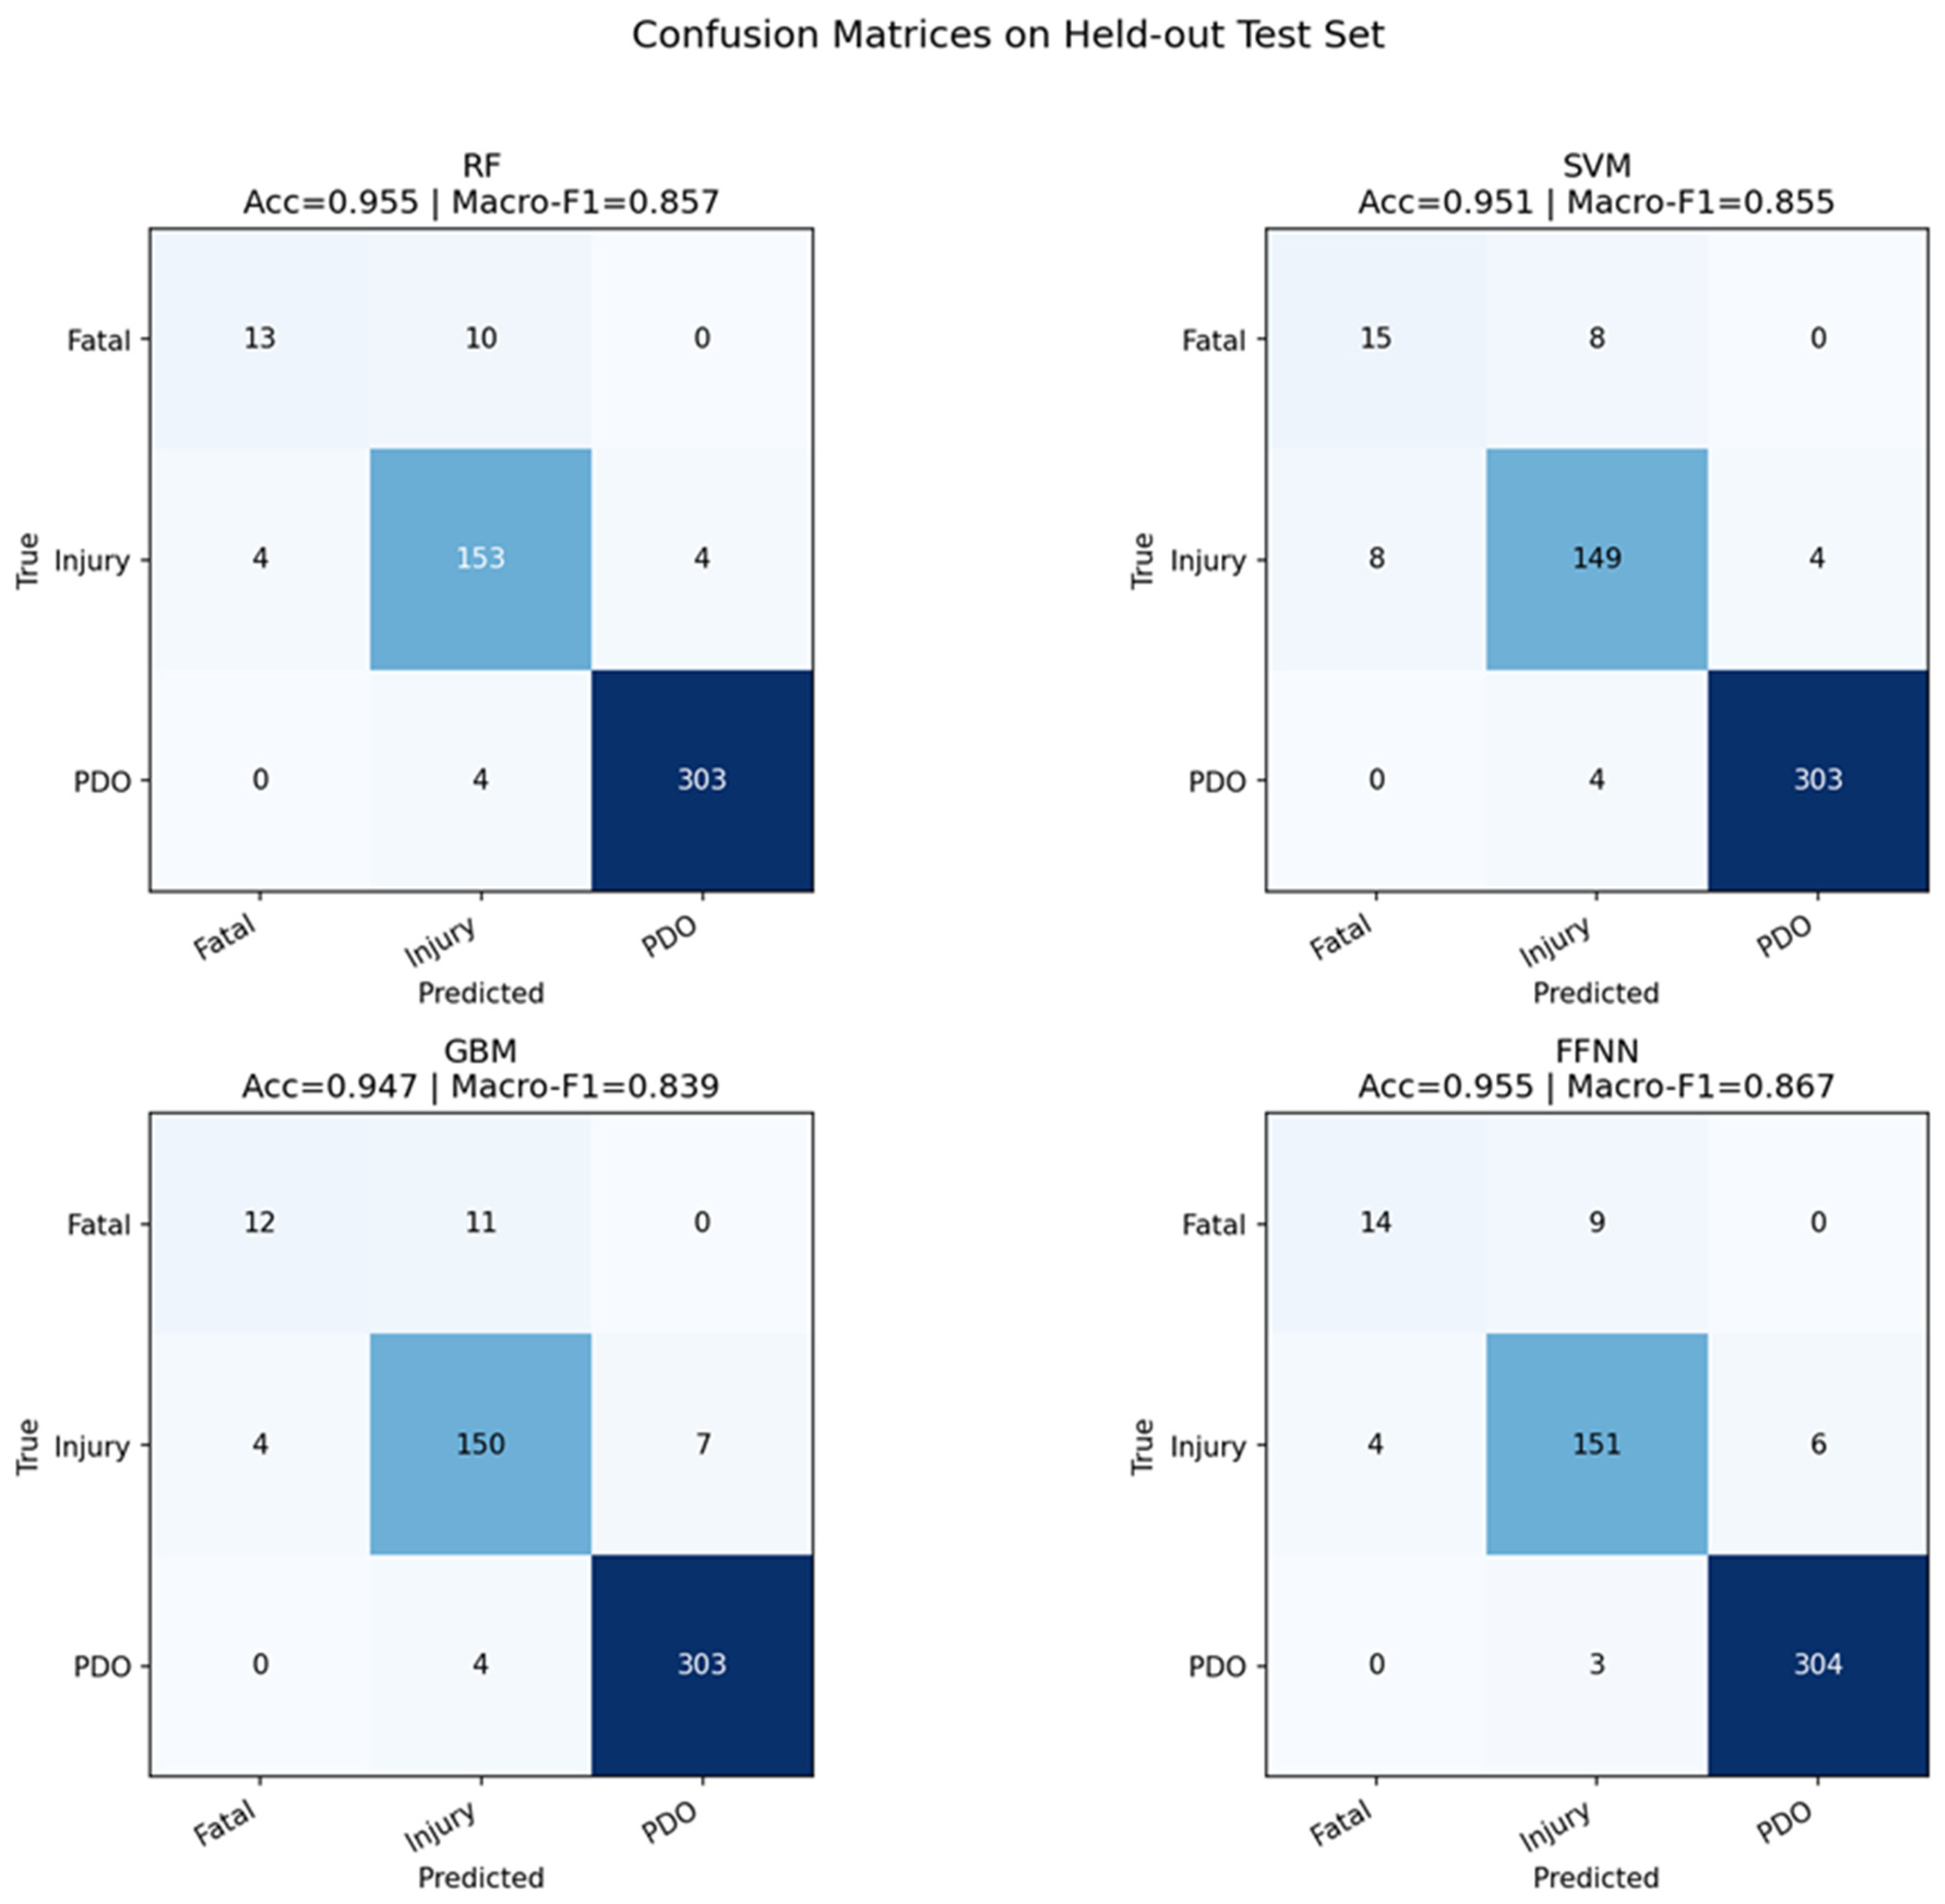
Models’ performance was assessed utilizing various indices including confusion matrices, ROC, AUC, precision, recall, and F1. Confusion matrices are created for every algorithm under consideration to analyze the prediction quality of the proposed classification models. A detailed breakdown of the true and false instances of severity classes, including fatal, injury, and PDO, is accurately classified. Hence, the aggregate performance metrics of accuracy and F1-score are further complemented. Evaluating these matrices helps in examining model behavior, especially in different classes. It also serves as the distinguishing feature between severe and non-severe outcomes and common misclassification patterns. Figure 3 shows the confusion matrices for crash injury severity classification for each model.
All models accurately classified around 303–304 PDO cases with minimal error. The injuries are also correctly identified, with only a few wrongly classified as fatal or PDO. The difficulty in prediction is analyzed with the fatal class, as many cases were misclassified as injury classes. The highest accuracy in fatal cases is achieved by SVM (15), followed by FFNN (14), RF (13), and GBM (12). Most classification errors occurred between the fatal and injury categories, indicating greater similarity between these two crash severity levels. In contrast, none of the models misclassified fatal crashes as PDO, suggesting that PDO crashes are clearly distinguishable from the more severe categories. RF and FFNN showed the strongest overall class-level performance, while GBM exhibited more confusion between the injury and PDO classes.
It is concluded that all four models attained high predictive performance with accuracy ranging from 0.94 to 0.96, as can be seen in Table 5. The highest accuracy of 0.96 is achieved by the RF model, followed by FFNN at 0.95. On the other hand, GBM and SVM both reached the accuracy value of 0.94. Furthermore, macro F1-score offers a better assessment of all crash severity classes’ performance. RF and FFNN have the highest macro F1-score of 0.86, representing that both models show high performance in classifying major and minor severity classes. GBM and SVM show a marginally lower value of 0.84. The class imbalance is further highlighted by balanced accuracy. The highest balanced accuracy of 0.85 is achieved by SVM and FFNN, outperforming RF at 0.83 and GBM at 0.81. Hence, it is concluded that SVM and FFNN show more consistent predictive performance among severity classes. GBM shows a higher value of the macro ROC-AUC value of 0.97, indicating that this model has a higher capability of distinguishing between crash severity. Next is SVM with an ROC-AUC value of 0.96, RF at 0.95, and FFNN at 0.94, respectively. GBM showed lower balanced accuracy and macro F1-score and the highest ROC-AUC, suggesting its strong discrimination and overall classification performance. The prediction performance of all the models in differentiating between crash severity is further evaluated by the ROC analysis. Table 6 presents class-wise performance metrics for all the models. It is observed that performance was strongest for PDO (the majority class), and weaker for fatal (minority class), which is expected due to its small sample size; however, the proposed models still capture the dominant fatal crash patterns reasonably well. Comparing the models, RF achieved the best overall balance across all the classes and accuracy metrics. FFNN and GBM also demonstrated reasonably good predictive performance, while SVM attained relatively lower results, particularly for the fatal class.
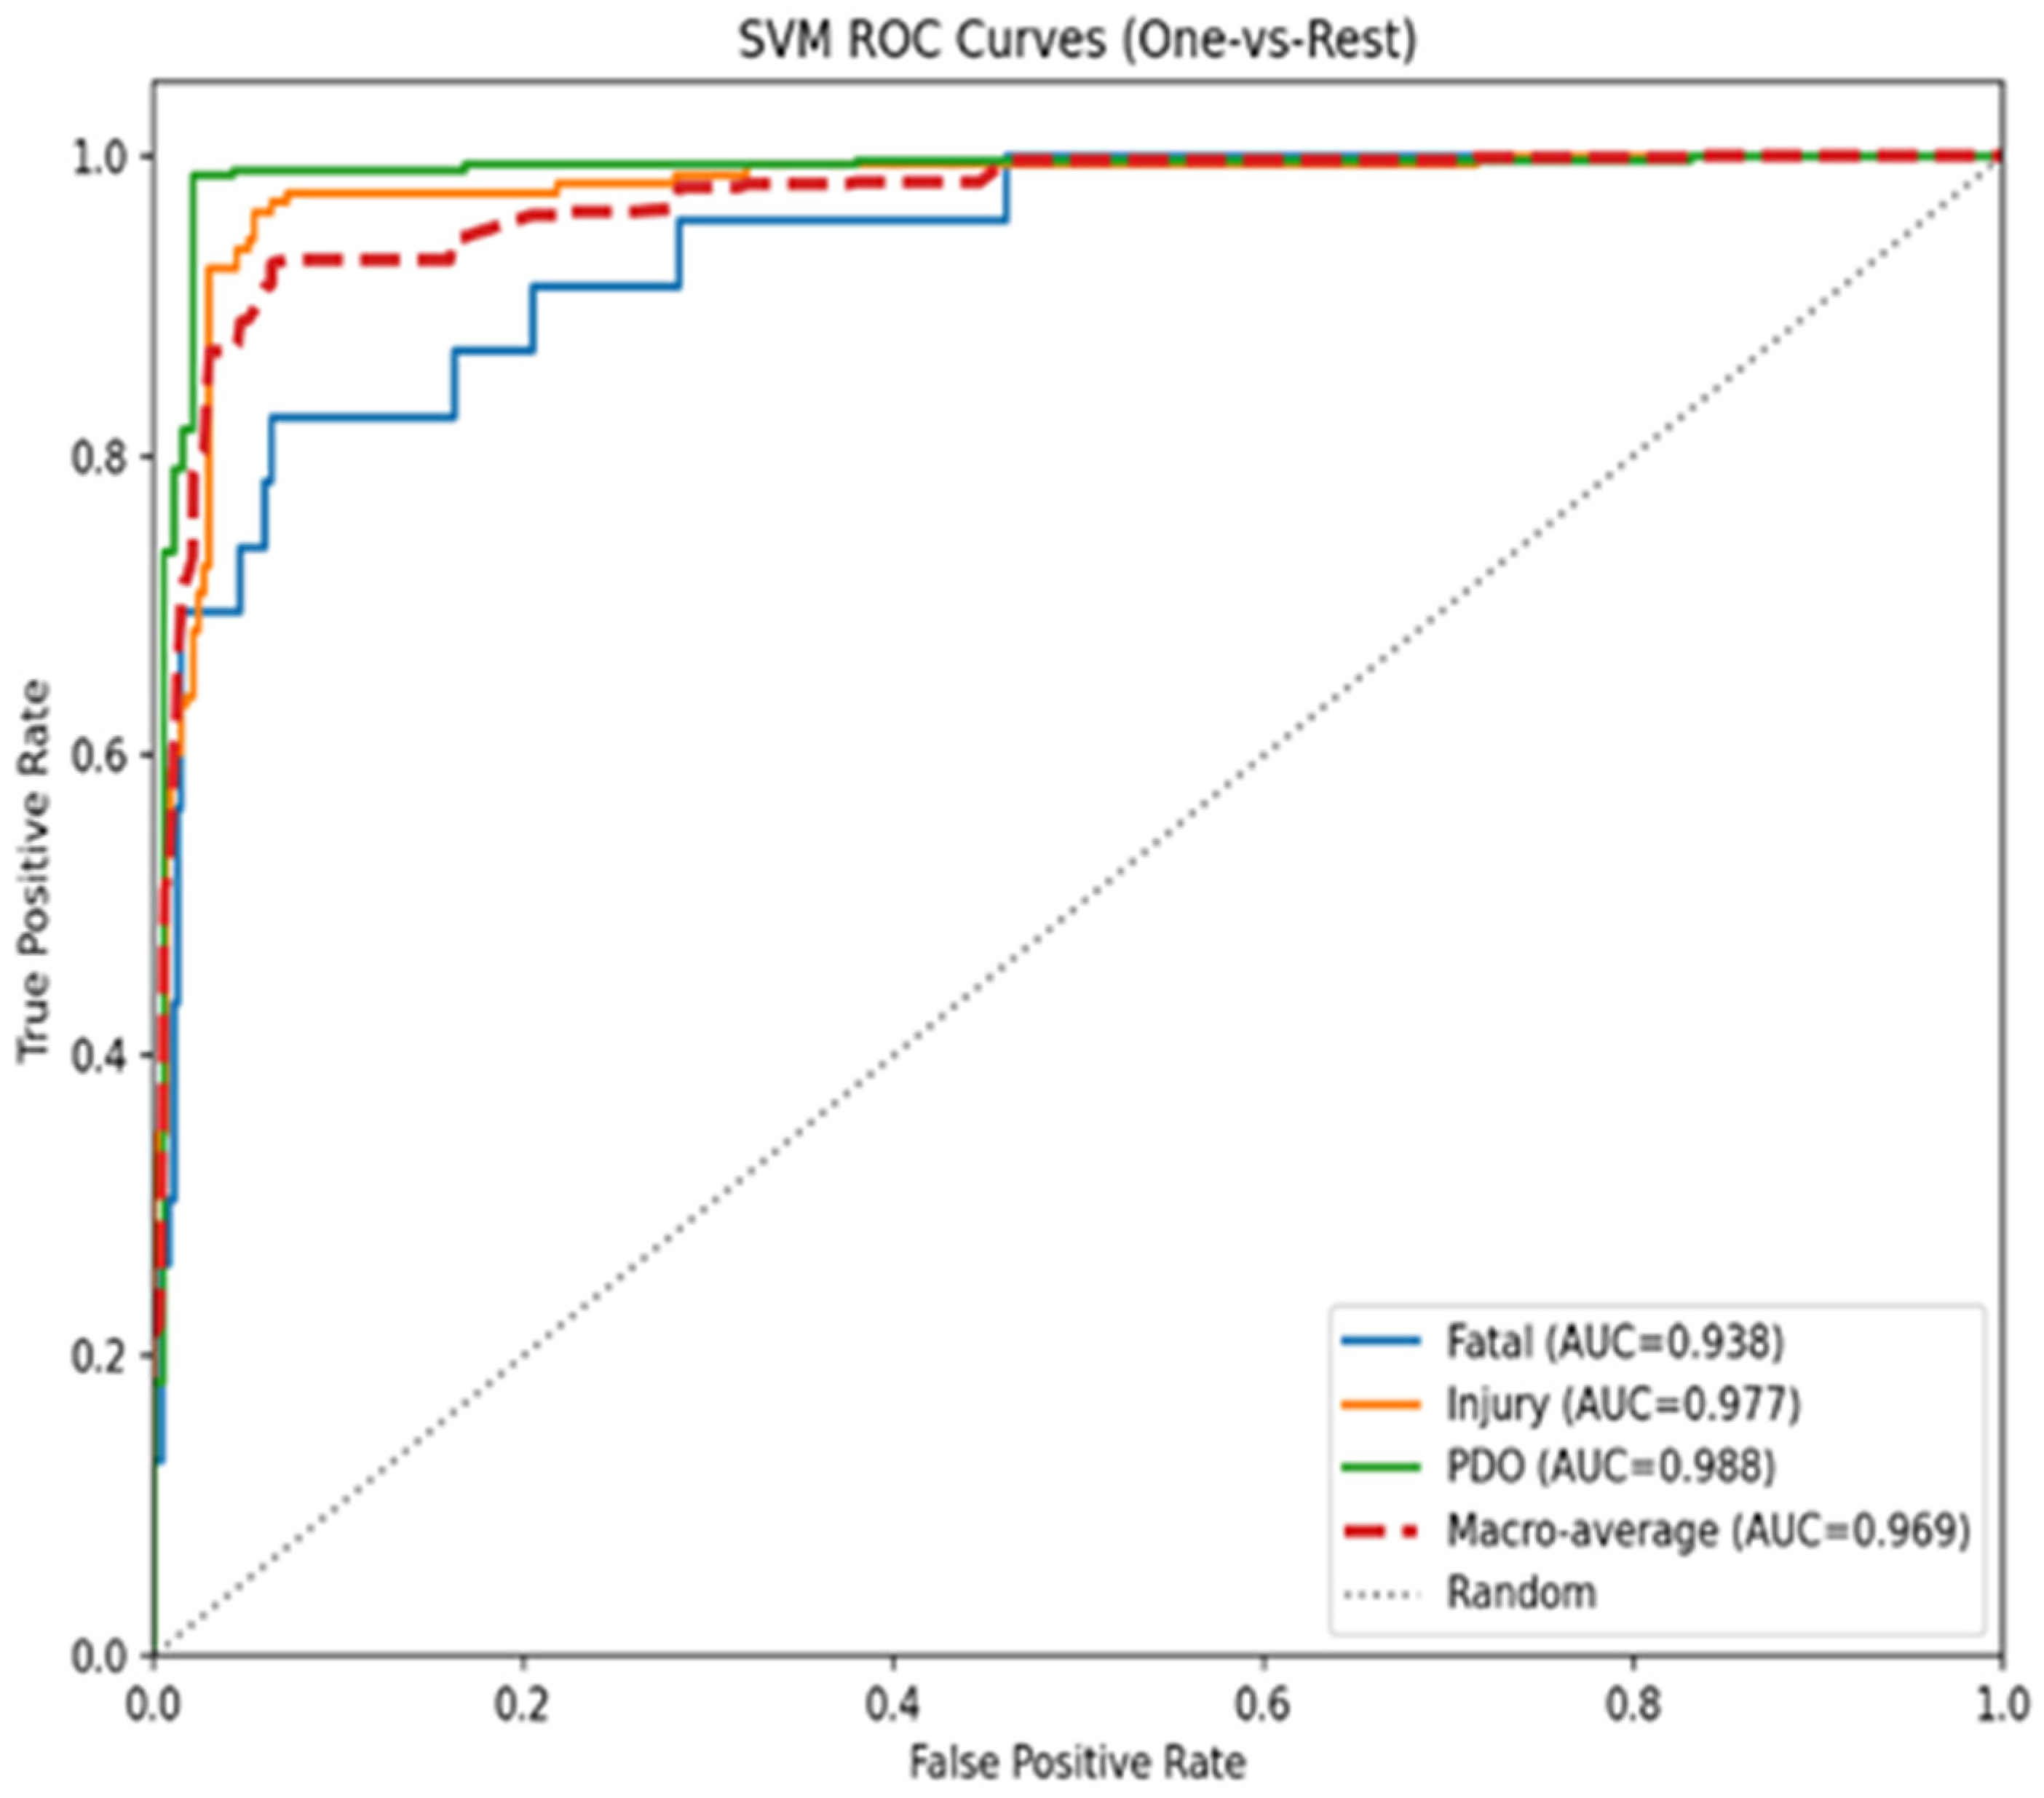
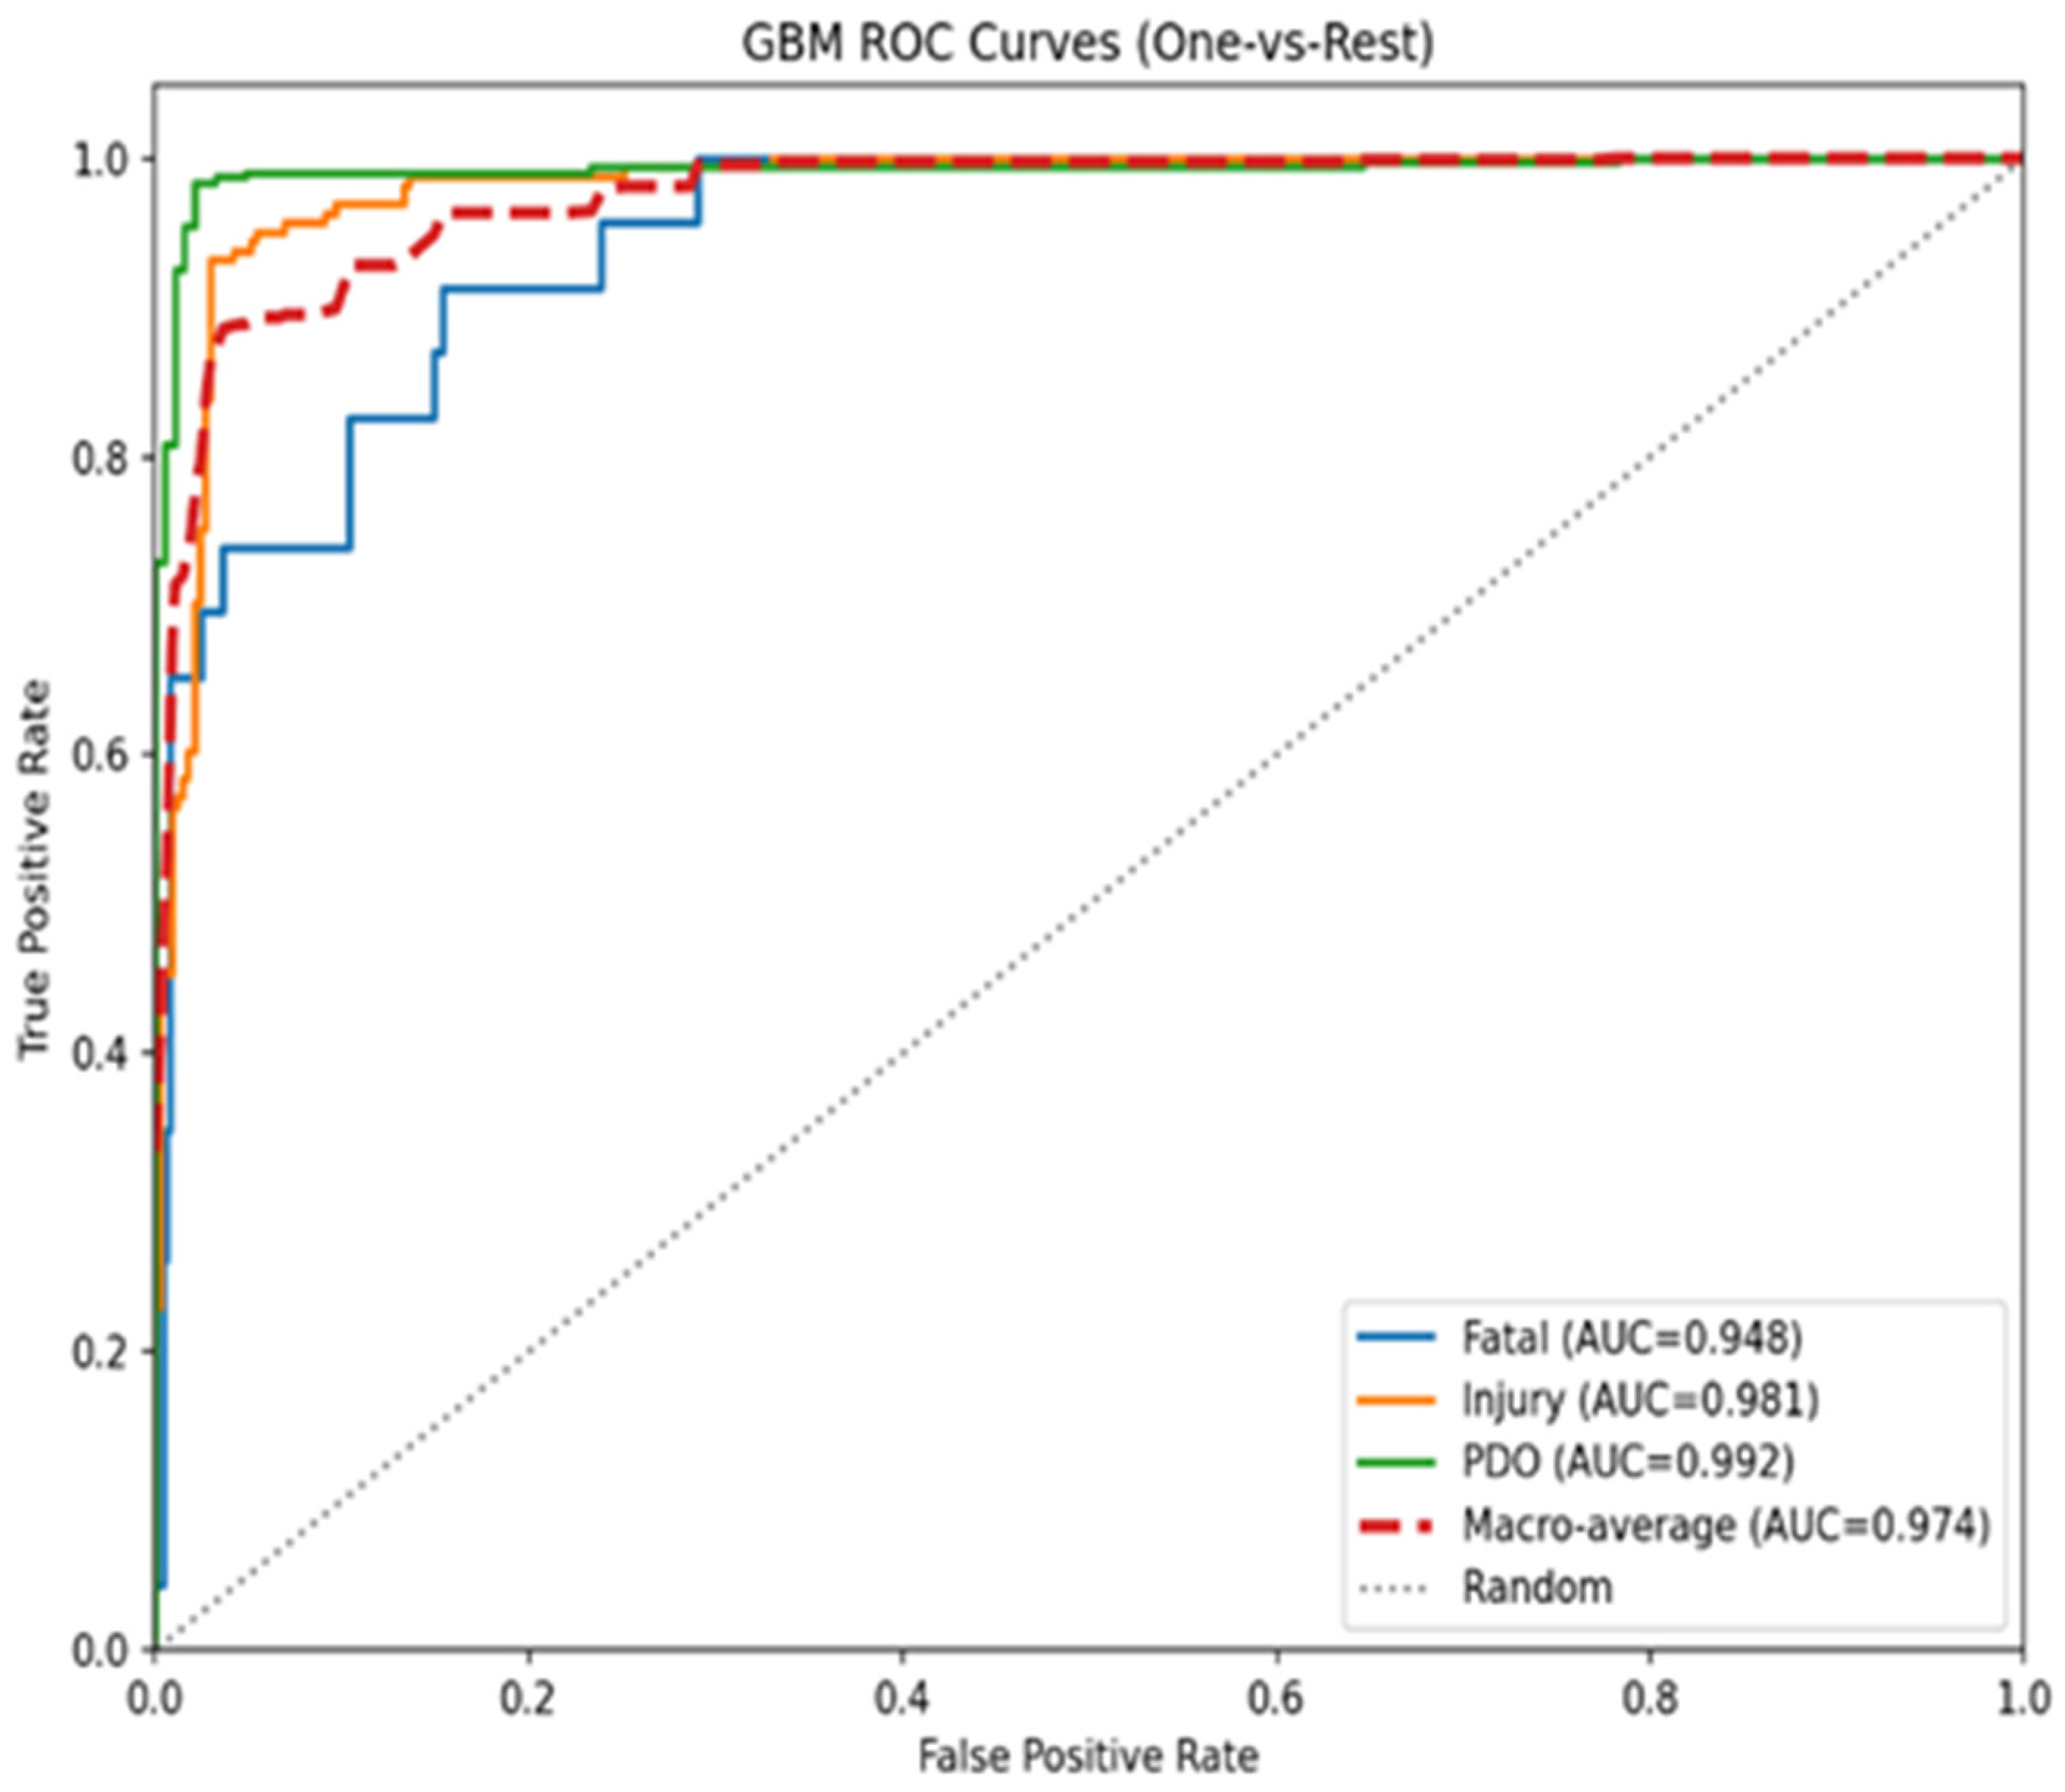
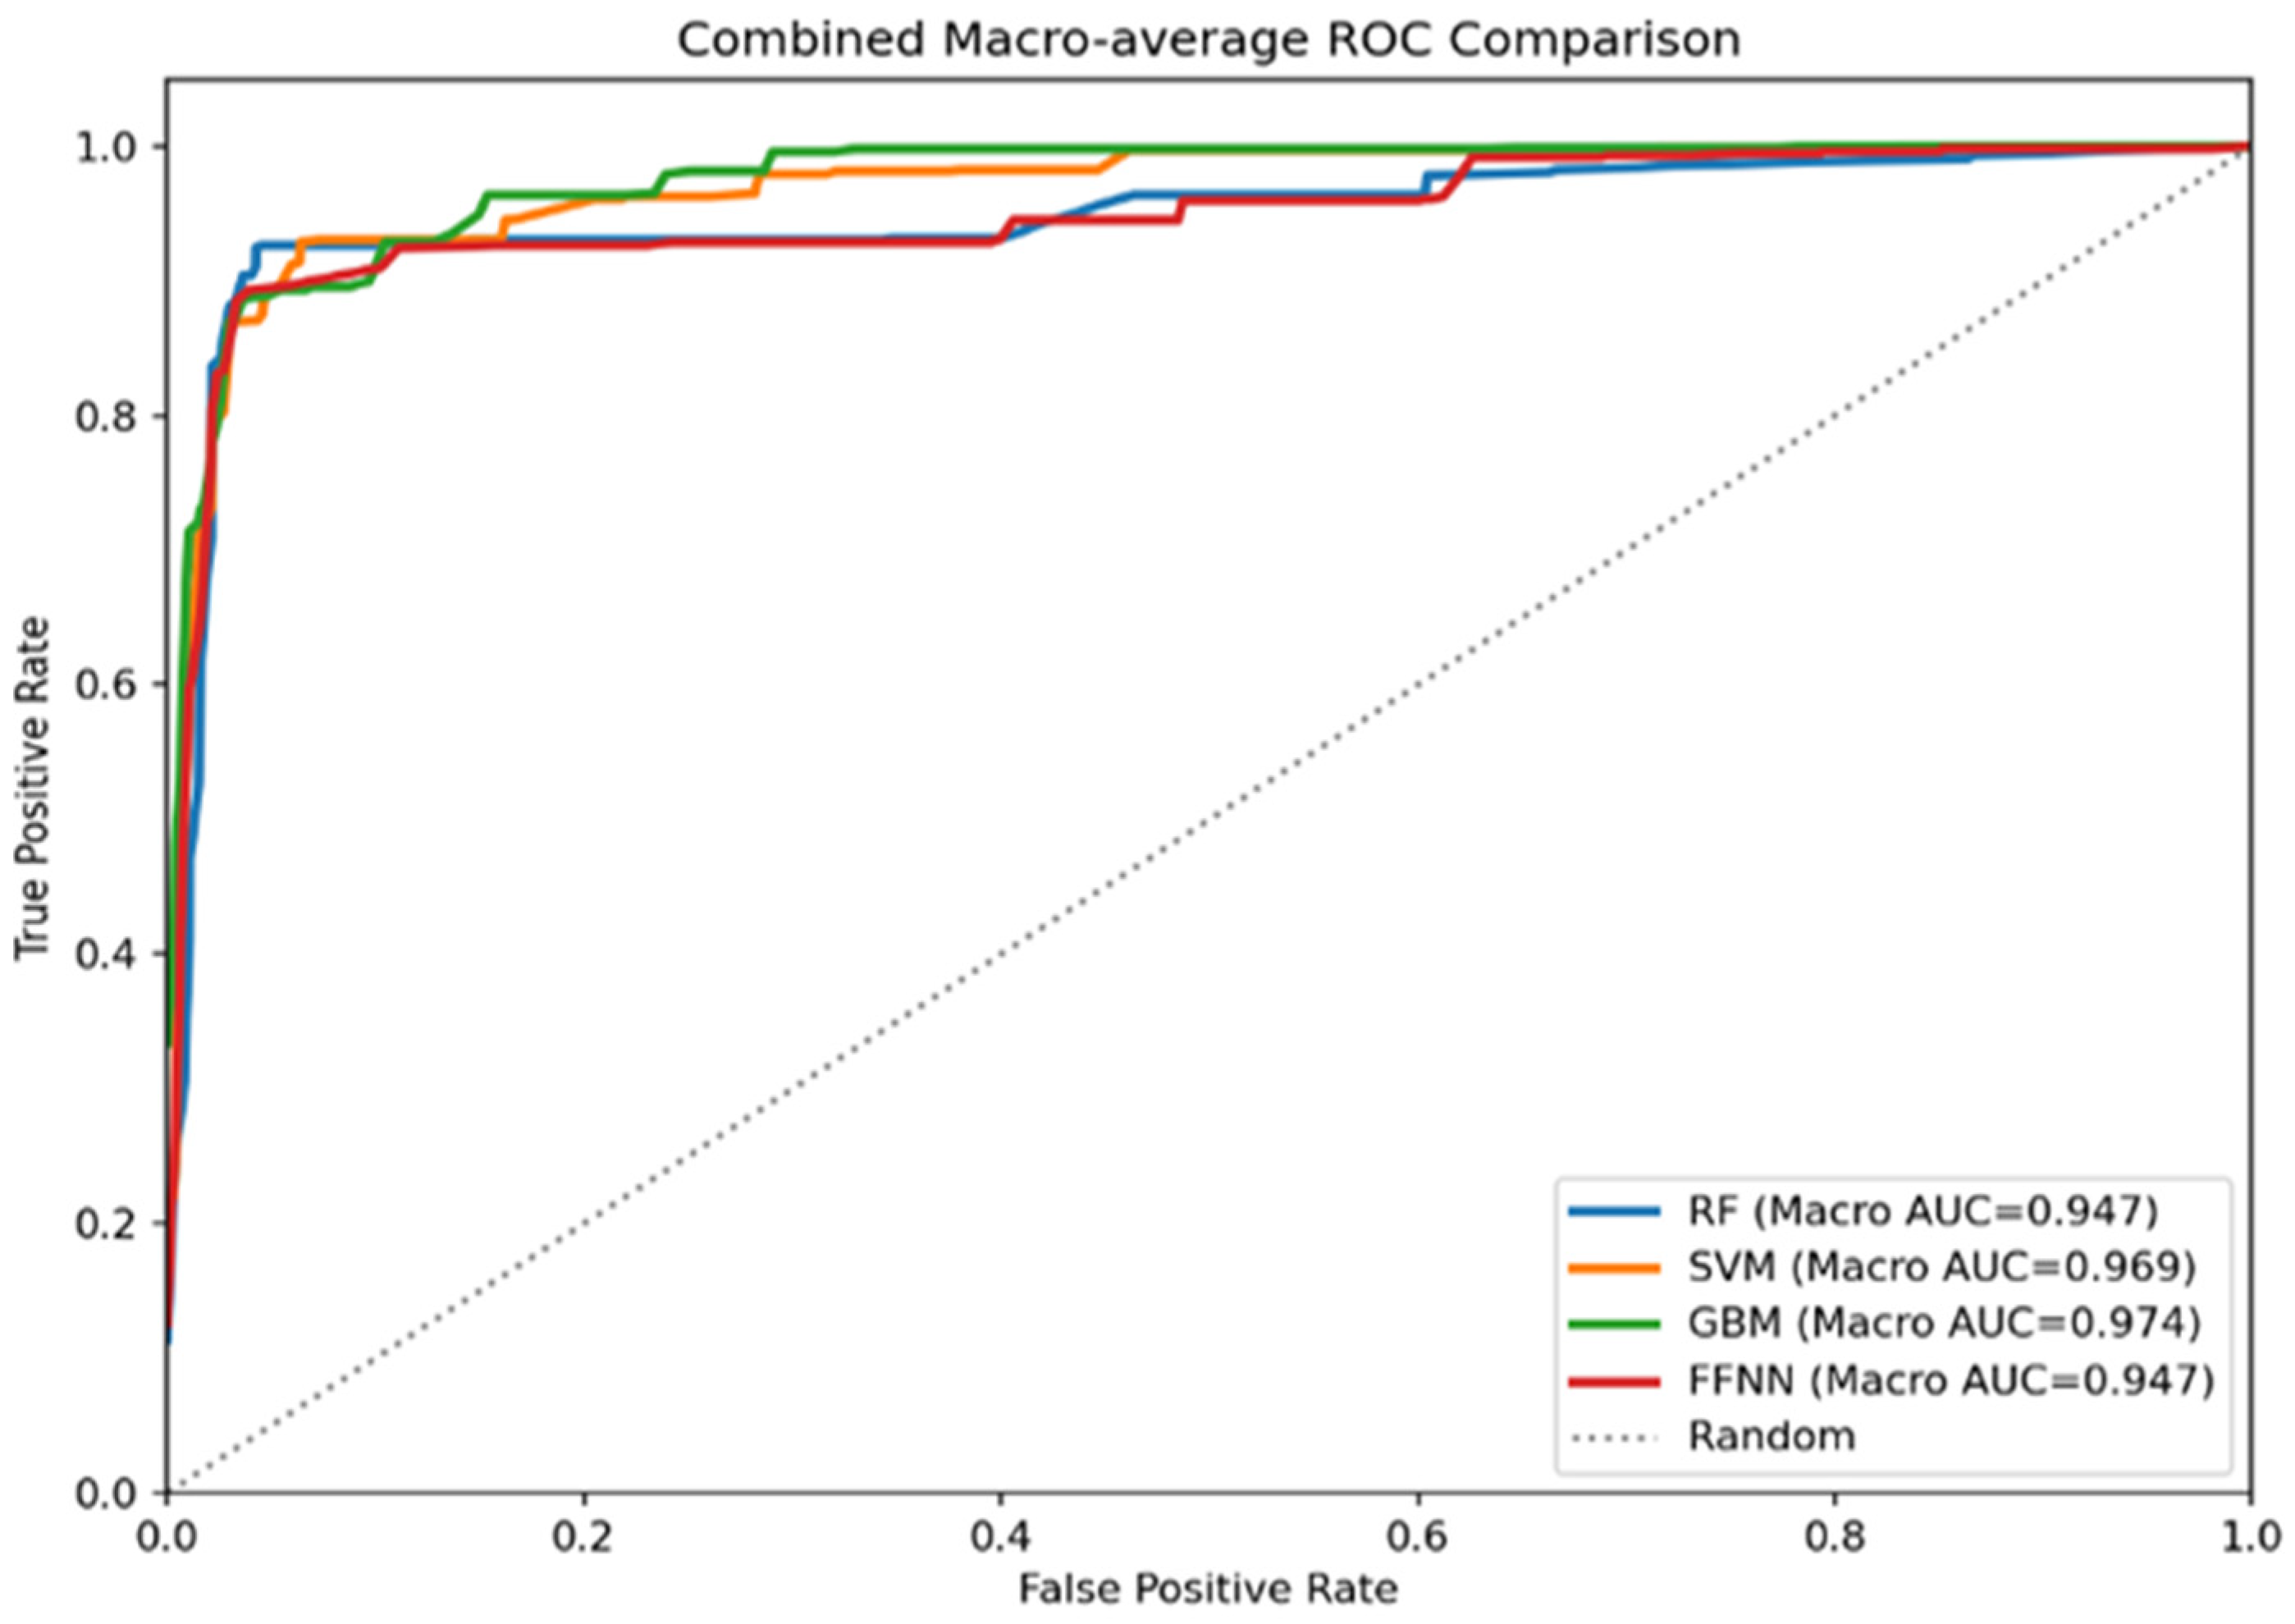
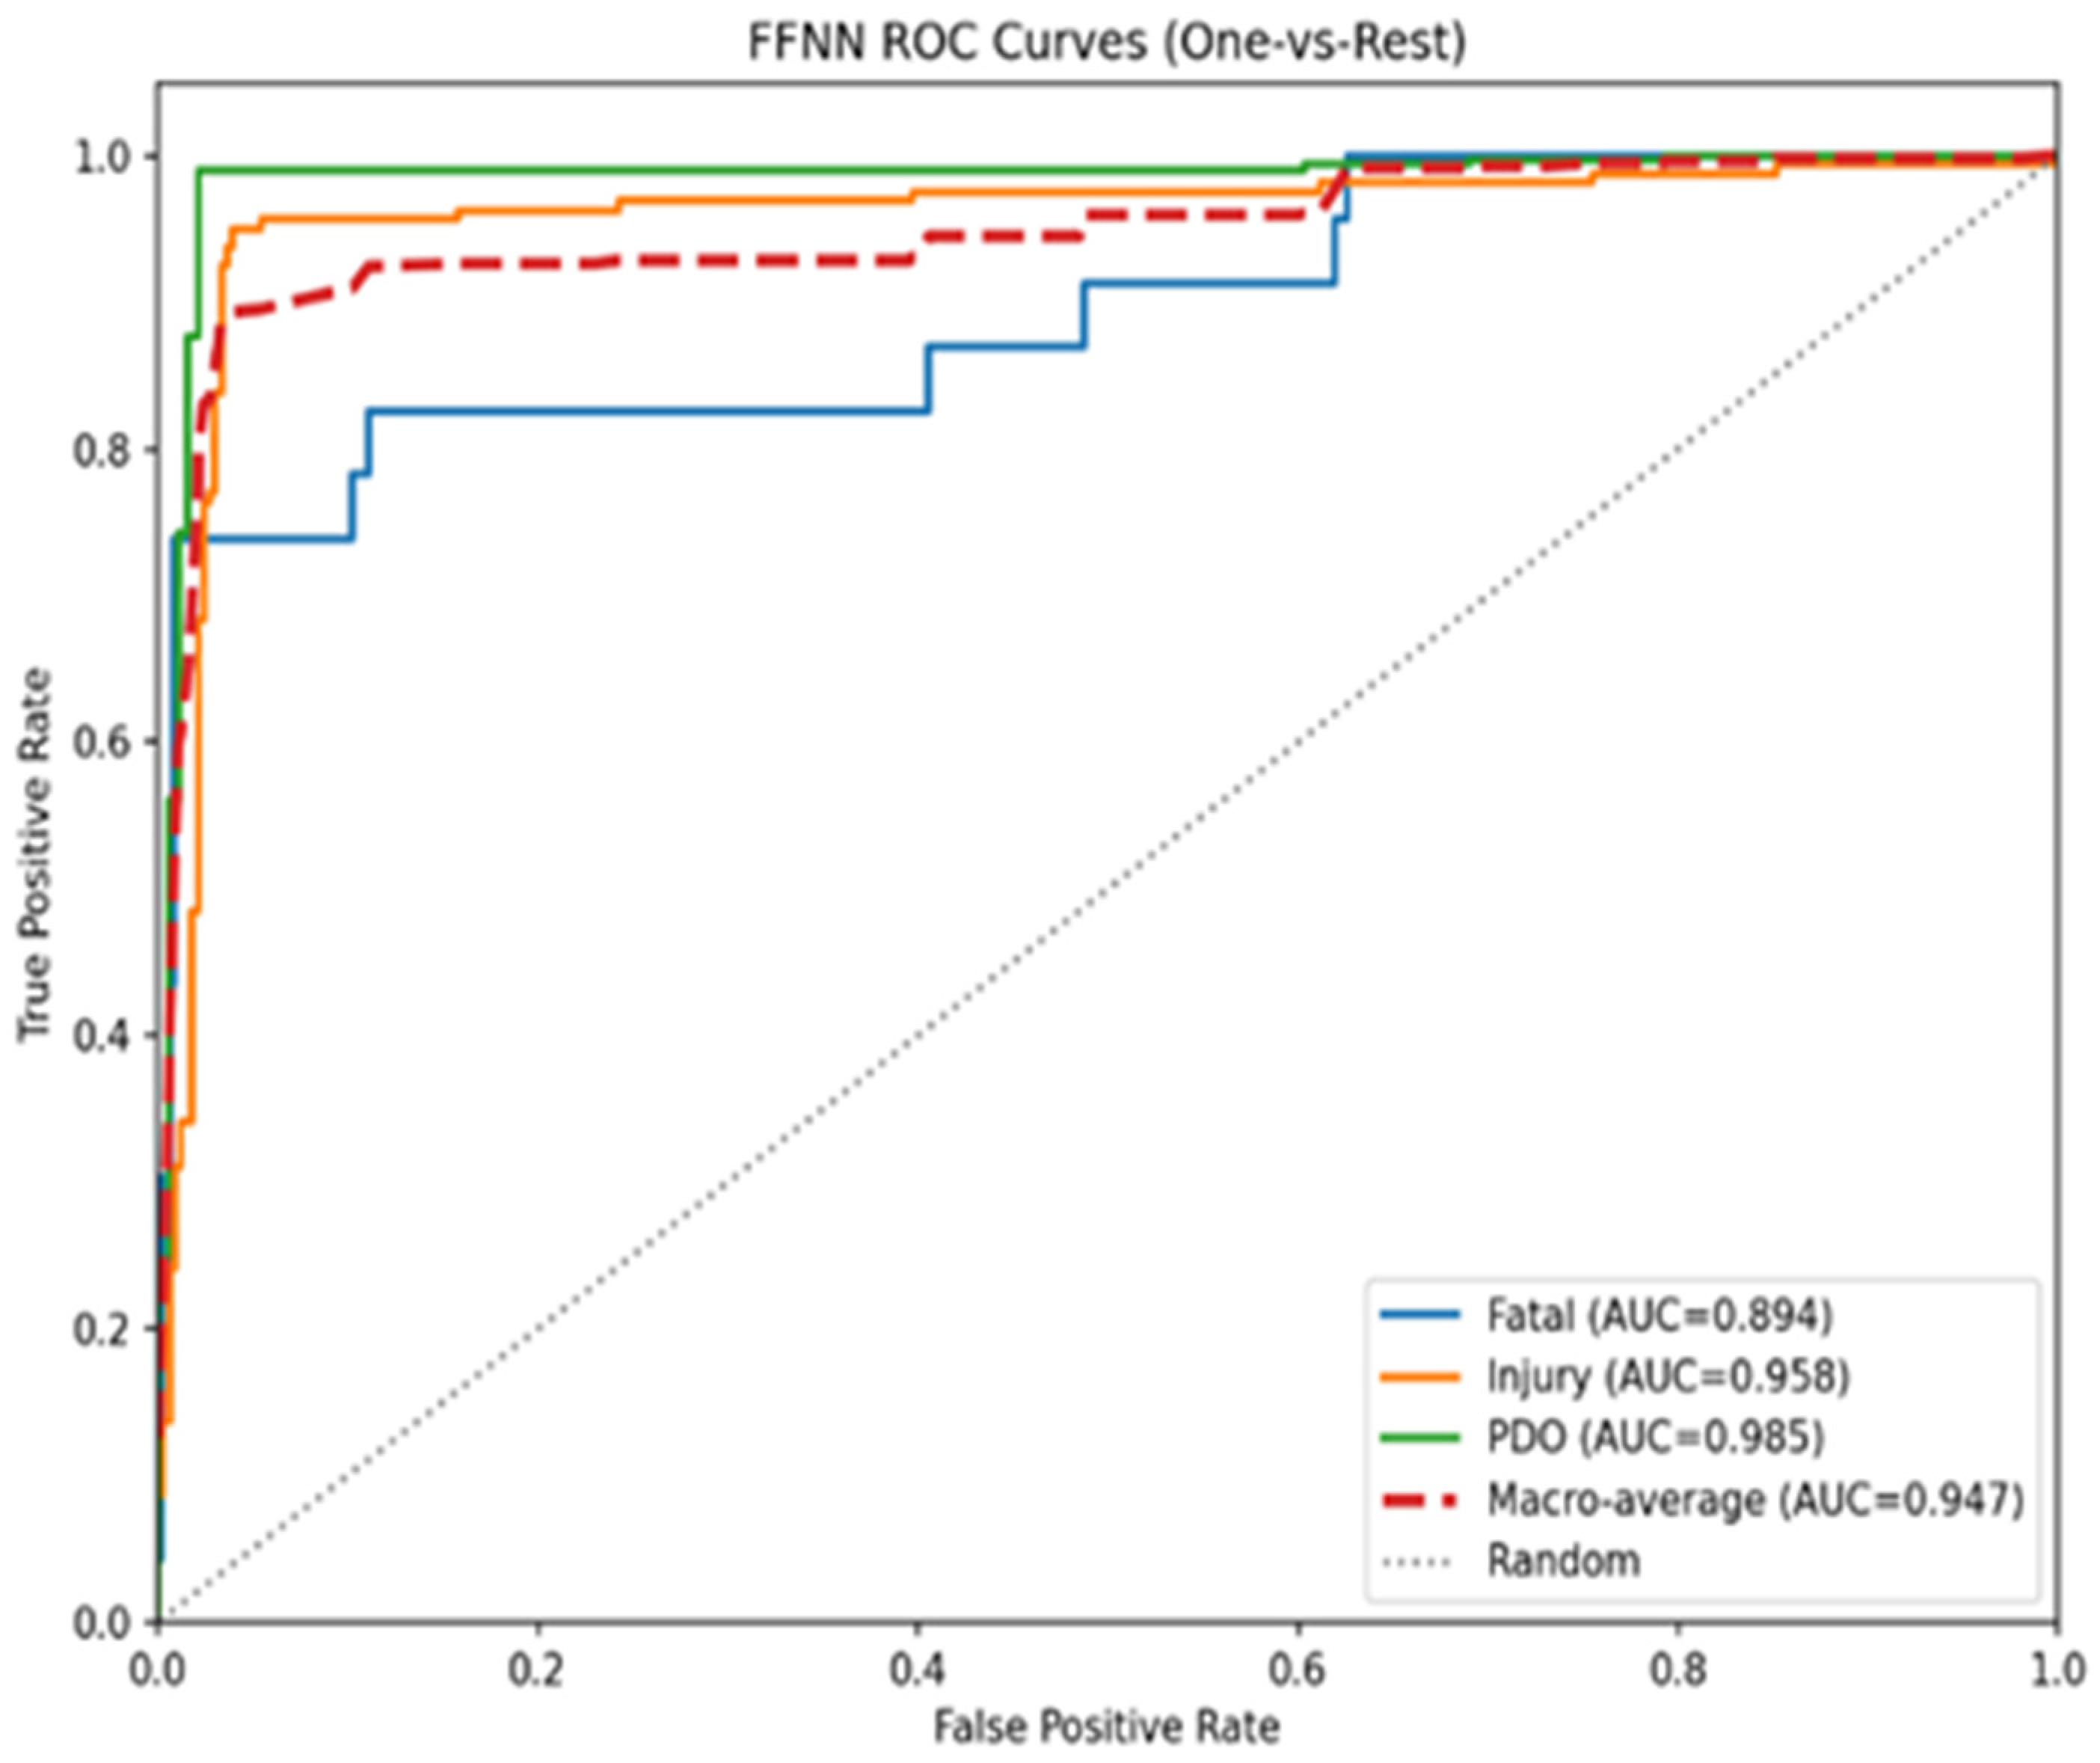
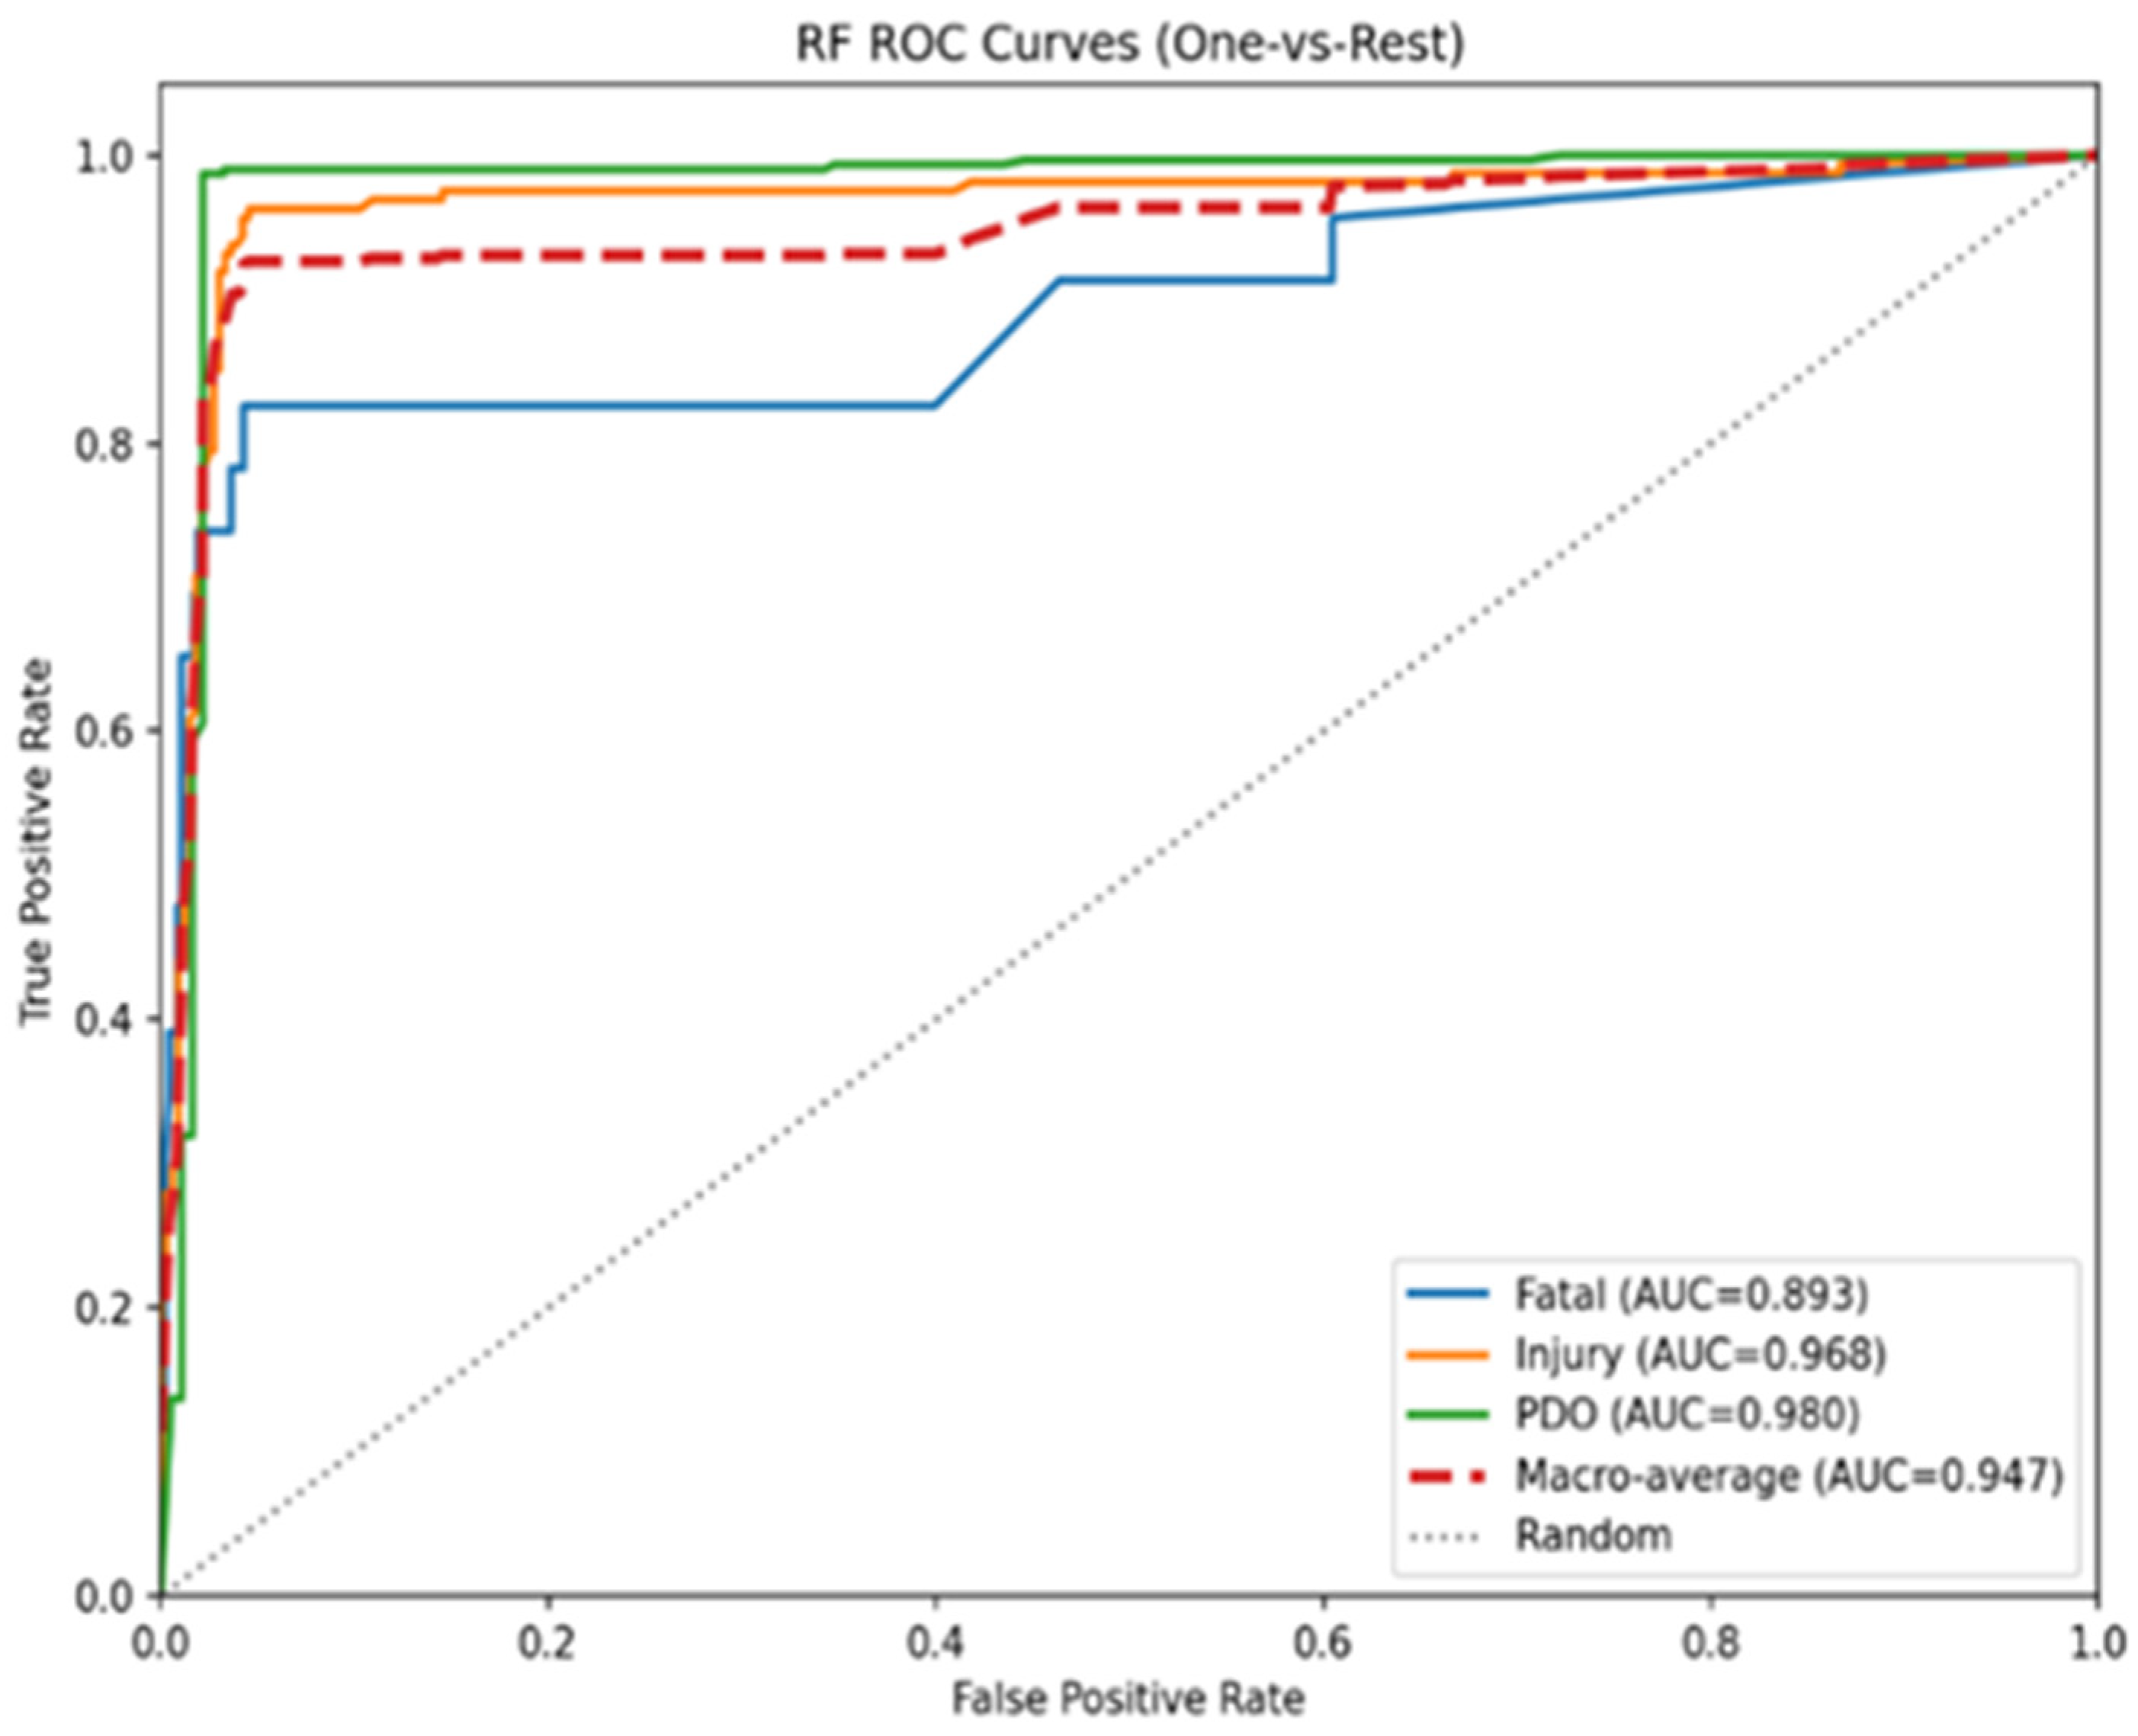
Figure 4 compares the macro-average ROC curves of RF, SVM, GBM, and FFNN models on the held-out test set. All models achieved ROC curves substantially above the random baseline, indicating strong discriminative performance. GBM achieved the highest macro-average ROC-AUC (0.974), followed by SVM (0.969), while RF and FFNN produced similar values (0.947). These results suggest that GBM and SVM were more effective at separating the three crash severity classes over a range of classification thresholds. To further investigate the discriminative performance of each model, Figure 5, Figure 6, Figure 7 and Figure 8 present the ROC curves for the fatal, injury, and PDO classes for each classifier.
Across all models, the PDO class achieved the highest AUC values, ranging from 0.980 to 0.992, indicating that PDO crashes were the easiest category to distinguish. The injury class also showed strong discrimination, with AUC values between 0.958 and 0.981. In contrast, the fatal class consistently produced the lowest AUC values, confirming that fatal crashes were the most difficult severity category to identify. SVM and GBM achieved the strongest discrimination for the fatal class, with AUC values of 0.938 and 0.948, respectively, whereas RF and FFNN obtained lower fatal-class AUC values of approximately 0.89. These findings are consistent with the confusion matrices, which showed that most classification errors occurred between the fatal and injury classes.

4.2. Model Interpretation Results

4.2.1. SHAP Interpretability Analysis

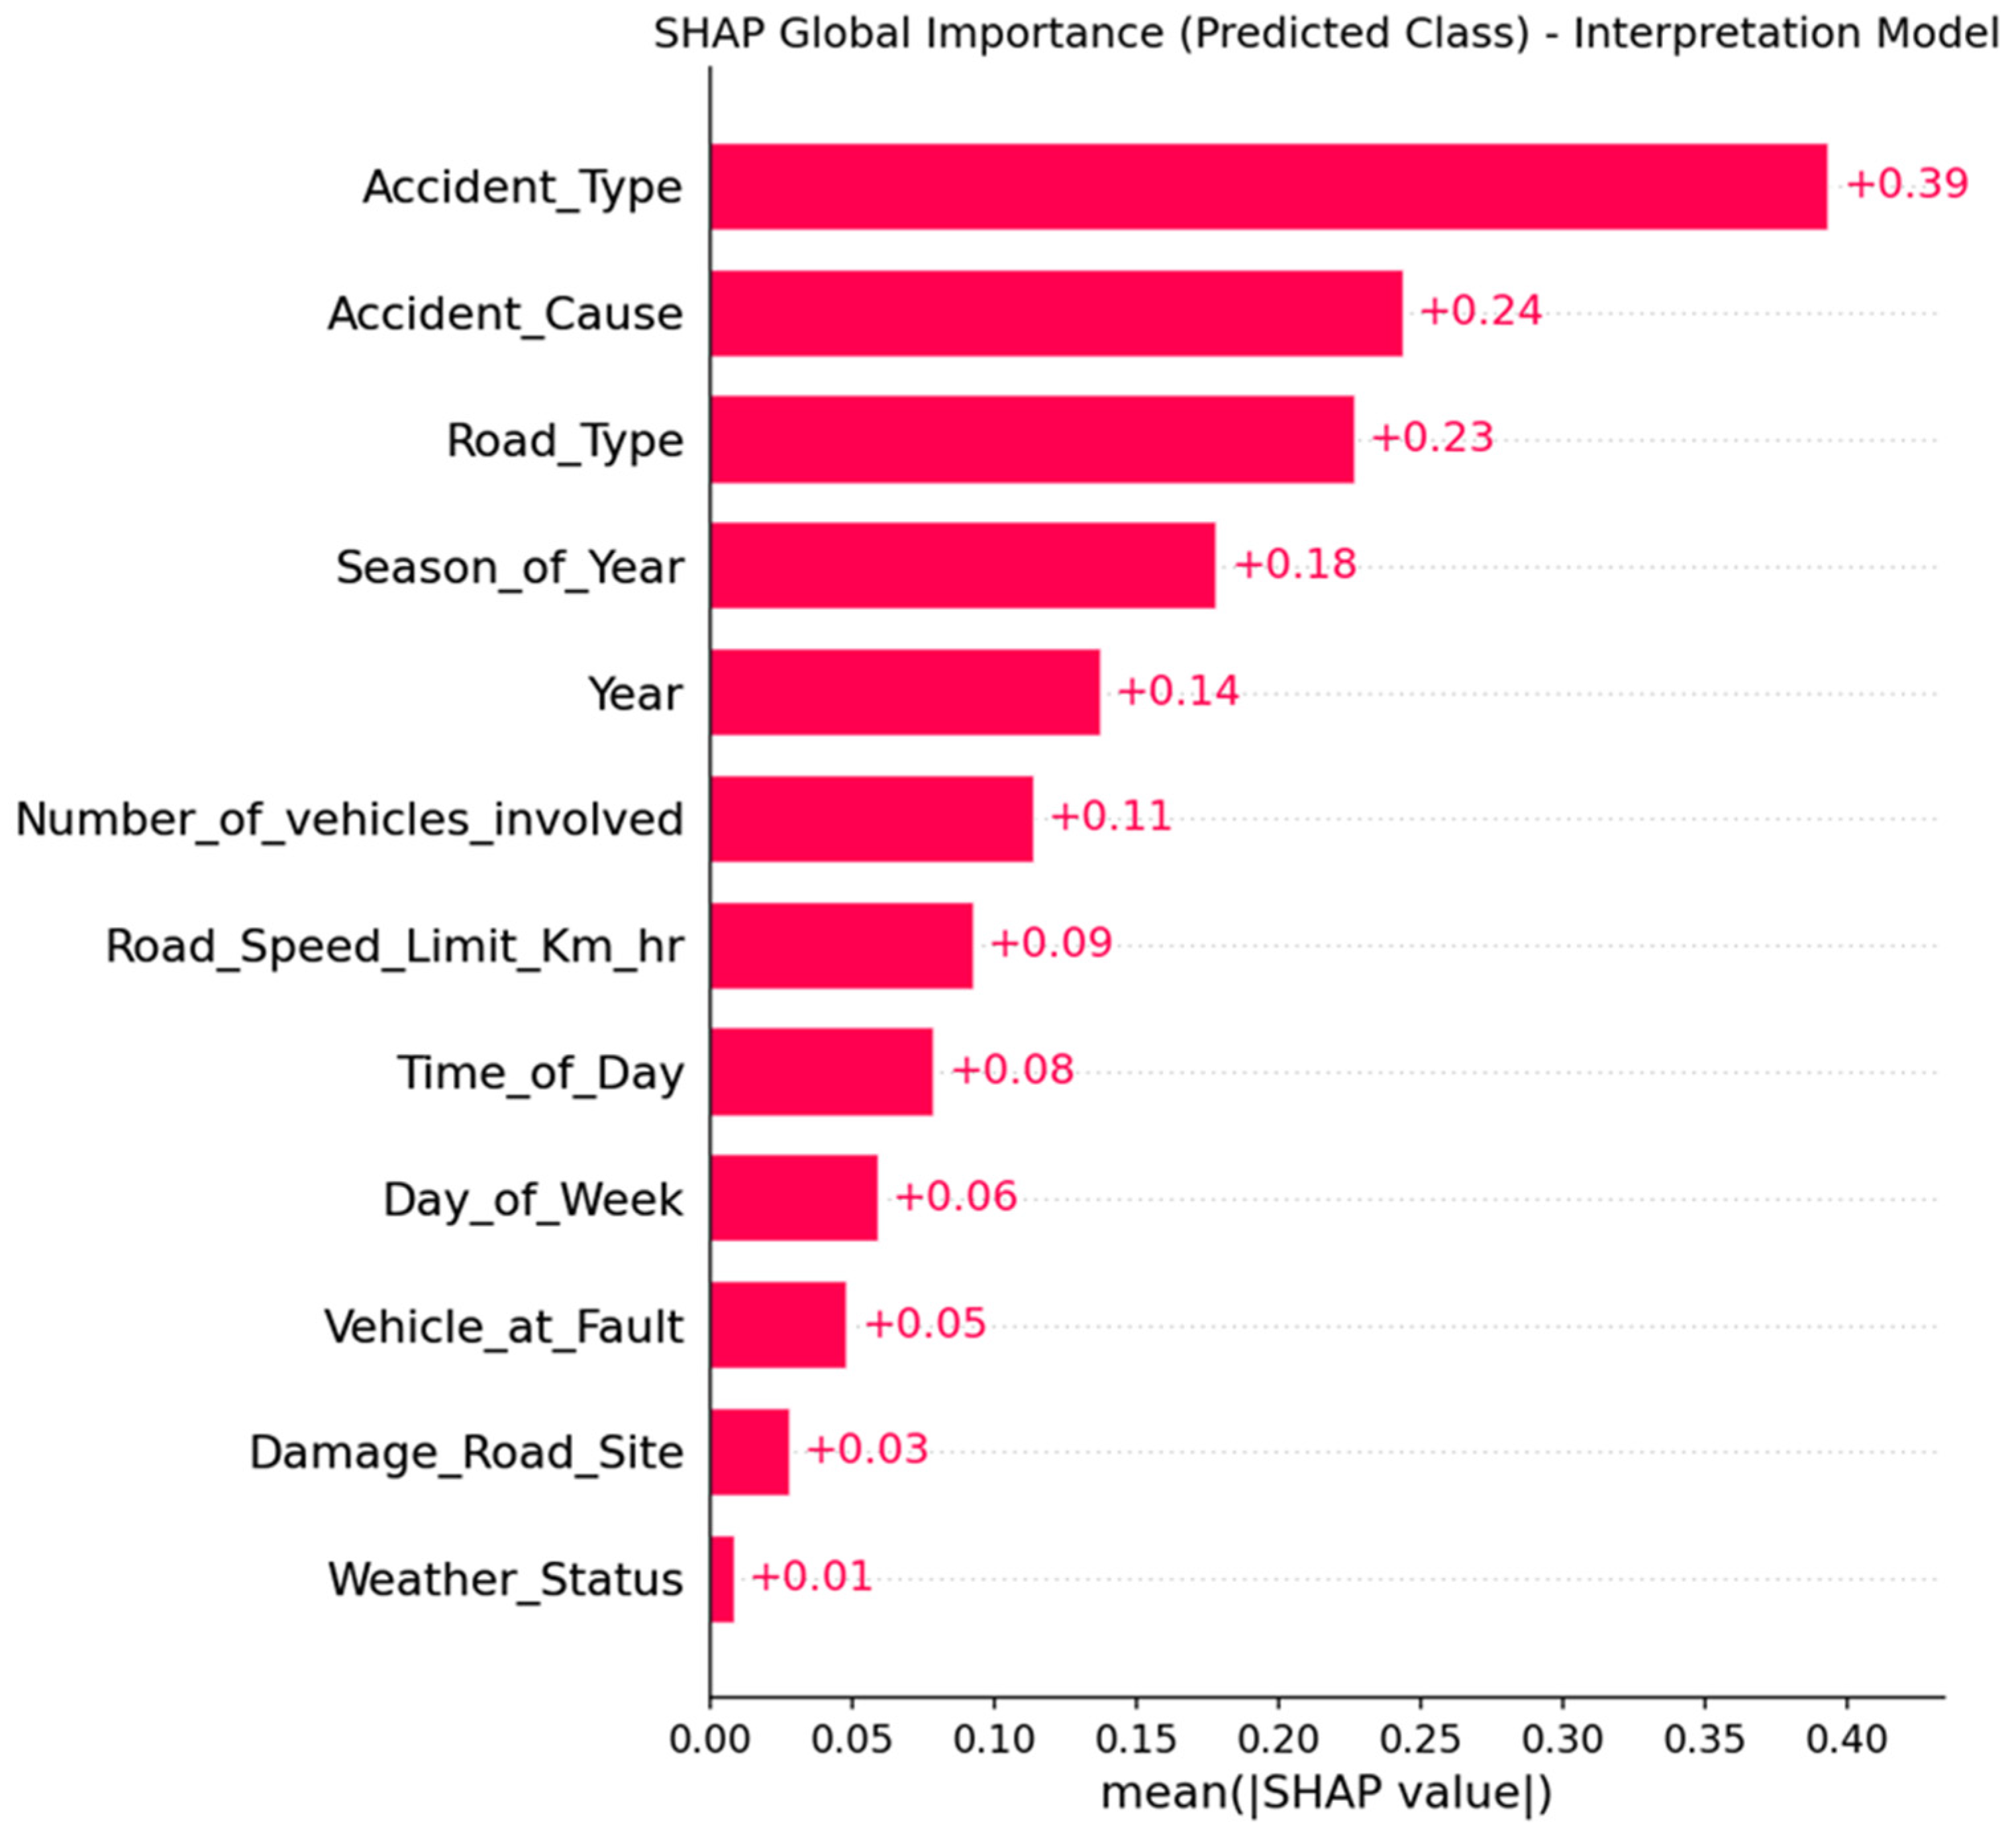
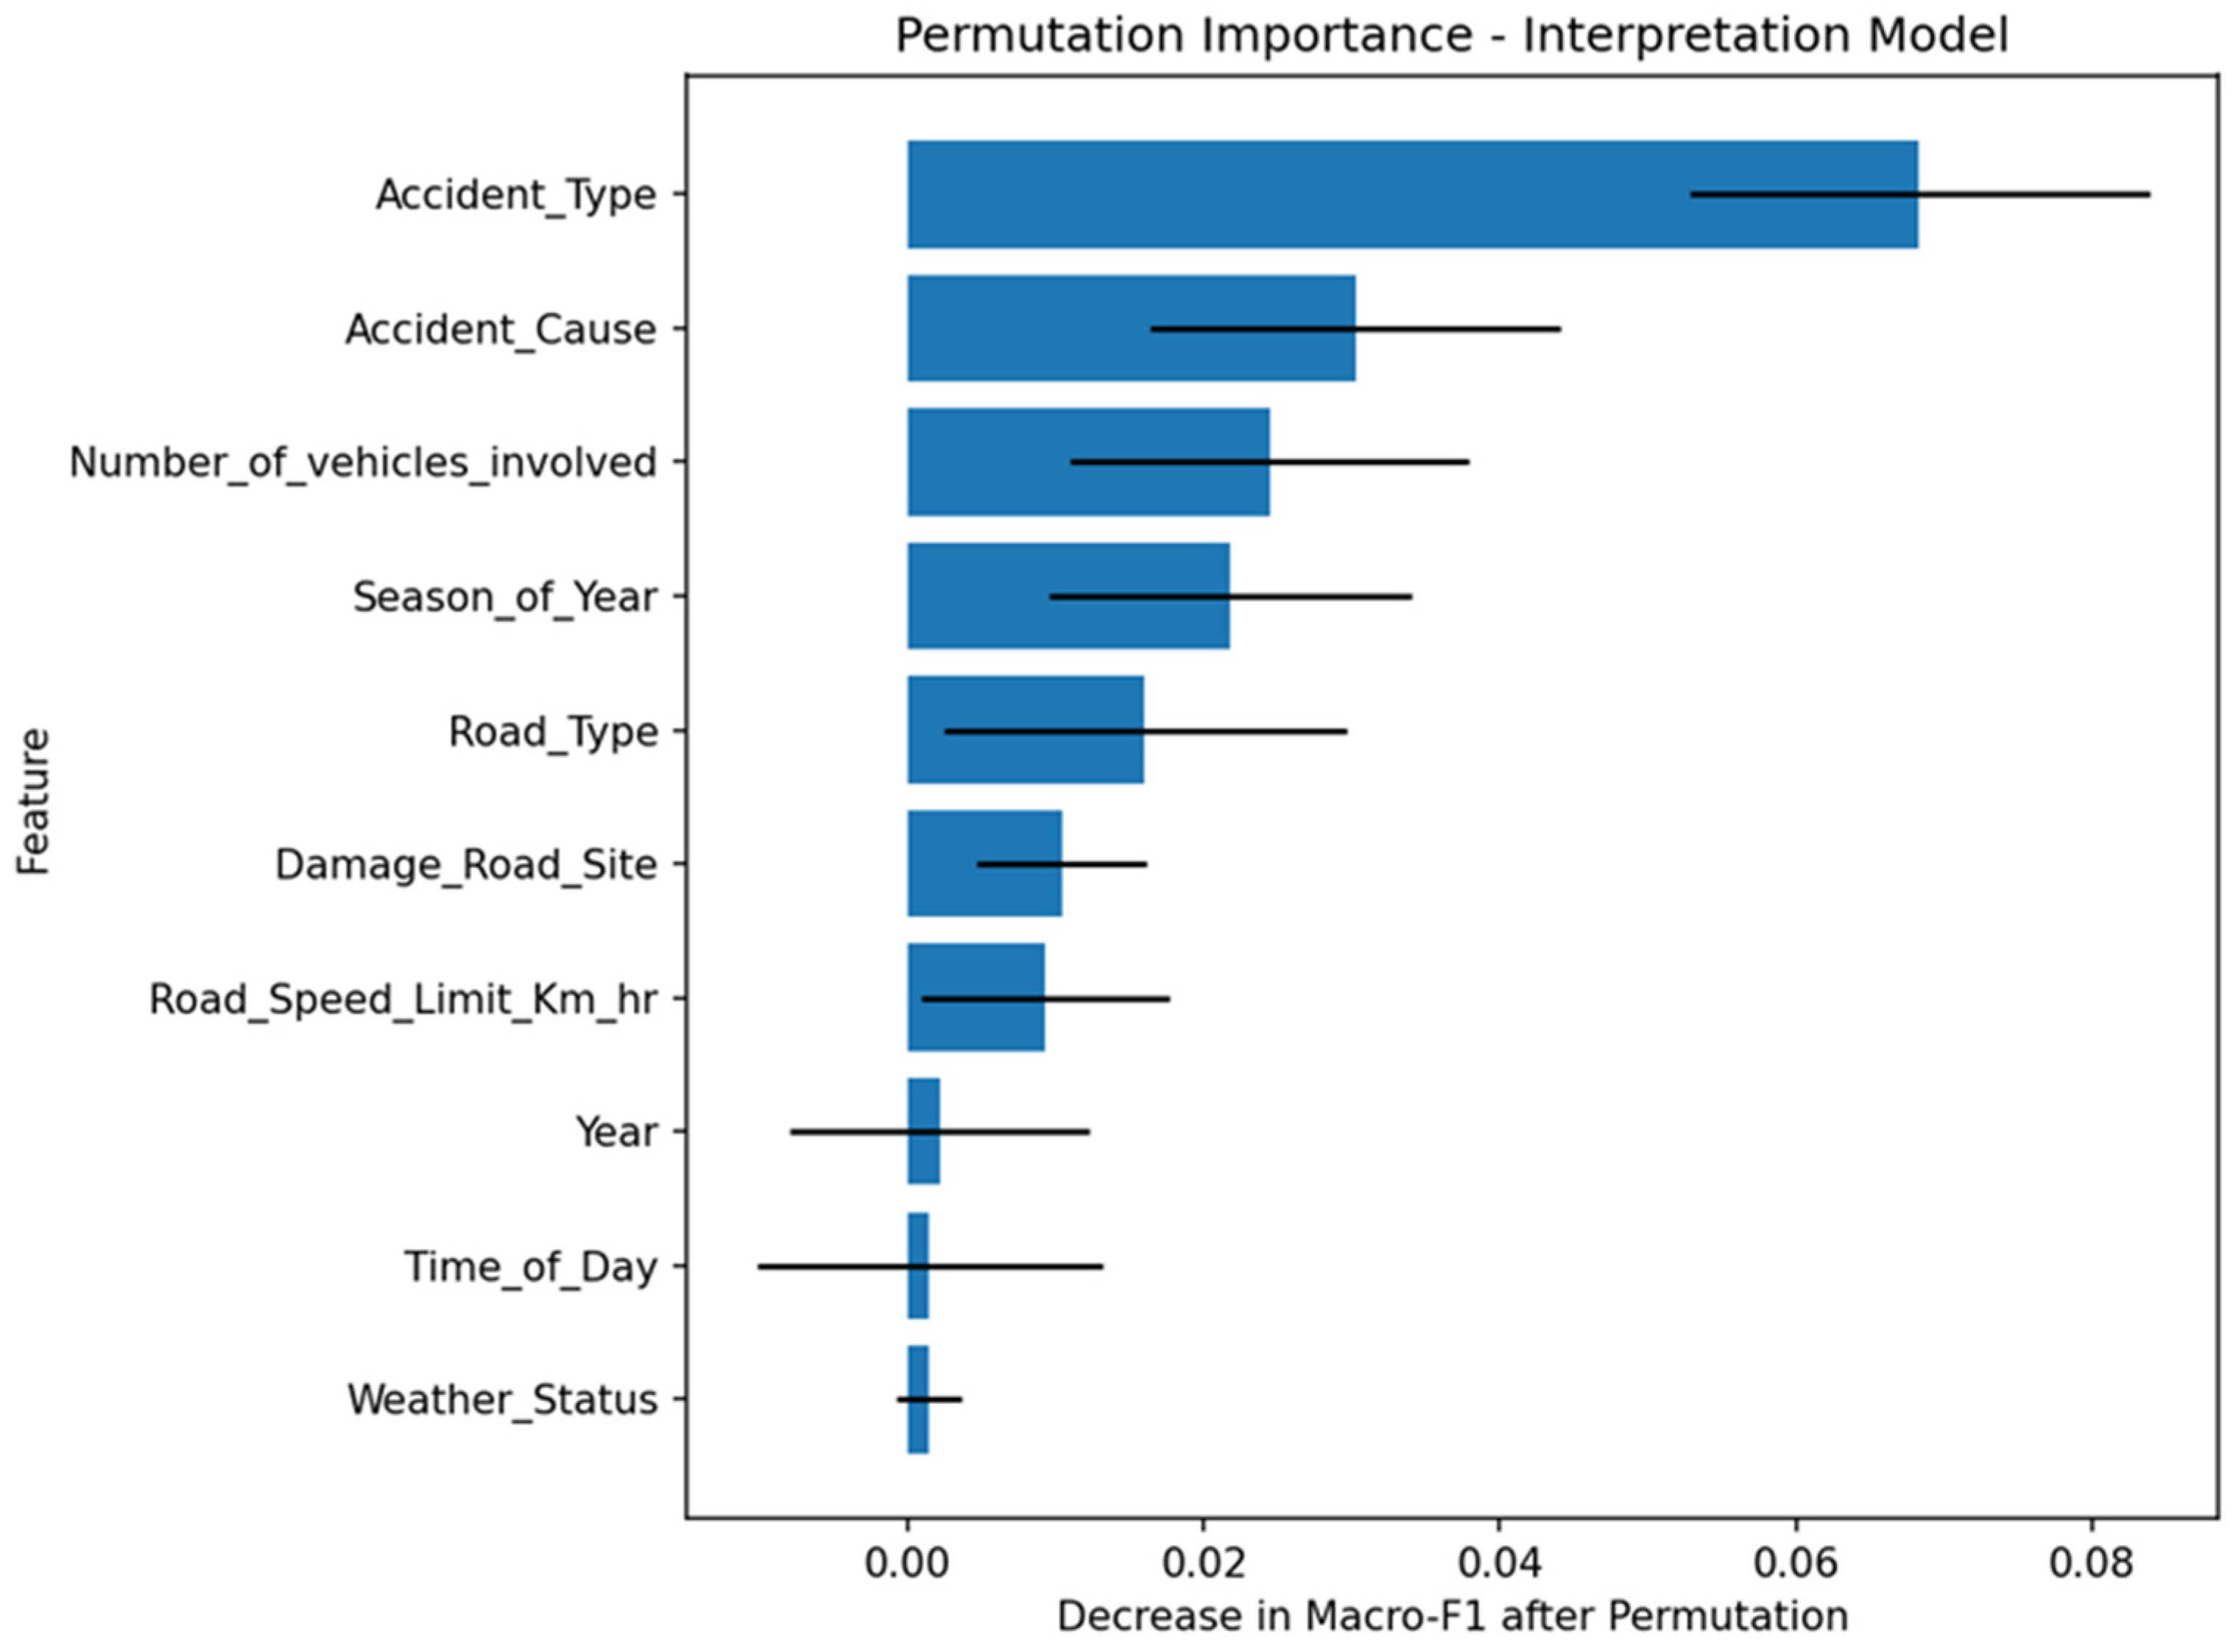
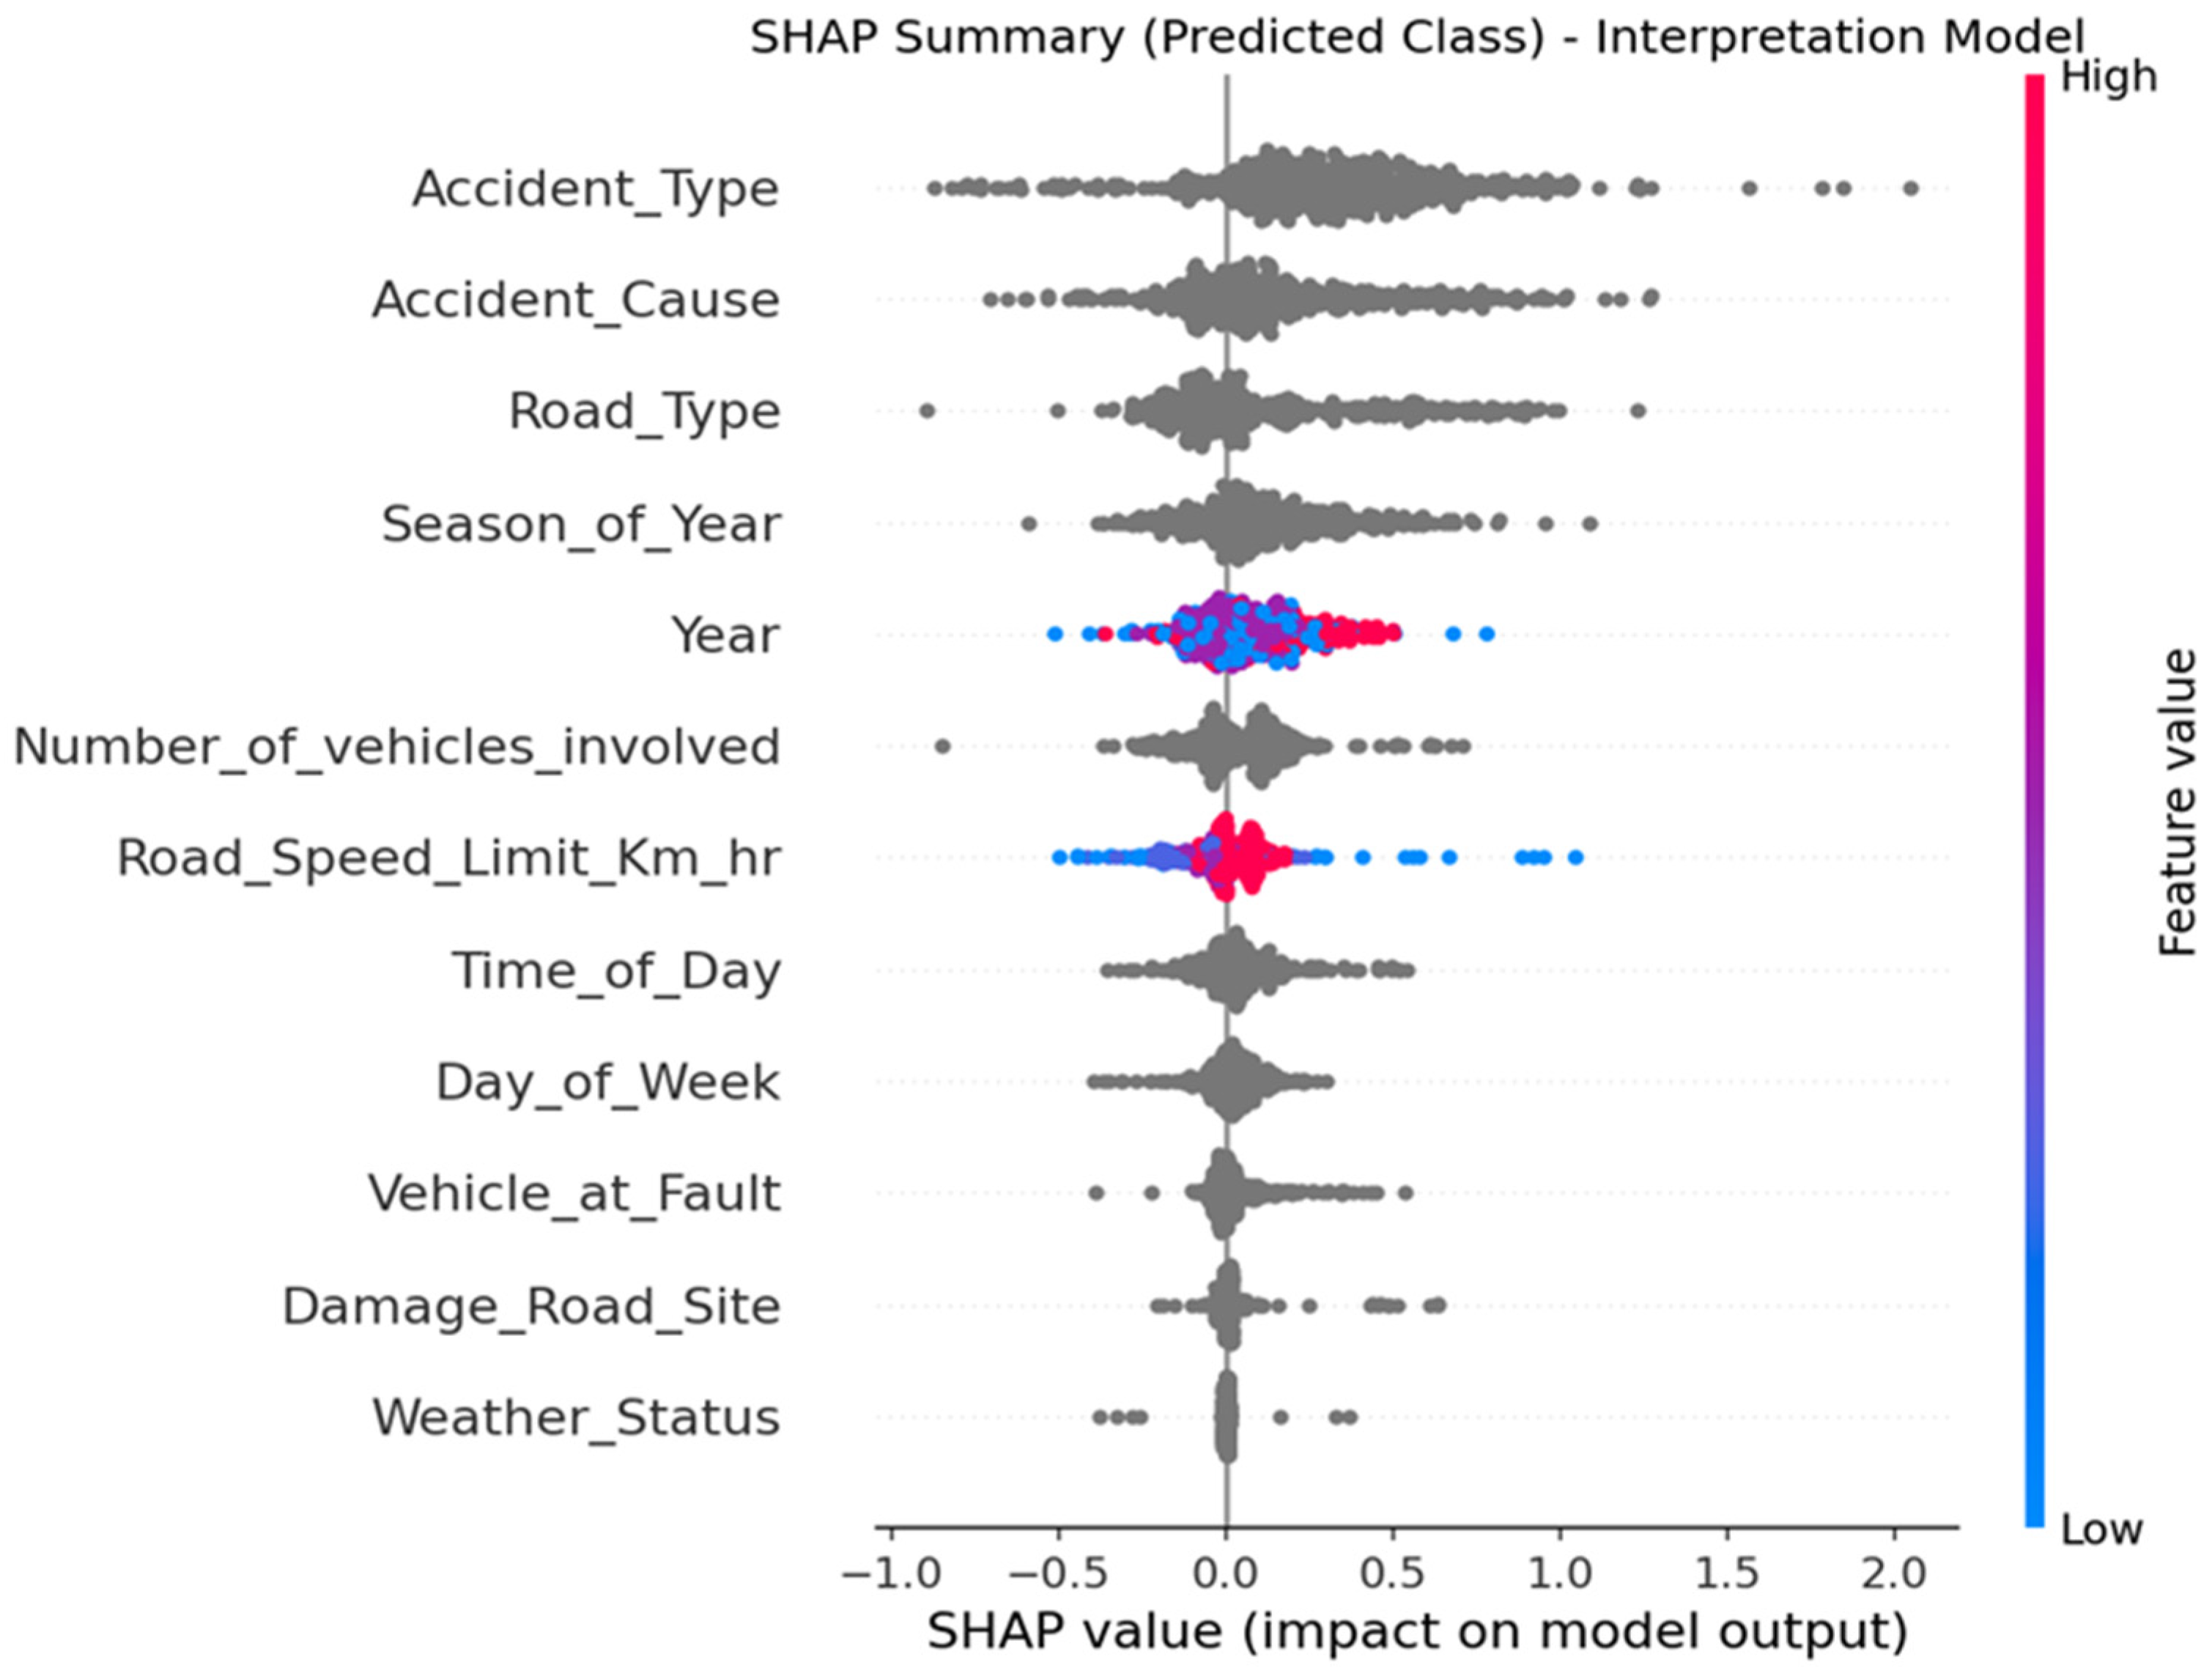
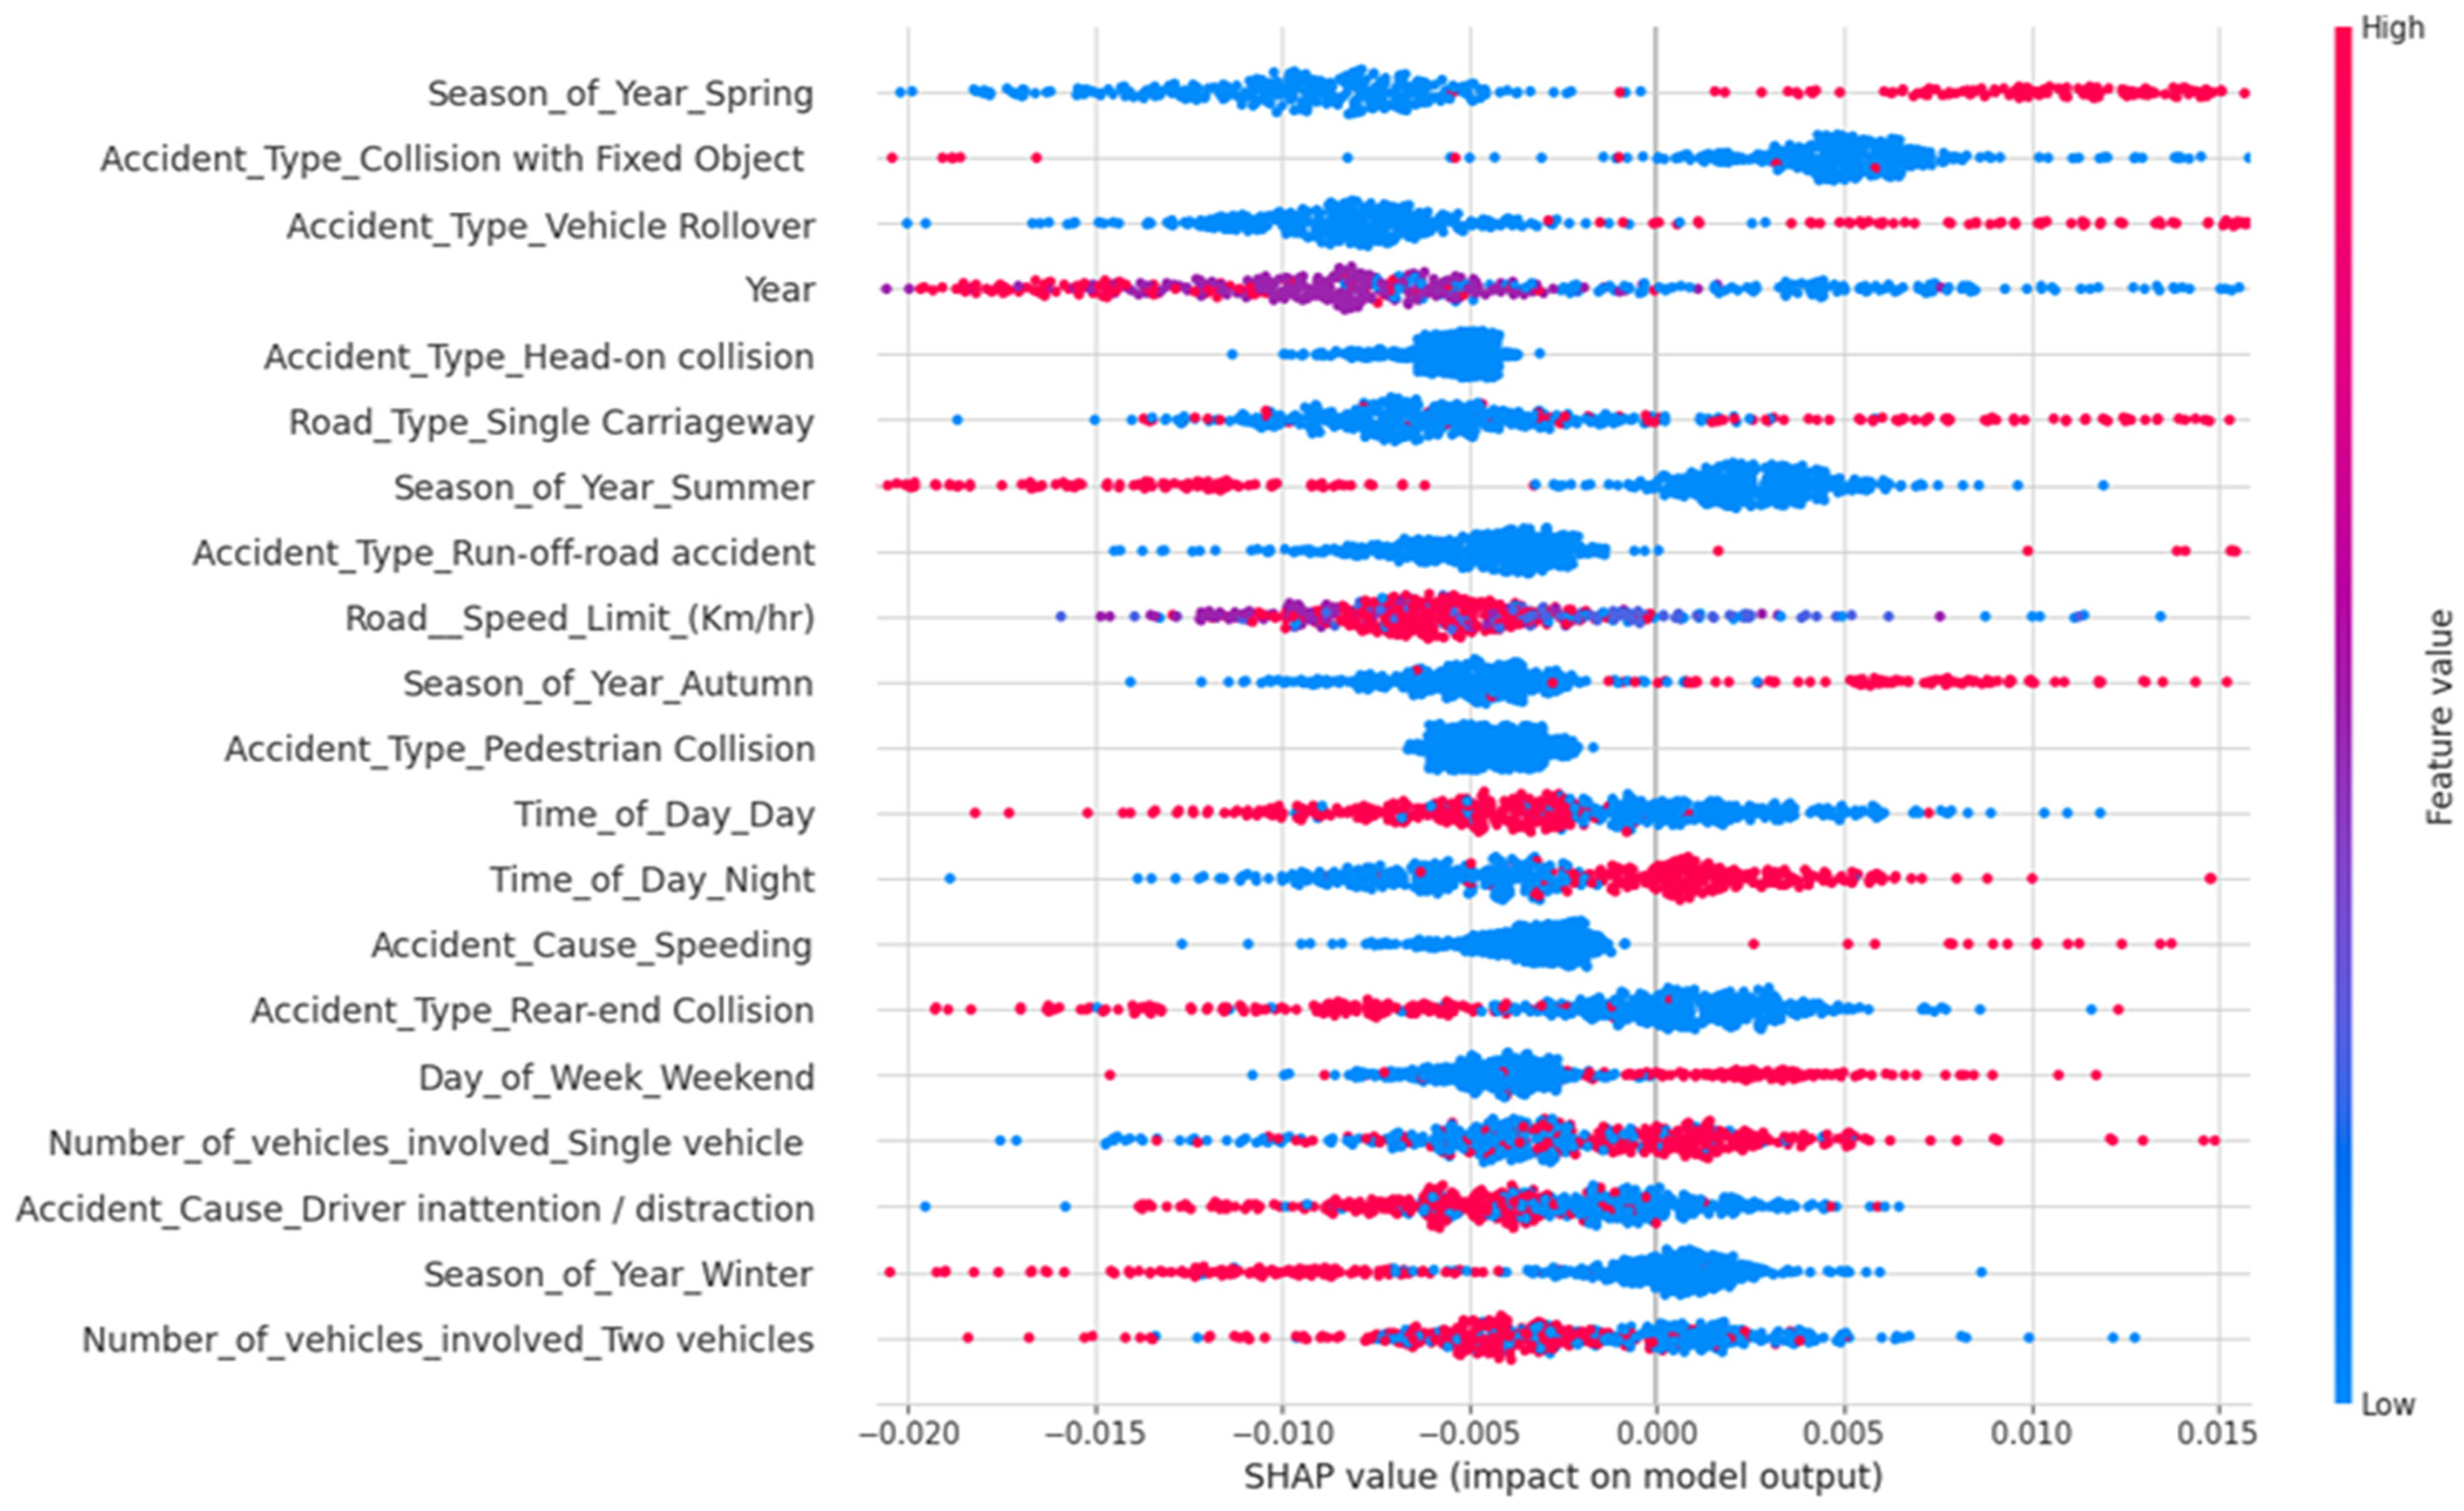
Additional analyses were conducted to interpret how the model reached its predictions and to identify the variables that most strongly influenced crash severity outcomes. To identify the most influential variables in the interpretation model, permutation importance and SHAP global importance analyses were performed and the results are shown in Figure 9 and Figure 10, respectively. Both methods produced similar rankings of variable importance. Accident type was the most influential predictor, followed by accident cause, road type, and season of the year. Variables such as weather status, damaged road site, and time of day had comparatively small effects on the model output. To further examine how feature values affect the model output, SHAP summary plots (shown in Figure 11 and Figure 12) were generated for the main (parent) feature and most influential sub-features. Figure 11 represents the overall SHAP summary plot for main/parent features, with gray dots showing the individual crash observations, the horizontal position showing the SHAP value, and the y-axis representing the relative feature importance (higher implies greater feature importance). On the other hand, the SHAP plot in Figure 12 illustrates the most influential sub-features for crash injury severity, with the color scale/coding showing their relative importance, i.e., red implies higher feature contribution toward injury severity prediction and vice versa.
The SHAP summary plots indicate that accident type is the most influential variable affecting the model prediction, followed by accident cause, road type, season of the year, and year, while variables such as weather status and road-site damage have relatively minor effects. Positive SHAP values increase the probability of the predicted class, whereas negative values reduce it. The detailed feature-level analysis further shows that spring, summer, collisions with fixed objects, speeding, weekend crashes, night-time accidents, and single-vehicle accidents generally contribute positively to the model output. In contrast, vehicle rollovers, winter conditions, daytime accidents, lower road speed limits, and two-vehicle accidents tend to decrease the predicted outcome.
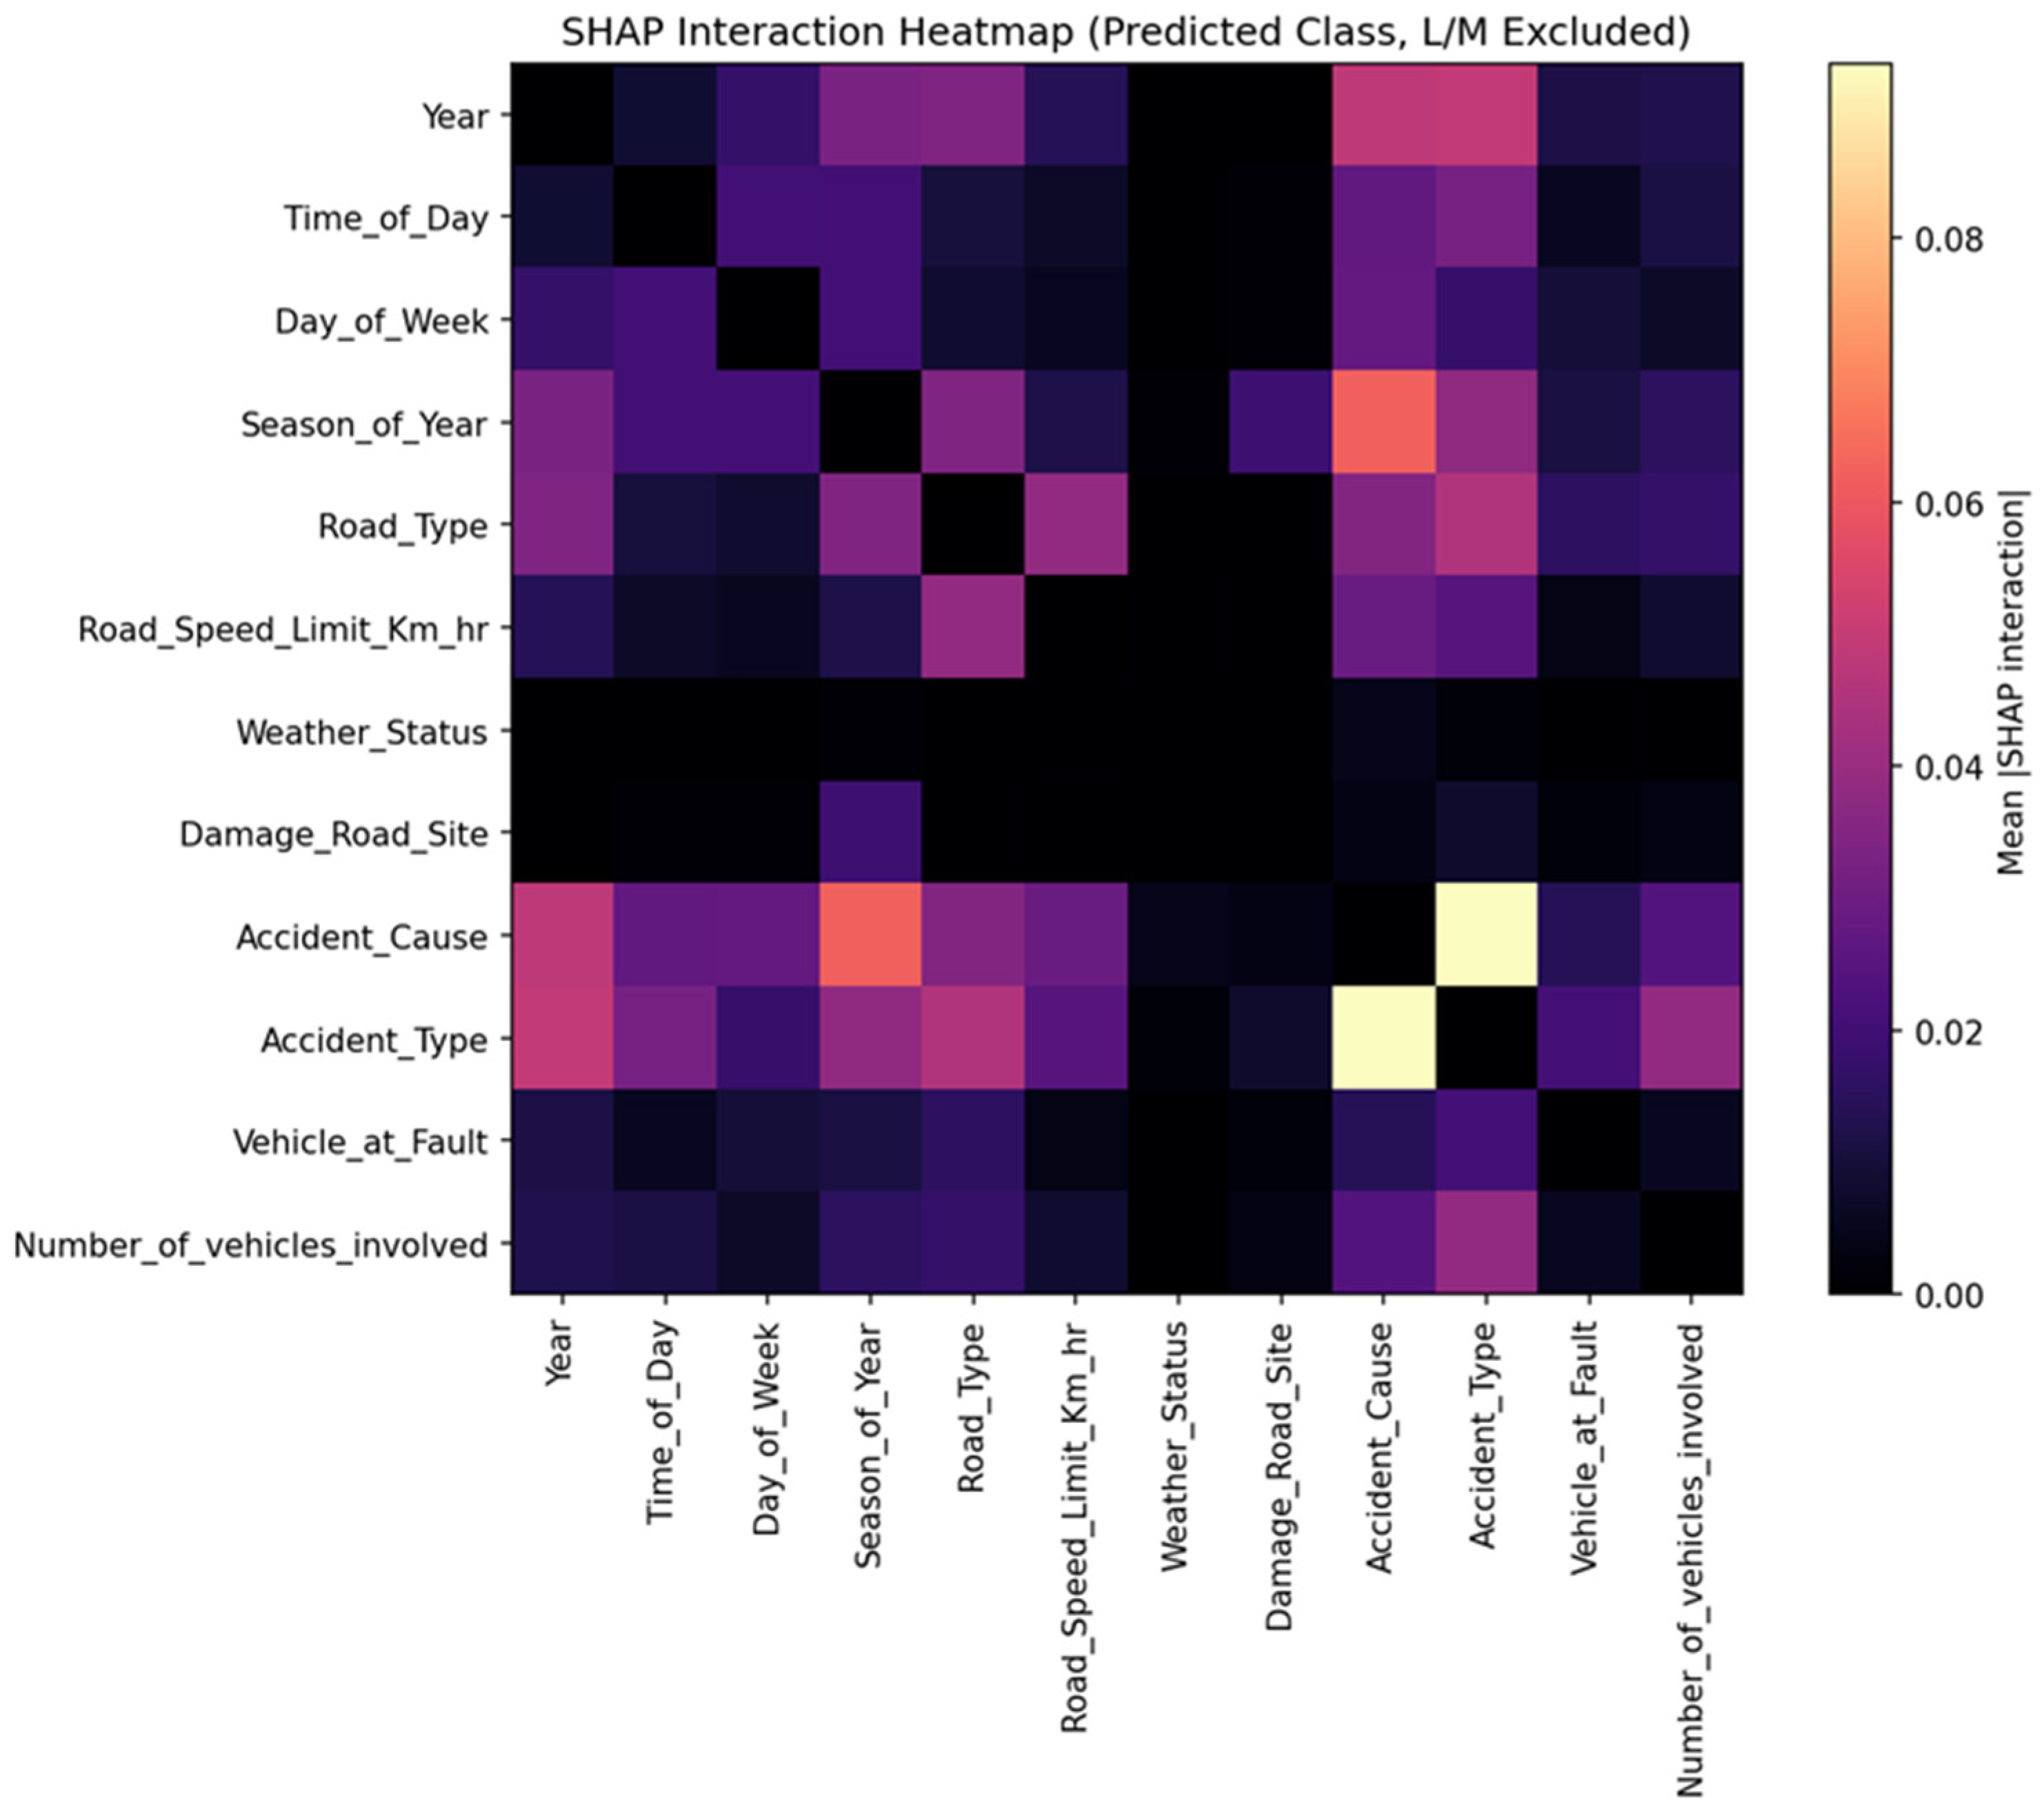
To investigate whether combinations of variables jointly affected crash severity predictions, SHAP interaction values were examined, and the results are presented in Figure 13.
The interaction heatmap indicates that the strongest interactions occur between accident type and accident cause, followed by interactions involving season of the year and road type. These results suggest that the effect of one variable on fatal-crash risk depends partly on the conditions represented by other variables.
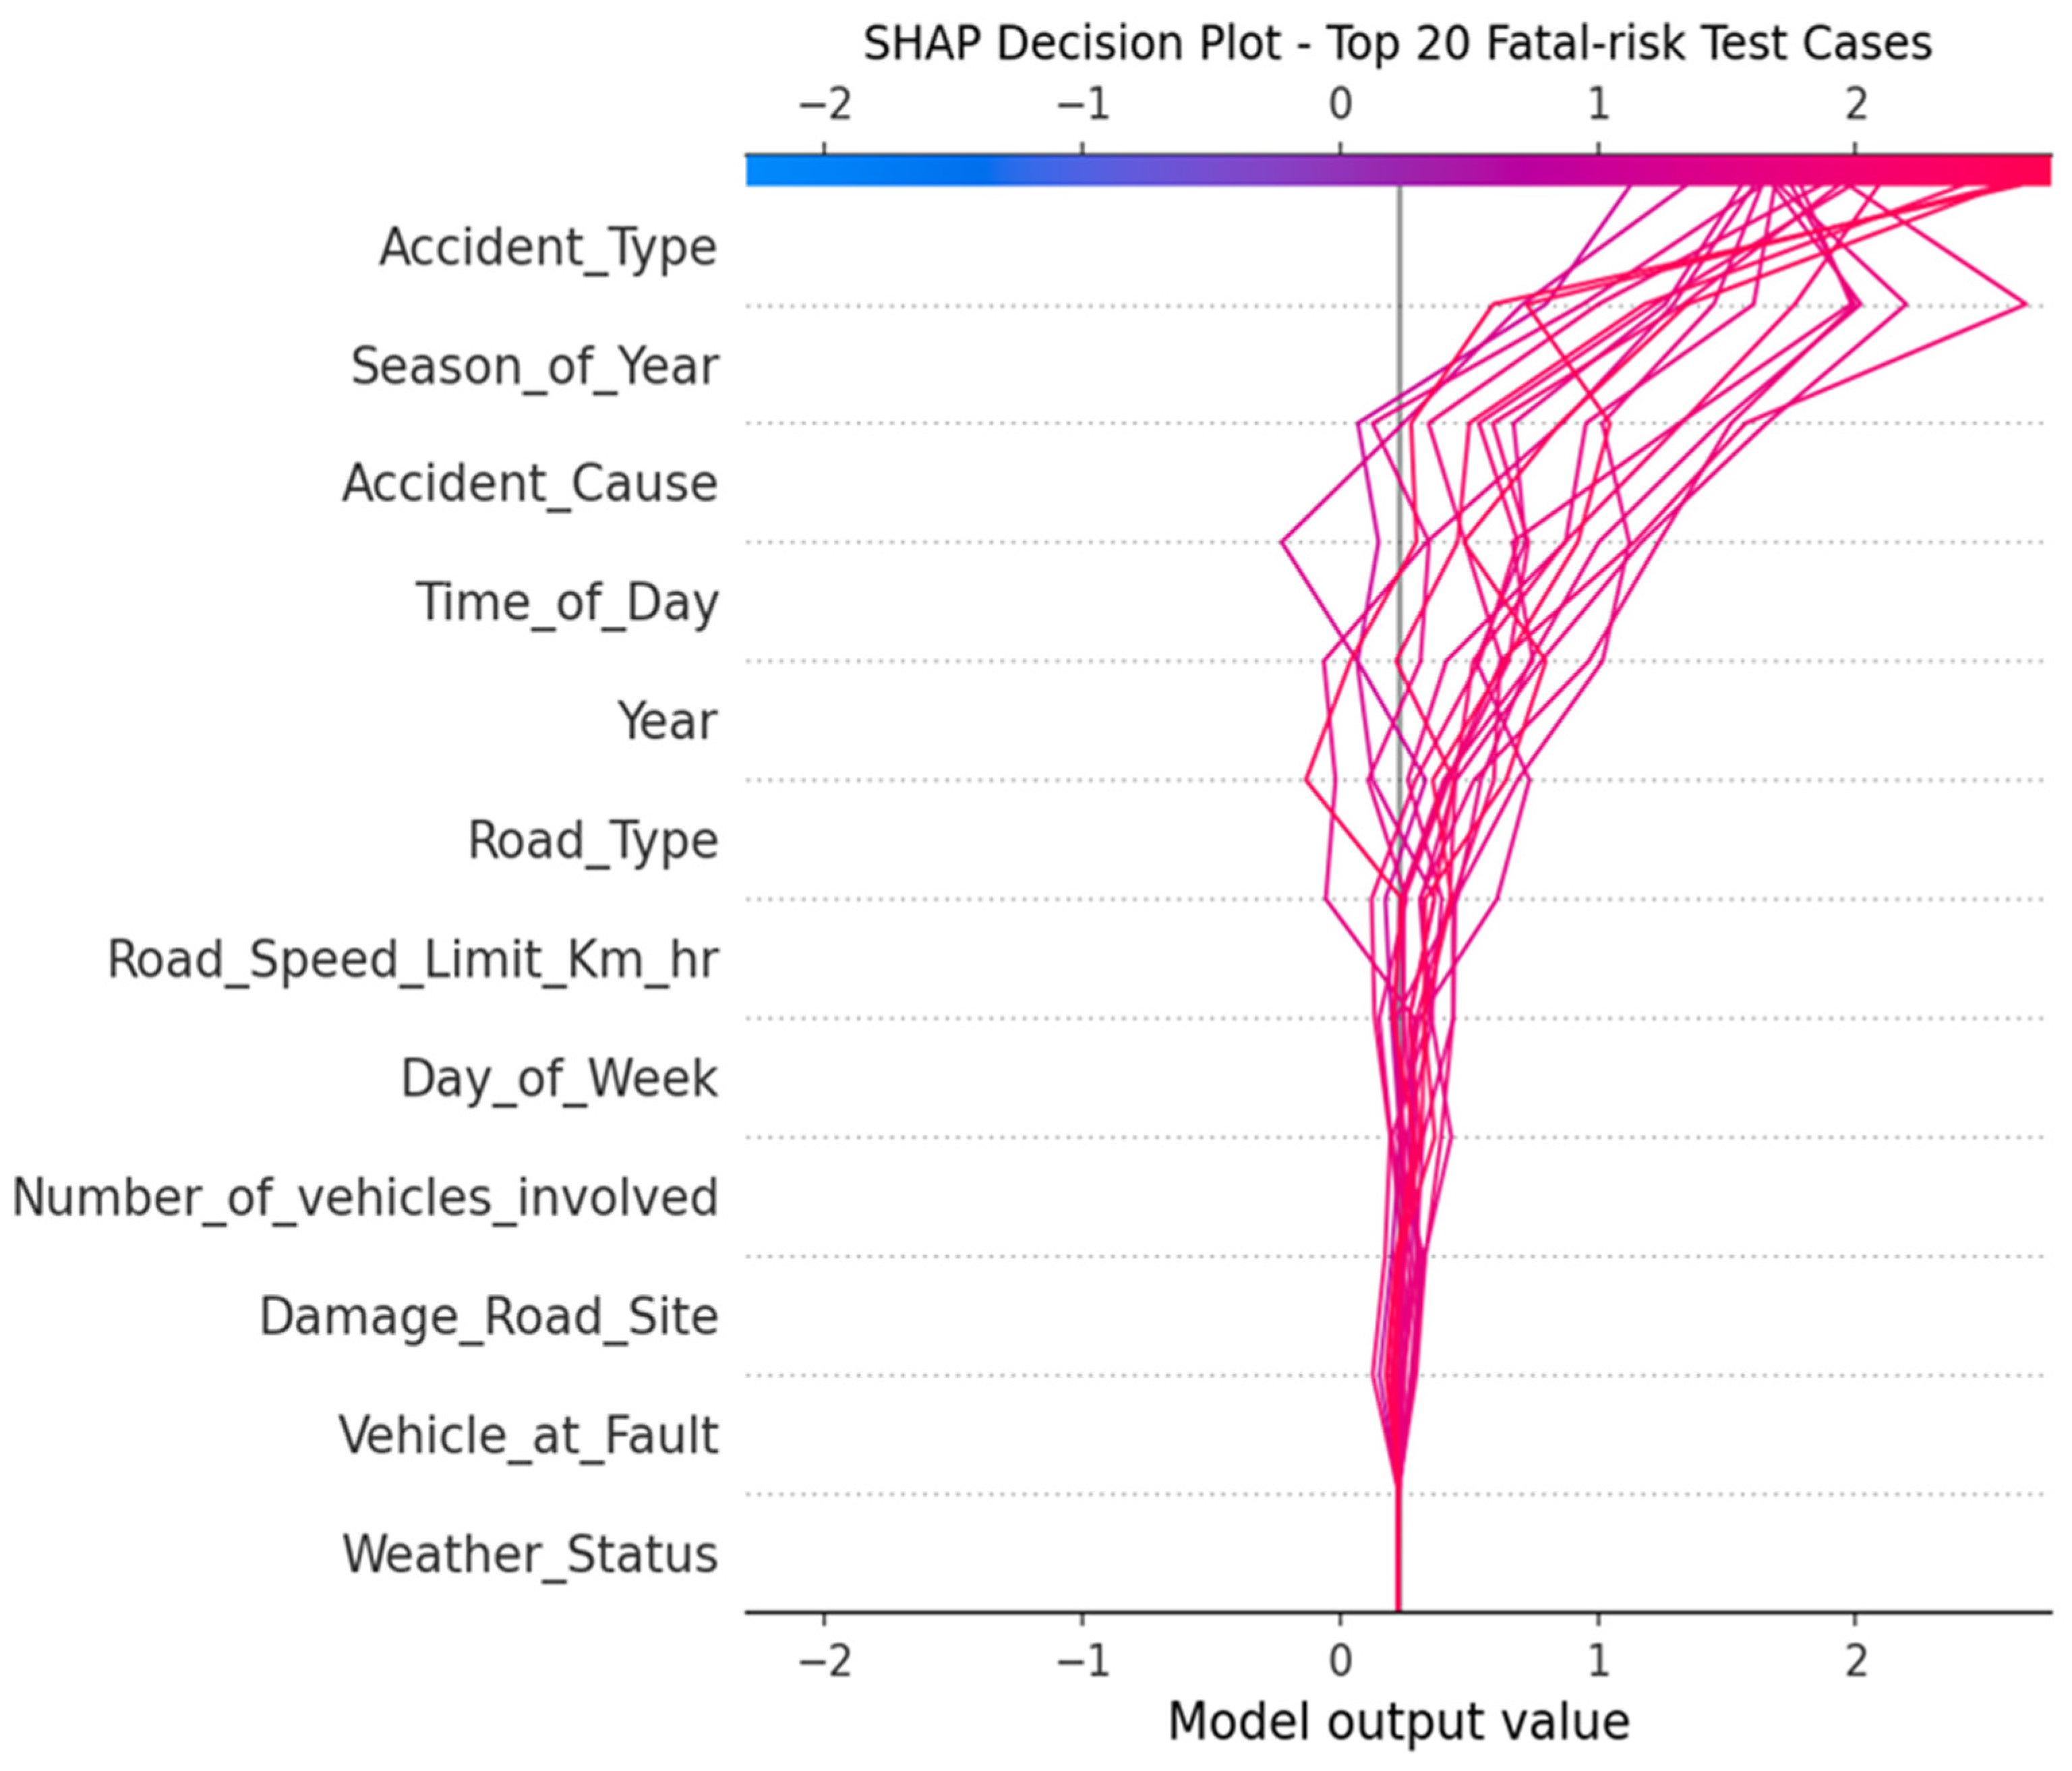
Local SHAP explanations were used to understand how the model generated high fatal-risk predictions for individual crash cases.
The decision plot (shown in Figure 14) shows that accident type consistently contributed the largest increase in fatal-risk predictions across the highest-risk cases, followed by season of the year and accident cause. Road type and time of day also increased the predicted fatal risk in several cases, whereas variables such as weather status, vehicle at fault, and damage to the road site had only a limited influence on the final model output.

4.2.2. Consistency of Crash Influencing Factors Between ML and DL Models

Table 7 presents an interpretive synthesis of the explainability analysis/outputs rather than a separate statistical test. The table was synthesized by comparing the ranking consistency of dominant risk factors across various models (RF, SVM, GBM, and FFNN), together with results derived from permutation feature importance, SHAP global importance, and SHAP summary plots. Factors consistently ranked highly across all methods for severity prediction were labeled as “Very High”, whereas other factors with stable and slightly lower importance were classified as “High” or “Moderate.” The results showed a general consistency between the machine learning models (RF, SVM, and GBM) and the deep learning model (FFNN) in identifying the main factors influencing crash severity, as shown in Table 7. All models agreed that crash type, crash cause, roadway type, and speed are the most important variables. However, some differences appeared in the ranking of factor importance. FFNN was more capable of capturing nonlinear relationships and complex interactions among variables and therefore provided a deeper interpretation of the factors associated with severe and fatal crashes. In contrast, the machine learning models, especially SVM, focused more on direct factors such as fatigue and speed. GBM showed a strong ability to detect interactions among multiple factors at the same time, such as the relationship between head-on collisions and high speed. This explains its higher ROC-AUC value. Random Forest, on the other hand, produced more stable and interpretable results, particularly regarding tire blowouts and distraction. The interpretability analyses revealed that fatal crashes are strongly influenced by speed-limit violations, reflecting that high travel speed is an important indicator of fatal and severe outcomes in the model. Overall, factors including speeding, high-speed road environments, and head-on collisions showed consistent and strong positive contributions in the fatal-crash class across various methods.

5. Discussion and Policy Implications

The results of this study demonstrate that machine learning and deep learning modeling frameworks can be used for efficient prediction of crash severity in the Qassim region. All the models achieve accuracy values above 0.90, demonstrating their robustness and efficacy. The results revealed that many factors, such as crash cause, type, driver behavior, and roadway characteristics, influence crash severity. Crash cause and type are among the primary variables that affect crash severity. Further, fatal and severe injuries were often observed to be associated with specific crash types, including head-on collisions, collisions with fixed objects, and vehicle rollovers. Similarly, the likelihood of fatal crashes is increased by driver fatigue, tire blowouts, improper passing, and speeding. These variable factors do not operate independently, as suggested by the SHAP analysis. Instead, crash severity becomes much higher when several high-risk factors occur simultaneously. For example, the combination of a head-on collision with speeding or improper passing produced the highest fatal-crash risk. The results also indicate that roadway characteristics amplify the effect of unsafe driver behavior. High-speed highways and undivided roads were more strongly associated with fatal crashes than urban roads or lower-speed facilities, suggesting that road design can intensify the consequences of unsafe driving. Although environmental and weather-related variables were included in the models, their influence was considerably lower than that of human and roadway factors.
The findings of this study are generally consistent with previous research on traffic crash severity. Like in [24], the current study found that head-on collisions, high-speed roads, and unsafe driver behavior are among the most important contributors to fatal crashes. The strong effect of speeding and driver distraction also agrees with the conclusions of the authors in [22], while the importance of driver fatigue and improper passing is consistent with the authors earlier research [23]. The present results also support the global review conducted by the authors of [21], which concluded that speed and risky driver behavior are the primary causes of severe and fatal crashes. Furthermore, the importance of roadway type and speed limit identified in this study agrees with prior research [26] and is also in line with the findings of another study [28] in Saudi Arabia. From a methodological perspective, the results support earlier studies by [32], [25], and [31], which demonstrated that machine learning and deep learning models outperform traditional statistical approaches because they can better capture nonlinear relationships and interactions among crash-related variables. This research compared many ML and DL models utilizing the same regional datasets and found that all the models identify the same influential factors. Therefore, confidence in the results’ reliability is significantly increased.
These research findings are of great importance to the transportation policy department and traffic safety management in Saudi Arabia. Model-interpretation results consistently identified that certain crash types (head-on collision) and crash causes, road speed limit, highway type, driver fatigue, distraction, and tire blowout are the most influential predictors of fatal and severe injury crashes. Specifically, head-on collisions and speed-related variables were consistently identified as the most significant severity factors across the models, while other variables such as environmental and weather conditions demonstrated relatively lower influence. Rules can be devised to increase the penalties for speed violations, variable speed limits in areas of severe crash histories, and the use of speed cameras. The findings also highlighted the necessity to enhance roadway design and roads with recurrent head-on collisions. This recommendation is supported by the importance of accident type and road type in the SHAP and permutation importance analysis, where head-on collisions and single-carriageway roads were associated with higher crash severity. The remedial action includes wider shoulders, improved warning signs, median barrier installation, and no-passing additional zones. Moreover, public awareness campaigns should be held to educate people about unsafe driving behavior, driver distraction, and fatigue. This recommendation is supported by the identified influence of driver-related crash causes, particularly driver inattention and distraction, on severe crash outcomes. Mechanical vehicle conditions should also be considered, as many severe and fatal crashes result from tire blowouts. Overall, the results indicate that the most efficient and suitable safety interventions are those directly aligned with the dominant risk factors identified by the descriptive statistical and ML interpretability analysis.

6. Conclusions

Crash severity analysis is an important domain in road safety as it helps to identify influential risk conditions and respective countermeasures. This research compared the predictive performance of RF, SVM, GBM, and FFNN for crash severity. Moreover, the main factors associated with severe crashes are identified using several interpretability techniques, including SHAP, permutation, and partial dependence plots. It is concluded that all four models attained high predictive performance with accuracy ranging from 0.94 to 0.96. The highest accuracy of 0.96 is achieved by the RF model, followed by FFNN with 0.95. Model predictive performance measured in terms of other evaluation indices including precision, recall, F1, ROC and AUC also demonstrated the efficacy and suitability of the proposed models. SHAP interpretation analysis showed that factors including roadway type, crash cause, and environmental parameters significantly influence the outcome of traffic crashes. In addition, head-on collisions, speeding, improper crossing, and crashes occurring on main highways were observed to significantly increase the incidence of fatal crashes. Other factors, such as road damage and weather conditions, have comparatively lower effects on crash severity.
The current research findings are of great importance to the transportation policy department and traffic safety management. The findings also highlighted the necessity to enhance roadway design and roads with recurrent head-on collisions. The remedial action includes wider shoulders, improved warning signs, median barrier installation, and additional no-passing zones. Finally, the prediction accuracy of the proposed models can help emergency response services to detect severe crashes and high-risk locations and to allocate resources in a timely manner. Despite the strong contributions of this study, some limitations should also be acknowledged. The available dataset lacks variables on traffic volume and driver demographics. Furthermore, it focused on a single geographic region (Qassim). Future studies may focus on incorporating multiple areas. Although the proposed framework achieved strong predictive performance under the adopted train–test procedure, future studies could expand this work by using stratified cross-validation to further assess model stability and generalizability. Validation of the proposed framework with other regions’ crash data can strengthen its general application.

Author Contributions

Conceptualization, S.A. and A.J.; methodology, S.A.; software, A.J.; validation, M.A. and F.A.; formal analysis, S.A.; investigation, S.A.; resources, M.A.; data curation, S.A.; writing—original draft preparation, S.A. and A.J.; writing—review and editing, M.A. and F.A.; visualization, F.A.; supervision, M.A.; project administration, M.A.; funding acquisition, M.A. and F.A. All authors have read and agreed to the published version of the manuscript.

Funding

The authors declare that no funds, grants, or other support were received from any organization during the preparation of this manuscript.

Institutional Review Board Statement

Not applicable.

Data Availability Statement

Data can be obtained from corresponding author upon reasonable request.

Acknowledgments

The researchers would like to thank the Deanship of Graduate Studies and Scientific Research at Qassim University for financial support (project code QU-APC-2026).

Conflicts of Interest

The authors declare no conflicts of interest.

References

  1. Ahmed, S.K.; Mohammed, M.G.; Abdulqadir, S.O.; El-Kader, R.G.A.; El-Shall, N.A.; Chandran, D.; Rehman, M.E.U.; Dhama, K. Road Traffic Accidental Injuries and Deaths: A Neglected Global Health Issue. Health Sci. Rep. 2023, 6, e1240. [Google Scholar] [CrossRef] [Scilit] [PubMed]
  2. World Health Organization. Global Status Report on Road Safety 2023: Country and Territory Profiles; WHO: Geneva, Switzerland, 2024. [Google Scholar]
  3. Jamal, A.; Zahid, M.; Tauhidur Rahman, M.; Al-Ahmadi, H.M.; Almoshaogeh, M.; Farooq, D.; Ahmad, M. Injury Severity Prediction of Traffic Crashes with Ensemble Machine Learning Techniques: A Comparative Study. Int. J. Inj. Control Saf. Promot. 2021, 28, 408–427. [Google Scholar] [CrossRef] [Scilit] [PubMed]
  4. Alshammari, T.O. Future Vision for Improving Riyadh City to Become a Smart Mobility City. Nat. Vol. Essent. Oils 2021, 8, 398–417. [Google Scholar]
  5. Akin, D.; Sisiopiku, V.P.; Alateah, A.H.; Almonbhi, A.O.; Al-Tholaia, M.M.H.; Al-Sodani, K.A.A. Identifying Causes of Traffic Crashes Associated with Driver Behavior Using Supervised Machine Learning Methods: Case of Highway 15 in Saudi Arabia. Sustainability 2022, 14, 16654. [Google Scholar] [CrossRef] [Scilit]
  6. Rahman, M.M.; Islam, M.K.; Al-Shayeb, A.; Arifuzzaman, M. Towards Sustainable Road Safety in Saudi Arabia: Exploring Traffic Accident Causes Associated with Driving Behavior Using a Bayesian Belief Network. Sustainability 2022, 14, 6315. [Google Scholar] [CrossRef] [Scilit]
  7. Jamal, A.; Rahman, M.T.; Al-Ahmadi, H.M.; Mansoor, U. The Dilemma of Road Safety in the Eastern Province of Saudi Arabia: Consequences and Prevention Strategies. Int. J. Environ. Res. Public Health 2020, 17, 157. [Google Scholar]
  8. Jamal, A.; Mahmood, T.; Riaz, M.; Al-Ahmadi, H.M. GLM-Based Flexible Monitoring Methods: An Application to Real-Time Highway Safety Surveillance. Symmetry 2021, 13, 362. [Google Scholar] [CrossRef] [Scilit]
  9. Al-Ahmadi, H.M.; Jamal, A.; Ahmed, T.; Rahman, M.T.; Reza, I.; Farooq, D. Calibrating the Highway Safety Manual Predictive Models for Multilane Rural Highway Segments in Saudi Arabia. Arab. J. Sci. Eng. 2021, 46, 11471–11485. [Google Scholar] [CrossRef] [Scilit]
  10. Abdulrahman, R.; Almoshaogeh, M.; Haider, H.; Alharbi, F.; Jamal, A. Development and Application of a Risk Analysis Methodology for Road Traffic Accidents. Alex. Eng. J. 2025, 111, 293–305. [Google Scholar] [CrossRef] [Scilit]
  11. Lord, D.; Mannering, F. The Statistical Analysis of Crash-Frequency Data: A Review and Assessment of Methodological Alternatives. Transp. Res. Part A Policy Pract. 2010, 44, 291–305. [Google Scholar] [CrossRef] [Scilit]
  12. Mannering, F.; Bhat, C.R.; Shankar, V.; Abdel-Aty, M. Big Data, Traditional Data and the Tradeoffs between Prediction and Causality in Highway-Safety Analysis. Anal. Methods Accid. Res. 2020, 25, 100113. [Google Scholar] [CrossRef] [Scilit]
  13. Pervez, A.; Jamal, A. Exploring E-Scooter Risk Factors Based on Interpretable Machine Learning Framework; Elsevier: Amsterdam, The Netherlands, 2025; Volume 94, pp. 128–140. [Google Scholar]
  14. Ma, X.; Dai, Z.; He, Z.; Ma, J.; Wang, Y.; Wang, Y. Learning Traffic as Images: A Deep Convolutional Neural Network for Large-Scale Transportation Network Speed Prediction. Sensors 2017, 17, 818. [Google Scholar] [CrossRef] [Scilit] [PubMed]
  15. Zhang, J.; Li, Z.; Pu, Z.; Xu, C. Comparing Prediction Performance for Crash Injury Severity among Various Machine Learning and Statistical Methods. IEEE Access 2018, 6, 60079–60087. [Google Scholar] [CrossRef] [Scilit]
  16. Delen, D.; Sharda, R.; Bessonov, M. Identifying Significant Predictors of Injury Severity in Traffic Accidents Using a Series of Artificial Neural Networks. Accid. Anal. Prev. 2006, 38, 434–444. [Google Scholar] [CrossRef] [Scilit] [PubMed]
  17. Jamal, A.; Umer, W. Exploring the Injury Severity Risk Factors in Fatal Crashes with Neural Network. Int. J. Environ. Res. Public Health 2020, 17, 7466. [Google Scholar] [CrossRef] [Scilit] [PubMed]
  18. Chen, T.; Guestrin, C. XGBoost: A Scalable Tree Boosting System. In Proceedings of the 22nd ACM SIGKDD International Conference on Knowledge Discovery and Data Mining; ACM: San Francisco, CA, USA, 2016; pp. 785–794. [Google Scholar]
  19. Dong, S.; Khattak, A.; Ullah, I.; Zhou, J.; Hussain, A. Predicting and Analyzing Road Traffic Injury Severity Using Boosting-Based Ensemble Learning Models with SHAPley Additive exPlanations. Int. J. Environ. Res. Public Health 2022, 19, 2925. [Google Scholar] [CrossRef] [Scilit] [PubMed]
  20. Friedman, J.H. Greedy Function Approximation: A Gradient Boosting Machine. Ann. Stat. 2001, 29, 1189–1232. [Google Scholar] [CrossRef] [Scilit]
  21. Ditcharoen, A.; Chhour, B.; Traikunwaranon, T.; Aphivongpanya, N.; Maneerat, K.; Ammarapala, V. Road Traffic Accidents Severity Factors: A Review Paper. In 2018 5th International Conference on Business and Industrial Research (ICBIR); IEEE: Bangkok, Thailand, 2018; pp. 339–343. [Google Scholar]
  22. Eboli, L.; Forciniti, C. The Severity of Traffic Crashes in Italy: An Explorative Analysis among Different Driving Circumstances. Sustainability 2020, 12, 856. [Google Scholar] [CrossRef] [Scilit]
  23. Paleti, R.; Eluru, N.; Bhat, C.R. Examining the Influence of Aggressive Driving Behavior on Driver Injury Severity in Traffic Crashes. Accid. Anal. Prev. 2010, 42, 1839–1854. [Google Scholar] [CrossRef] [Scilit] [PubMed]
  24. Zhang, J.; Lindsay, J.; Clarke, K.; Robbins, G.; Mao, Y. Factors Affecting the Severity of Motor Vehicle Traffic Crashes Involving Elderly Drivers in Ontario. Accid. Anal. Prev. 2000, 32, 117–125. [Google Scholar] [CrossRef] [Scilit] [PubMed]
  25. Dong, C.; Shao, C.; Li, J.; Xiong, Z. An Improved Deep Learning Model for Traffic Crash Prediction. J. Adv. Transp. 2018, 2018, 3869106. [Google Scholar] [CrossRef] [Scilit]
  26. Wen, X.; Xie, Y.; Wu, L.; Jiang, L. Quantifying and Comparing the Effects of Key Risk Factors on Various Types of Roadway Segment Crashes with LightGBM and SHAP. Accid. Anal. Prev. 2021, 159, 106261. [Google Scholar] [CrossRef] [Scilit] [PubMed]
  27. Rahim, M.A.; Hassan, H.M. A Deep Learning Based Traffic Crash Severity Prediction Framework. Accid. Anal. Prev. 2021, 154, 106090. [Google Scholar] [CrossRef] [Scilit] [PubMed]
  28. Alshehri, A.H.; Alanazi, F.; Yosri, A.M.; Yasir, M. Comparing Fatal Crash Risk Factors by Age and Crash Type by Using Machine Learning Techniques. PLoS ONE 2024, 19, e0302171. [Google Scholar] [CrossRef] [Scilit] [PubMed]
  29. Zhang, H.; Qu, W.; Ge, Y.; Sun, X.; Zhang, K. Effect of Personality Traits, Age and Sex on Aggressive Driving: Psychometric Adaptation of the Driver Aggression Indicators Scale in China. Accid. Anal. Prev. 2017, 103, 29–36. [Google Scholar] [CrossRef] [Scilit] [PubMed]
  30. Ali, F.; Ali, A.; Imran, M.; Naqvi, R.A.; Siddiqi, M.H.; Kwak, K.-S. Traffic Accident Detection and Condition Analysis Based on Social Networking Data. Accid. Anal. Prev. 2021, 151, 105973. [Google Scholar] [CrossRef] [Scilit] [PubMed]
  31. Huang, T.; Wang, S.; Sharma, A. Highway Crash Detection and Risk Estimation Using Deep Learning. Accid. Anal. Prev. 2020, 135, 105392. [Google Scholar] [CrossRef] [Scilit] [PubMed]
  32. Wen, X.; Xie, Y.; Jiang, L.; Pu, Z.; Ge, T. Applications of Machine Learning Methods in Traffic Crash Severity Modelling: Current Status and Future Directions. Transp. Rev. 2021, 41, 855–879. [Google Scholar] [CrossRef] [Scilit]
  33. Sattar, K.; Chikh Oughali, F.; Assi, K.; Ratrout, N.; Jamal, A.; Masiur Rahman, S. Transparent Deep Machine Learning Framework for Predicting Traffic Crash Severity. Neural Comput. Appl. 2023, 35, 1535–1547. [Google Scholar] [CrossRef] [Scilit]
  34. Abdel-Aty, M.; Uddin, N.; Pande, A.; Abdalla, M.F.; Hsia, L. Predicting Freeway Crashes from Loop Detector Data by Matched Case-Control Logistic Regression. Transp. Res. Rec. J. Transp. Res. Board 2004, 1897, 88–95. [Google Scholar] [CrossRef] [Scilit]
  35. Hossain, M.; Muromachi, Y. Understanding Crash Mechanism on Urban Expressways Using High-Resolution Traffic Data. Accid. Anal. Prev. 2013, 57, 17–29. [Google Scholar] [CrossRef] [Scilit] [PubMed]
  36. Wang, L.; Abdel-Aty, M.; Lee, J.; Shi, Q. Analysis of Real-Time Crash Risk for Expressway Ramps Using Traffic, Geometric, Trip Generation, and Socio-Demographic Predictors. Accid. Anal. Prev. 2019, 122, 378–384. [Google Scholar] [CrossRef] [Scilit] [PubMed]
  37. Chen, S.; Wang, W. Decision Tree Learning for Freeway Automatic Incident Detection. Expert Syst. Appl. 2009, 36, 4101–4105. [Google Scholar] [CrossRef] [Scilit]
  38. Agarwal, S.; Kachroo, P.; Regentova, E. A Hybrid Model Using Logistic Regression and Wavelet Transformation to Detect Traffic Incidents. IATSS Res. 2016, 40, 56–63. [Google Scholar] [CrossRef] [Scilit]
  39. Shao, Y.; Shi, X.; Zhang, Y.; Shiwakoti, N.; Xu, Y.; Ye, Z. Injury Severity Prediction and Exploration of Behavior-Cause Relationships in Automotive Crashes Using Natural Language Processing and Extreme Gradient Boosting; Elsevier: Amsterdam, The Netherlands, 2024; Volume 133, p. 108542. [Google Scholar]
  40. Zhang, Z.; Niu, Z.; Li, Y.; Ma, X.; Sun, S. Research on the Influence Factors of Accident Severity of New Energy Vehicles Based on Ensemble Learning. Front. Energy Res. 2023, 11, 1329688. [Google Scholar] [CrossRef] [Scilit]
  41. Bao, J.; Liu, P.; Ukkusuri, S.V. A Spatiotemporal Deep Learning Approach for Citywide Short-Term Crash Risk Prediction with Multi-Source Data. Accid. Anal. Prev. 2019, 122, 239–254. [Google Scholar] [CrossRef] [Scilit] [PubMed]
  42. Wenqi, L.; Dongyu, L.; Menghua, Y. A Model of Traffic Accident Prediction Based on Convolutional Neural Network. In Proceedings of the 2017 2nd IEEE International Conference on Intelligent Transportation Engineering (ICITE); IEEE: Singapore, 2017; pp. 198–202. [Google Scholar]
  43. Iranitalab, A.; Khattak, A. Comparison of Four Statistical and Machine Learning Methods for Crash Severity Prediction. Accid. Anal. Prev. 2017, 108, 27–36. [Google Scholar] [CrossRef] [Scilit] [PubMed]
  44. Almoshaogeh, M.; Abdulrehman, R.; Haider, H.; Alharbi, F.; Jamal, A.; Alarifi, S.; Shafiquzzaman, M. Traffic Accident Risk Assessment Framework for Qassim, Saudi Arabia: Evaluating the Impact of Speed Cameras. Appl. Sci. 2021, 11, 6682. [Google Scholar] [CrossRef] [Scilit]
  45. Savolainen, P.T.; Mannering, F.L.; Lord, D.; Quddus, M.A. The Statistical Analysis of Highway Crash-Injury Severities: A Review and Assessment of Methodological Alternatives. Accid. Anal. Prev. 2011, 43, 1666–1676. [Google Scholar] [CrossRef] [Scilit] [PubMed]
  46. Fiorentini, N.; Losa, M. Handling Imbalanced Data in Road Crash Severity Prediction by Machine Learning Algorithms. Infrastructures 2020, 5, 61. [Google Scholar] [CrossRef] [Scilit]
  47. Abdullah, D.M.; Abdulazeez, A.M. Machine Learning Applications Based on SVM Classification a Review. Qubahan Acad. J. 2021, 1, 81–90. [Google Scholar] [CrossRef] [Scilit]
  48. Sen, P.C.; Hajra, M.; Ghosh, M. Supervised Classification Algorithms in Machine Learning: A Survey and Review. In Emerging Technology in Modelling and Graphics; Mandal, J.K., Bhattacharya, D., Eds.; Advances in Intelligent Systems and Computing; Springer: Singapore, 2020; Volume 937, pp. 99–111. [Google Scholar]
  49. Yu, R.; Abdel-Aty, M. Utilizing Support Vector Machine in Real-Time Crash Risk Evaluation. Accid. Anal. Prev. 2013, 51, 252–259. [Google Scholar] [CrossRef] [Scilit] [PubMed]
  50. Cortes, C.; Vapnik, V. Support-Vector Networks. Mach. Learn. 1995, 20, 273–297. [Google Scholar] [CrossRef] [Scilit]
  51. Schölkopf, B.; Smola, A.J. Learning with Kernels: Support Vector Machines, Regularization, Optimization, and Beyond; MIT Press: Cambridge, MA, USA, 2002. [Google Scholar]
  52. Breiman, L. Random Forests. Mach. Learn. 2001, 45, 5–32. [Google Scholar] [CrossRef] [Scilit]
  53. Breiman, L. Bagging Predictors. Mach. Learn. 1996, 24, 123–140. [Google Scholar] [CrossRef] [Scilit]
  54. Pande, A.; Abdel-Aty, M. Assessment of Freeway Traffic Parameters Leading to Lane-Change Related Collisions. Accid. Anal. Prev. 2006, 38, 936–948. [Google Scholar] [CrossRef] [Scilit] [PubMed]
  55. Ke, G.; Meng, Q.; Finley, T.; Wang, T.; Chen, W.; Ma, W.; Ye, Q.; Liu, T.-Y. Lightgbm: A Highly Efficient Gradient Boosting Decision Tree. Adv. Neural Inf. Process. Syst. 2017, 30, 3146–3154. [Google Scholar]
  56. Prokhorenkova, L.; Gusev, G.; Vorobev, A.; Dorogush, A.V.; Gulin, A. CatBoost: Unbiased Boosting with Categorical Features. Adv. Neural Inf. Process. Syst. 2018, 31, 6638–6648. [Google Scholar]
  57. Basheer, I.A.; Hajmeer, M. Artificial Neural Networks: Fundamentals, Computing, Design, and Application. J. Microbiol. Methods 2000, 43, 3–31. [Google Scholar] [CrossRef] [Scilit] [PubMed]
  58. Svozil, D.; Kvasnicka, V.; Pospichal, J. Introduction to Multi-Layer Feed-Forward Neural Networks. Chemom. Intell. Lab. Syst. 1997, 39, 43–62. [Google Scholar] [CrossRef] [Scilit]
  59. Jamal, A.; Reza, I.; Shafiullah, M. Modeling Retroreflectivity Degradation of Traffic Signs Using Artificial Neural Networks. IATSS Res. 2022, 46, 499–514. [Google Scholar] [CrossRef] [Scilit]
  60. Hornik, K.; Stinchcombe, M.; White, H. Multilayer Feedforward Networks Are Universal Approximators; Elsevier: Amsterdam, The Netherlands, 1989; Volume 2, pp. 359–366. [Google Scholar]
Figure 1. Flow chart for methodology.
Vehicles 08 00151 g001
Figure 2. Qassim region: the study area selected for analysis.
Vehicles 08 00151 g002
Figure 3. Confusion matrices for crash severity classification for all models.
Vehicles 08 00151 g003
Figure 4. Combined ROC curves for comparative assessment of selected models.
Vehicles 08 00151 g004
Figure 5. FFNN ROC curves for individual severity classes.
Vehicles 08 00151 g005
Figure 6. RF ROC curves for individual severity classes.
Vehicles 08 00151 g006
Figure 7. SVM ROC curves for individual severity classes.
Vehicles 08 00151 g007
Figure 8. GBM ROC curves for individual severity classes.
Vehicles 08 00151 g008
Figure 9. Permutation importance analysis for severity risk factor identification.
Vehicles 08 00151 g009
Figure 10. SHAP global importance analysis for feature ranking.
Vehicles 08 00151 g010
Figure 11. SHAP summary plot showing the contribution of all main input across individual crash observation.
Vehicles 08 00151 g011
Figure 12. SHAP summary plot of the most influential sub-features illustrating the direction and magnitude of crash injury severity prediction.
Vehicles 08 00151 g012
Figure 13. SHAP interaction heatmap illustrating pairwise interaction among the main crash severity features.
Vehicles 08 00151 g013
Figure 14. SHAP decision plot for crash severity risk factor analysis.
Vehicles 08 00151 g014
Table 1. Research studies related to traffic crash severity prediction.
#Study ObjectiveData UsedMethodologyFactors Affecting SeverityKey FindingsReferences
1To examine factors influencing the severity of crashes involving elderly drivers in Ontario.Canadian Traffic Accident Information Databank (TRAID).Multivariate unconditional logistic regression.Age, sex, failing to yield, seat belt usage, snowy weather,
roads with high speed limits, and head-on collisions.
Older drivers and factors like not wearing seat belts and adverse weather significantly increase crash severity.[24]
2To analyze the impact of road, driver, and environmental characteristics on crash severity.Italian crash data from 2016.Logistic regression models.Distracted driving, speeding, and not maintaining a safe distance.Circumstances such as distracted driving and speeding significantly influence crash severity.[22]
3To evaluate the role of personal behavior, age, and sex in aggressive driving behaviors.Driver Aggression Indicators Scale (DAIS) applied to 422 participants in Beijing, China.Psychometric analysis and correlation studies.Personality traits, age, and sex.Neuroticism correlates with aggressive driving, and older age groups exhibit more hostile aggression.[29]
4To assess how aggressive driving moderates the effects of various variables on injury severity.National Motor Vehicle Crash Causation Study (NMVCCS).Accommodate moderating effect for aggressive driving and injury severity.Aggressive driving, seat belt usage, speed limits, and demographic variables.Aggressive driving behavior significantly increases injury severity; addressing it could reduce crash impacts.[23]
5To review factors influencing traffic accident severity globally.The literature on global traffic accidents.Review of logistic regression and other models.Speed, alcohol consumption, driver fatigue, and vehicle types.Speed and human behaviors are primary determinants of crash severity.[21]
6To compare the performance of MNL, NNC, SVM, and RF for crash severity prediction.2012–2015 Nebraska two-vehicle crash data.MNL, NNC, SVM, RF with K-means and Latent Class Clustering.Crash costs, data clustering effects.NNC outperformed others for severe crashes; K-means improved performance.[43]
7To develop a deep learning model with regression for traffic crash prediction.Tennessee roadway information management system and pavement management system.Deep learning with multivariate regression layer.Roadway geometry, traffic, and weather.Model improved prediction accuracy by 84.58% over baseline models.[25]
8To review ML applications in crash severity modeling.Survey on ML methods for crash severity.Survey of ML techniques like RF, SVM, ANNs.Imbalanced data, spatiotemporal correlations, and interpretability.ML outperforms traditional methods but lacks interpretability.[32]
9To assess the impact of speed cameras on accident reduction in Qassim, Saudi Arabia.Crash data from MOT in Riyadh, three years’ accident records (2017–2019).ArcGIS risk scoring and analysis.Speed, road conditions, driver behavior, environmental conditions.Speed cameras led to a 70% decline in total accidents counts, and 84% in injury crashes, and a complete absence of accidents with fatalities.[44]
10To develop a framework using deep learning to predict crash severity.Crash data from work zones in Louisiana (2014–2018).CNN with a customized loss function.Road, vehicle, and human-related features.Improved performance for fatal and injury crash prediction.[27]
11To detect traffic accidents using social networking data.Traffic information from social networks.FastText model and Bi-LSTM.Traffic-related sentiments, dynamic data.Achieved 97% accuracy for event detection.[30]
12Feasibility of using deep learning models to detect crashes and predict crash risk on highways.Sensor data from Interstate 235, Des Moines.Deep learning algorithms, including several model variants.Traffic volume, speed, and occupancy.Deep learning models have better crash detection performance than shallow models for crash detection.[31]
13To examine risk factors for crashes by age and type using machine learning.Dataset of traffic crashes in Jeddah, Saudi Arabia (2020–2022).Machine Learning algorithms (XGBoost, CatBoost, LightGBM, and RF).Driver demographics, crash location, weather, and vehicle type.LightGBM achieved the highest accuracy (95.4%), identifying specific age-related risks.[28]
14Analyze the effects of risk factors on crash frequency and types.Texas crash dataset (2015–2017).LightGBM and SHAP.Speed limits, area type, number of lanes, roadway classes, shoulder width, and type.Speed limits and narrow lanes are critical factors.[26]
Table 2. Key descriptive statistics of crash data.
AttributeDescriptionFrequency (n)Percentage (%)
Crash Severity Distribution1: PDO; 2: injury; 3: fatal1535/803/115 62.5/32.7/4.6
Accident year1: 2023; 2: 2024; 3: 2025683/1135/63527.9/46.3/25.8
Traffic Accident Types1: Rear-end collision; 2: collision with fixed object; 3: vehicle rollover; 4: sideswipe; 5: run-off-road accident; 6: collision with object; 7: vehicle fire; 8: collision with an animal; 9: head-on collision; 10: pedestrian collision; 11: intersection collision757/506/455/291/155/84/79/67/40/10/930.8/20.6/18.5/11.8/6.3/3.4/3.2/2.7/1.6/0.4/0.4
Traffic Accident Causes1: Driver inattention/distraction; 2: tire blowout; 3: driver fatigue; 4: speeding; 5: electrical/mechanical issues; 6: sudden swerve; 7: animal-related; 8: improper passing; 9: road obstruction; 10: insufficient safe distance; 11: sudden deceleration; 12: wet road surface; 13: wrong-way driving; 14: failure to yield; 15: traffic signal violation; 16: strong wind1182/278/226/152/132/118/68/67/65/49/37/36/16/14/8/548.1/11.3/9.2/6.2/5.3/4.8/2.7/2.7/2.6/1.9/1.5/1.4/0.6/0.5/0.3/0.2
Time of Day (ToD)1: Day; 2: night 1353/110055.1/44.9
Day of the Week (DoW)1: Weekday; 2: weekend 1818/635 74.1/25.9
Season of the Year1: Winter; 2: spring; 3: autumn; 4: summer659/661/619/51426.8/26.9/25.2/20.9
Road Type1: Main highway; 2: dual carriageway; 3: single carriageway1419/518/51657.9/21.1/21
Road Speed Limit1: 140; 2: 120; 3: 110; 4: 100; 5: 90; 6: 80 1411/365/493/60/87/8057.5/14.9/20.1/2.5/3.6/1.5
Weather Status1: Clear; 2: rainy; 3: cloudy; 4: windy2397/24/19/1397.7/1.0/0.8/0.5
Damage at the Site1: Undamaged road/site; 2: damaged road/site 2310/14394.1/5.9
Vehicle at Fault 1: Private vehicle driver; 2: truck drive; 3: bus driver; 4: motorcycle rider 1984/447/19/381/18.2/0.7/0.8/0.05
Number of Vehicles Involved1: Single vehicle; 2: two vehicles; 3: multi-vehicles 1208/1182/6349.3/48.2/2.5
Table 3. Hyperparameter tuning settings for selected models.
ModelKey ParameterSearch SpaceOptimized Value
SVMKernelRBF, linear, polynomialRBF
Kernel coefficient (gamma)0.001–10.01
Penalty parameter (c)0.1–10010
RFmax_depth5–3020
n_estimators100–500300
max_featureslog2, sqrt, or 0.3–1.0sqrt
min_samples_split2–102
GBMlearning_rate0.01–0.30.05
Number of boosting rounds 100–500250
max_depth2–63
Subsample rate 0.5–1.00.7
FFNNActivation functionReLU/sigmoid/tanhSigmoid
Hidden layers1–42
Neurons per layer32–256128
Epochs50–200150
OptimizerAdam/RMSprop/SGDAdam
Batch size16–12864
Table 4. Confusion matrix for evaluating the model’s performance.
Actual ConditionPredicted PositivePredicted Negative
PositiveTrue positives (TP)False negatives (FN)
NegativeFalse positives (FP)True negatives (TN)
Table 5. Performance evaluation of different models.
ModelAccuracyMacro F1-ScoreBalanced AccuracyMacro ROC-AUC
FFNN0.950.860.850.94
RF0.960.860.830.95
SVM0.940.840.850.96
GBM0.940.840.810.97
Table 6. Class-wise performance metrics for different models.
Classifier ModelSeverity ClassRecallPrecision F1-Score
SVMFatal0.620.710.67
Injury0.840.860.85
PDO0.970.960.96
Macro avg.0.810.840.83
RFFatal0.670.790.72
Injury0.890.910.90
PDO0.980.970.97
Macro avg.0.850.890.86
GBMFatal0.740.730.73
Injury0.870.850.86
PDO0.960.950.95
Macro avg.0.850.850.85
FFNNFatal0.710.760.73
Injury0.860.890.88
PDO0.970.960.97
Macro avg.0.850.870.86
Table 7. Consistency of crash influencing factors between different models.
Influential FactorRFSVMGBMFFNNLevel of AgreementInterpretive Comment
Crash TypeVery HighHighVery HighVery HighVery HighAll models agreed that crash type is the most influential factor, particularly head-on collisions and rollovers.
Crash CauseVery HighVery HighVery HighVery HighVery HighThe models agreed that distraction, speeding, fatigue, and improper passing are among the most important causes of increased crash severity.
Roadway TypeHighModerateHighVery HighHighFFNN and GBM assigned greater importance to highways compared with SVM.
Speed LimitVery HighVery HighHighHighVery HighAll models showed that increasing speed is associated with a higher probability of fatal crashes.
Head-on CollisionVery HighVery HighVery HighVery HighVery HighThis was the factor most strongly associated with fatal crashes in all models.
Improper PassingVery HighHighHighModerateModerate to HighFFNN was the most sensitive to this factor, indicating its ability to capture complex interactions.
Driver FatigueHighHighHighModerateHighThis appeared as an important factor, particularly in severe and fatal crashes.
Tire BlowoutHighHighModerateHighModerate to HighRF and FFNN assigned greater weight to this factor because of its association with fatal crashes on highways.
Distraction/InattentionVery HighHighVery HighVery HighVery HighThis was the most common factor across all crash severity levels, although it had less ability to distinguish between severe and non-severe crashes.
Weather and Environmental ConditionsLowLowModerateLowLowThese factors had less influence compared with human- and roadway-related factors.
Disclaimer/Publisher’s Note: The statements, opinions and data contained in all publications are solely those of the individual author(s) and contributor(s) and not of MDPI and/or the editor(s). MDPI and/or the editor(s) disclaim responsibility for any injury to people or property resulting from any ideas, methods, instructions or products referred to in the content.