1. Introduction
With the ongoing development of multi-network integration in urban and intercity transportation, the operation of urban rail transit lines has become increasingly vital for ensuring safe, reliable, and efficient travel. Many of these lines are now connected to airports to better meet passenger demand for travel to and from the airport. According to the latest reports (
https://news.sohu.com/a/850458675_121124399 (accessed on 1 July 2025)), 34 cities in China (including 5 in Hong Kong, Macao, and Taiwan) have already opened airport-connected urban rail transit lines, with 5 additional airport lines under construction. These airport lines not only enhance the convenience of airport transportation but also improve the efficiency and sustainability of the urban comprehensive transportation system.
Airports are typically located in peripheral areas of cities, and airport lines are often of considerable length. Applying conventional capacity allocation strategies to such lines would require excessive vehicle turnover and potentially lead to significant capacity waste. Moreover, flight departure and arrival times are not uniformly distributed, and different aircraft types vary in passenger capacity, resulting in unique spatiotemporal passenger demand patterns [
1]. Therefore, to balance operational efficiency and passenger service quality, it is essential to incorporate flight schedules and the specific passenger flow characteristics of airport lines when designing operational strategies.
Intermodal transport is a desirable direction for the development of rail transport [
2]. The integration of urban rail transit and air transport has attracted increasing research attention in recent years. For instance, Lu et al. [
3] developed a mathematical model for optimizing the timetable of Beijing’s Capital Airport Line, aiming to minimize the sum of passenger waiting time and train-kilometer costs, and solved it using a genetic algorithm. Zhao et al. [
4] applied three virtual train formation techniques to the Capital Airport Line, comparing different operational schemes based on service level and cost metrics. Wang et al. [
5] investigated freight and passenger coordination optimization for the Capital Airport Line to maximize operational profit, formulating a mixed-integer nonlinear programming model solved via linearization techniques and commercial solvers. These studies demonstrate that incorporating flight data and passenger flow characteristics into operational planning can significantly reduce waiting times and operational costs, thereby enhancing overall efficiency.
Given that the passenger flow characteristics at the airport differ from those of commuter traffic [
6], research on multimodal integration extends beyond rail–air connections to include other transport modes. For instance, Zhou et al. [
7] carried out an optimization of airport bus routes, and Salicru et al. [
8] optimized the airport bus timetable. Their shared objective is to cut down the travel time for passengers. Li [
9] developed a bilevel programming model for the optimization of the airport bus timetable. The model aims to minimize the transfer time between buses and flights while maximizing the coverage. Lu et al. [
10] optimized the airport bus timetable during the cultivation period, taking into account passengers’ dynamic airport choices under uncertain conditions. Recently, Zhou [
11] developed a simulation model based on Beijing Capital Airport operations to optimize bus schedules by analyzing passenger–vehicle interaction dynamics. To strengthen air–rail coordination, Wang et al. [
12] formulated a linear programming model for railway timetable optimization solved with commercial solvers. Ke et al. [
13] proposed a joint timetable optimization model for trains and flights using a spatiotemporal network framework, solved via Lagrangian relaxation methods.
For urban public transit lines with termini in suburban areas and central city segments, adopting flexible full-length and short-turning operations can better balance capacity supply and demand. In bus systems, Tirachini et al. [
14] analyzed optimal short-turning frequencies, vehicle capacities, and short-turning locations, while Cortes et al. [
15] integrated short-turning operations with vehicle deadheading strategies. In urban rail systems, Cheng et al. [
16] established a multi-objective 0-1 mixed integer programming model for train route optimization. By predefining the headways for short-turning train services and full-length train services, Zhang et al. [
17] proposed a mixed-integer nonlinear programming (MINLP) model for train scheduling that incorporates a short-turning strategy on an urban rail transit line with multiple depots. Duan et al. [
18] incorporated stop dwell times into passenger costs to develop a dual-objective integer programming model for “full-length & short-turning + fast-slow train” operations. Li et al. [
19] formulated a mixed-integer nonlinear programming model for joint optimization of vehicle headways and loop lengths, solved with a two-stage genetic algorithm, and He et al. [
20] also investigated a similar problem. Wang et al. [
21] constructed an integer programming model for metro loop optimization based on minimizing discrepancies between train capacity and passenger flow, subject to constraints on waiting time, headway, load factors, and fleet size, solved via linearization with commercial solvers. Yang et al. [
22] developed a dynamic passenger demand-oriented train scheduling problem that integrates a flexible short-turning strategy. While optimizing the train operation planning with full-length and short-turn routes, Zhou et al. [
23] also took into account the operation of virtual coupling trains. Recently, the joint optimization of integrating the all-stop, skip-stop, express, and short-turn trains is arising [
24,
25,
26]. Additionally, El-Demerdash and Mostafa [
27] introduced a simulation-based short-turning strategy, while Zhu et al. [
28] presented a robust collaborative optimization approach for train timetabling and short-turning strategies in urban rail transit systems. Notably, Sun et al. [
29] focused on Shanghai Metro’s airport line, developing a joint optimization model for full-length and short-turning configurations and frequencies under facility capacity constraints, solved using GAMS (General Algebraic Modeling System).
The existing literature highlights the unique operational challenges of airport lines in urban rail transit, attracting attention from both practitioners and researchers. While Sun et al. [
29] studied joint optimization of loop configurations and frequencies, their model primarily focused on frequency variables, leading to approximate passenger waiting time calculations and nonlinear formulations requiring heuristic or linearization techniques. With the imminent opening of Nanchang Metro Line 1’s airport extension line, which plans to adopt full-length and short-turning operations, this study proposes a novel modeling approach for joint optimization of loop configurations and timetables. Our method offers three key advantages: (1) precise calculation of passenger waiting times with strict adherence to capacity constraints; (2) implicit treatment of train numbers in loop operations as decision variables; and (3) formulation as a linear programming model, enabling direct computation of optimal solutions using commercial solvers.
The paper is organized as follows:
Section 2 formally defines the full-length and short-turning integrated planning and scheduling problem. Following this,
Section 3 introduces a novel joint optimization model that concurrently addresses operational cost minimization and heterogeneous passenger demand characteristics. The model’s practical applicability is demonstrated in
Section 4 via an in-depth case study on Nanchang Metro Line 1, where sensitivity analyses of critical parameters evaluate the effectiveness of various operational strategies.
Section 5 synthesizes key findings, discusses methodological limitations, and outlines promising research directions.
2. Problem Description
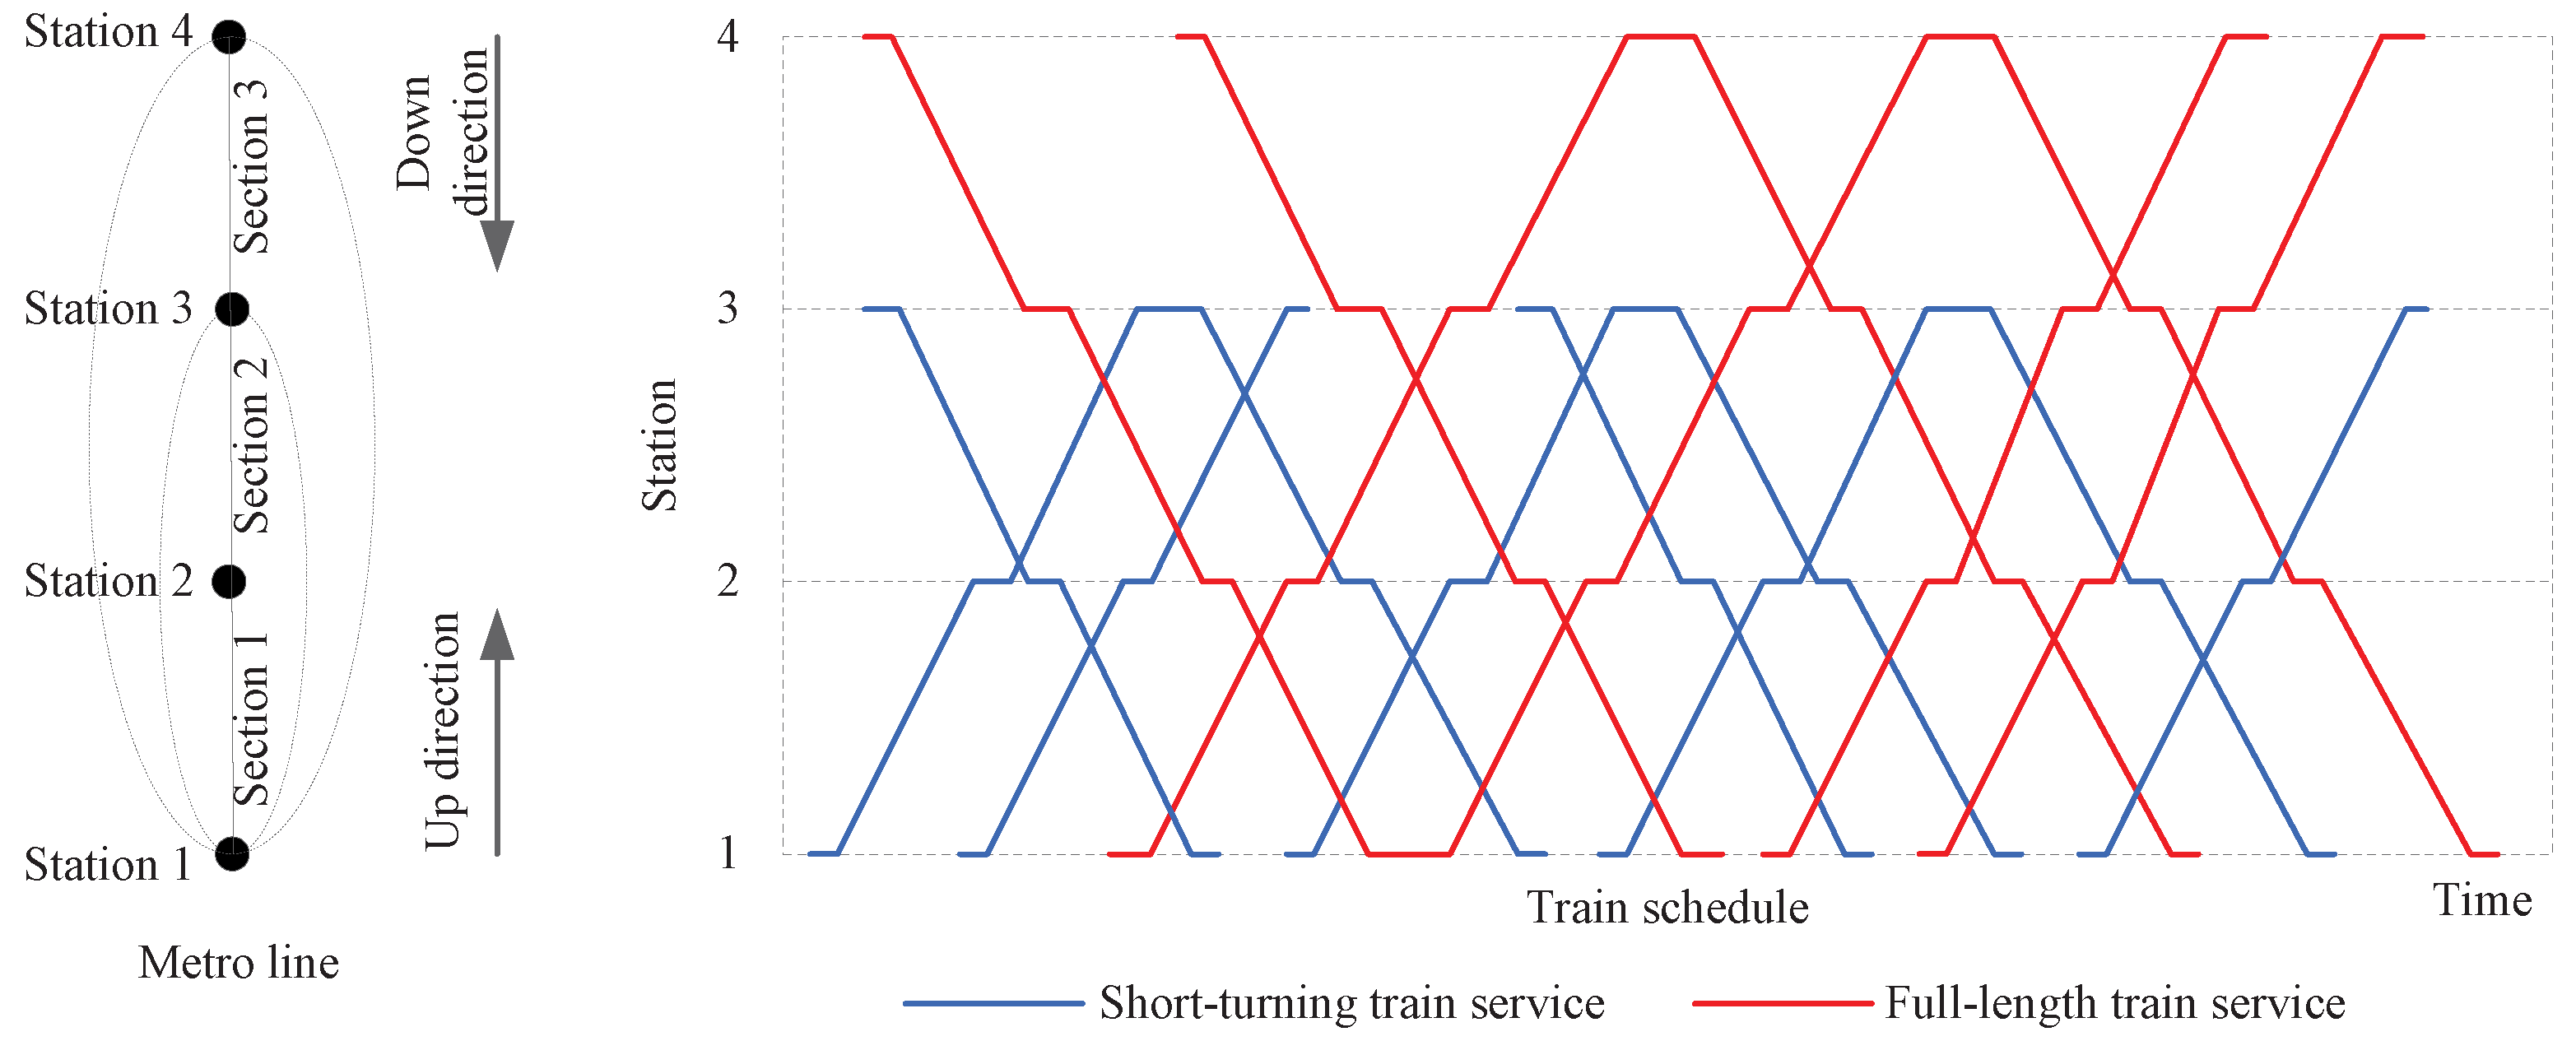
To clarify the problem under investigation, this paper presents a simplified illustration based on the actual conditions of Nanchang Airport Line. As shown in
Figure 1, the left side depicts a bidirectional metro line with four stations and three operational sections. Given the varying passenger demand across different sections, the system employs both full-length and short-turning operations. Specifically, trains operating between Station 1 and Station 3 constitute the short-turning service, while those running between Station 1 and Station 4 represent the full-length service. Additionally, stabling tracks are available at Stations 1, 3, and 4, enabling train scheduling with predetermined quantities. The dwell time at each station and the running time for each section are all predetermined and known parameters.
There are multiple potential train operation diagram plans for the full-length and short-turning routes, as shown in
Figure 1. The right side of
Figure 1 illustrates a specific arrangement where blue zigzag lines represent the short-turning train operation diagram, and red zigzag lines indicate the full-length train operation diagram. Different train operation plans yield varying impacts on line operational efficiency and passenger service quality. The objective of this study is to identify an optimal train operation diagram that balances capacity allocation with passenger service quality.
To achieve this goal, we first discretize the given time horizon at a specified granularity, and then describe the potential space-time trajectories (PSTTs) of trains at each discretized time point as demonstrated in
Figure 2. Within this framework, the joint optimization of the full-length and short-turning plan and schedule attempts to simultaneously address the following three sequential decision-making processes: (1) selecting which PSTTs to incorporate into the train operation plan; (2) determining whether these trajectories should be full-length or short-turning; (3) assigning passengers to the trains.
Regarding the first issue, the crucial factor to consider is the headway constraint. When it comes to the second issue, the continuous operation and turnover of trains are significant aspects to take into account. For the third issue, the capacity constraint is the key consideration. Consequently, we will incorporate these three issues into a unified formulation, which is expected to ensure that the system operates at its optimal level. The performance of the system is evaluated through two main indicators: operational cost and passenger waiting time.
4. Numerical Experiments
The aforementioned model is an integer linear programming (ILP) problem; thus, in the subsequent numerical experiments we use the commercial solver Gurobi to solve it. All experiments are based on the scenario of the Nanchang Metro Line 1 (Airport Line), and implemented in Python 3.11 and executed on a Windows 11 personal computer equipped with an Intel Core i7-13650HX CPU and 16 GB of RAM.
4.1. Parameter Setting
Nanchang Metro Line 1 officially commenced operations in December 2015. In February 2022, it was approved to initiate the construction of the east extension and the airport extension projects, which are planned to be fully connected by the end of June 2025. The entire line features 34 stations, spans a total length of 50.17 km, and is equipped with three depots: Changbei, Jiaoqiao, and Yaohu.
Figure 3 shows the specific route and station distribution.
The Nanchang Metro Airport Line plans to implement the mixed operations of full-length and short-turning routes. Specifically, the short-turning operation will run between Station 34 (Maqiu Station) and Station 8 (Jiaoqiao Station), while the full-length operation will run between Station 34 and Station 1 (Changbei Airport metro station). Other parameter settings are as follows: The arrival timestamps of passengers range from 06:40:30 to 10:40:30, and the departure timestamps of trains range from 06:00:00 to 10:50:00. Time is discretized in 1-min intervals (i.e., ). The minimum train headway is 3 min, and the maximum train headway is 7 min (i.e., ). Based on the actual capacity of the depots, the initial numbers of available trains at Changbei, Jiaoqiao, and Yaohu depots are assumed to be , and , respectively. The maximum number of trains that these depots can accommodate is . The train capacity for passengers is , and the maximum waiting time of passengers is min. The power cost for operating a short-turning train is yuan, and for a full-length train it is yuan. The weight coefficients are set as .
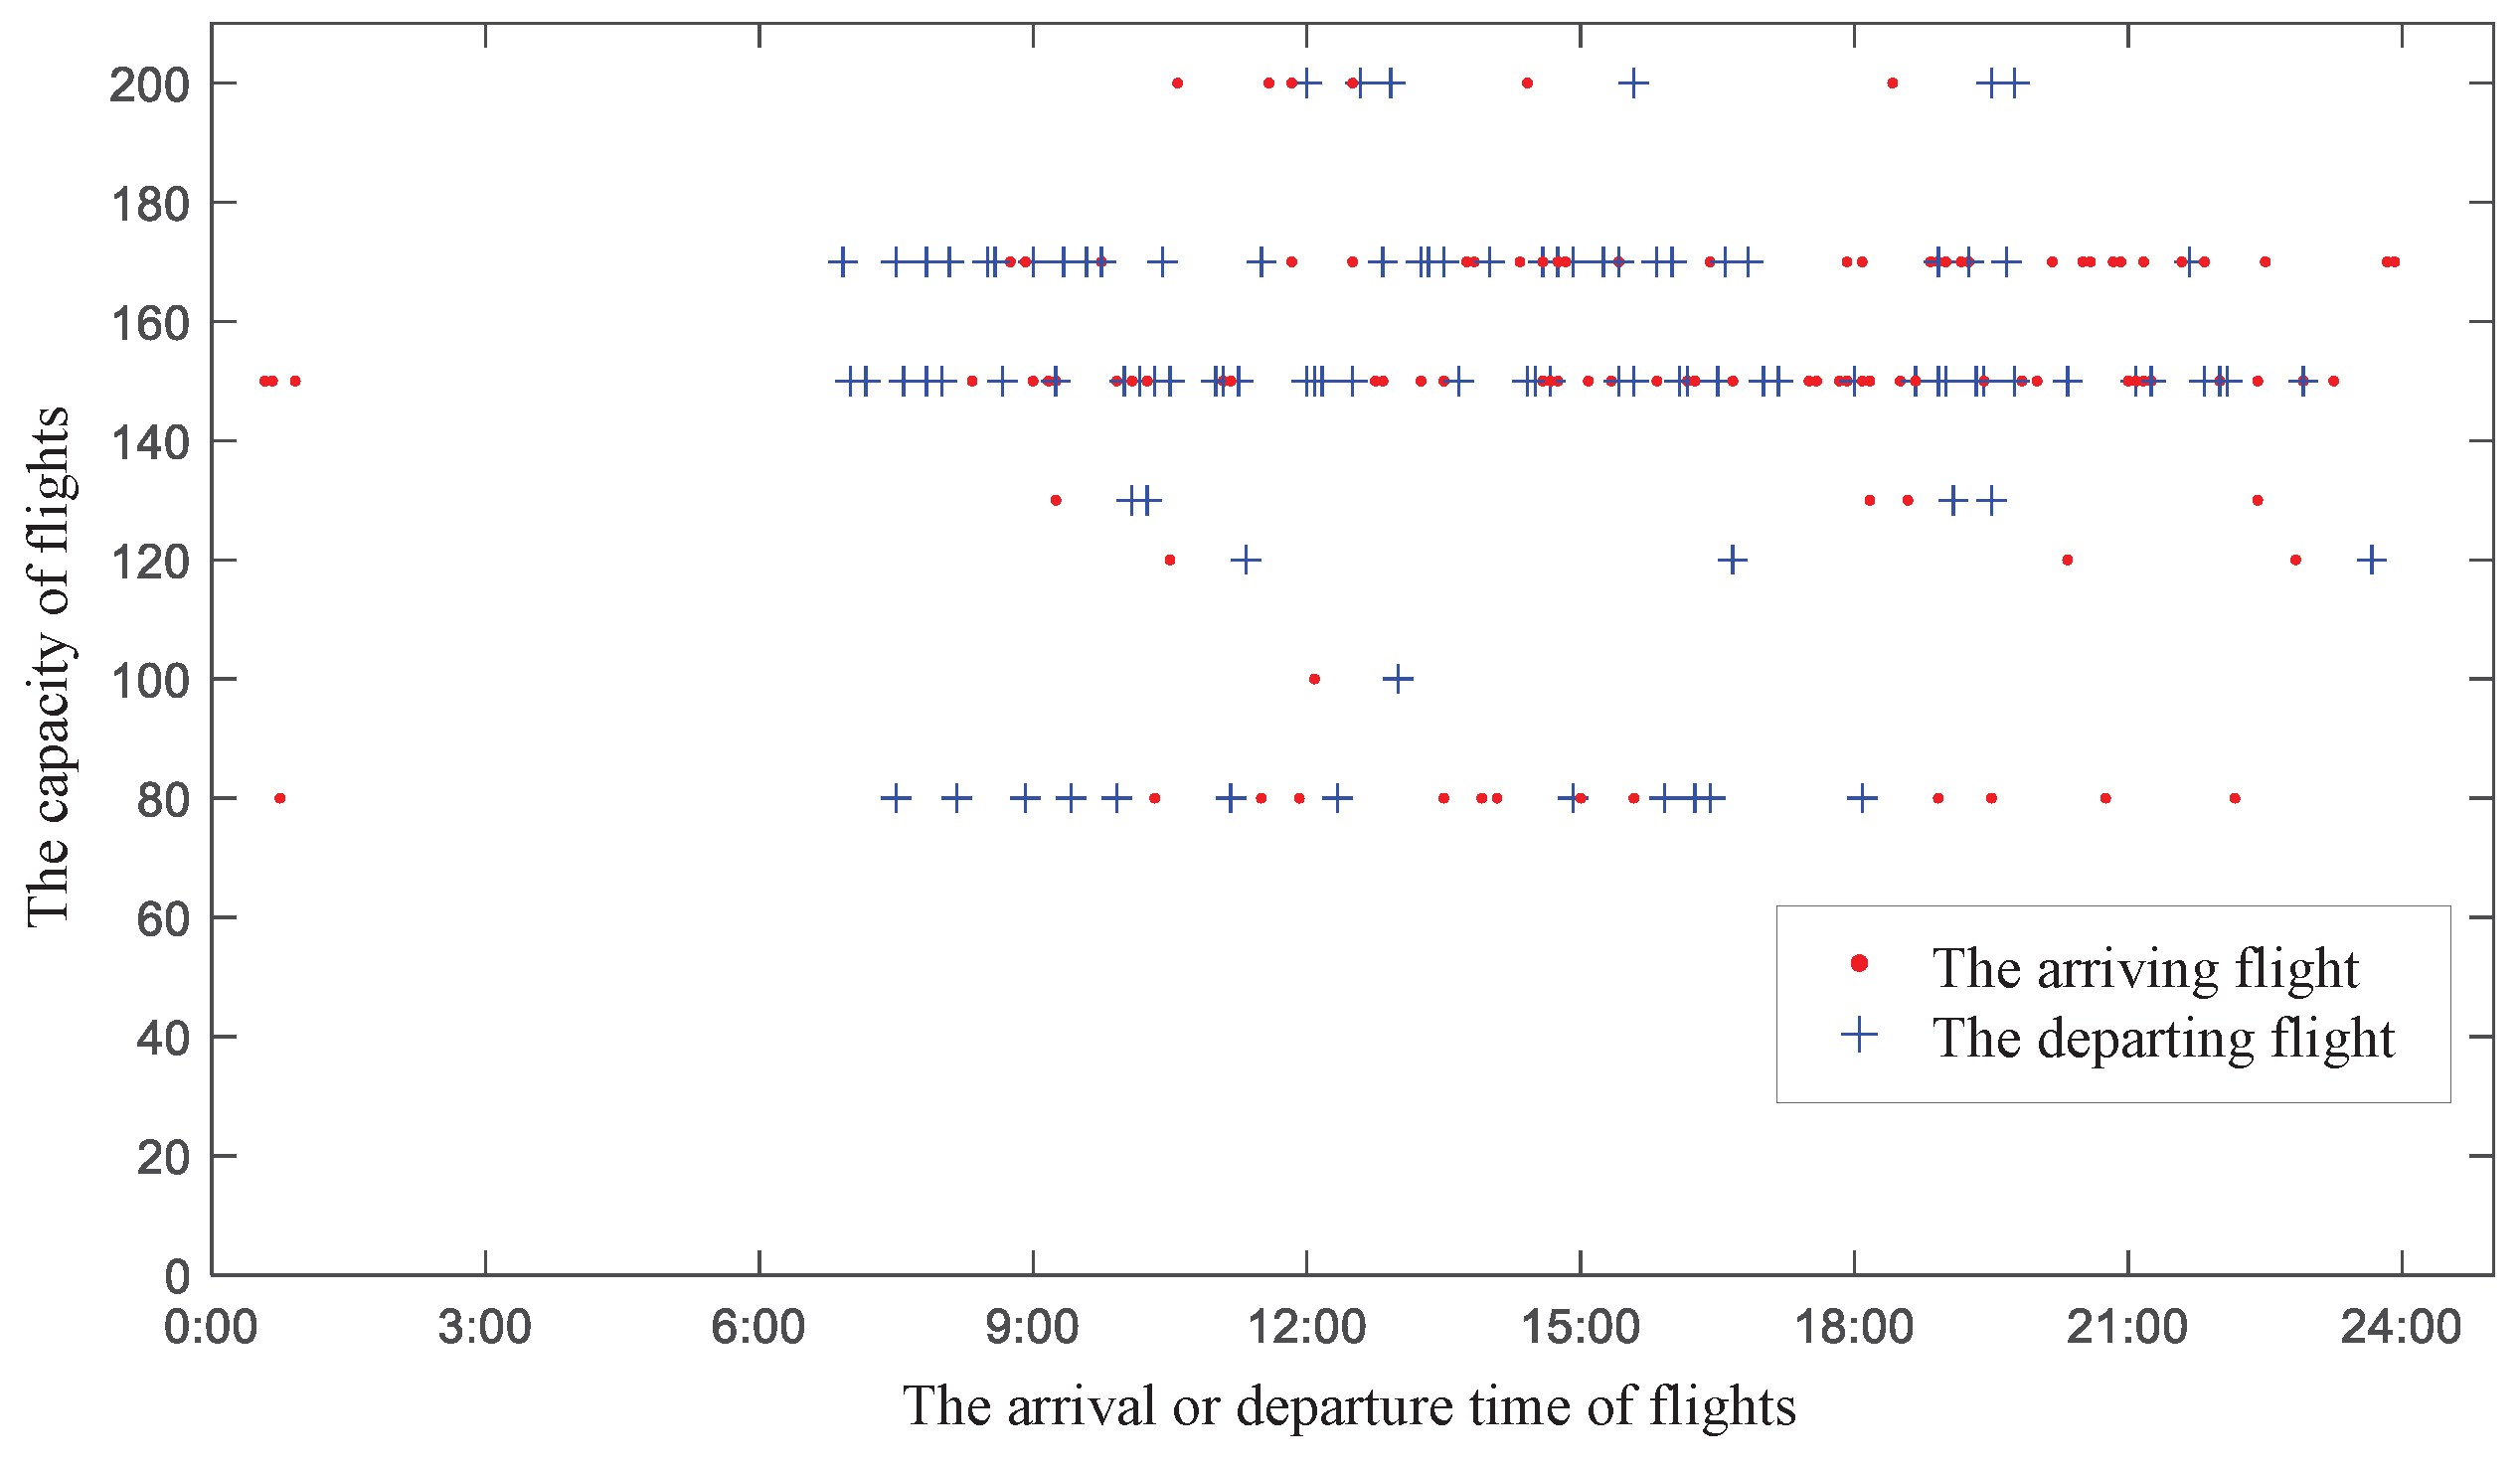
As this study specifically focuses on the influence of flight information on metro operations,
Figure 4 depicts the regular flight distribution at Changbei Airport. In this figure, the horizontal axis denotes the flight arrival or departure, while the vertical axis indicates the flight capacity. The flight-related information serves as a foundation for the subsequent demand forecasting at the Changbei Airport metro station. To guarantee the stability of the demand-supply equilibrium, it is assumed that all regular flights and the metro trains on the airport line adhere strictly to their scheduled timetables.
Due to the large volume of PSTT data and demand data, it is not possible to list them in detail here. The relevant content will be presented in the form of schematic diagrams later. It should be specifically noted that the PSTT data between Station 32 (Yaohu Lake West Station) and Station 9 (Shuanggang Station) are set based on historical timetables. For the extension lines that have not been officially put into operation, the relevant PSTTs are calculated according to the operating mileage.
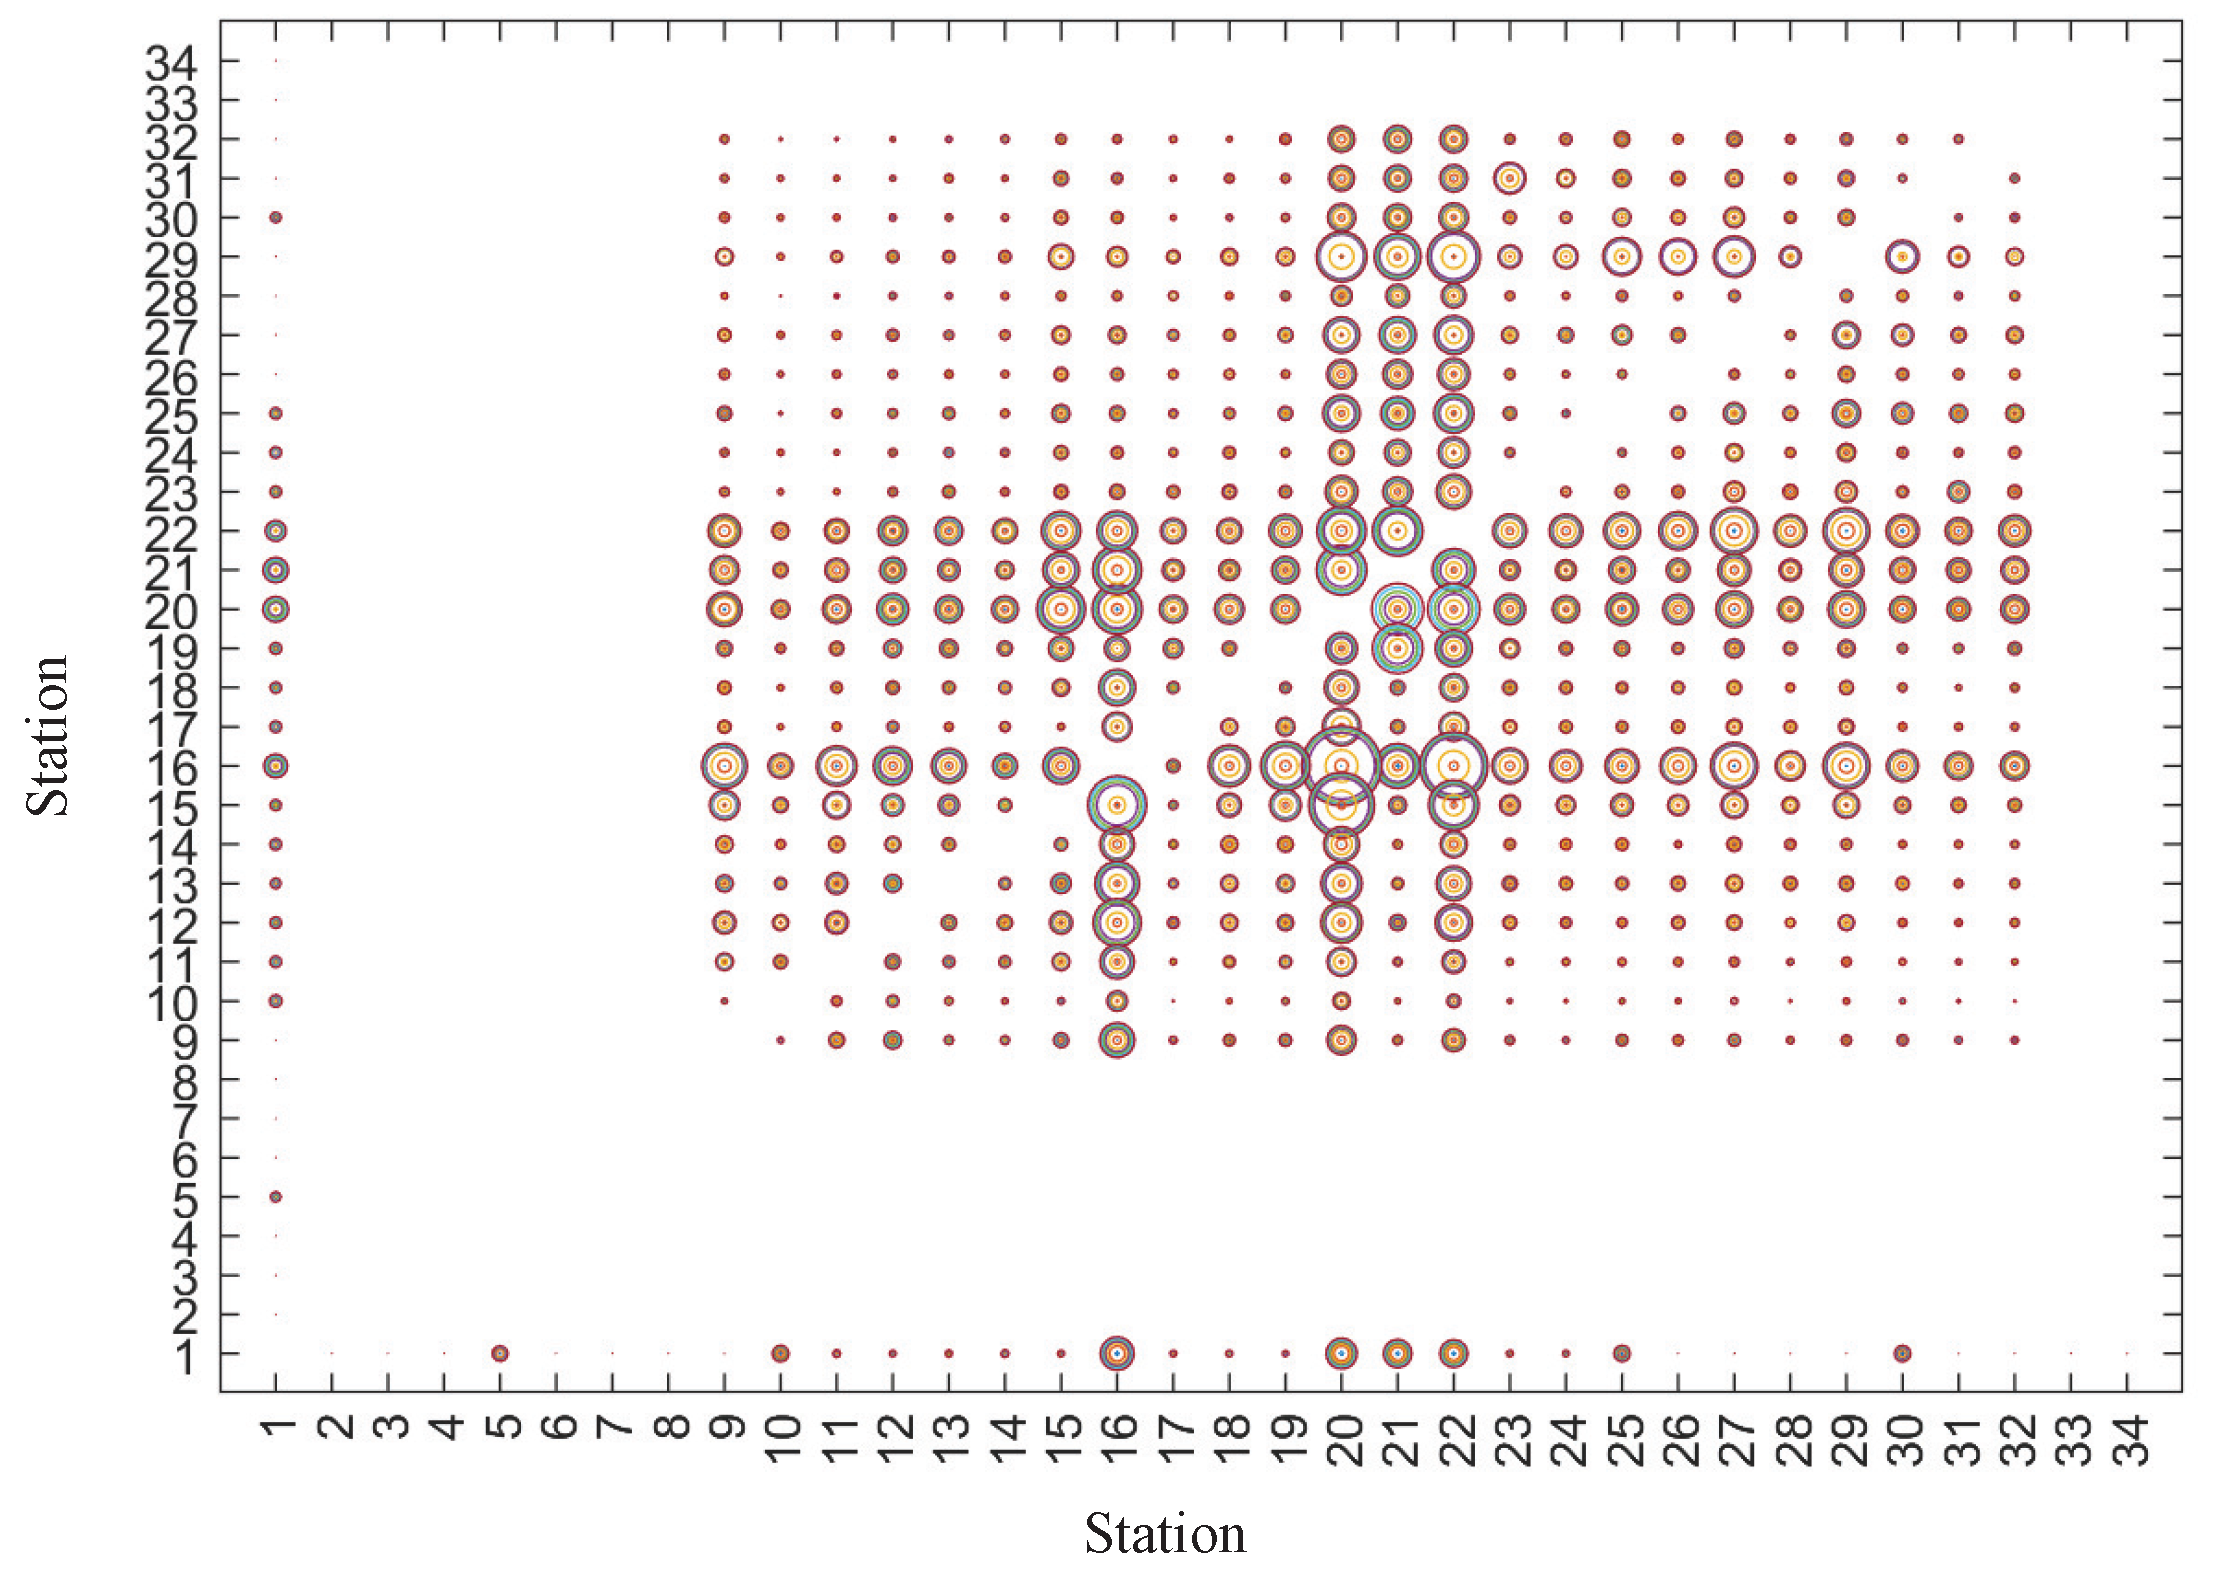
The demand data are shown in
Figure 5. In this figure, the horizontal axis represents the origins of passengers, and the vertical axis represents the destinations of passengers. The size of the circles at the corresponding coordinate positions reflects the hourly cumulative amount of the origin–destination (OD) demand. In this figure, the OD demand between Station 32 and Station 9 is derived from historical data, while the demand data with Changbei Airport metro station (Station 1) as the origin or destination are predicted based on the flight information in
Figure 4. Within the considered time frame, there are 8674 sets of demands in the upward direction for a total of 41,188 passengers (including 343 sets of 1024 passengers taking the metro from the airport), and 9058 sets of demands in the downward direction for a total of 49,965 passengers (including 486 sets of 1349 passengers arriving at the airport by metro).
4.2. Result Analysis
Under the above parameter settings, Gurobi only took 82 s to obtain the optimal solution with a relative gap of only 1%. The joint optimization result of full-length and short-turning plan and schedule (Optimized Strategy) is shown in
Figure 6. Specifically, in the upward direction, there are 20 full-length trains (i.e., the index with an asterisk) and 38 short-turning trains, while in the downward direction, there are 11 full-length trains (i.e., the index with an asterisk) and 46 short-turning trains. Overall, the total number of trains in both directions remains well-balanced. For comparison, we also calculated the value of objective function (
22) under the current implemented route strategy (Current Strategy), i.e., full-length trains and short-turning trains operate alternately. The comparative metrics for the optimized and current strategies are presented in
Table 3.
As illustrated in
Figure 6, the optimized timetable demonstrates strong demand coupling. The metro service frequency adopts a peak-hour prioritization strategy with high-frequency operations during peak periods and reduced frequency during off-peak hours. The full-length train timetable is strategically synchronized with the flight timetable. In the downward direction, where departing flight frequencies exhibit a consistent distribution throughout the morning, full-length train intervals demonstrate balanced proportions, with 1 to 3 short-turning trains interspersed between two adjacent full-length services. Conversely, the upward direction reveals greater variability due to fluctuating flight arrival intervals. This results in irregular train spacing patterns, including consecutive full-length train departures or up to four short-turning trains between two adjacent full-length services. Notably, the absence of pre-8:00 a.m. flight arrivals corresponds directly to the temporary suspension of full-length train operations during this period.
As illustrated in
Table 3, the jointly optimized strategy demonstrates superior performance in balancing passenger waiting time and operational efficiency compared to the current strategy. The optimized strategy achieves a 13% reduction in total train services and a significant 53% decrease in full-length train operations, resulting in a 22% power cost saving. Meanwhile, the waiting time for all passengers (i.e., GWT+CAWT+ACWT) has been reduced by 3.4%, where the waiting time for the airport-to-city passengers has decreased by about 10%, but the waiting time for the city-to-airport passengers has increased by about 60%. Although the numbers of passengers in these two groups are relatively smaller and their differences are not statistically significant, the explanation is straightforward: airport-to-city passengers from flight arrivals are typically more concentrated, whereas city-to-airport passengers originate from diverse locations across the city, leading to a greater temporal dispersion in their arrival patterns. This finding reveals an underlying mechanism: during the optimization process, there is a tendency to prioritize short-turning services to accommodate the majority of commuter passengers, while the relatively smaller group of city-to-airport passengers (i.e., 1349) experiences longer waits. Considering the substantial cost savings and the relatively minor impact on the small passenger group, the optimization strategy demonstrates clear feasibility for implementation. However, for practical implementation, decision-makers must carefully weigh the service level for this group against subway operation costs.
This study involves a multitude of parameters, all of which exert an influence on the optimized schedules and indicators. On the one hand, from the perspective of a metro company, certain parameters are predetermined. For instance, the minimum and maximum headways, depot stock levels and capacities, as well as train capacity are fixed values. On the other hand, the core objective of this study is to explore the impact of the schedules of full-length and short-turning trains on airport passenger flow. In light of this, we have next selected two parameters as representatives to conduct sensitivity analysis.
4.3. Sensitivity Analysis on the NFLT in the Upward Direction
Although the number of city-to-airport passengers is relatively smaller, the full-length train operations are critical for them, as missing the metro connection could potentially result in a flight disruption. To ensure equity, it may be essential in practice to augment the number of full-length trains (NFLT) in the upward direction. For convenience, this number is denoted by
. Consequently, we perform a sensitivity analysis on the value of
by introducing a constraint, specifically
. We let
increase by 2, ranging from 20 to 30. The resulting performance curves of key indicators are depicted in
Figure 7.
In the first subplot of
Figure 7, it is evident that as the value of
increases, the number of short-turning trains (NSTT) in the same direction decreases. However, the combined total of full-length and short-turning trains remains nearly constant. In the process of increasing the value of
, as anticipated, there is a significant reduction in the waiting time for city-to-airport passengers, as illustrated in the third subplot of
Figure 7. Specifically, for every two additional full-length trains, the waiting time is reduced by approximately 6.7%. When
is set to 30, the waiting time for the city-to-airport passengers is merely 405,680 s. Although this result is still 7 percentage points higher than that of the current strategy, it is 32.7% lower than that of the optimal strategy.
The first subplot of
Figure 7 further reveals that both the NFLT and NSTT in the downward direction remain almost unchanged. This stability ensures that the waiting time for the airport-to-city passengers is less affected by the increase in the value of
, as clearly depicted in the second subplot of
Figure 7.
As shown in the fourth subplot of
Figure 7, the waiting time for general metro passengers experiences some fluctuations during the process of increasing the value of
. However, the amplitude of these fluctuations is less than 1.4%. In essence, the increase in the value of
has a negligible impact on the waiting time for the general metro passengers.
From the last subplot, the power cost exhibits a gradual upward trend as the value of increases. When reaches 30, the power cost amounts to 142,890 yuan. This indicator represents a 6.4% increase over the optimized strategy, but a 17.0% reduction compared to the current strategy.
The above sensitivity analysis indicates that there are many well-performing solutions between the optimized strategy and the current strategy. This finding offers a relatively flexible decision-making framework, particularly when considering both operational efficiency and equity. Consequently, implementing mitigation strategies, such as introducing buffer trains during peak departure times or integrating with airport shuttle buses, is essential in practice.
4.4. Sensitivity Analysis on the Weight Coefficient
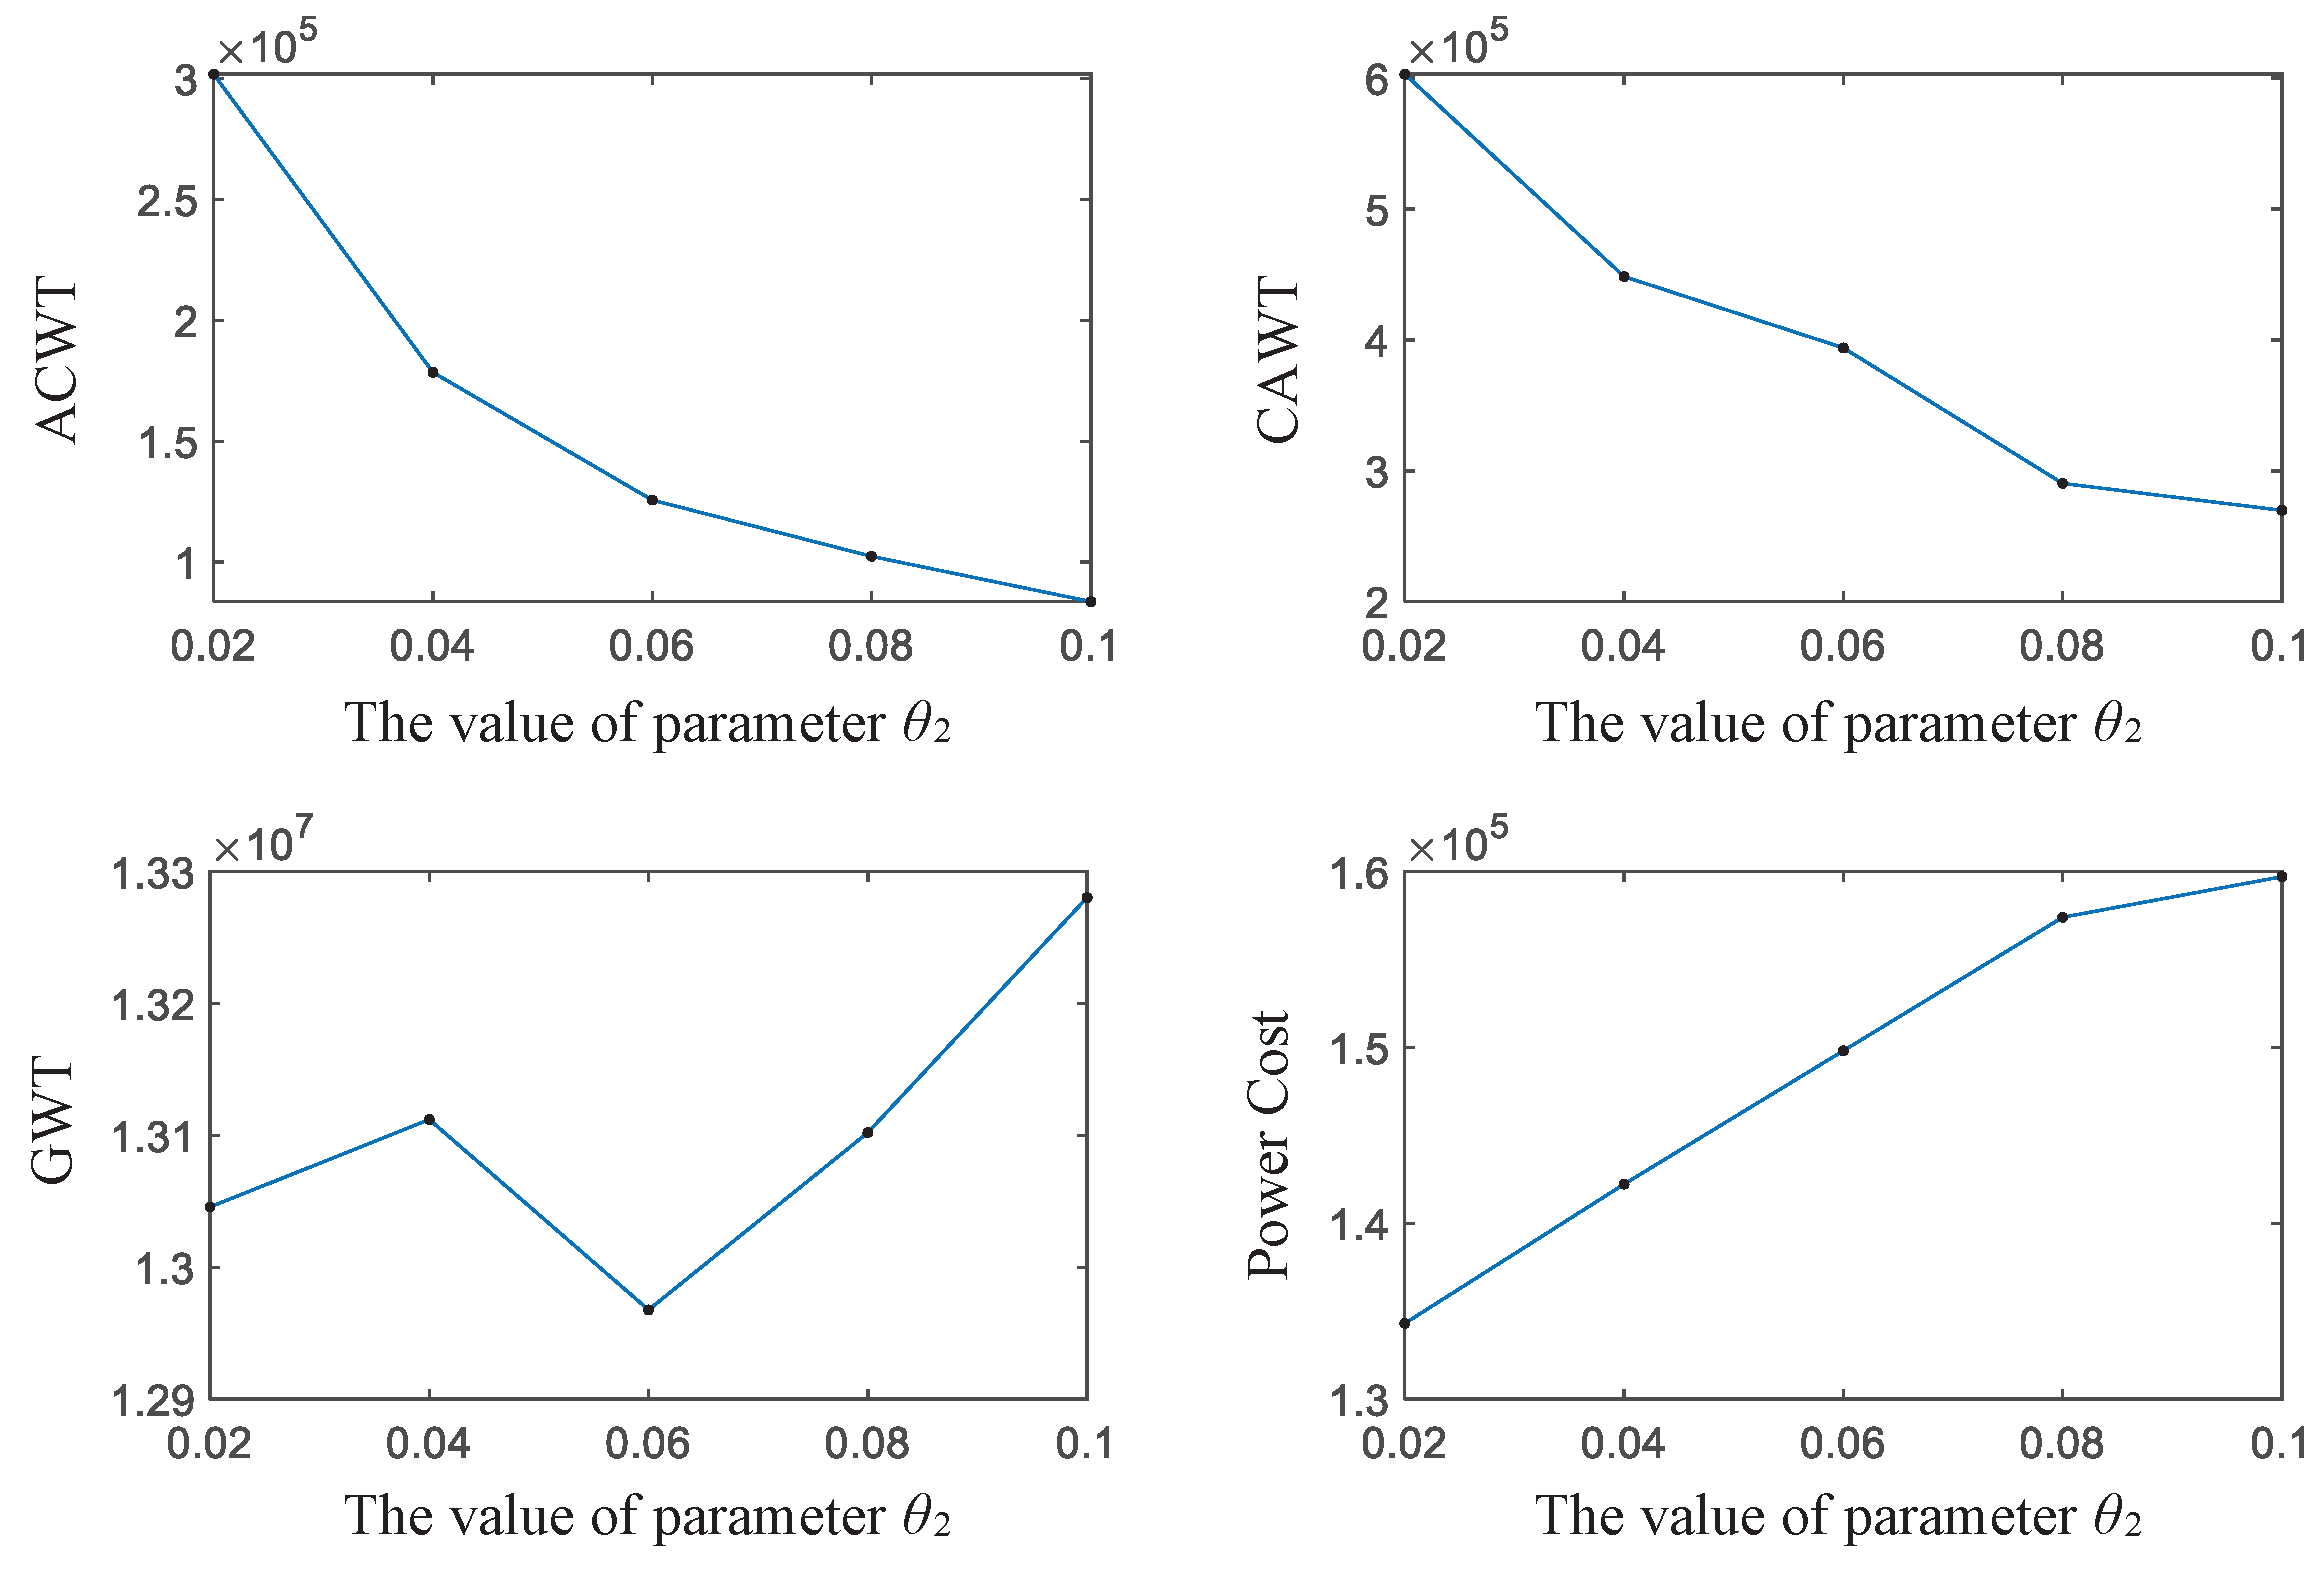
Section 4.2 has illustrated the strong coupling relationship between the optimized timetable of metro trains and the dynamics of demand. For both city-to-airport and airport-to-city passenger flows, this dynamics can be reflected by the heterogeneity of flight patterns and their schedules, which may cause demand surges. Given that only full-length trains are capable of accommodating both city-to-airport and airport-to-city passenger flows, the parameter
exerts a critical influence on the scheduling strategy of these services. To systematically examine this impact, we conducted a sensitivity analysis by varying
across the interval [0.02, 0.1] in 0.02 increments. The resulting performance curves of key indicators are depicted in
Figure 8.
As illustrated in
Figure 8, the first subplot demonstrates a significant reduction in the waiting time for airport-to-city passengers as parameter
increases. For city-to-airport passengers, a similar decreasing trend is observed, albeit at a marginally slower rate (second subplot). The waiting time for other passengers exhibits a fluctuating relationship with
, achieving its minimum value at
before significantly increasing beyond this threshold (third subplot). Notably, the final subplot reveals a direct correlation between power costs and parameter
, with costs increasing monotonically as
increases. Overall, the relatively low volume, geographically dispersed origins, and temporally dispersed departures of city-to-airport passengers necessitate substantial operational costs to reduce their waiting time, with the primary expenditure being on the implementation of additional full-length train services.
5. Conclusions and Future Research
This study presents a mathematical framework for optimizing integrated full-length and short-turning operations on the Nanchang Metro Airport Line, incorporating three critical decision variables: train scheduling, service pattern, and passenger flow assignment. The primary objective is to minimize the composite operational cost comprising train power expenditures and passenger waiting time costs, with particular emphasis on bidirectional airport-metro passenger demand dynamics. Experimental validation demonstrates that the proposed optimization strategy effectively achieves simultaneous reductions in the power cost (by 22%) and the waiting time of all passengers (by 3.4%), with notable performance differentials observed between city-to-airport and airport-to-city traffic patterns. Specifically, the concentrated nature of airport departure passenger flows is beneficial for the cost control during the implementation of the full-length services, whereas the dispersed characteristics of airport arrival flows create operational challenges for maintaining cost control in full-length service implementation. The sensitivity analysis suggests that in particular decision-making contexts, the optimal outcomes can be adjusted flexibly to align with practical requirements. For instance, for every two additional full-length trains, the waiting time is reduced by approximately 6.7%.
In addition, this study can reveal the coupling relationship between the metro train timetable and the dynamics of passenger flows from the city to the airport and vice versa. From a management perspective, the airport authority can share real-time data of flight schedules and passenger flow with the metro company. Through leveraging this information, the metro company can dynamically adjust its operational strategies. This collaborative approach not only reduces average connection time for multimodal integration services but also increases metro’s modal share ratio among airport-bound passengers. Crucially, it involves evolving the metro operator’s role from a mere “transport service provider” to that of an “integral component of the aviation travel service chain”. The ultimate objective is to achieve a seamless passenger experience, from exiting the plane to accessing the metro and departing from the metro for immediate boarding. Since the model is proposed under a general scenario, it can be directly applied to metro airport lines in other cities with varying airport characteristics.
The joint optimization of service patterns and scheduling presents inherent complexities that warrant further investigation. However, the current study adopts deterministic assumptions for demands, train dwell times and inter-station travel durations, neglecting operational uncertainties such as signal system malfunctions, equipment breakdowns, and human errors, which may cause service disruptions. In real-world metro operations, these stochastic factors frequently induce line delays, necessitating the development of adaptive rescheduling mechanisms for dynamic service adjustments. Since the operation of Nanchang Metro Line 1, which adopts both full-length and short-turn services, has just commenced, the passenger flow to the airport remains relatively low. With the ongoing implementation of this strategy, an increasing amount of passenger data will become available for the iterative decision-making. Future research directions will focus on three key areas: (1) incorporating probabilistic modeling of operational uncertainties to enhance robustness, (2) optimizing passenger transfer efficiency across the metro network through integrated timetable design, (3) developing combinatorial optimization approaches for heterogeneous train fleets with varying capacity and power consumption characteristics, (4) integrating the optimization framework into a real-time decision support system, and (5) conducting a multi-objective study and providing a Pareto frontier for decision-makers. These advancements aim to create more resilient, diversified and passenger-centric metro operation strategies for airport-connected transit systems.


