Article

Enhancing Highway Emergency Lane Control via Koopman Graph Mamba: An Interpretable Dynamic Decision Model

Command and Control Engineering College, Army Engineering University of PLA, Nanjing 210007, China
*
Author to whom correspondence should be addressed.
Vehicles 2025, 7(4), 129; https://doi.org/10.3390/vehicles7040129
Submission received: 7 September 2025 / Revised: 27 October 2025 / Accepted: 6 November 2025 / Published: 10 November 2025

Abstract

Intelligent Transportation Systems (ITS) play a pivotal role in addressing traffic congestion, inefficiency, and safety concerns. Emergency lane control on highways is a critical ITS component, yet existing strategies often lack flexibility, theoretical rigor, and the ability to handle dynamic spatiotemporal interactions under uncertain data. To address these limitations, this paper introduces Koopman Graph Mamba (KGM), an innovative framework integrating the Koopman operator with a graph-based state space model for dynamic emergency lane control. KGM leverages multimodal traffic data to predict spatiotemporal patterns, facilitating real-time decisions. An interpretable decision module based on fuzzy neural networks ensures context-sensitive decisions. Evaluated on a real-world dataset from the Changshen Expressway (Nanjing-Changzhou section) and public datasets including NGSIM, PeMS04, and PeMS08, KGM demonstrates superior performance with linear computational complexity, underscoring its potential for large-scale, real-time applications.

1. Introduction

Transportation is a cornerstone for economic growth, environmental sustainability, and quality of life. However, it faces significant challenges such as congestion, safety concerns, and inefficiency. Intelligent Transportation Systems (ITS) [1,2,3] address these issues by integrating sensor data, predictive analytics, and machine learning to enhance throughput, control, service, and safety. Despite their potential, ITS are characterized by inherent uncertainties and dynamic complexities, which result in high-dimensional, nonlinear dynamical systems that complicate the development of accurate traffic evolution models. A key challenge lies in managing the dynamic interactions within these systems, which, in the context of this study, refer to the real-time decision-making process that continuously determines whether to activate emergency lanes based on evolving traffic conditions, creating a feedback loop between the traffic state and control actions.
Emergency lane control on highways [4,5,6], a critical component of ITS, can mitigate congestion and prevent bottlenecks through strategic use of lanes typically reserved for urgent operations. The primary goal of temporary emergency lane activation is to augment road capacity during periods of high demand or unexpected incidents, thereby alleviating congestion, reducing travel time, and enhancing traffic safety. Effective management of emergency lanes is essential for improving traffic flow and safety. Ref. [7] has shown that opening the temporary hard shoulder running on the M25 motorway in the United Kingdom can decrease emissions and congestion. Refs. [8,9] have examined the safety implications of hard shoulder use, uncovering correlations between shoulder length, usage timing, and collision frequency. Ref. [10] indicates that active traffic management, including dynamic emergency lane operations, can lower accident rates on Interstate 66 in Virginia. Advanced optimization techniques, such as genetic algorithms [11] and Q-learning [12], have been applied to optimize emergency lane control, thereby reducing travel time. A specific approach [13] optimizes hard shoulder use during accidents to minimize delays. Furthermore, ref. [14] presents a novel Kriging-genetic algorithm-based optimization for highway emergency lane control, incorporating the spatiotemporal aspects of emergency lane openings to improve operational efficiency and safety.
These studies emphasize the importance of rational emergency lane utilization for both safety and efficiency. Current emergency lane control strategies, however, are often inflexible, relying on fixed-time or fixed-space controls. Moreover, the dependence on video surveillance and experiential judgment lacks a robust theoretical foundation and is difficult to evaluate. The optimization of these strategies is constrained by several limitations: (i) existing methods typically optimize either spatial or temporal strategies under static conditions, neglecting dynamic interactions; (ii) spatiotemporal traffic patterns are often inadequately represented and predicted by existing approaches, which rely on static or simplistic models that fail to capture the complex and evolving nature of traffic flow and the intricate interactions between different road segments; (iii) decisions are made based on certain information, and the difficulty in obtaining complete information in real-world scenarios means that this reliance on potentially imprecise or uncertain data results in challenges to achieving reliable and effective decisions; and (iv) the computational intensity and time consumption of these algorithms hinder practical implementation. These limitations highlight the necessity for advanced and efficient optimization methods capable of addressing the dynamic nature of emergency lane control, integrating multiple objectives, and providing real-time solutions. Consequently, developing a decision-making model to predict congestion and assess the benefits of temporary emergency lane use is imperative.
To address these challenges, we propose the Koopman Graph Mamba (KGM), an innovative framework that integrates the Koopman operator with a graph-based State Space Model (SSM). KGM leverages road monitoring data to make dynamic, real-time decisions regarding emergency lane activation. Multimodal traffic data, including traffic volume, vehicle types, density, and speed, are analyzed using Koopman Mode Decomposition (KMD) [15] to identify and forecast spatiotemporal traffic patterns, which inform proactive decision-making. The Graph Mamba (GM), built upon SSM, facilitates efficient, low-latency decisions and excels in real-time processing of long-range dependencies and large-scale datasets, which are crucial for effective traffic management. In the KGM model, highway observation points are represented as nodes that encode both current and predicted traffic parameters, and the multi-layer structure captures the complex interactions among road segments, with an embedded attention mechanism dynamically highlighting critical segments during decision-making. Furthermore, an Interpretable Decision Module (IDM), powered by Fuzzy Neural Networks (FNN) [16], formulates the control of emergency lanes as a binary classification task based on imprecise or uncertain data. This module predicts the necessity for emergency lane activation and generates actionable recommendations based on a predefined probability threshold. Consequently, the KGM model ensures prompt and well-informed decisions for emergency lane control, optimizing traffic flow and safety. Preliminary comparative analysis shows that KGM achieves a higher F1-score (0.978 on the real-world dataset) compared to existing graph-based methods (e.g., STSGCN: 0.952) and Mamba-based models (e.g., GMN: 0.965), while maintaining O n complexity, which is a significant advantage over computationally intensive alternatives.
This paper makes several key contributions, which are outlined below:
  • The application of KMD to reveal and predict spatiotemporal traffic patterns, introduces three distinct traffic patterns that provide a theoretical basis for dynamic decision-making in highway emergency lane control.
  • The integration of the Koopman operator into a graph-based SSM, enables real-time, dynamic decision-making, and proposes a node prioritization strategy for informed sparsification, enhancing the model’s capability to handle complex traffic scenarios.
  • The development of an IDM using FNN to frame emergency lane control as a binary classification problem, synthesizes fuzzy rule outcomes and KMD-recognized patterns for context-sensitive and integrated decision-making, effectively handling imprecise or uncertain data.
  • The comprehensive evaluation on a real-world Chinese road dataset and NGSIM, PeMS04, and PeMS08 datasets, demonstrates the superior performance of KGM in dynamic emergency lane control compared to baseline models, with O n computational complexity, significantly reducing overhead.

2. Related Work

2.1. Traffic Prediction

Traffic forecasting [17,18,19,20] is a fundamental aspect of ITS. Traditional approaches have been widely employed, but they often struggle with capturing complex spatiotemporal dependencies and nonlinear patterns in traffic data. The advent of deep learning, particularly graph-based models, has significantly advanced the field. Recurrent Neural Networks (RNN) have effectively addressed temporal dynamics, while Graph Convolutional Networks (GCN) have provided an improved representation for the non-Euclidean nature of spatial relationships, albeit with challenges such as over-smoothing. The incorporation of Convolutional Neural Networks (CNN), renowned for their proficiency in spatial analysis, and attention mechanisms has further enhanced feature extraction capabilities. This integration has led to the development of sophisticated hybrid models, including Spatio-Temporal Graph Convolutional Networks (STGCN) [21] and Spatial-Temporal Synchronous Graph Convolutional Networks (STSGCN) [22], which synthesize these techniques to achieve state-of-the-art performance.
Recent studies, such as the Spatial-Temporal Large Language Model (ST-LLM) [23] for capturing complex dependencies, further advance the field. Despite these advancements, the requirement for extensive datasets and the inherent complexity of these models presents significant obstacles, especially in scenarios with limited data availability. Furthermore, these models are predominantly designed for prediction tasks and often lack the integrated, interpretable, and low-latency decision-making capability essential for direct real-time control applications like emergency lane management. As our experimental results will later demonstrate (c.f. Section 5.4.3), while models like STSGCN achieve high prediction accuracy (F1 = 0.952), the proposed KGM framework surpasses them in the decision-making task (F1 = 0.978) while maintaining the linear computational complexity crucial for real-time operation.

2.2. Mamba

The Mamba framework, an advanced variant of selective SSM, is adept at handling sequential data, including text, time series, and speech, and has recently been extended to non-sequential data such as images and graphs. This extension leverages Mamba’s ability to capture long-range dependencies and facilitate efficient learning and inference, positioning it as a versatile, general-purpose model across diverse domains. In financial, traffic, and weather forecasting, which rely heavily on time-series data, Mamba enhances the modeling of long-range sequences. Notable applications include TimeMachine [24], which employs Mamba for low-memory, multivariate time-series pattern recognition. For graph-structured data, Selective SSM facilitate the encoding of contextual information and the regulation of input flow, processes that can be analogized to attention sparsification. Specifically, the Graph-Mamba [25] approach combines graph flattening with Mamba’s selection mechanism, while the Graph Mamba Network (GMN) [26] reinterprets SSM for graph learning, outperforming both GNN and Transformer across multiple benchmarks. For Spatial-Temporal Graph (STG) data, STG-Mamba [27] combines a graph selective state space block and kalman filtering within an encoder-decoder framework, delivering state-of-the-art performance and efficiency.
In contrast to previous approaches [28], KGM model integrates Koopman operator with a graph-based SSM, specifically designed for dynamic and real-time decision-making in emergency lane control. While existing Mamba applications like GMN focus on graph representation learning and achieve high efficiency (F1 = 0.965 in our experiments), they do not inherently provide the interpretable decision logic required for trustworthy traffic control. KGM addresses this by incorporating a dedicated Interpretable Decision Module (IDM), enabling it to leverage the efficiency of SSMs for a novel, decision-oriented task where both performance and explainability are paramount.

3. Problem Definition

The control of emergency lanes on highways aims to determine the optimal times to open these lanes to enhance traffic efficiency and safety. The control strategy specifies the start point and length of the segment where the emergency lane should be opened, thereby improving traffic conditions in congested or accident-prone areas. As illustrated in Figure 1, the control segments are spatially discretized into segments s of approximately equal length, with each segment l s ranging from 200 to 400 m. Temporally, the control duration T is divided into 10-min intervals T ^ , during which the status of each segment remains constant. A binary variable D s represents the status of the emergency lane for the s -th segment: D s = 1 indicates the lane is open, and D s = 0 indicates it is closed.
As shown in Figure 1, the control strategy for all spatial segments within the same time interval T ^ is represented as:
I k t = D 1 t = 1 , D 2 t = 0 , , D s 1 t = 1 , D s t = 0
The control duration T is divided into t intervals of T ^ , and the control strategy over the entire duration T is denoted as:
I k = I k 1 , I k 2 , , I k t
where k represents the observation point. This strategy is a two-dimensional s × t binary variable matrix, where s is the number of spatial segments and t is the number of time intervals. The matrix describes open or closed status of each spatial segment of the emergency lane control section L during different time intervals. To ensure the feasibility of the control strategies, temporal and spatial constraints are imposed. The impact of each control strategy I k on highway traffic conditions varies, and the optimization problem is to determine the optimal control strategy I k that maximizes operational efficiency and safety under these constraints.
To reduce the effects of frequent adjustments in emergency lane control on management costs and driver safety, spatiotemporal constraints are introduced. A 30-min time window is established to analyze traffic condition changes and define temporal constraints. Decisions on the emergency lane’s status (open or closed) are made every 10 min. The total count of state alterations for all spatial segments of emergency lane between two consecutive decisions is defined as the number of state transitions within the time window. The decision-making interval T ^ , set to 10 min, represents the minimum duration during which the emergency lane maintains its state.
i = 1 s D i t + 1 D i t 2 N trans
In the given context, D i t is the control state of the i -th spatial segment at time period t, and D i t + 1 is control state at the next time period t + 1 . The term N trans represents the number of time window transitions, defined as the total number of changes in control variable D i across all spatial segments within a single time window. A transition is counted whenever D i changes from 0 to 1 or from 1 to 0.
To reduce the frequency of state changes and enhance safety, the number of state transitions must be controlled. Spatial constraints are added to the emergency lane control strategy to prevent overly fragmented opening and closing patterns, which could increase lane-changing events and safety risks. Using the concept of connected components from graph theory, we define the degree D ^ of discreteness in the emergency lane’s states. Within a 10-min interval, consecutive open and spatially connected segments are counted as a single lane component. D ^ = 0 means the segment does not form a lane component, while D ^ = 1 means it does. The sum of all lane components within an interval is denoted as N component . The following constraints must be met by the number of lane components [14]:
D ^ N component

4. Methodology

4.1. Overview

As illustrated in Figure 2, the KGM workflow begins with the acquisition and preprocessing of real-time and multimodal traffic data from road monitoring devices. The proposed KGM framework is primarily designed for controlled-access highways (e.g., expressways, motorways). Its effectiveness is predicated on the infrastructure characteristics of such roads, including the presence of a dedicated emergency lane (hard shoulder), full access control, and the availability of consistent sensor data along the corridor. This data, including traffic volume, vehicle types, density, and speed, is processed to ensure consistency and remove noise. The preprocessed data then undergoes KMD to identify spatiotemporal patterns for predicting future traffic conditions. A spatiotemporal graph is constructed, where highway observation points are represented as nodes, each enriched with both current and forecasted traffic parameters, and edges represent interactions between different road segments. To mitigate computational overhead and enhance unidirectional recurrent updates, a node prioritization strategy is employed. This strategy flattens the nodes into a sequence through a structured process, with more influential nodes placed at the end. This reordering ensures that key nodes have access to a broader context, improving the model’s capacity to utilize comprehensive historical information. The GM network processes graph-structured data, capturing long-range dependencies and focusing on critical segments through multiple layers. The IDM classifies emergency lane activation as a binary decision using FNN. The IDM integrates fuzzy rules and recognized traffic patterns derived from KMD, utilizing the outputs of the GM and Gated Graph Convolutional Network (Gated GCN) as inputs. Recommendations are generated based on activation probability, and the system adapts and improves over time, optimizing the utilization of graph-structured data for accurate and context-sensitive decision support in managing emergency lanes on highways.

4.2. Koopman Mode Decomposition

The Koopman operator theory offers a linear framework for the temporal evolution of observables in dynamical systems, facilitating the extraction of underlying structural information from data. Spectral decomposition via the Koopman operator segregates the system into mean, periodic, and stochastic components. Discrete spectra provide clear insights into stable and oscillatory behaviors, whereas continuous spectra are indicative of chaotic dynamics. KMD, based on the operator’s eigenvalues and modes, represents complex data as a collection of evolving, interpretable sub-patterns. KMD, which is computable through Dynamic Mode Decomposition (DMD) algorithms, is a robust method for analyzing and predicting the behavior of intricate systems. In traffic flow prediction, Koopman-theory-based models are employed to capture hierarchical system dynamics through a stackable block structure that sequentially analyzes the temporal evolution of traffic. Each block identifies local dynamic features and computes context-aware operators for global optimization. Furthermore, the Koopman predictor is integrated into a deep residual network, enabling end-to-end optimization for the prediction task.
For traffic flow data, we formalize it as a time series matrix P = p 1 , , p t , where t represents time, p i = p 1 i , , p K i T , K denotes the number of observation points. The average matrix P ^ is defined as:
P ^ = p 1 1 t i = 1 t p i , , p t 1 t i = 1 t p i
Following mean subtraction, the data matrix is processed by the Hankel-DMD algorithm, which integrates time-delay embedding (Hankel matrix) with ExactDMD. As a state-space reconstruction technique, delay embedding recovers the intrinsic attractor of the original system. After selecting an appropriate delay, the mean-subtracted data is embedded using Equation (6), thereby enabling the extraction of dynamic modes.
P ^ Q = p 1 p 2 p m d p 2 p 3 p m d + 1 p d p d + 1 p m = q 1 , , q l
The ExactDMD aims to approximate a finite-dimensional form of Koopman operator, conforming to the relation in Equation (7). This approximation captures the essential dynamics in a reduced space, enabling the identification of significant system modes.
Q 2 = K Q 1 + r
Q 1 = q 1 , , q l 1
Q 2 = q 2 , , q l
In this context, Q 1 and Q 2 are the time-shifted matrices, K represents the finite matrix approximation of Koopman operator, and r denotes residual error resulting from the finite-dimensional truncation of a potentially infinite expansion. The ExactDMD approximates the Koopman operator by minimizing the residual term in a least squares sense. This is achieved by applying Singular Value Decomposition (SVD) of Q 1 = U Σ W to re-express Equation (7) as:
Q 2 = K Q 1 + r = KU Σ W + r
Since r must be orthogonal to U, multiplying both sides of Equation (10) by U , we obtain:
U Q 2 = U KU Σ W + U r = U KU Σ W
Through a similarity transformation, we can obtain a matrix S = U KU = U Q 2 W 1 related to K . Since K and S are related, they share the same eigenvalues. If λ i , w i is an eigenvector of S , then λ i , v i = U w i is an eigenvector of K . Additionally, the sampled data, representing a discrete-time version of a continuous process, yields eigenvalues { λ i } on the unit circle. The corresponding continuous-time eigenvalues are given by:
w i = ln ( λ i ) T ¯
where T ¯ is the sampling interval. The KMD then describes observed data points p i as:
p k m d ( t ) = i = 1 l b 0 i v i e ω i t = V e ω t b 0
In this context, e ω t is a diagonal matrix with elements e w i t . V = v 1 , , v l , where v i is the eigenvectors. b 0 = V p 1 , where V is the Moore-Penrose pseudoinverse of V . The Hankel-DMD algorithm [15] generates mode-eigenvalue pairs v i , ω i . These pairs can be evolved over t time steps using Equation (13) to reconstruct the data. Extending this evolution beyond t steps enables the prediction of future system states. A visual representation of the procedure is provided in Figure 3.
Inspired by [29], we classify traffic patterns into three distinct categories based on the eigenvalues V of Koopman operator: Steady-State Smooth Traffic (SST), Asymmetric Oscillating Congestion (AOC), and Multi-Source Bottleneck Diffusion Congestion (MSBDC). SST is characterized by smooth and steady traffic flow with minimal congestion and high average speeds. This pattern typically occurs during off-peak hours or in less congested areas, where the traffic volume is well below the road capacity, allowing vehicles to maintain consistent speeds and safe distances. The key features of SST include: (i) high average speeds and low variability: vehicles maintain consistent speeds with minimal fluctuations; (ii) minimal congestion and stable driving conditions: traffic flow is stable, with few disruptions and safe driving conditions; and (iii) efficient use of road infrastructure: roads are utilized efficiently with minimal delays, optimizing the overall traffic management.
In contrast, AOC is marked by uneven periodic fluctuations in traffic velocity, with more frequent or pronounced deceleration than acceleration, often occurring in complex road segments such as junctions between multi-lane highways and single-lane roads, or near irregular exits. The key features of AOC include: (i) periodic fluctuations in traffic speed: significant decelerations are more frequent than accelerations; (ii) unstable vehicle flow: prolonged periods of low-speed travel are interspersed with brief higher-speed intervals; and (iii) triggered by minor disturbances: AOC is often initiated when traffic volume approaches road capacity, leading to unstable flow.
MSBDC, on the other hand, occurs when multiple, dispersed bottlenecks—caused by construction, accidents, or localized obstacles—interact, resulting in widespread congestion. Each bottleneck reduces throughput in its section, but collectively, they significantly degrade overall network performance, causing congestion across several nodes. The key features of MSBDC include: (i) widespread congestion: multiple bottlenecks interact, leading to extensive congestion; (ii) reverse impact of cumulative bottlenecks: the cumulative bottleneck of a subsequent section will have a reverse impact on the previous section, further exacerbating the overall congestion; and (iii) complexity and predictive challenges: conventional models struggle to predict and manage this type of congestion due to its complexity.
To adapt to evolving traffic conditions, we adopt a rolling prediction mechanism, which re-estimates the Koopman operator with the arrival of new data. This ensures that predictions are always based on the latest information, transforming the nonlinear system identification problem into a linear one. This approach not only facilitates subsequent network-based decision-making but also enhances the accuracy and responsiveness of traffic management strategies, ensuring that the system remains robust and adaptive to real-time changes.

4.3. Graph Mamba

STG data, exemplified by traffic networks, exhibit dynamic, heterogeneous, and non-stationary properties, posing significant challenges for learning. STG learning involves understanding and forecasting the evolution of these networks, similar to state space transitions. The Mamba model has introduced novel capabilities for STG learning, effectively capturing the non-stationary and heterogeneous characteristics of such graphs. By integrating attention and recurrent structures, Selective SSM enhances the representation of temporal dynamics, improving predictive accuracy in various applications.
The Mamba model maps input signal x t R 1 × K to output signal y t R 1 × K through a hidden state h t R N × K . This transformation can be formalized as:
h ( t ) = A h ( t ) + B x ( t )
y ( t ) = C h ( t )
In these equations, h ( i ) is the derivative of h ( i ) , A R N × N , B R N × 1 , C R 1 × N can be expressed using the state transition matrix, input matrix, and output matrix. To adapt to real-world data, the SSM is discretized using the Zero-Order Hold (ZOH) assumption. Equations (14) and (15) can be solved iteratively as:
h t = A ¯ h t 1 + B ¯ x t
y t = C h t
In this context, A ¯ = exp ( Δ A ) and B ¯ = ( Δ A ) 1 ( exp ( Δ A ) I ) · Δ B are discretization parameters, with Δ = t i 1 , t i representing discrete time interval. To enhance computational efficiency and scalability, the iterative process in Equations (16) and (17) can be expressed in a convolutional form:
y = x K ¯
Here, K ¯ = C B ¯ , C AB ¯ , , C A ¯ k B ¯ , serves as the convolution kernel for the SSM, and ∗ denotes the convolution operation.
In the GM framework, highway observation points are represented as nodes, with edges connecting adjacent points to form a complex traffic network. Each node encapsulates a feature vector that includes current traffic parameters such as traffic volume, vehicle types, density, and speed, along with future traffic state predictions derived from KMD. It is important to note that the model implicitly accounts for the dynamic and aggregate effects of driver behavior (e.g., lane-changing in response to traffic conditions or emergency lane activation) through their direct impact on these observed macroscopic parameters. The complex interactions and temporal evolution of these parameters, influenced by underlying driver actions, are what the GM network is designed to capture and process, rather than modeling individual driver characteristics as explicit, time-varying inputs.
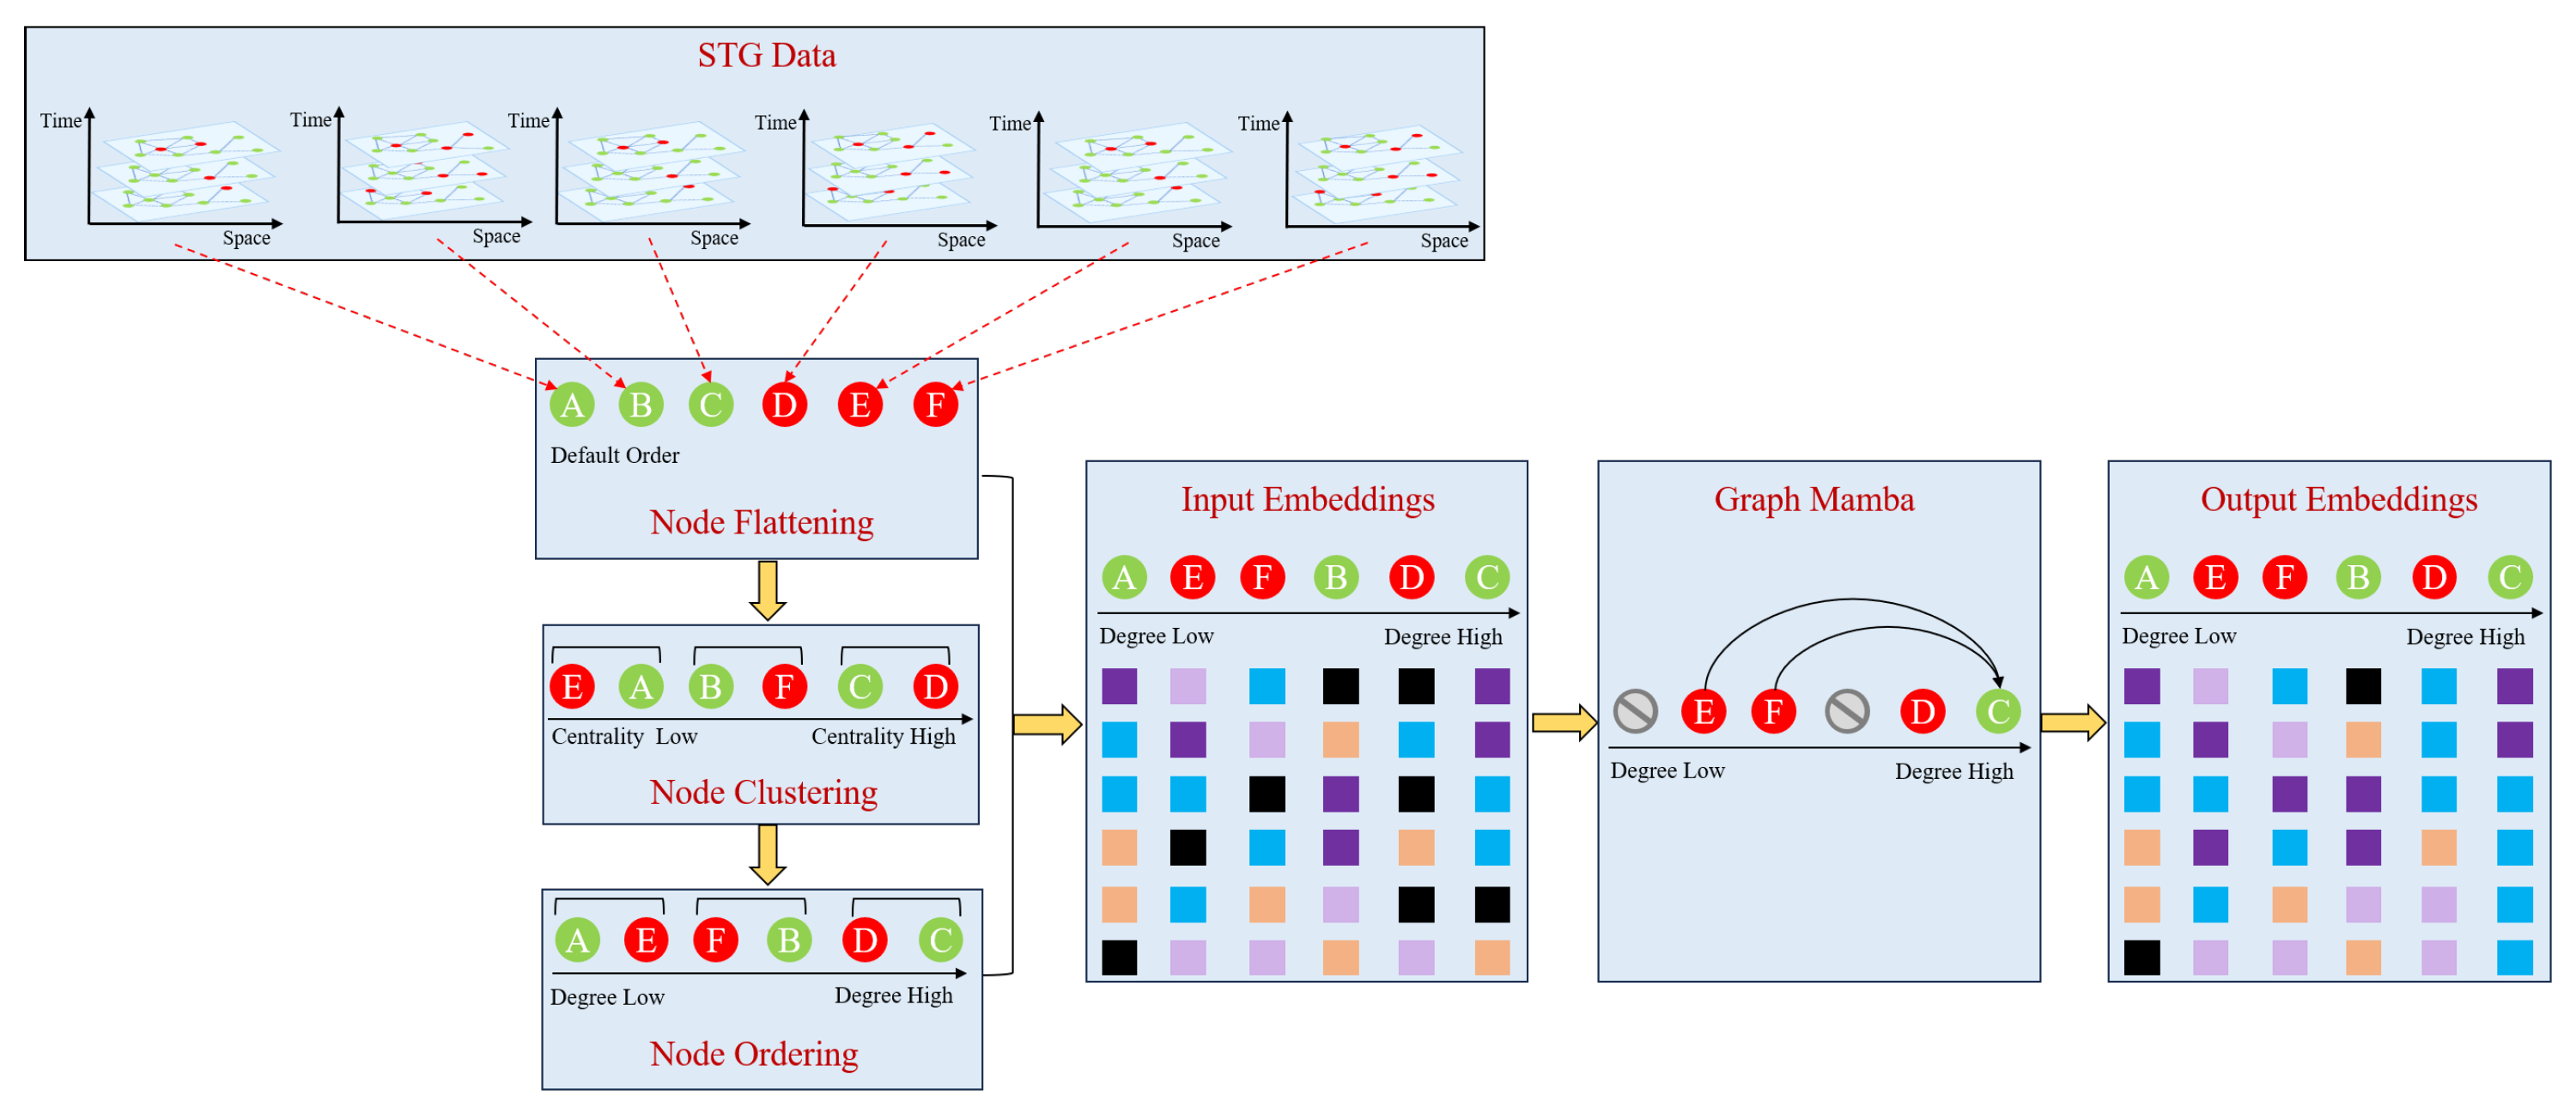
Adapting sequence models, such as Mamba, to graph-structured data presents significant challenges due to the unidirectional recurrent update, which restricts information flow based on node position. To address this, we introduce a node prioritization strategy for informed sparsification in KGM. As depicted in Figure 4, our approach involves flattening the nodes into a sequence through a three-step process. Firstly, nodes are clustered based on the modularity Q using the Louvain algorithm:
Q = 1 2 m i , j A i j k i k j 2 m δ c i , c j
In this context, A i j represents the edge weight between i and j, k i = j A i j is the sum of weights of the edges connected to node i and m = 1 2 i j A i j . Each node i is assigned to a cluster c i ,and δ c i , c j is defined as:
δ c i , c j = 1 c i = c j 0 otherwise
Secondly, the clusters are ordered according to the sum of node centrality e within each cluster, node centrality is defined as:
e i = 1 λ c j = c i A i j e j
where λ is a constant. Finally, the nodes within each cluster are sorted by node degree:
d i = c j = c i A i j
This method aims to incorporate local structure, overlooked in dense attention mechanisms [25]. More influential nodes are placed at the end of the sequence to ensure they have access to a broader context, enhancing the model’s ability to leverage comprehensive historical information and improving overall performance. By integrating these techniques, our approach mitigates the limitations of unidirectional updates and leverages the rich structural information inherent in graph-structured data, providing accurate and context-sensitive decision support. The overall algorithm of GM is presented in Algorithm 1.
Algorithm 1 The overall algorithm of GM
Input: Node embeddings X R K × D ; Node number N R K × 1
Output: Feature embeddings X R K × D
  1:
N = N + N 0 , 1
  2:
X 1 N 1 o u t s o r t , , X k N k o u t s o r t Louvain X N o u t s o r t
  3:
N o u t s o r t = A r g s o r t N
  4:
for  i = 1 , 2 , , k   do
  5:
     N i i n s o r t = A r g s o r t N i o u t s o r t
  6:
     N i n s o r t . a p p e n d N i i n s o r t
  7:
end for
  8:
X s o r t : K , D = X N i n s o r t
  9:
X n o r m : K , D = L a y e r N o r m X s o r t
10:
x : K , D = L i n e a r 0 X n o r m
11:
x : K , D = S i L U L i n e a r 1 X n o r m
12:
x S S M K , D = S i L U C o n v 1 d x
13:
B : K , N = L i n e a r B x S S M
14:
C : K , N = L i n e a r C x S S M
15:
Δ : K , D = s o f t p l u s L i n e a r Δ x S S M
16:
A ¯ : K , D , N = d i s c r e t i z e A Δ , A
17:
B ¯ : K , D , N = d i s c r e t i z e B Δ , A , B
18:
y : K , D = S S M A ¯ , B ¯ , C x SSM
19:
y n o r m : K , D = L a y e r N o r m y
20:
y : K , D = y n o r m x
21:
X : K , D = L i n e a r 2 y

4.4. Interpretable Decision Module

FNN combine the transparent IF-THEN rules of fuzzy logic with adaptive learning capabilities of neural networks. This integration allows FNN to iteratively refine their parameters, enhancing precision without relying heavily on expert knowledge, while also providing interpretable insights into decision-making processes. Due to this unique combination, FNN serve as effective tools in data mining and system modeling, capable of approximating non-linear functions to a high degree of accuracy. In this study, we have formulated the challenge of managing emergency lanes as a binary classification problem based on imprecise or uncertain data. To address this, we introduce an IDM characterized by its high precision in classification.
As depicted in Figure 5, the IDM architecture is composed of three distinct layers: an initial fuzzification layer, several intermediate fuzzy logic layers, and a final decision-making layer. The input vectors, representing various traffic features, are first transformed into fuzzy sets within the fuzzification layer, similar to the fuzzification phase in traditional fuzzy inference systems. Subsequently, the fuzzy logic layers use their node configurations to implement logical conjunctions and disjunctions, or ’and’ and ’or’ operations, through fuzzy intersection and union. This allows for the representation of fuzzy rules that govern the system’s behavior. Multiple stacked fuzzy logic layers facilitate the construction of more complex and sophisticated rule structures. Additionally, direct links or skip connections between nodes of the fuzzy logic layers and the final decision layer ensure that all nodes across the fuzzy logic tiers contribute to the final output, thus enhancing the module’s capacity to integrate diverse patterns and conditions. The decision layer then synthesizes the outcomes of the applied fuzzy rules and the recognized traffic patterns from KMD, generating the final action for emergency lane control. This approach supports a nuanced and context-sensitive decision-making process, which is crucial for the effective management of emergency lanes in dynamic traffic environments. Algorithm 2 details the overall algorithm of the IDM.
Algorithm 2 The overall algorithm of IDM
Input: Feature embeddings F = F 1 , , F t
              Rule R k : if F 1 is A 1 k and … F t is A t k , then class is c k with the weight ε k
Output: Decision c k
1:
Calculate the membership function value f A t k F t = exp f t μ t z 2 2 σ t z 2 of each input variable F on its own fuzzy set A t k = { < F , f A t k F > | F 0 , 1 } based on the mean μ t z and standard deviation σ t z of the Gaussian membership function
2:
Calculate the degree of activation a k = f A 1 k F 1 f A t k F t of F on each rule in the fuzzy rule base
3:
Calculate the degree of correlation h k = a k × ε k on each rule based on the degree of activation
4:
Calculate the cumulative score g c = R k R c h k , R c = R k c k = c
5:
Get classification result c k = arg max c g c

4.5. Training and Inference

To train the KGM, we define the cross-entropy loss function as:
L K G M = i = 0 n c i l a b e l log c i p r e d i c t
where c p r e d i c t represents the ouotput of KGM, c l a b e l denotes ground truth, n is batch size.
Algorithm 3 illustrates the forward pass through the KGM model. The KMD extracts traffic patterns from multimodal data and generates future forecasts. These patterns are subsequently processed through the Multi-Layer Perceptron (MLP) to produce the final node embeddings, which are used for decision-making. Given the prominence of Message-Passing Neural Networks (MPNN) in graph-based machine learning and the considerable attention they have garnered, Gated GCN stand out as a robust architecture within the MPNN framework. In the proposed KGM, two rounds of embedding updates are conducted using Gated GCN and GM on an input graph with K nodes, E edges, and an embedding size of D. Specifically, the Gated GCN updates both node and edge embeddings, whereas the GM updates only the node embeddings. The updated node embeddings from both the Gated GCN and GM are combined via the MLP to produce final output node embeddings. The IDM then utilizes these embeddings, along with the output from the KMD, to determine the activation of emergency lanes.
Algorithm 3 The overall algorithm of KGM
Input: Multimodal traffic data P = p 1 , , p t
Output: Decision c k
  1:
Q = Hankel DMD P
  2:
V , W = KMD Q
  3:
V KMD = MLP V
  4:
P ˜ = V e ω t b 0
  5:
Building STG: Node embeddings X i n i t R K × D ; Edge embeddings E i n i t R E × D ; Adjacency matrix A i n i t R K × K
  6:
X ^ G a t e d G C N m i d , E m i d = GatedGCN X i n i t , E i n i t , A i n i t
  7:
X ^ G M m i d = GM X i n i t
  8:
X G a t e d G C N = D r o p o u t X ^ G a t e d G C N m i d + X i n i t
  9:
X G M = D r o p o u t X ^ G M m i d + X i n i t
10:
X K G M = MLP X G a t e d G C N + X G M
11:
c k = IDM X K G M , V K M D

5. Experiments

5.1. Dataset

In this study, we aimed to develop a decision-making model for emergency lane control on highways. To achieve this, we utilized real-world data sourced from a 5-km segment of the Changshen Expressway (G25) between Nanjing and Changzhou, Jiangsu Province, China, as illustrated in Figure 6. Figure 6a shows the geographical distribution of the four observation points along the expressway, while Figure 6b provides a schematic diagram of the road segment geometry, clearly depicting the two travel lanes and one emergency lane (hard shoulder). This segment is a critical segment of a major national north-south artery, featuring two travel lanes and one emergency lane (hard shoulder) in each direction, with no intermediate interchanges within the studied section. Data collection was conducted on 1 May 2024 (a public holiday during the summer season) under clear weather conditions, spanning 280 min from 11:35 to 16:15, using four video observation points. This specific section was strategically selected for the experiment due to its documented susceptibility to congestion, particularly during holiday periods when traffic volume surges significantly. Furthermore, the presence of a temporary construction zone near the fourth observation point introduced an additional, dynamic bottleneck, creating a complex scenario ideal for testing the robustness and real-time responsiveness of our model. The dataset was compliant with traffic laws and accurately labeled, ensuring the quality and reliability of the data. As shown in Table 1, we gathered two categories of samples sequentially: activation and deactivation.
To analyze traffic flow parameters, we generated time-varying heatmaps that illustrate speed and density fluctuations, as shown in Figure 7. In Figure 7a, which represents speed data, the color scale ranges from red (low speed) to blue (high speed), measured in kilometers per hour (km/h). The x-axis represents time, and the y-axis represents distance along the road. The heatmap indicates that during peak hours, there is a significant reduction in average vehicle speed across all observation points due to heightened congestion, as reflected by the predominance of red areas. Conversely, off-peak hours, characterized by fewer vehicles and lower densities, exhibit higher speeds, indicated by blue areas, signifying improved traffic flow efficiency. Figure 7b displays the density data, with a color scale ranging from red (low density) to blue (high density), measured in vehicles per kilometer (Veh./km). The axes are the same as in Figure 7a. During peak hours, vehicle density escalates substantially at all locations, as indicated by the prevalence of blue areas. Off-peak hours, marked by dispersed vehicle travel, show lower density, represented by red areas. Unforeseen events, such as road construction, also influenced vehicle density; for example, an hour before the fourth observation point, there was a sharp rise in local vehicle density due to ongoing construction activities, underscoring the significance of real-time monitoring and prompt responses. This pattern highlights the interdependence between vehicle density and speed, where lower density facilitates swifter and more effective vehicular movement.
Through careful scrutiny of the peak and trough patterns in these visualizations, we discerned the principal temporal progression of traffic conditions. This systematic exploration not only provides insights into current traffic situations but also establishes a robust foundation for formulating more accurate decision-making models.

5.2. Implementation Details and Experimental Settings

The study section, spanning 5000 m, includes two travel lanes, each 3.75 m wide, and a single emergency lane, 3.5 m wide. The section is divided into 25 spatial segments, each approximately 200 m in length, which serves as the minimum decision unit for emergency lane activation. The experimental analysis determined that the optimal number of time window transitions N trans is 8, with the sum of switch state changes across all segments within a 30-min time window not exceeding this value. Additionally, the space constraint mandates that the aggregate number of lane components N component within an interval be limited to 5, allowing only configurations with a lane component count within the [0, 5] range. The threshold for activation, denoted as γ , is established at a value of 0.5.
The KGM was implemented using Python on a high-performance computing system, featuring 4 NVIDIA V100 Tensor Core 32G GPUs, an Intel Xeon Gold 6248R CPU running at 3.0 GHz and featuring 96 cores, along with 64 GB of RAM. The software environment includes Ubuntu 18.04 as the operating system, Python 3.9 for scripting, PyTorch 2.1.0 as the deep learning framework, CUDA 12.1 for GPU acceleration, and cuDNN 8.9.2 for deep neural network computations. During the training phase, we utilized a batch size of 64, and the AdamW optimization algorithm was chosen for its regularization properties. The initial learning rate was set to 1 × 10 3 , with a weight decay factor of 5 × 10 2 to mitigate overfitting. A Cosine Annealing with Warm Restarts (CosineAnnealingLR) [30] schedule was adopted for dynamic learning rate adjustment, with a maximum of 50 iterations and a minimum learning rate of 1 × 10 5 . The entire training process spanned 500 epochs, which was sufficient for the model to converge to a stable and optimal state.
For training, validation, and testing, the dataset was partitioned in a 6:2:2 ratio along the temporal axis. Data preprocessing involved normalizing all samples to the [0, 1] interval using MinMax scaling. To ensure the accuracy of model, data cleaning techniques were applied to remove outliers in traffic volume, vehicle density, and speed from different detection sections. The source code has been released on https://github.com/zhanggun/KGM, accessed on 25 September 2025.

5.3. Evaluation Metrics

To quantify the performance of emergency lane activation model and ensure its continuous optimization in practical applications, we have developed a comprehensive set of performance evaluation metrics. These include the confusion matrix, accuracy, precision, recall, and F1-score. In emergency lane control, these metrics translate to real-world impacts. High precision prevents unwarranted activations that could lead to traffic confusion or safety hazards, while high recall ensures that emergency lanes are activated when needed, potentially preventing traffic jams and facilitating timely emergency responses. The F1-score helps strike a balance between these two concerns, ensuring the model performs robustly in varied traffic conditions.

5.4. Experimental Results and Analysis

5.4.1. Traffic Pattern Analysis

Figure 8 provides a visualization of the eigenvalues of the Koopman operator, which is instrumental in elucidating the dynamic traffic patterns over time and distance. The x-axis denotes time in hours, the y-axis represents distance in kilometers, and the z-axis illustrates the distribution of eigenvalue parameters, categorized into three distinct layers by two horizontal planes. The upper layer, characterized by a prominent red peak, corresponds to SST, indicating periods of high average speeds and minimal congestion. During SST, traffic flows efficiently with few disruptions, enabling vehicles to maintain consistent speeds and safe distances. The middle layer, marked by several smaller peaks, represents MSBDC. This layer signifies scenarios where multiple dispersed bottlenecks occur simultaneously, leading to widespread congestion and reduced overall traffic efficiency. The lower layer, more uniform in appearance, is AOC, characterized by periodic fluctuations in traffic speed with more frequent decelerations than accelerations. AOC indicates that during these periods, traffic flow is less efficient, with vehicles frequently slowing down or stopping, often due to minor disturbances when traffic volume approaches road capacity.
Observation Point 4, which includes an entrance and exit to a service area, introduces additional complexity. The presence of the service area leads to uneven periodic fluctuations in traffic velocity, with more frequent decelerations and occasional higher-speed intervals. Furthermore, an accident at Observation Point 4 adversely affects traffic conditions at Observation Points 2 and 3, causing significant congestion. The accident triggers a ripple effect, exacerbating the MSBDC pattern at these points, resulting in further reduced throughput and increased congestion. The ability of KMD to identify and analyze the complex interactions between different traffic patterns, including the impact of an accident at one point on others, underscores its value in real-time traffic management and emergency response.
These visualized patterns provide a robust theoretical foundation for emergency lane control, offering insights into the spatio-temporal dynamics of traffic flow. The KMD effectively captures these features, enabling the IDM to make context-sensitive and proactive decisions to enhance traffic management and mitigate congestion. The IDM architecture consists of an initial fuzzification layer, several intermediate fuzzy logic layers, and a final decision-making layer. The fuzzification layer transforms raw traffic feature vectors into fuzzy sets, allowing the system to handle imprecise or uncertain data. The intermediate fuzzy logic layers, equipped with node configurations that perform logical conjunctions and disjunctions, enable the representation of complex rule structures through fuzzy intersection and union operations. These layers can be stacked to build sophisticated rule systems, and direct connections to the final decision layer ensure that all nodes contribute to the output, enhancing the network’s ability to integrate diverse patterns. The decision layer synthesizes the results from the applied fuzzy rules and the recognized traffic patterns from KMD, leading to precise and context-sensitive actions for emergency lane control. This approach not only iteratively refines parameters for greater accuracy but also maintains interpretability, making it a powerful tool for managing dynamic traffic environments and optimizing emergency lane usage.

5.4.2. Correlation Analysis

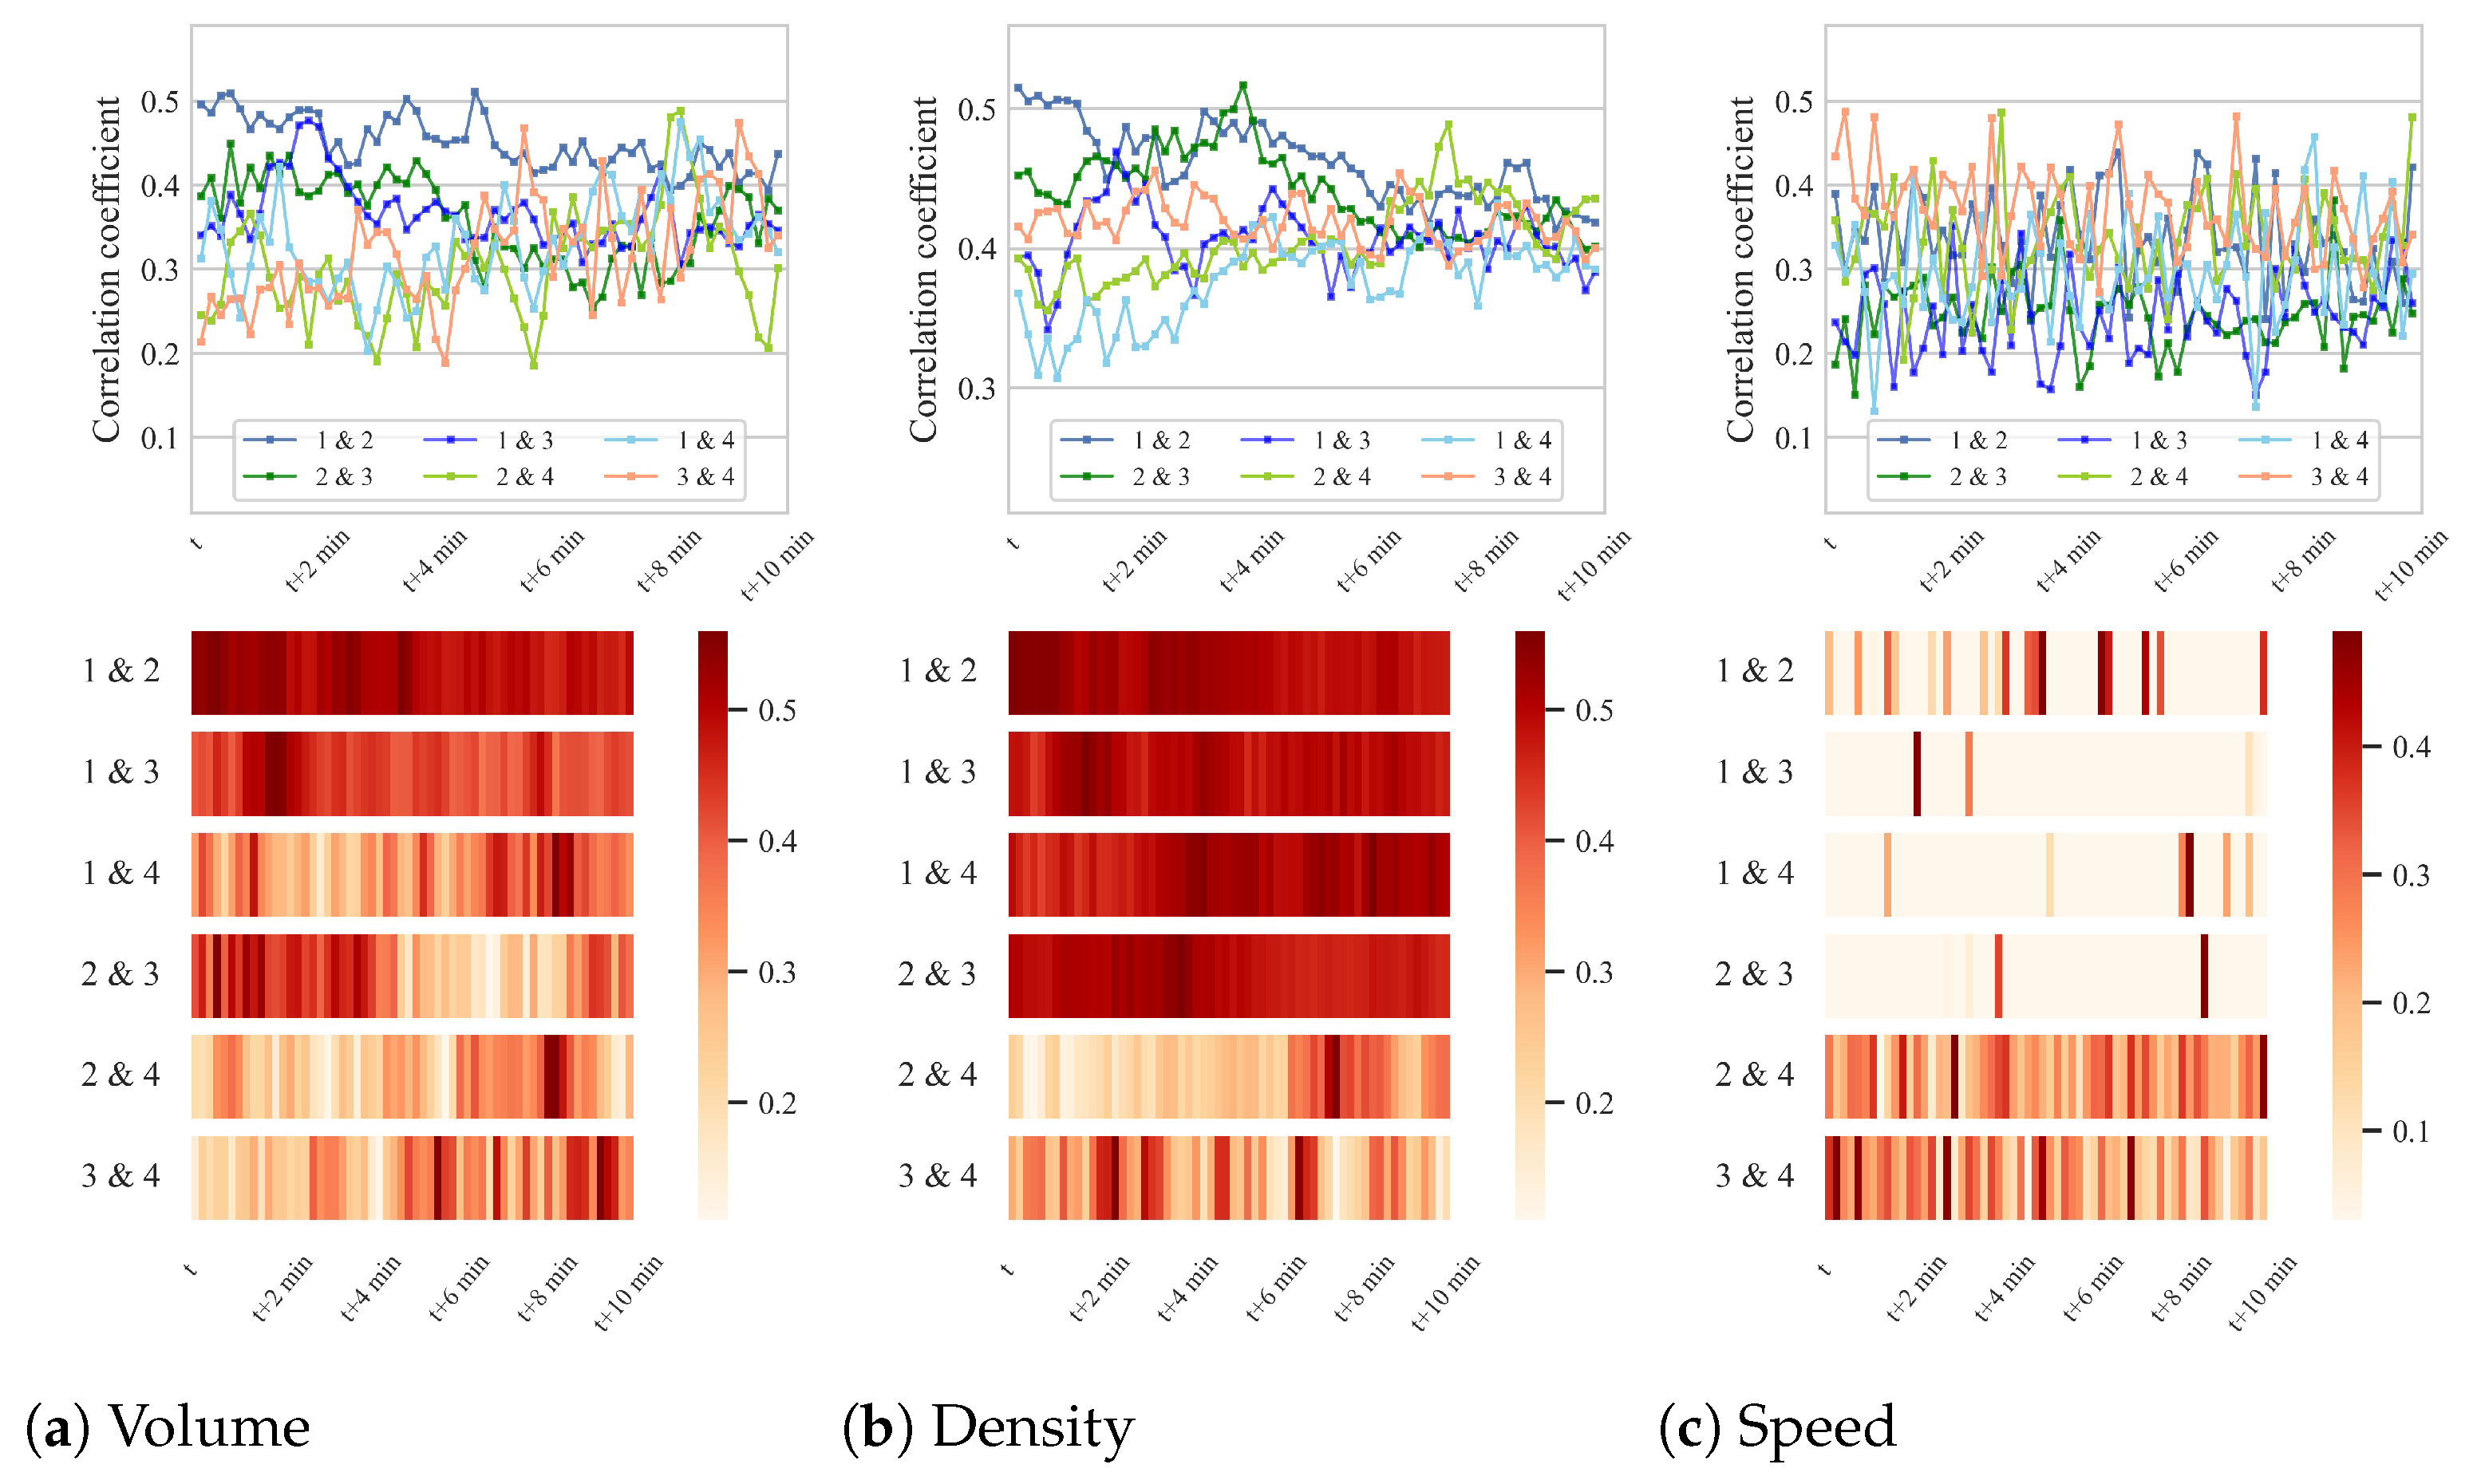
Identifying periods of strong correlation not only elucidates the temporal propagation of traffic conditions but also provides a critical foundation for real-time congestion prediction and informed decision-making regarding the activation of emergency lanes to alleviate potential bottlenecks. To investigate the dynamic interrelationships among traffic parameters at various observation points over time, we analyzed the time-lagged correlations of traffic volume, density, and speed, as illustrated in Figure 9. Specifically, the traffic volume at Observation Point 1 immediately influences Observation Point 2, affects Observation Point 3 after a two-minute delay, and significantly impacts Observation Point 4 approximately five minutes later. The density at Observation Point 2 affects Observation Point 3 after four minutes and has a pronounced effect on Observation Point 4 around seven minutes later. Additionally, the speed at Observation Points 2 and 3 exerts an intermittent impact on Observation Point 4 within a one-to-ten-minute window.
From this analysis, it is evident that the dynamic interrelationships among traffic parameters at each observation point, as evidenced by the time-lagged correlations in traffic volume, density, and speed, highlight the necessity of constructing the STG. These interrelationships, characterized by variable lags and influences across different points, indicate a complex, interdependent system that evolves over time. The STG effectively captures these intricate dynamics, providing a more comprehensive understanding of traffic condition propagation throughout the network. This graphical structure is essential for accurate traffic variation prediction and supports advanced decision-making models for emergency lane control.

5.4.3. Comparative Analysis

In this study, comparative experiments were conducted to evaluate the KGM model against nine other models for real-time decision-making in emergency lane control. The models include Graph-based methods such as Hypergraph Convolutional Recurrent Neural Network (HGC-RNN) [31], STSGCN, Spatial-Temporal Graph ODE (STGODE) [32], DSTHGCN [33], 3D-STGPCN [34], Spatial–Temporal Complex Graph Convolution Network (ST-CGCN) [35], and Prior Knowledge Enhanced Time-Varying Graph Convolution Network (PKET-GCN) [36], excel at capturing spatial and temporal relationships but can struggle with dynamic changes and computational efficiency, especially in large-scale scenarios. Mamba-based methods, such as Mamba and GMN, offer efficient processing through SSM but may lack the interpretability and fine-grained control required for nuanced traffic management.
The KGM model addresses these limitations by integrating several key innovations. It leverages KMD to reduce the dimensionality of input data and, through its structured SSM, ensures linear computational complexity, making it highly efficient for real-time applications and enabling it to handle large-scale and dynamic traffic data more effectively. Additionally, KGM incorporates a node prioritization mechanism that optimizes the processing of critical information, reducing unnecessary computations and improving accuracy. The IDM provides context-sensitive and interpretable decisions, ensuring both efficiency and transparency. A significant advantage of KGM is its capability to handle multimodal traffic data, which is essential for comprehensive and accurate real-time decision-making. In real-world traffic management, data often comes from multiple sources, such as video feeds, sensor data, and historical traffic patterns. By integrating and processing these diverse data types, KGM can provide a more holistic view of traffic conditions, enhancing its ability to make informed and reliable decisions. This multimodal data handling, combined with the model’s other innovative features, makes KGM particularly well-suited for the dynamic and heterogeneous nature of traffic environments.
To validate the KGM model, we conducted preliminary experiments using three public datasets: NGSIM [15], PeMS04, and PeMS08 [37,38], in addition to real road dataset. The NGSIM dataset was specifically selected for its unique value in providing high-resolution, microscopic vehicle trajectory data, which allows for validating the model’s capability to capture fundamental driver behaviors (e.g., lane-changing) that underpin macroscopic traffic patterns. This complements the macroscopic flow data from PeMS and our real-world dataset, enabling a more comprehensive evaluation across different data granularities. NGSIM, compiled by the US Federal Highway Administration, provides a detailed, microscopic view of traffic, capturing vehicle locations, lane positions, and relative positions at 0.1-s intervals on segments of the US-101 and I80 highways. PeMS04 and PeMS08, sourced from the California Department of Transportation’s Performance Measurement System (PeMS), offer real-time traffic data including volume, speed, and occupancy, recorded at 5-min intervals. We preprocessed the data by aggregating measurements into 5-min intervals, resulting in 288 time steps per day, and applied Z-score normalization to ensure consistency and suitability [39]. Experimental results, summarized in Table 2, highlight the superior performance of KGM across key evaluation metrics, including accuracy, precision, recall, and F1-score. Specifically, KGM demonstrates high precision and recall rates, effectively distinguishing between situations requiring and not requiring the activation of the emergency lane. This minimizes both false positives and false negatives, which is crucial for reliable decision-making. The F1-score is notably higher for KGM, indicating its balanced and robust performance. These findings underscore the high accuracy of KGM, making it a highly effective model for real-time decision-making in emergency lane control. The combination of enhanced computational efficiency, interpretability, and the ability to handle multimodal traffic data positions KGM as a robust and reliable solution for real-world traffic management systems.

5.5. Ablation Study

To evaluate individual contributions of each component to the performance of KGM, we conducted an ablation study, the results of which are summarized in Table 3. The first row represents the performance of KGM with its full architecture. Subsequent rows illustrate the model’s performance after systematically removing or substituting a single component, while keeping the remaining components constant.
  • Row 2: In this configuration, the GM is replaced with a Transformer architecture. The significant decline in performance highlights the critical role of GM in capturing complex spatio-temporal dependencies and the superiority of the structured SSM over attention-based methods. The SSM framework ensures linear computational complexity, making it more efficient and effective for real-time traffic management.
  • Row 3: This row excludes the IDM and uses the MLP for direct classification. The drop in performance demonstrates the value of the IDM in providing context-sensitive and interpretable decisions, which are crucial for managing emergency lanes in dynamic traffic environments.
  • Row 4: This row evaluates the model without the KMD. Instead, the STG is constructed directly from historical traffic data, and IDM relies solely on the output of GM for decision-making. The absence of KMD leads to a reduction in performance, underscoring the importance of KMD in extracting traffic patterns and enhancing the model’s predictive capabilities.
  • Row 5: Here, the node prioritization mechanism is eliminated, and a random flattening method is adopted instead. The degradation in performance indicates that the node prioritization mechanism is essential for effectively handling the hierarchical and dynamic nature of traffic data, ensuring that the most important nodes are given higher priority in the decision-making process.
The ablation study reveals that each component positively contributes to the overall effectiveness of KGM. Notably, the GM has the most significant impact on performance, followed by the IDM, the KMD, and the node prioritization mechanism. The results underscore the importance of each component and validate the design choices made in the KGM framework.

5.6. Computational Efficiency

A key advantage of the proposed KGM model is its enhanced computational performance and efficient memory utilization. To quantitatively evaluate these attributes, we use two well-established metrics: the number of Floating Point Operations (FLOPs) and inference time. As shown in Table 2, KGM achieves competitive inference times across all datasets (1.65 s on real-world, 1.67 s on NGSIM, 1.60 s on PeMS04, and 1.62 s on PeMS08), which are comparable to or better than other efficient models like STSGCN and GMN while maintaining superior accuracy. This efficiency is particularly beneficial for real-time applications and in resource-constrained environments.
  • KMD: The KMD component significantly reduces the dimensionality of input data, leading to a decrease in the number of FLOPs required for subsequent processing. By extracting traffic patterns, KMD streamlines the data, thereby reducing the computational load and improving overall efficiency.
  • GM: The SSM employed in the GM ensures linear computational complexity, which is crucial for handling large-scale and dynamic traffic data. Compared to attention-based models, the GM architecture achieves lower FLOPs and faster inference times, making it more suitable for real-time traffic management.
  • Node Prioritization: This mechanism optimizes the processing of nodes by prioritizing the most relevant ones, thereby reducing unnecessary computations. While node prioritization slightly increases inference time, it has a negligible effect on the overall performance of KGM. By focusing on critical nodes, the model can achieve faster and more efficient decision-making without compromising accuracy, which is essential for dynamic environments.
  • IDM: The IDM, while providing context-sensitive and interpretable decisions, increases the inference time but greatly enhances decision accuracy. Its modular structure and optimized decision-making process are designed to balance the trade-off between computational efficiency and interpretability. Although the increase in inference time is a trade-off, the significant improvement in decision accuracy justifies this additional computational cost.
The experimental results, summarized in Table 2 and Table 3, demonstrate that KGM achieves an optimal balance between prediction accuracy and computational efficiency. Specifically, the integration of KMD and GM architecture leads to the most significant improvements in FLOPs and inference time. The node prioritization and IDM further enhance the model’s effectiveness by optimizing the processing and decision-making steps. These findings underscore the effectiveness of the KGM in achieving both high performance and computational efficiency, making it well-suited for real-time emergency lane control.

5.7. Discussion

The effectiveness of the KGM is evident when comparing the original distribution of emergency lane decision samples (Figure 10a) with the distribution of feature vectors extracted by KGM (Figure 10b) and the visualization of KGM decision results (Figure 10c). Specifically, “Activation” denotes the scenario where the emergency lane is actively utilized, whereas “Deactivation” signifies that the emergency lane is not in use.
In Figure 10a, the original data distribution exhibits a non-linear and indistinguishable nature due to overlapping multimodal patterns, which introduces ambiguity in distinguishing activation from deactivation states. This complexity arises from the inherent multimodal characteristics of traffic data, where various factors such as traffic volume, density, and speed intertwine in non-linear ways. Traditional decision-making approaches struggle to model these intricate relationships directly, as linear classifiers or threshold-based methods cannot disentangle the entangled feature space, leading to suboptimal or unstable decisions. However, upon applying KMD and GM for feature extraction, the feature vectors depicted in Figure 10b become markedly more distinguishable. KMD identifies and extracts meaningful features from multimodal traffic data, revealing underlying patterns that were previously obscured. These patterns are subsequently processed by GM, which maps them into a space where the deactivation and activation states are more clearly separated. This transformation is crucial for enhancing both the interpretability and accuracy of the decision-making process. Figure 10c visualizes the decision results obtained by combining the KMD-extracted traffic patterns with the output of GM. The clarity of the “activation” and “deactivation” distributions in Figure 10c can be attributed to the effective feature extraction and transformation process. KMD initially disentangles the complex data distribution by identifying key traffic patterns, while GM further enhances the separability of these patterns in the transformed space. Consequently, this results in a decision boundary that accurately distinguishes between different states, making the decision results more interpretable and reliable. The IDM leverages these inputs to formulate optimized decisions concerning emergency lane control. By framing the control of emergency lanes as a binary classification task, the IDM predicts the necessity for activation or deactivation based on the extracted features. The integration of fuzzy rule outcomes with KMD-recognized traffic patterns enables context-sensitive and holistic decision-making, ensuring both robustness and interpretability. This comprehensive approach enables the IDM to consider multiple factors simultaneously, including real-time traffic conditions, historical data, and traffic patterns, thereby leading to more informed and adaptive decisions.
Overall, the KGM effectively addresses the challenges posed by the non-linear and indistinguishable nature of the original data. By leveraging advanced feature extraction techniques such as KMD and GM, followed by the IDM’s sophisticated decision-making capabilities, the KGM provides a robust theoretical foundation for emergency lane control. This approach not only enhances the accuracy and reliability of decisions but also contributes significantly to the optimization of traffic flow and safety in dynamic and complex highway environments.

5.8. Limitation

While the KGM framework demonstrates effective performance in dynamic emergency lane control, certain limitations should be acknowledged. First, as a macroscopic decision-making model, KGM operates at the segment level and does not capture the fine-grained physical interactions described by continuum models, which can simulate the precise evolution of traffic flow fields. Second, although safety improvements are achieved indirectly through congestion mitigation, the current model does not explicitly incorporate real-time safety metrics (e.g., time-to-collision) as optimization objectives. These limitations highlight aspects where the model could be further enhanced in subsequent research.

6. Conclusions and Future Work

In this paper, we have tackled the challenges of emergency lane control within ITS by proposing the KGM framework. KGM integrates the Koopman operator with a graph-based SSM, enabling dynamic, real-time decision-making for emergency lane activation. By employing KMD, our approach identifies and predicts spatiotemporal traffic patterns, which are crucial for proactive management. The GM network, enhanced with an attention mechanism, efficiently processes complex interactions among road segments, facilitating timely and informed decisions. Furthermore, an IDM based on FNN synthesizes context-sensitive and integrated actions, further enhancing the decision-making process. Our comprehensive evaluation, conducted using a real-world Chinese road dataset and three public datasets, has demonstrated that KGM outperforms state-of-the-art methods in terms of both accuracy and computational efficiency, with a complexity of O n . This work provides a robust theoretical foundation and a practical solution for dynamic emergency lane control, contributing to improved safety and efficiency on highways.
For future work, we aim to enhance the KGM framework by incorporating more sophisticated traffic models and additional sensor data, such as weather and road surface conditions, to further improve the accuracy and reliability of emergency lane control. Additionally, we will explore the integration of reinforcement learning techniques, allowing KGM to learn from its environment and achieve more autonomous and adaptive decision-making. These advancements, along with further investigation into lane-by-lane traffic flow dynamics during emergency lane operations, are expected to contribute to the development of smarter and safer transportation systems.

Author Contributions

Conceptualization, H.Z. and W.H.; Formal analysis, L.X.; Investigation, L.X.; Methodology, H.Z.; Validation, Z.W.; Visualization, H.L. and Z.W.; Writing—original draft, H.L.; Writing—review & editing, W.H. All authors have read and agreed to the published version of the manuscript.

Funding

This research received no external funding.

Data Availability Statement

The data used to support the findings of this study is available from the corresponding author upon request.

Conflicts of Interest

The authors declare no conflicts of interest.

References

  1. Benzagouta, M.-L.; Aniss, H.; Fouchal, H.; El Faouzi, N.-E. Road-Side Unit Anomaly Detection. Vehicles 2023, 5, 1467–1481. [Google Scholar] [CrossRef]
  2. Cristiani, A.L.; Immich, R.; Akabane, A.T.; Madeira, E.R.M.; Villas, L.A.; Meneguette, R.I. ATRIP: Architecture for Traffic Classification Based on Image Processing. Vehicles 2020, 2, 303–317. [Google Scholar] [CrossRef]
  3. Simchon, L.; Rabinovici, R. Real-Time Implementation of Green Light Optimal Speed Advisory for Electric Vehicles. Vehicles 2020, 2, 35–54. [Google Scholar] [CrossRef]
  4. Feng, Z.; Zhan, J.; Liu, J.; Zhang, W.; Zhou, M.; Wang, K. Development and Validation of Highway Emergency Lane Illegal Occupancy Scale for Chinese Drivers. Transp. Res. Rec. 2017, 2634, 43–49. [Google Scholar] [CrossRef]
  5. Wang, S.; Lei, D.; Menggeng, Q.; Yu, X.; Li, W.; Zhang, Q.; Feng, J.; Wang, J. Design and Research of Emergency Activation Model for Highway Emergency Lane. In Proceedings of the 2025 4th International Conference on Big Data, Information and Computer Network, Guangzhou, China, 10–12 January 2025; pp. 517–523. [Google Scholar]
  6. Dai, Y.; Ding, F.; Peng, J.; Tan, H.; Ran, B. Traffic Characteristics for Long-Term Use of Emergency Lane: An Exploratory Field Test on G42 Freeway in China. In Proceedings of the 20th COTA International Conference of Transportation Professionals, CICTP, Xi’an, China, 14–16 August 2020; pp. 607–617. [Google Scholar]
  7. Li, D.; Lasenby, J. Mitigating urban motorway congestion and emissions via active traffic management. Res. Transp. Bus. Manag. 2023, 48, 100789. [Google Scholar] [CrossRef]
  8. Guerrieri, M.; Mauro, R. Capacity and safety analysis of hard-shoulder running (HSR). A motorway case study. Transp. Res. Part A Policy Pract. 2016, 92, 162–183. [Google Scholar] [CrossRef]
  9. Coffey, S.; Park, S. Part-time shoulder use operational impact on the safety performance of interstate 476. Traffic Inj. Prev. 2020, 21, 470–475. [Google Scholar] [CrossRef]
  10. Dutta, N.; Boateng, R.A.; Fontaine, M.D. Safety and operational effects of the interstate 66 active traffic management system. J. Transp. Eng. Part A Syst. 2019, 145, 04018089. [Google Scholar] [CrossRef]
  11. Li, R.; Zhen, Y.; Li, B. Optimal control and simulation of hard shoulder running on highways. J. Syst. Simul. 2019, 30, 34. [Google Scholar]
  12. Zhou, W.; Yang, M.; Lee, M.; Zhang, L. Q-learning-based coordinated variable speed limit and hard shoulder running control strategy to reduce travel time at freeway corridor. Transp. Res. Rec. 2020, 2674, 915–925. [Google Scholar] [CrossRef]
  13. Li, R.; Zhen, Y.; Li, B.; Zhan, X. Simulation of hard shoulder running combined with queue warning during traffic accident with CTM model. IET Intell. Transp. Syst. 2017, 11, 1–8. [Google Scholar] [CrossRef]
  14. Tang, J.; Hu, L.; Li, M.; Zhang, X. Optimization of Highway Emergency Lane Control Based on Kriging Genetic Algorithm. J. Syst. Simul. 2024, 36, 11. [Google Scholar]
  15. Avila, A.M.; Mezi, I. Data-driven analysis and forecasting of highway traffic dynamics. Nat. Commun. 2020, 11, 2090. [Google Scholar] [CrossRef]
  16. Zhang, K.; Hao, W.-N.; Yu, X.-H.; Jin, D.-W.; Yu, K. A fuzzy neural network classifier and its dual network for adaptive learning of structure and parameters. Int. J. Fuzzy Syst. 2023, 25, 1034–1054. [Google Scholar] [CrossRef]
  17. Sun, W.; Abdullah, L.N.; Suhaiza Sulaiman, P.; Khalid, F. Meta-Feature-Based Traffic Accident Risk Prediction: A Novel Approach to Forecasting Severity and Incidence. Vehicles 2024, 6, 728–746. [Google Scholar] [CrossRef]
  18. Yang, Z.; Zhang, Q.; Chang, W.; Xiao, P.; Li, M. EGFormer: An Enhanced Transformer Model with Efficient Attention Mechanism for Traffic Flow Forecasting. Vehicles 2024, 6, 120–139. [Google Scholar] [CrossRef]
  19. Hadadi, F.; Tehrani, H.G.; Aghayan, I. An extended non-lane-discipline-based continuum model through driver behaviors for analyzing multi-traffic flows. Phys. A Stat. Mech. Its Appl. 2023, 625, 128965. [Google Scholar] [CrossRef]
  20. Hadadi, F.; Aghayan, I. An extended LWR non-lane-based-discipline model for light vehicle traffic flow analysis incorporating driver behavior. Chin. J. Phys. 2025, 97, 591–606. [Google Scholar] [CrossRef]
  21. Yu, B.; Yin, H.; Zhu, Z. Spatio-Temporal Graph Convolutional Networks: A Deep Learning Framework for Traffic Forecasting. In Proceedings of the Twenty-Seventh International Joint Conference on Artificial Intelligence, Stockholm, Sweden, 13–19 July 2018. [Google Scholar]
  22. Song, C.; Lin, Y.; Guo, S.; Wan, H. Spatial-temporal synchronous graph convolutional networks: A new framework for spatial-temporal network data forecasting. In Proceedings of the AAAI Conference on Artificial Intelligence, New York, NY, USA, 7–12 February 2020. [Google Scholar]
  23. Liu, C.; Yang, S.; Xu, Q.; Li, Z.; Long, C.; Li, Z.; Zhao, R. Spatial-Temporal Large Language Model for Traffic Prediction. In Proceedings of the 25th IEEE International Conference on Mobile Data Management, Brussels, Belgium, 24–27 June 2024. [Google Scholar]
  24. Ahamed, M.A.; Cheng, Q.S. TimeMachine: A Time Series is Worth 4 Mambas for Long-Term Forecasting. In Proceedings of the 27th European Conference on Artificial Intelligence, Santiago de Compostela, Spain, 19–24 October 2024. [Google Scholar]
  25. Wang, C.; Tsepa, O.; Ma, J.; Wang, B. Graph-mamba: Towards long-range graph sequence modeling with selective state spaces. arXiv 2024, arXiv:2402.00789. [Google Scholar]
  26. Behrouz, A.; Hashemi, F. Graph mamba: Towards learning on graphs with state space models. In Proceedings of the 30th ACM SIGKDD Conference on Knowledge Discovery and Data Mining, Barcelona, Spain, 25–29 August 2024. [Google Scholar]
  27. Li, L.; Wang, H.; Zhang, W.; Coster, A. Stg-mamba: Spatial-temporal graph learning via selective state space model. arXiv 2024, arXiv:2403.12418. [Google Scholar]
  28. Li, Z.; Han, M.; Yin, X. MamKO: Mamba-based Koopman operator for modeling and predictive control. In Proceedings of the Thirteenth International Conference on Learning Representations, Singapore, 24–28 April 2025. [Google Scholar]
  29. Schönhof, M.; Helbing, D. Empirical features of congested traffic states and their implications for traffic modeling. Transp. Sci. 2007, 41, 135–166. [Google Scholar] [CrossRef]
  30. Loschilov, I.; Hutter, F. SGDR: Stochastic Gradient Descent with Warm Restarts. In Proceedings of the 5th International Conference on Learning Representations, Toulon, France, 24–26 April 2017. [Google Scholar]
  31. Yi, J.; Park, J. Hypergraph Convolutional Recurrent Neural Network. In Proceedings of the 26th ACM SIGKDD Conference on Knowledge Discovery and Data Mining, Virtual Event, 23–27 August 2020. [Google Scholar]
  32. Fang, Z.; Long, Q.; Song, G.; Xie, K. Spatial-Temporal Graph ODE Networks for Traffic Flow Forecasting. In Proceedings of the 27th ACM SIGKDD Conference on Knowledge Discovery and Data Mining, Virtual Event, 14–18 August 2021. [Google Scholar]
  33. Wang, J.; Zhang, Y.; Wei, Y.; Hu, Y.; Piao, X.; Yin, B. Metro Passenger Flow Prediction via Dynamic Hypergraph Convolution Networks. IEEE Trans. Intell. Transp. Syst. 2021, 22, 7891–7903. [Google Scholar] [CrossRef]
  34. Nguyen, M.-P.; Dao, M.-S.; Nguyen, T.-B. 3D-STGPCN: 3D Spatio-Temporal Graph Point-wise Convolutional Network for Traffic Forecasting. In Proceedings of the 2022 IEEE International Conference on Big Data, Osaka, Japan, 17–20 December 2022. [Google Scholar]
  35. Bao, Y.; Huang, J.; Shen, Q.; Cao, Y.; Ding, W.; Shi, Z.-Q.; Shi, Q. Spatial-Temporal Complex Graph Convolution Network for Traffic Flow Prediction. Eng. Appl. Artif. Intell. 2023, 212, 106044. [Google Scholar] [CrossRef]
  36. Bao, Y.; Liu, J.; Shen, Q.; Cao, Y.; Ding, W.; Shi, Q. PKET-GCN: Prior knowledge enhanced time-varying graph convolution network for traffic flow prediction. Inf. Sci. 2023, 634, 359–381. [Google Scholar] [CrossRef]
  37. Chen, C.; Petty, K.; Skabardonis, A.; Varaiya, P.; Jia, Z. Freeway performance measurement system: Mining loop detector data. Transp. Res. Rec. 2001, 1748, 96–102. [Google Scholar] [CrossRef]
  38. Chen, Y.; Segovia-Dominguez, I.; Gel, Y.R. Z-GCNETs: Time Zigzags at Graph Convolutional Networks for Time Series Forecasting. In Proceedings of the 38th International Conference on Machine Learning, Virtual, 18–24 July 2021. [Google Scholar]
  39. Li, Y.; Yu, R.; Shahabi, C.; Liu, Y. Diffusion Convolutional Recurrent Neural Network: Data-Driven Traffic Forecasting. In Proceedings of the 6th International Conference on Learning Representations, Vancouver, BC, Canada, 30 April–3 May 2018. [Google Scholar]
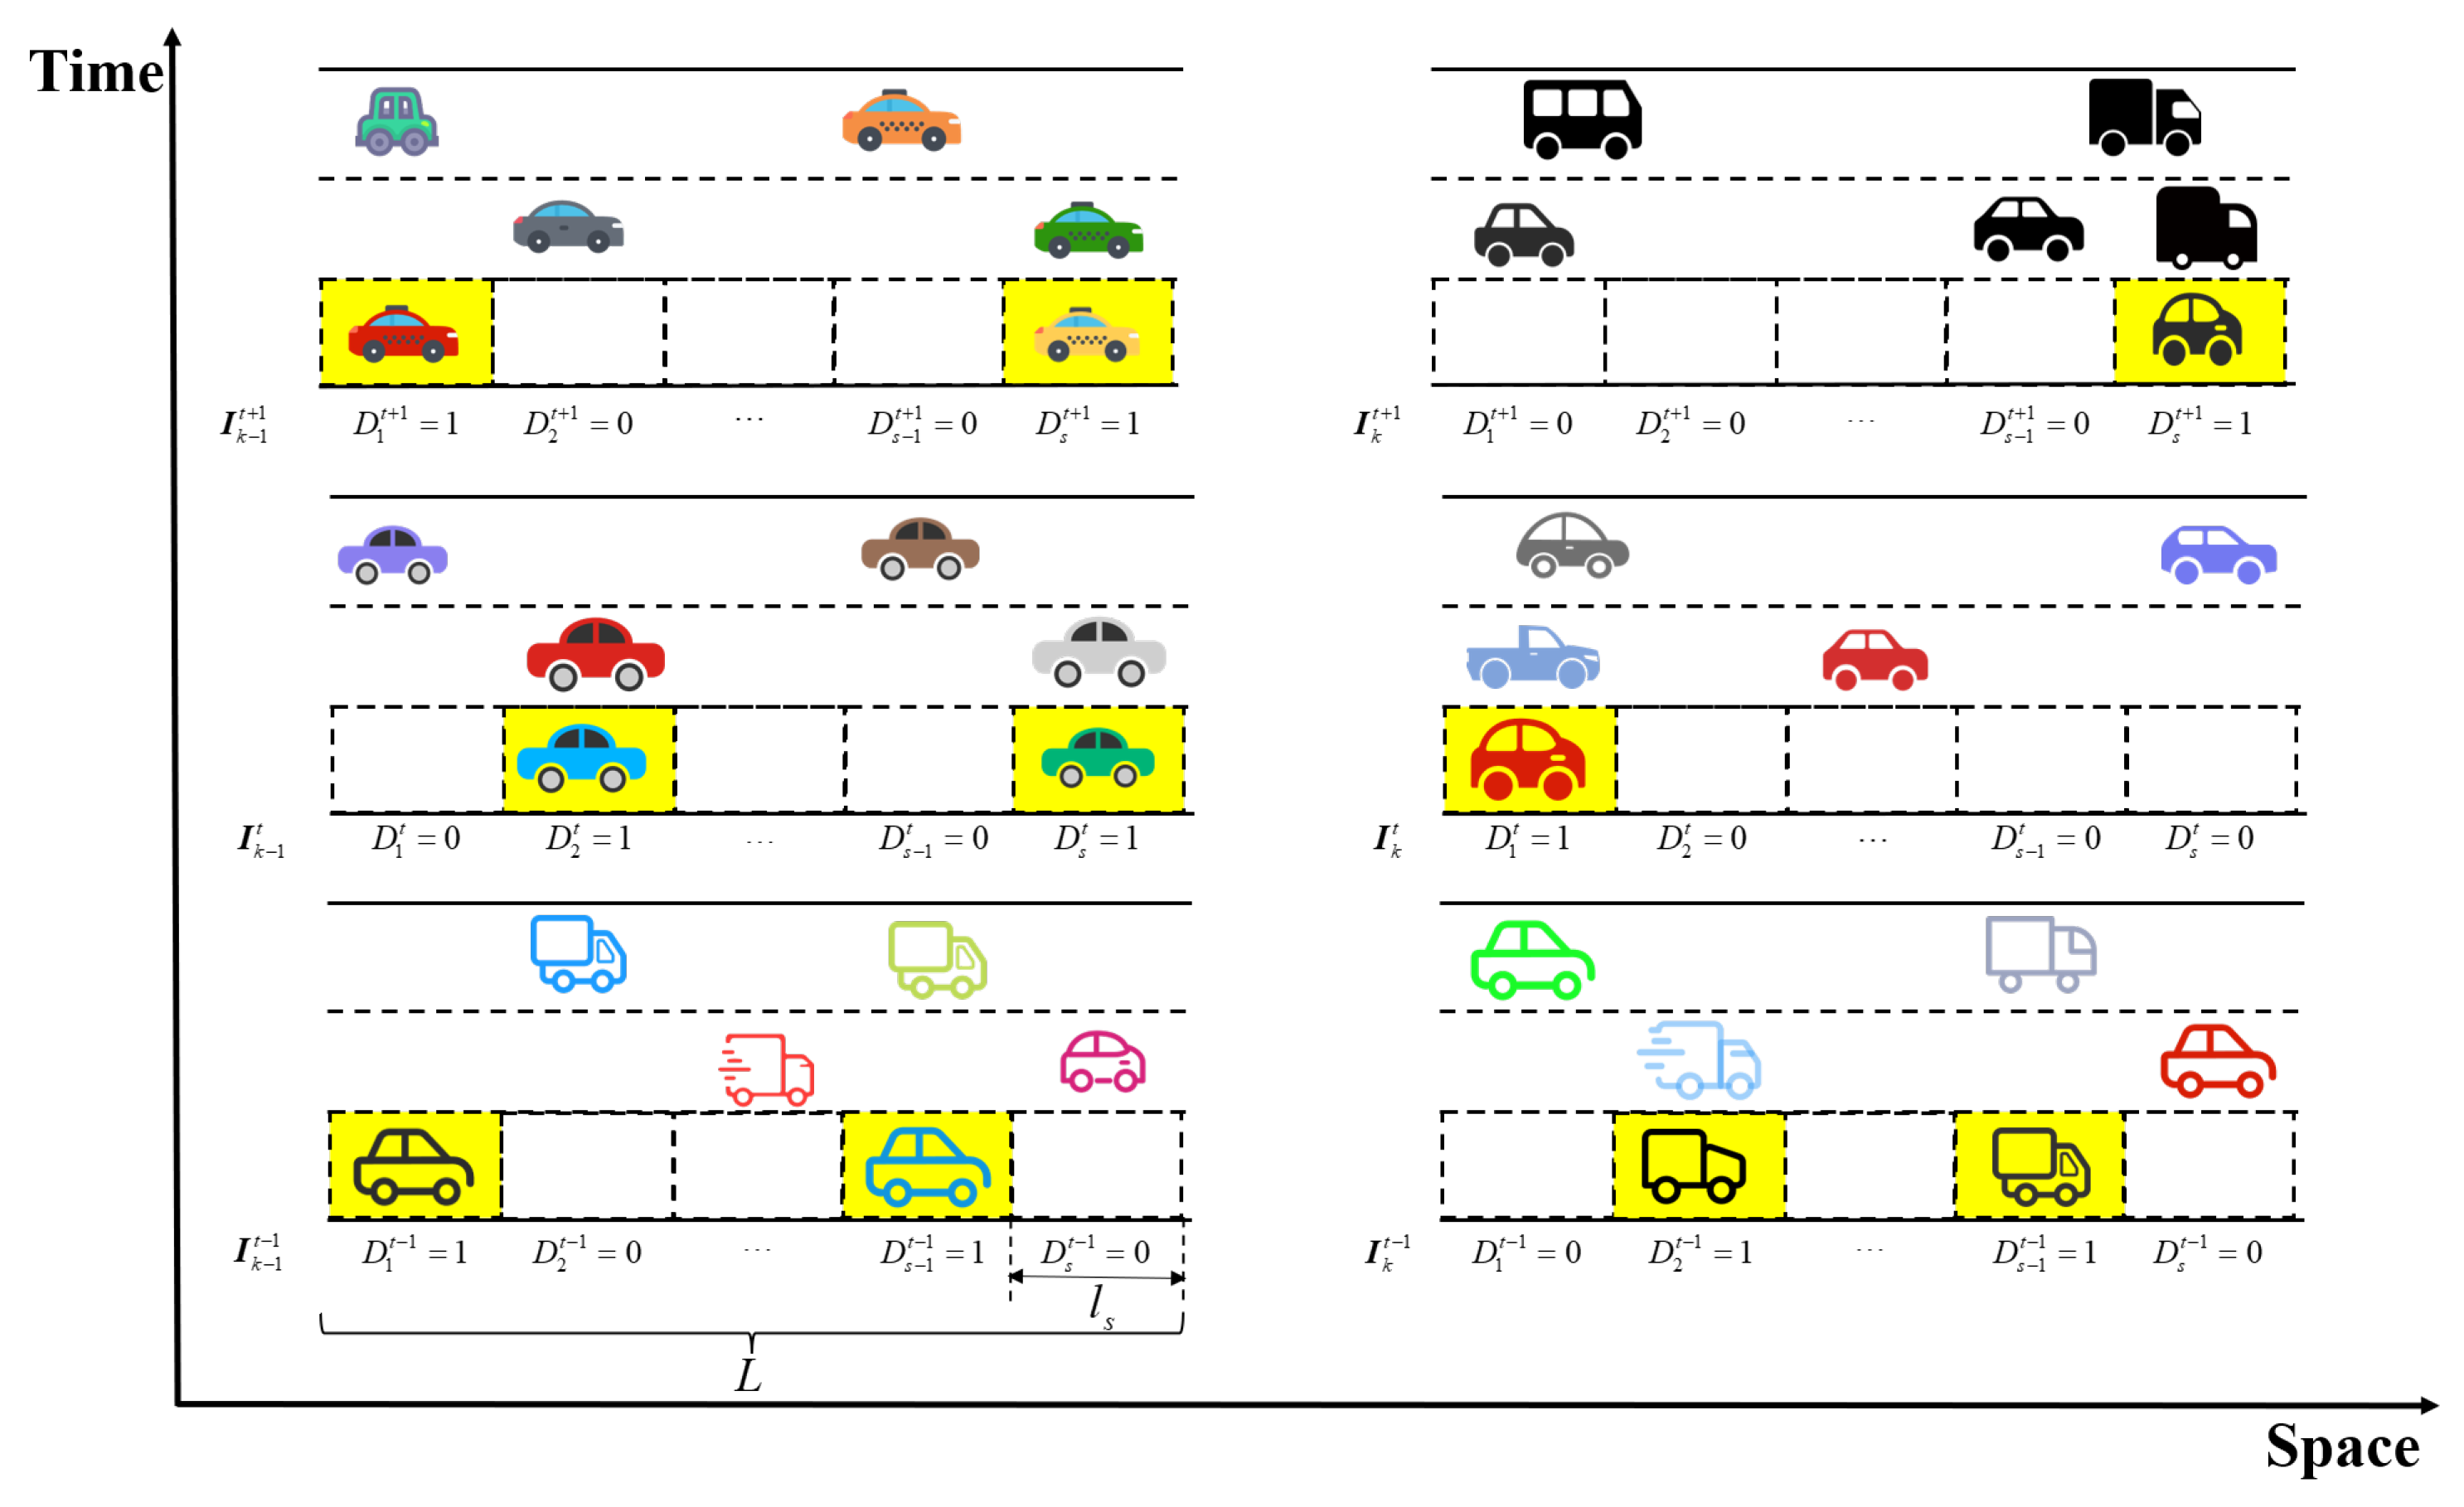
Figure 1. Highway emergency lane control diagram.
Vehicles 07 00129 g001
Figure 2. Overview of Koopman Graph Mamba architecture.
Vehicles 07 00129 g002
Figure 3. Schematic of the Koopman Mode Decomposition procedure.
Vehicles 07 00129 g003
Figure 4. Schematic of node prioritization and selection mechanism of Graph Mamba.
Vehicles 07 00129 g004
Figure 5. Structure of Interpretable Decision Module.
Vehicles 07 00129 g005
Figure 6. Study area overview.
Vehicles 07 00129 g006
Figure 7. Time-varying heatmaps illustrating speed and density fluctuations.
Vehicles 07 00129 g007
Figure 8. Visualization of traffic patterns.
Vehicles 07 00129 g008
Figure 9. Correlation of traffic flow parameters at different observation points.
Vehicles 07 00129 g009
Figure 10. Comparison of visualization results.
Vehicles 07 00129 g010
Table 1. Sample distribution of the dataset.
Observation PointActivationDeactivation
1 t 33 , 264 325 , 1639 t 265 , 324
2 t 192 , 203 256 , 315 356 , 649 771 , 1345 t 204 , 225 316 , 355 650 , 770
3 t 1 , 403 529 , 672 865 , 1607 t 404 , 528 673 , 864
4 t 922 , 1312 t 487 , 921
Table 2. Comparative experiment results. The top three results are highlighted in red, green, and blue.
ModelSourceReal-World Road DatasetNGSIM Dataset
Acc. Pre. Rec. F1 Time Acc. Pre. Rec. F1 Time
HGC-RNN [31]KDD 20200.8990.8920.9050.8982.4000.7040.6590.6630.6612.540
STSGCN [22]AAAI 20200.9420.9510.9530.9521.6500.7460.7990.6630.7251.680
STGODE [32]KDD 20210.8960.8630.9380.8991.9000.7340.6790.7000.6892.050
DSTHGCN [33]TITS 20210.9210.9300.9080.9191.7300.7470.7990.6640.7251.860
3D-STGPCN [34]BigData 20220.9090.9020.9150.9081.6800.7370.7210.7260.7241.820
ST-CGCN [35]EAAI 20230.9340.9330.9320.9331.8200.7510.7730.6960.7321.810
PKET-GCN [36]ISCI 20230.9400.9400.9370.9391.9200.7590.7760.7120.7431.960
MambaICML 20240.9270.9360.9340.9351.8600.7720.8030.7170.7581.850
GMN [26]KDD 20240.9570.9620.9690.9651.8000.7810.8020.7160.7561.730
KGMOurs0.9640.9730.9760.9781.6500.7960.8380.7410.7861.670
ModelSourcePEMS04 DatasetPEMS08 Dataset
Acc.Pre.Rec.F1TimeAcc.Pre.Rec.F1Time
HGC-RNN [31]KDD 20200.7350.7530.7120.7322.2700.7170.7060.5840.6392.480
STSGCN [22]AAAI 20200.7470.7440.7660.7551.5200.7160.7960.5980.6831.620
STGODE [32]KDD 20210.7420.7510.7330.7421.8300.7170.7950.6020.6851.960
DSTHGCN [33]TITS 20210.7530.7630.7440.7531.6600.7310.7440.7160.7301.780
3D-STGPCN [34]BigData 20220.7360.7490.7230.7361.6600.7170.7920.6030.6851.720
ST-CGCN [35]EAAI 20230.7730.8180.7090.7601.8600.7170.7940.6020.6851.840
PKET-GCN [36]ISCI 20230.7510.7070.7700.7371.8900.7340.7910.6470.7121.910
MambaICML 20240.7840.7930.7770.7851.8100.7400.7960.7520.7731.840
GMN [26]KDD 20240.8040.8050.8090.8071.7600.7390.7970.7500.7721.780
KGMOurs0.8090.8550.7510.7991.6000.7420.8020.7520.7761.620
Table 3. Ablation study of KGM (KGM: Koopman Graph Mamba; GM: Graph Mamba; IDM: Interpretable Decision Module; KMD: Koopman Mode Decomposition; FLOPs: Floating Point Operations; w/o: without).
ModelF1Inference TimeFLOPs
KGM0.9781.65 s 2.69 × 10 9
w/o GM0.9464.06 s 8.28 × 10 9
w/o IDM0.9541.17 s 1.95 × 10 9
w/o KMD0.9612.21 s 4.73 × 10 9
w/o Node Prioritization0.9671.48 s 2.69 × 10 9
Disclaimer/Publisher’s Note: The statements, opinions and data contained in all publications are solely those of the individual author(s) and contributor(s) and not of MDPI and/or the editor(s). MDPI and/or the editor(s) disclaim responsibility for any injury to people or property resulting from any ideas, methods, instructions or products referred to in the content.