1. Introduction
The United States has approximately 4 million miles of paved roads, yet according to the American Society of Civil Engineers (ASCE) 2025 Report Card [
1], about 39% of public roads are in poor to mediocre conditions. This deterioration leads to billions of dollars in pavement and vehicle maintenance costs annually. Pavement distress is a major contributor to the rising maintenance costs of both pavements and vehicles. Among the most critical pavement distresses are potholes, which contribute to approximately 500 fatal accidents each year in the U.S. Furthermore, in 2021 [
2] alone, pothole-related vehicle damage cost Americans over
$26.5 billion.
Government agencies are striving to keep up with the increasing number of pothole reports and perform the necessary maintenance. However, with the continued rise in the number of vehicles and the expanding roadway network, addressing these issues effectively remains a challenge. A 2022 AAA survey [
2] found that 1 in 10 drivers required repairs due to pothole-related damage. One of the key challenges in pothole mitigation is their unpredictable formation, as they result from a combination of factors such as weather conditions, traffic loads, and underlying pavement weaknesses.
Traditional pothole inspection methods rely on trained professionals manually surveying road sections to identify and report pavement deficiencies. While this approach has been standard for years, it is labor-intensive, time-consuming, and increasingly inefficient given the growing scale of road maintenance needs.
Another critical need for the efficient detection and localization of potholes is the safe deployment of Connected and Autonomous Vehicles (CAVs), especially as transportation agencies increasingly explore the implications of CAV adoption on existing infrastructure [
3]. Autonomous Vehicles (AVs) rely primarily on two integrated systems: the
perception system, responsible for self-localization and environmental understanding, and the
decision-making system, which governs navigation and motion planning [
4]. Both systems are fundamental to ensuring the safe and effective operation of AVs.
The perception system is equipped with a suite of advanced sensors, including LiDAR, cameras, GPS, and radar, which collectively enable the vehicle to detect and classify environmental elements such as other vehicles, pedestrians, traffic signs, and roadway features. To enhance navigation and environmental awareness, AVs commonly utilize high-definition (HD) maps that offer rich semantic and geometric information, such as lane boundaries, road markings, roadside infrastructure, and speed limits, allowing for centimeter-level localization accuracy. These HD maps, such as those provided by companies like HERE, can be updated in near real-time through internet connectivity.
However, AVs cannot rely solely on HD maps, as they are limited by update latency and require constant internet access. In scenarios where connectivity is lost or road conditions change rapidly, such as the sudden appearance of a pothole, reliance on pre-downloaded maps becomes insufficient. Therefore, AVs must be capable of autonomously detecting road surface defects in real time to ensure safe navigation and minimize the risk of damage or accidents.
A key enabler of such real-time perception is the Advanced Driver-Assistance System (ADAS), which leverages sensors like cameras and LiDAR to support functions such as cruise control, lane keeping, and collision avoidance. When integrated with artificial intelligence (AI) and computer vision algorithms, ADAS can be extended to detect and localize road surface defects, such as potholes, effectively. This integration not only enhances driving safety and comfort but also facilitates continuous monitoring and maintenance of road infrastructure by enabling a crowdsourced approach to pothole detection and reporting.
2. Related Work
In recent years, there has been a significant increase in the application of artificial intelligence and sensor-driven systems for pothole detection and reporting. The advances in deep learning, computer vision, and embedded hardware technologies allowed researchers to propose a wide range of solutions, with many leveraging convolutional neural network (CNN)-based object detectors, such as YOLO variants, Single Shot Multibox Detector (SSD), and others, to analyze street-level imagery or aerial footage for the identification and localization of road potholes.
Multiple studies implemented low-cost, edge-based systems using a Raspberry Pi computer and OAK-D. For instance, Jeffreys et al. [
5] mounted Raspberry Pi 4+ units with EfficientDet-Lite0 and TL-VGG models on garbage trucks to detect potholes; the results showed 85% and 65% in precision and recall, respectively. Moreover, Asad et al. [
6] deployed Tiny-YOLOv4 on Raspberry Pi with OAK-D for real-time detection at 31 frames per second (FPS) and achieved 90% accuracy. Heo et al. [
7] also tested multiple YOLO versions for pothole detection. The results showed that SPFPN-YOLOv4 tiny achieved the highest mean average precision (mAP) of 79.6%, while estimating pothole distance and size using monocular vision.
Aerial-based pothole detection has seen growing adoption through the integration of unmanned aerial vehicles (UAVs) equipped with computer vision models. For example, Parmar et al. [
8] and Alzamzami et al. [
9] employed UAVs to capture high-resolution road surface imagery, leveraging YOLOv5 through YOLOv8 for object detection. Among these, YOLOv8 demonstrated superior performance, achieving precision and recall rates of up to 96% and 92%, respectively [
8]. Additionally, Pehere et al. [
10] highlighted the effectiveness of UAVs using traditional image processing techniques, such as edge detection and morphological filtering, reporting 80% precision and 74.4% recall.
Hybrid systems that fuse visual and non-visual data streams have demonstrated promising results in pothole detection. Silvester et al. [
11] combined SSD-based image detection with inertial measurements from accelerometers and gyroscopes to enhance detection reliability. Similarly, Xin et al. [
12] employed a crowdsourced approach by leveraging smartphone GPS and video data, achieving a 6% improvement in performance compared to conventional methods. In another study, Matouq et al. [
13] developed a YOLOv8-based detection framework that integrates GPS data and camera calibration for real-time pothole detection and area estimation, reporting a mAP of 93%. In addition, P. and B.K. [
14] proposed a self-deployed model to detect potholes in various weather conditions using thermal imaging. The model was validated on 300 images in various weather conditions and achieved outstanding results with about 98% in precision.
LiDAR-based approaches have demonstrated high accuracy in pothole detection, particularly for detailed 3D surface profiling. Talha et al. [
15] utilized mobile LiDAR synchronized with GNSS to generate cross-sectional road images, which were then analyzed using YOLOv5n and YOLOv5s, achieving a detection accuracy of 98%. In another study, Salcedo et al. [
16] integrated UNet-based semantic segmentation with YOLOv5 and EfficientDet for object detection on annotated road datasets such as IDD and RDD2020. Their segmentation model attained an average precision (AP) of 94%, while object detection performance ranged from 63% to 74% AP, depending on the detector used.
In addition, other research has focused on comparative evaluations of CNN architectures for object detection. For example, Ping et al. [
17] benchmarked YOLOv3, SSD, Histogram of Oriented Gradients (HOG) with Support Vector Machine (SVM), and Faster R-CNN on 2036 smartphone-captured images, reporting YOLOv3 as the most accurate with 82% accuracy. Moreover, Yik et al. [
18] integrated YOLOv3 with the Google Maps API to enhance geolocation capability, achieving 90% precision and an mAP of 65%.
Earlier approaches, such as the method proposed by Koch and Brilakis [
19], relied on classical image processing techniques to segment defective pavement regions using histogram thresholding and geometric modeling, achieving an accuracy of 86%. Another research by Bharadwaj et al. [
20] proposed an approach to detect potholes using software designed through MATLAB that processes images from a camera placed on top of an AV. The results showed a limitation related to lighting conditions, where the approach did not perform well under inconsistent lighting conditions.
Although the use of Advanced Driver Assistance Systems (ADAS) for pothole detection has gained some attention, only a limited number of studies have explored this approach in depth. For example, studies [
21,
22] proposed methodologies that analyze grayscale images to detect the features of a pothole, such as width and length. In their approach, the camera view must be mounted at the front bottom of a vehicle. Similarly, Martins et al. [
23] presented an approach that evaluated multiple AI models that analyze images from a front-facing camera, achieving a mAP of approximately 72%.
Across these studies, YOLOv5 and YOLOv8 have consistently demonstrated strong performance in terms of both detection speed and accuracy. The use of UAVs and edge devices further enables flexible and scalable deployment in diverse environments. Moreover, the integration of GNSS and IMU data significantly improves localization precision and system reliability. Recent developments increasingly focus on real-time operation and the feasibility of large-scale deployment, reflecting a shift toward practical implementation in intelligent transportation systems.
With the rapid emergence of new technologies, it is important to acknowledge that solutions like LiDAR and UAVs come with notable drawbacks. While LiDAR technology is becoming more affordable due to technical advancements, it remains a costly addition to most systems compared to conventional cameras. Similarly, drones, despite their ability to cover large areas efficiently, are limited by their short flight duration and the need for frequent recharging. In contrast, vehicle-mounted cameras present a more cost-effective alternative, providing a continuous stream of data as they operate on roads where vehicles naturally travel.
This paper contributes to the ongoing efforts for wider deployment of autonomous vehicles by ensuring safer and more efficient navigation of AVs on roads with potholes. It also establishes a foundation for leveraging crowdsourced pothole data to assist transportation agencies in more effective maintenance planning. This contribution is achieved by evaluating the integration of artificial intelligence, object detection techniques, a GNSS navigation system, and an ADAS-like camera, which is already deployed in production-level vehicles, for real-time pothole detection, enabling AVs to accurately identify and avoid road potholes while supporting data-driven infrastructure management.
3. Methodology
3.1. Hardware Overview
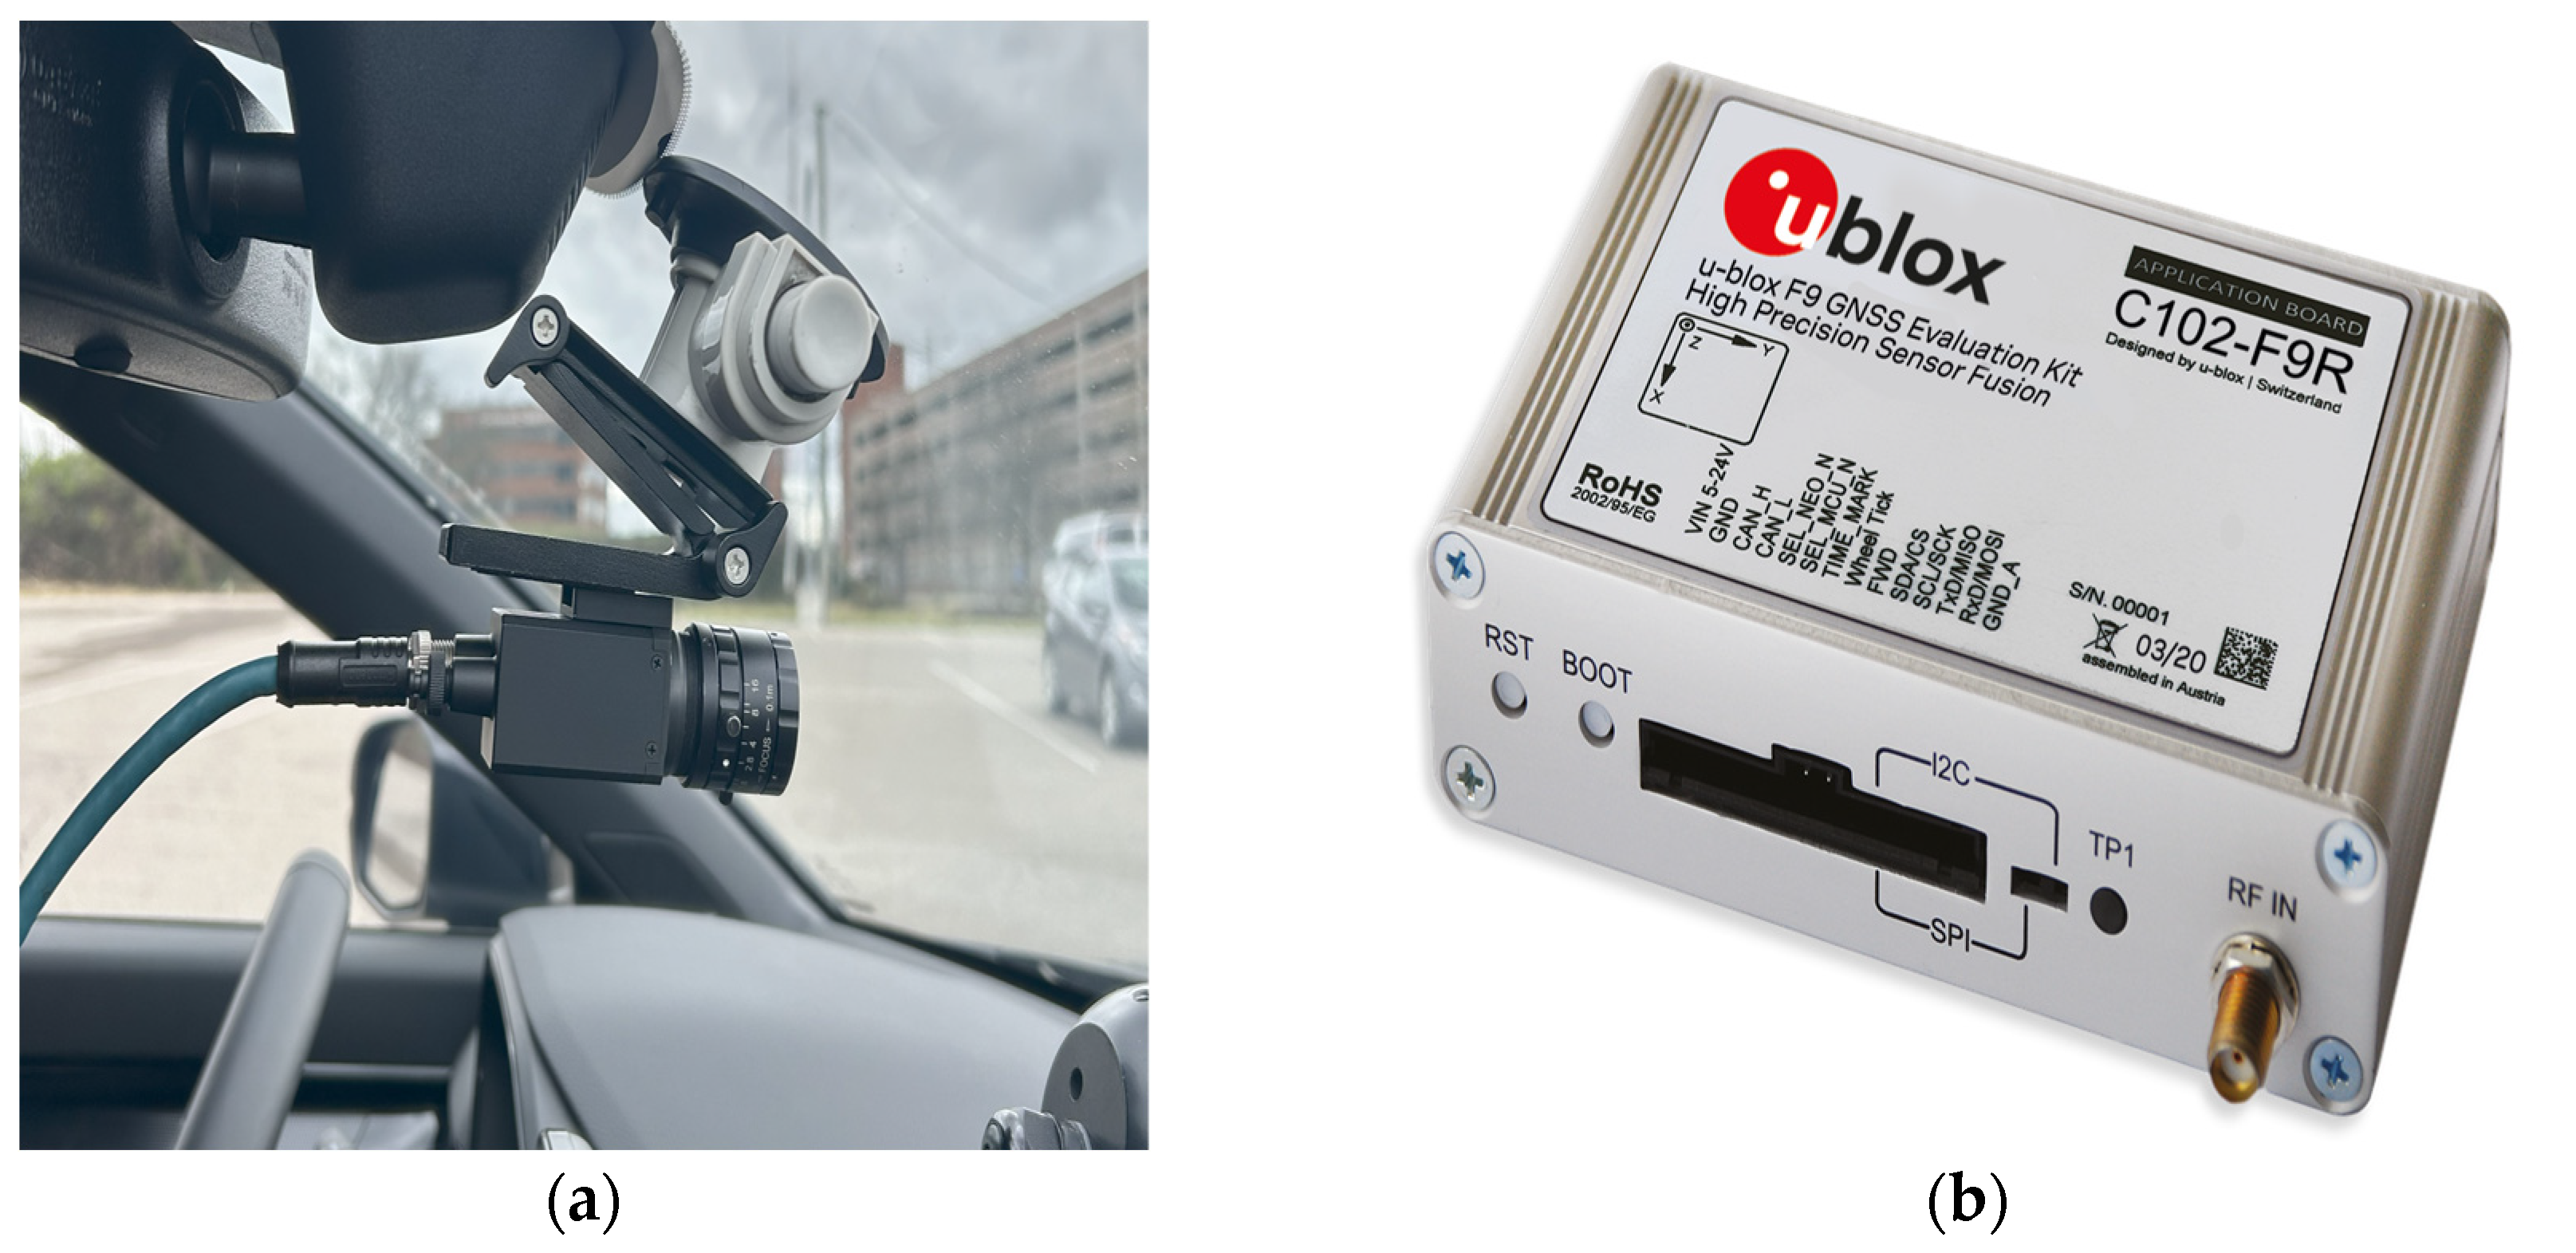
Figure 1 illustrates the hardware system used in this study. The primary sensors include a Lucid Triton TRI054S camera (LUCID Vision Labs, Richmond, BC, Canada) equipped with a 12.5 mm lens
Figure 1a and a GNSS receiver (u-blox, Thalwil, Switzerland)
Figure 1b, which is the navigation system that is being used in production-level vehicles. These sensors were connected to a Lenovo P16 Gen2 laptop (Lenovo, Whitsett, NC, USA) featuring an Intel i9 processor and an NVIDIA RTX 4070 GPU. As shown in
Figure 1, the camera location, which was mounted on the windshield of an SUV near the rearview mirror at a 5° downward tilt from level, is the same location as the camera utilized in the Advanced Driver Assistance System (ADAS), providing a clear view of the road ahead. The camera was configured to operate at 10 frames per second (fps), while the GPS system was calibrated to run at 50 Hz, enabling high-precision pothole localization.
3.2. Algorithm Overview
Figure 2 below illustrates the overall workflow of the proposed algorithm. Data collection, pothole detection, and post-processing were all implemented within the Robot Operating System (ROS) framework. ROS is a flexible middleware platform that offers a suite of software libraries and tools for building robotic applications. A fundamental component of ROS is the node, which operates either as a publisher (sending data) or a subscriber (receiving data). In this algorithm, a custom ROS node, entirely developed in Python version 3.8.10 programming language, was created to collect images and GPS data from sensors. Captured images are analyzed for pothole detection using the YoloV8n model. After a pothole detection, a dedicated ROS topic is published containing the pothole-related information, which are (1) the number of potholes in the image, (2) GPS coordinates, (3) pothole’s relative location with respect to the front of the vehicle (left of vehicle, center of vehicle, right of vehicle). Finally, detection results were stored in a ROS bag file (ros bag) in 30 min intervals of recording, which enables real-time offline post-processing and analysis. As outlined in the introduction, the reporting functionality in the algorithm is designed to serve infrastructure maintenance agencies for long-term maintenance planning. Details on the reporting mechanism will be discussed in a later section.
3.3. Detection Model
The primary objective of this paper is to detect potholes in real time. To achieve this, the Ultralytics YOLO object detection model, considered a state-of-the-art solution in the field, was selected. Ultralytics YOLO represents the latest advancement in the YOLO (You Only Look Once) series, specifically designed for real-time object detection and image segmentation tasks. YOLO models use an end-to-end convolutional neural network that simultaneously predicts bounding boxes and class probabilities in a single forward pass, making them highly efficient for real-time applications.
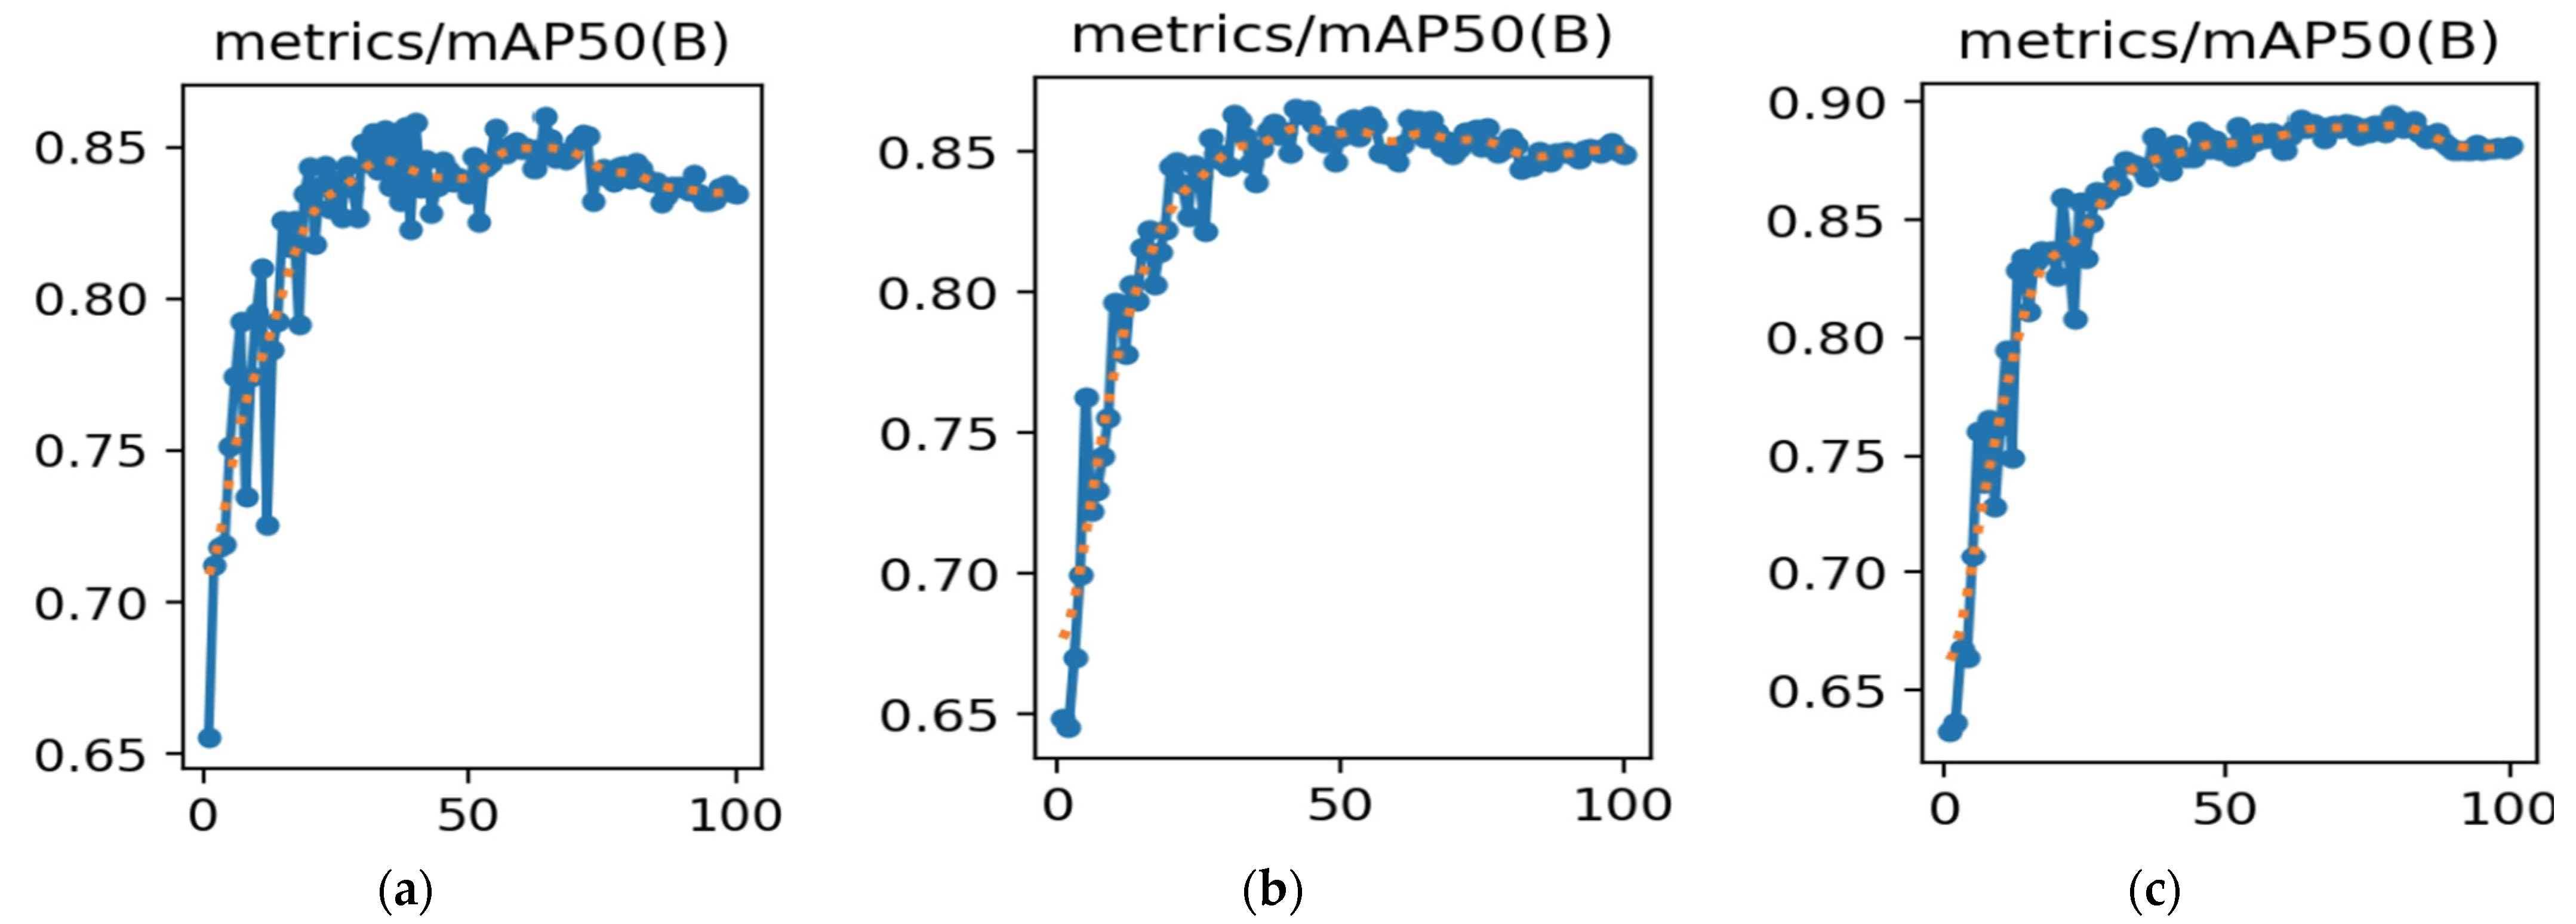
In this study, YOLOv8n, YOLOv11n, and YOLOv12n were trained and evaluated to be employed to detect potholes from camera images. All versions architecture is available in multiple sizes: nano, small, medium, large, and x-large, each offering a trade-off between accuracy and computational demand. Larger models tend to yield higher detection accuracy but require more processing power, which may compromise real-time performance. Since this application focuses solely on detecting potholes and emphasizes real-time performance on embedded hardware, the nano variant was selected because it offers a balanced combination of detection accuracy and high inference speed, making it well-suited for deployment in real-time pavement inspection scenarios.
Data collected was split into 80% for training and 20% for validation. Each image that contained the objects of interest was annotated with a 2D bounding box using the LabelMe version 5.4.1 annotation software.
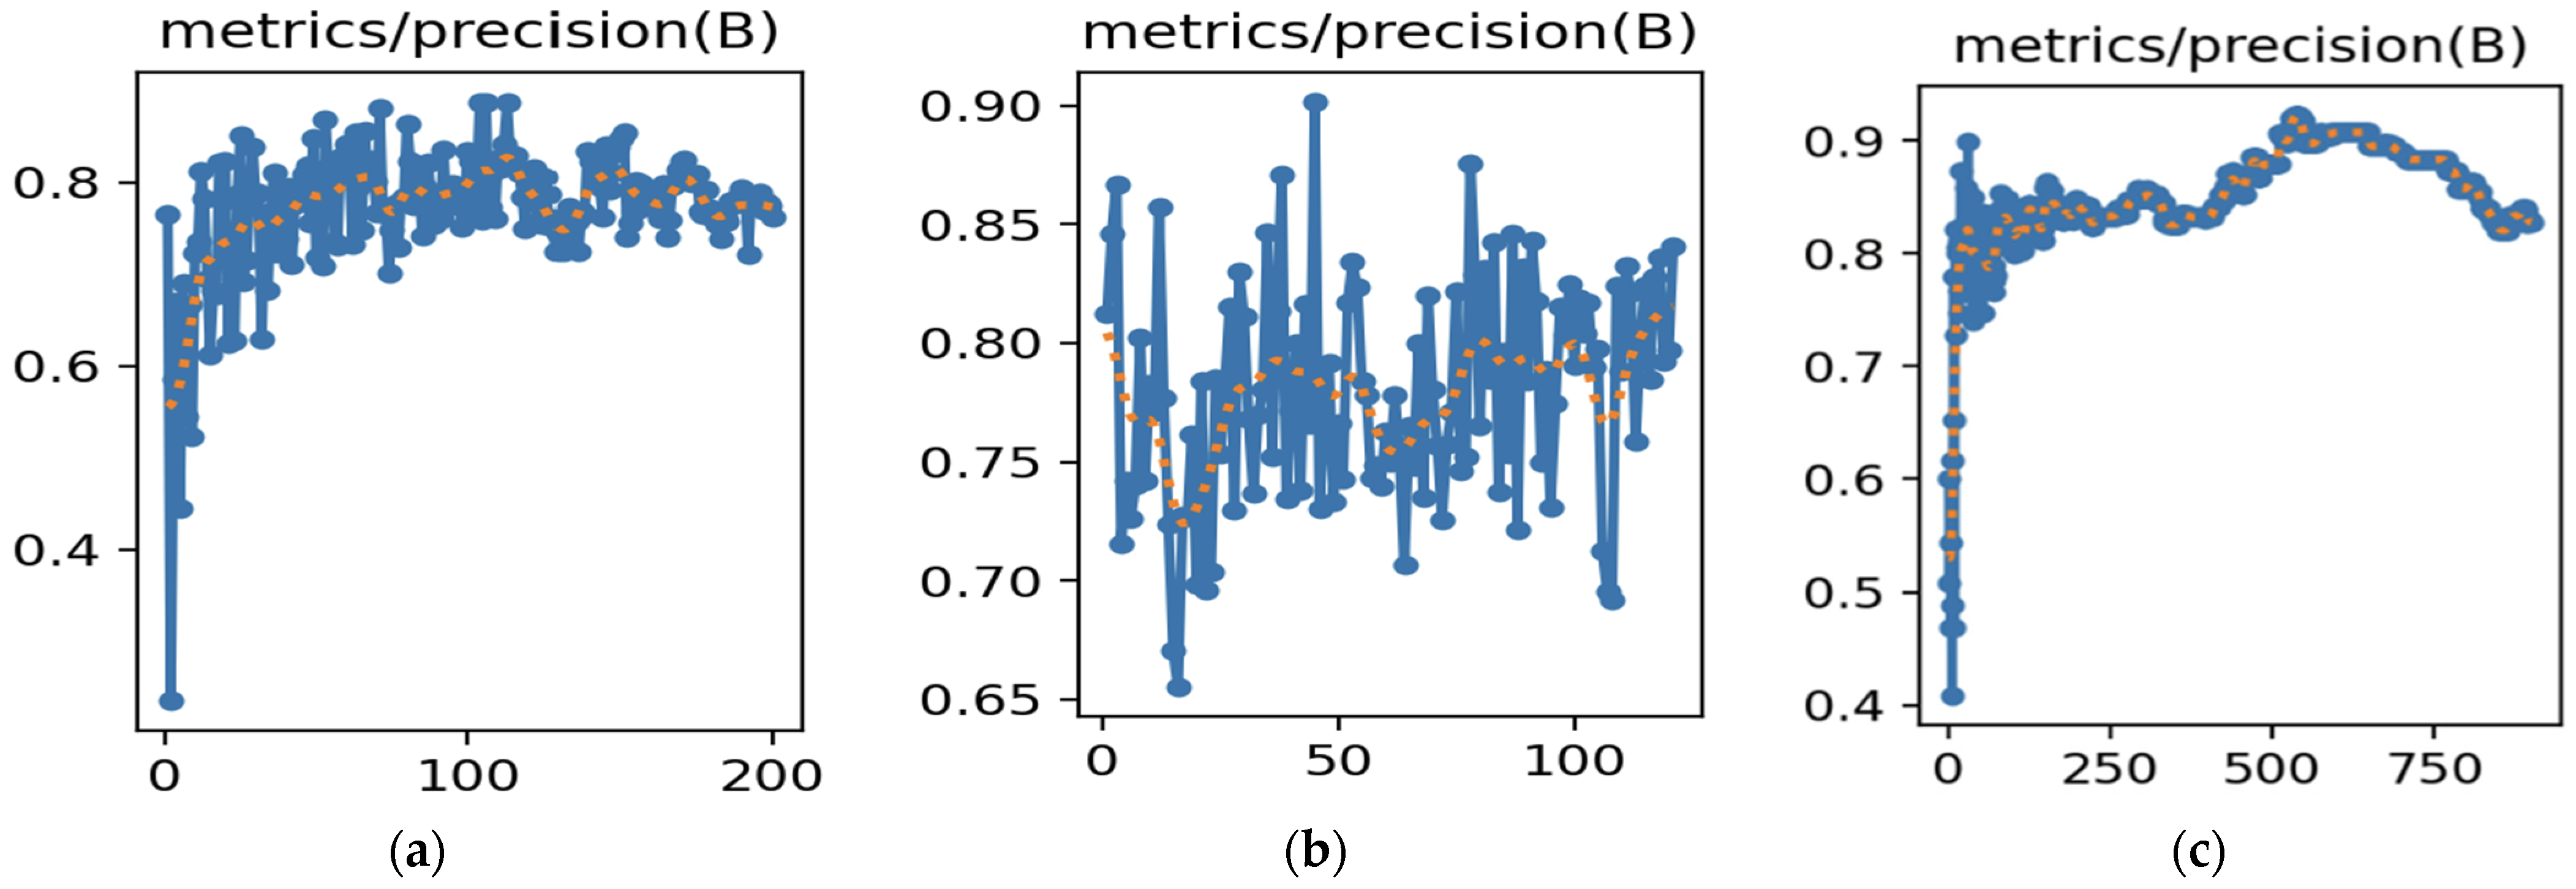
The evaluation metrics chosen for assessing model performance are precision and recall. Precision evaluates the model’s ability to correctly identify potholes while minimizing false positives (incorrectly classifying non-potholes as potholes). Precision can be calculated using the following equation:
where
True Positives (TP) are the number of instances that are correctly classified as positive by the model.
False Positives (FP) are the number of instances that are incorrectly classified as positive by the model.
On the other hand, the recall metric indicates the model’s ability to identify all relevant instances in a dataset. It is calculated using the following equation:
where
During training and evaluation, it was observed that the model struggled with false positives, particularly due to the challenging front-facing perspective of potholes from the vehicle’s viewpoint. To address this limitation, several solutions were explored and detailed in the following sections.
3.3.1. Training the Model on Different Classes
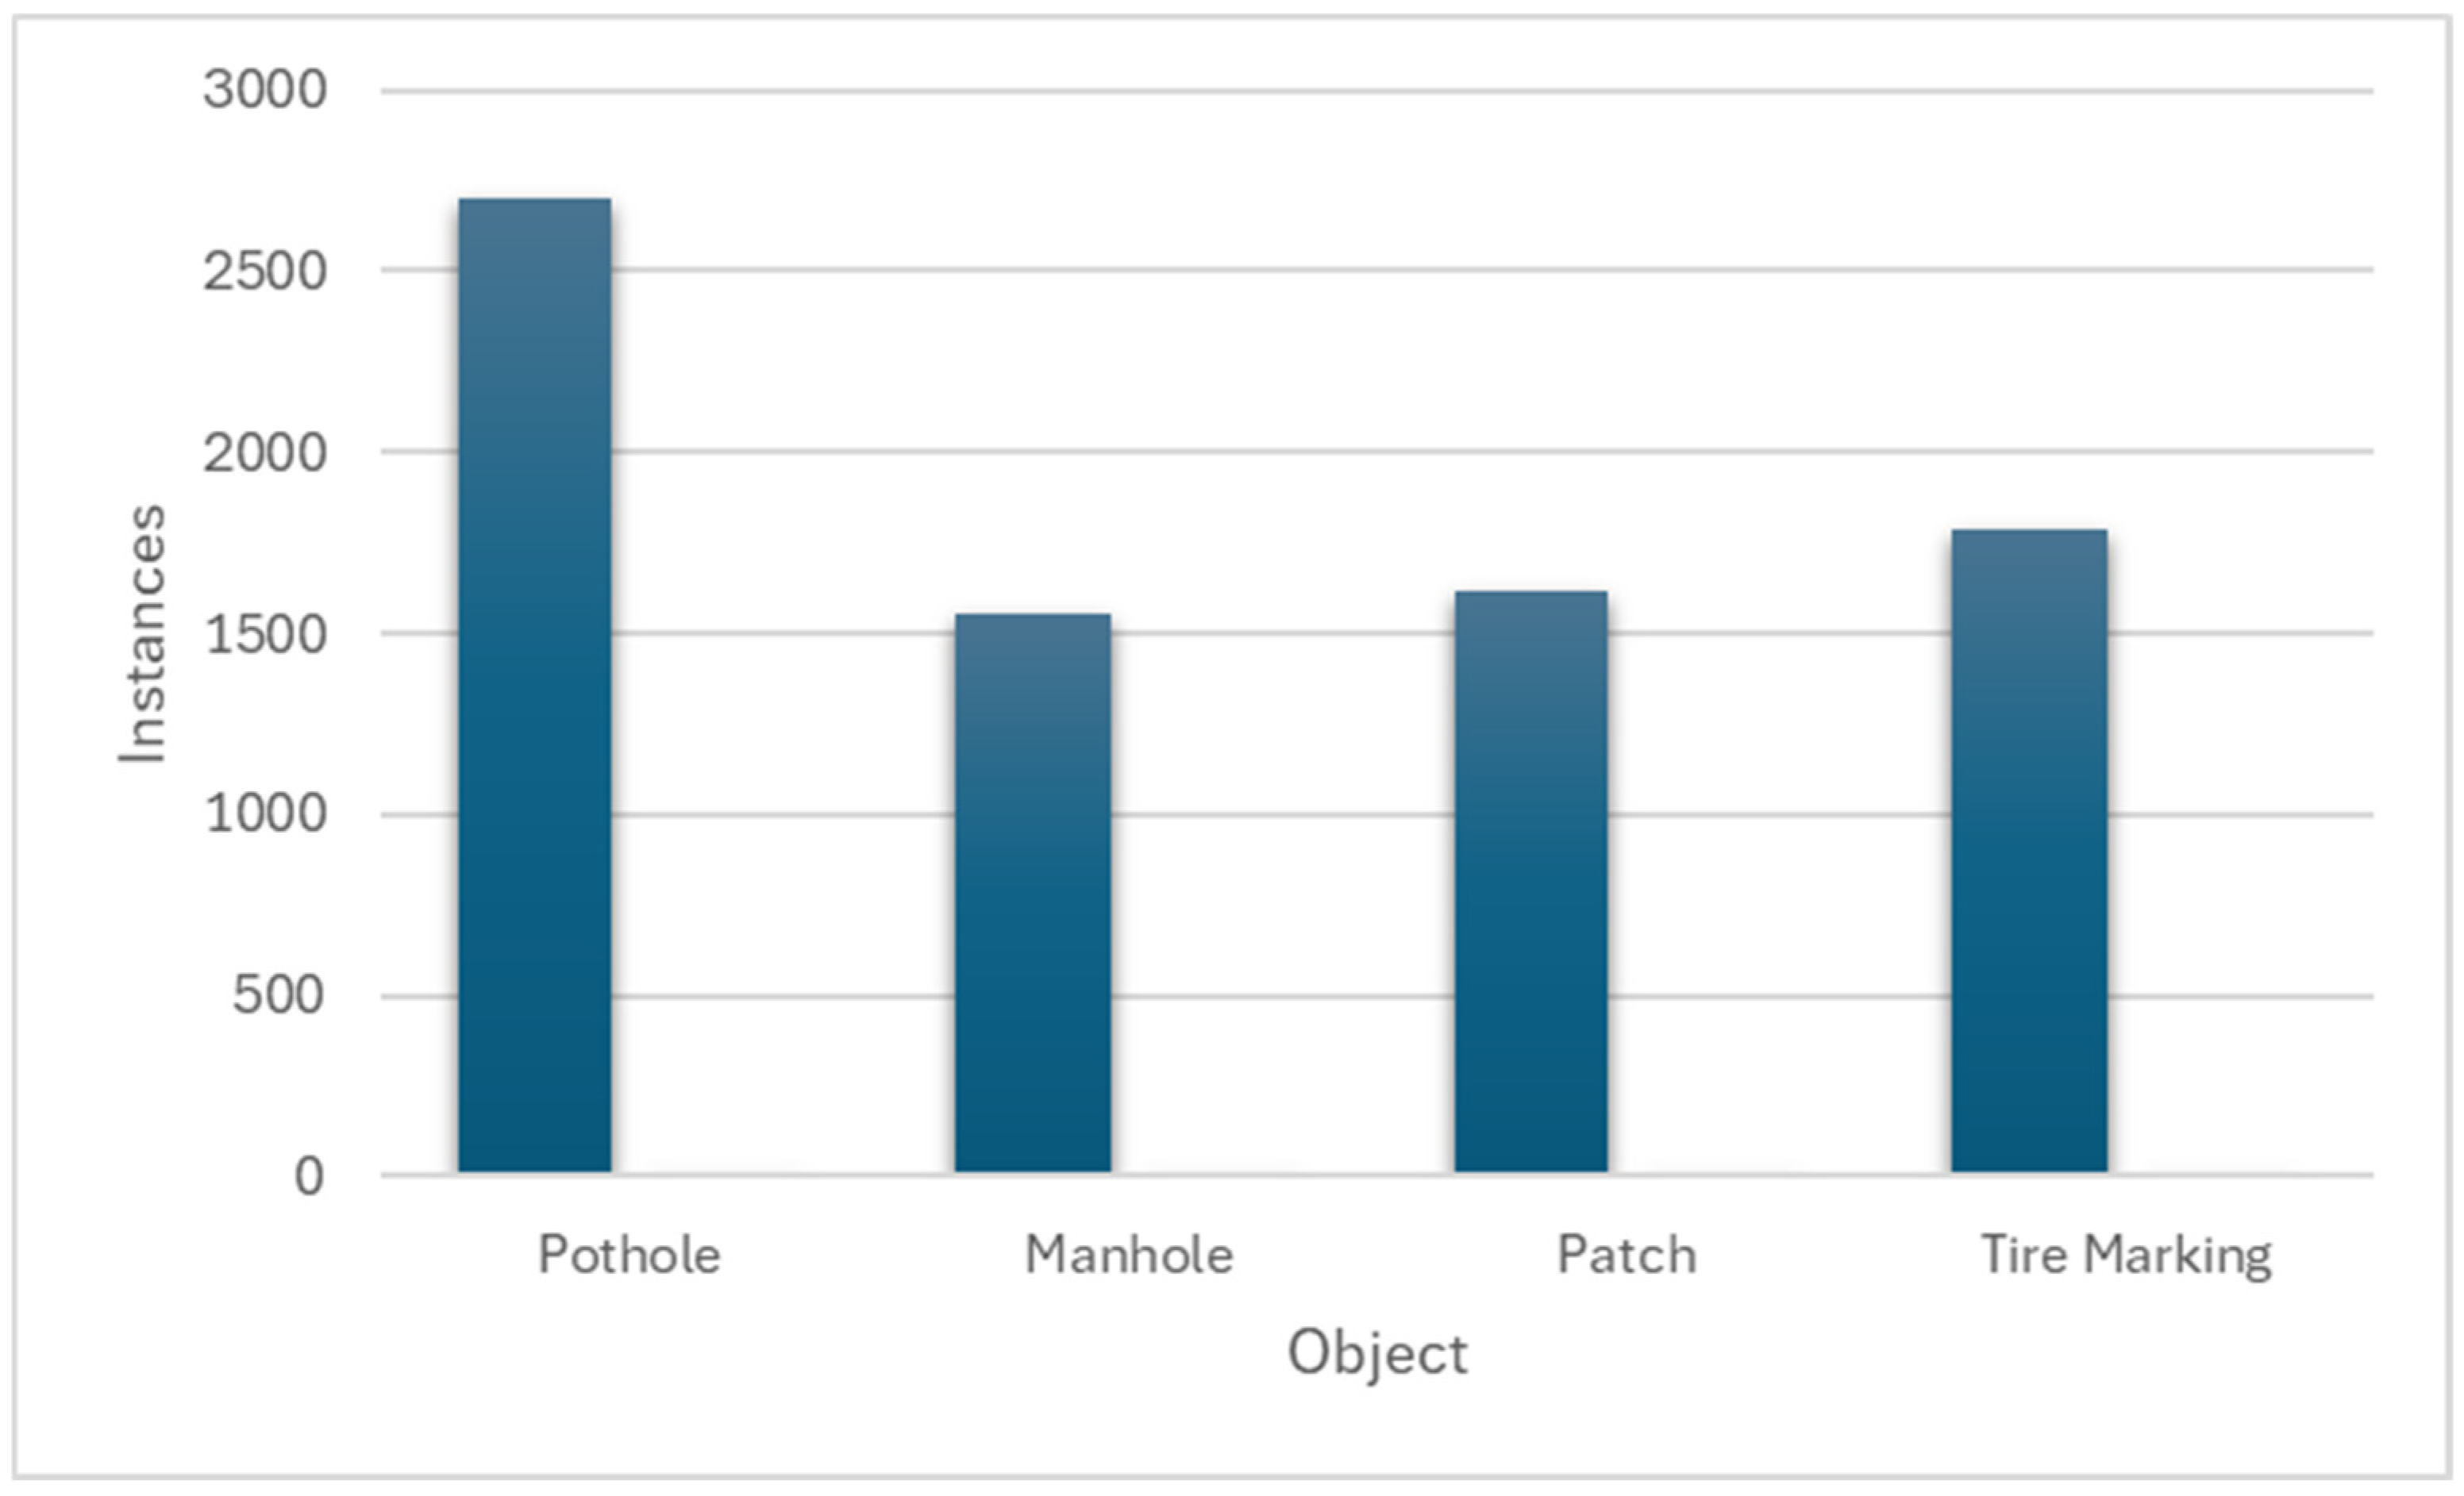
The model frequently misclassified various objects, such as manhole covers, tire markings, pavement sealing, patches, and other random artifacts, as potholes. To address this issue and enhance the model’s precision, the dataset annotations were expanded to include four distinct classes: potholes, patches, manhole covers, and tire markings. Those objects were chosen since they can be distinguished clearly from the images and have a consistent pattern. Nevertheless, due to the irregular and unpredictable nature of pavement sealing patterns and miscellaneous objects, consistent annotation was not feasible. Therefore, an alternative approach was employed to mitigate their impact on detection performance.
3.3.2. Adding Background Images
Several studies [
3,
13] recommend that background images, images that do not contain any objects of interest, should comprise approximately 10% of the total dataset. This inclusion is intended to help the model distinguish between meaningful objects and irrelevant content, thereby reducing the likelihood of false positives. However, the standard 10% background image ratio proved to be insufficient in the pothole detection scenario. This limitation became particularly evident due to the challenging nature of pothole detection, which often involves subtle surface variations and inconsistent lighting conditions.
To address this issue more effectively, we adopted a targeted approach by introducing selective background images. Instead of using arbitrary background images, we carefully curated images that had previously caused the model to trigger false positive detections during earlier rounds of inference. These selectively chosen backgrounds provided more realistic and challenging negative examples for the model to learn from.
To understand the impact of different background image ratios on model performance, various proportions of selective backgrounds were evaluated, specifically 10, 30, and 50% of the total training dataset. For each configuration, the model was retrained, and evaluated the outcomes were evaluated using the standard performance metrics previously discussed, such as precision, recall, and F1-score. This approach supported the assessment of whether increasing the presence of challenging negative examples could enhance the model’s ability to differentiate potholes from look-alike objects and reduce the false positive rate.
3.3.3. Two-Step Solution with an AI Image Classifier
To further address the persistent misclassification problem, an additional verification system was introduced. YOLOvn_cls classifier was introduced as a secondary filtering step. The model is built upon the YOLO architecture but repurposed as a multi-class image classifier. This model was explicitly trained to distinguish between four categories: potholes, manhole covers, surface patches, and tire markings. These categories were chosen based on an analysis of the most common sources of false positives identified during model inference.
The integration of the classifier into the detection pipeline serves as a filtering step. After the primary object detection model identified potential potholes, each detected region was cropped and subsequently passed through the classifier. A detection was only retained and labeled as a pothole if the classifier also confirmed it as such with high confidence. If the classifier assigned the region to one of the other three categories, it was discarded as a false positive.
The classifier was trained using a balanced dataset composed of cropped image samples representing each class, with careful attention given to ensuring variability in lighting, texture, and angle to encourage robust generalization. Once trained, the classifier’s performance was thoroughly evaluated using the same set of performance metrics adopted in earlier stages. These evaluations were conducted on a hold-out validation set specifically curated to include challenging and ambiguous samples to test the classifier’s robustness under realistic conditions.
3.3.4. Data Augmentation and Data Collection Under Various Weather Conditions
To enhance the model’s generalization capabilities and improve performance under diverse real-world conditions, a variety of augmentation techniques were applied specifically to the pothole images. These augmentations included random rotations, horizontal flipping (mirroring), as well as modifications to brightness and contrast levels to simulate different lighting environments. The purpose of these transformations was to expose the model to a wider range of visual variations, helping it become more resilient to changes in orientation, lighting, and appearance of potholes during inference. In addition, the potholes data collection was conducted in different weather conditions to provide the model with real-life examples of lighting conditions that might not be created through the augmentation techniques.
3.3.5. Limiting Detection Range
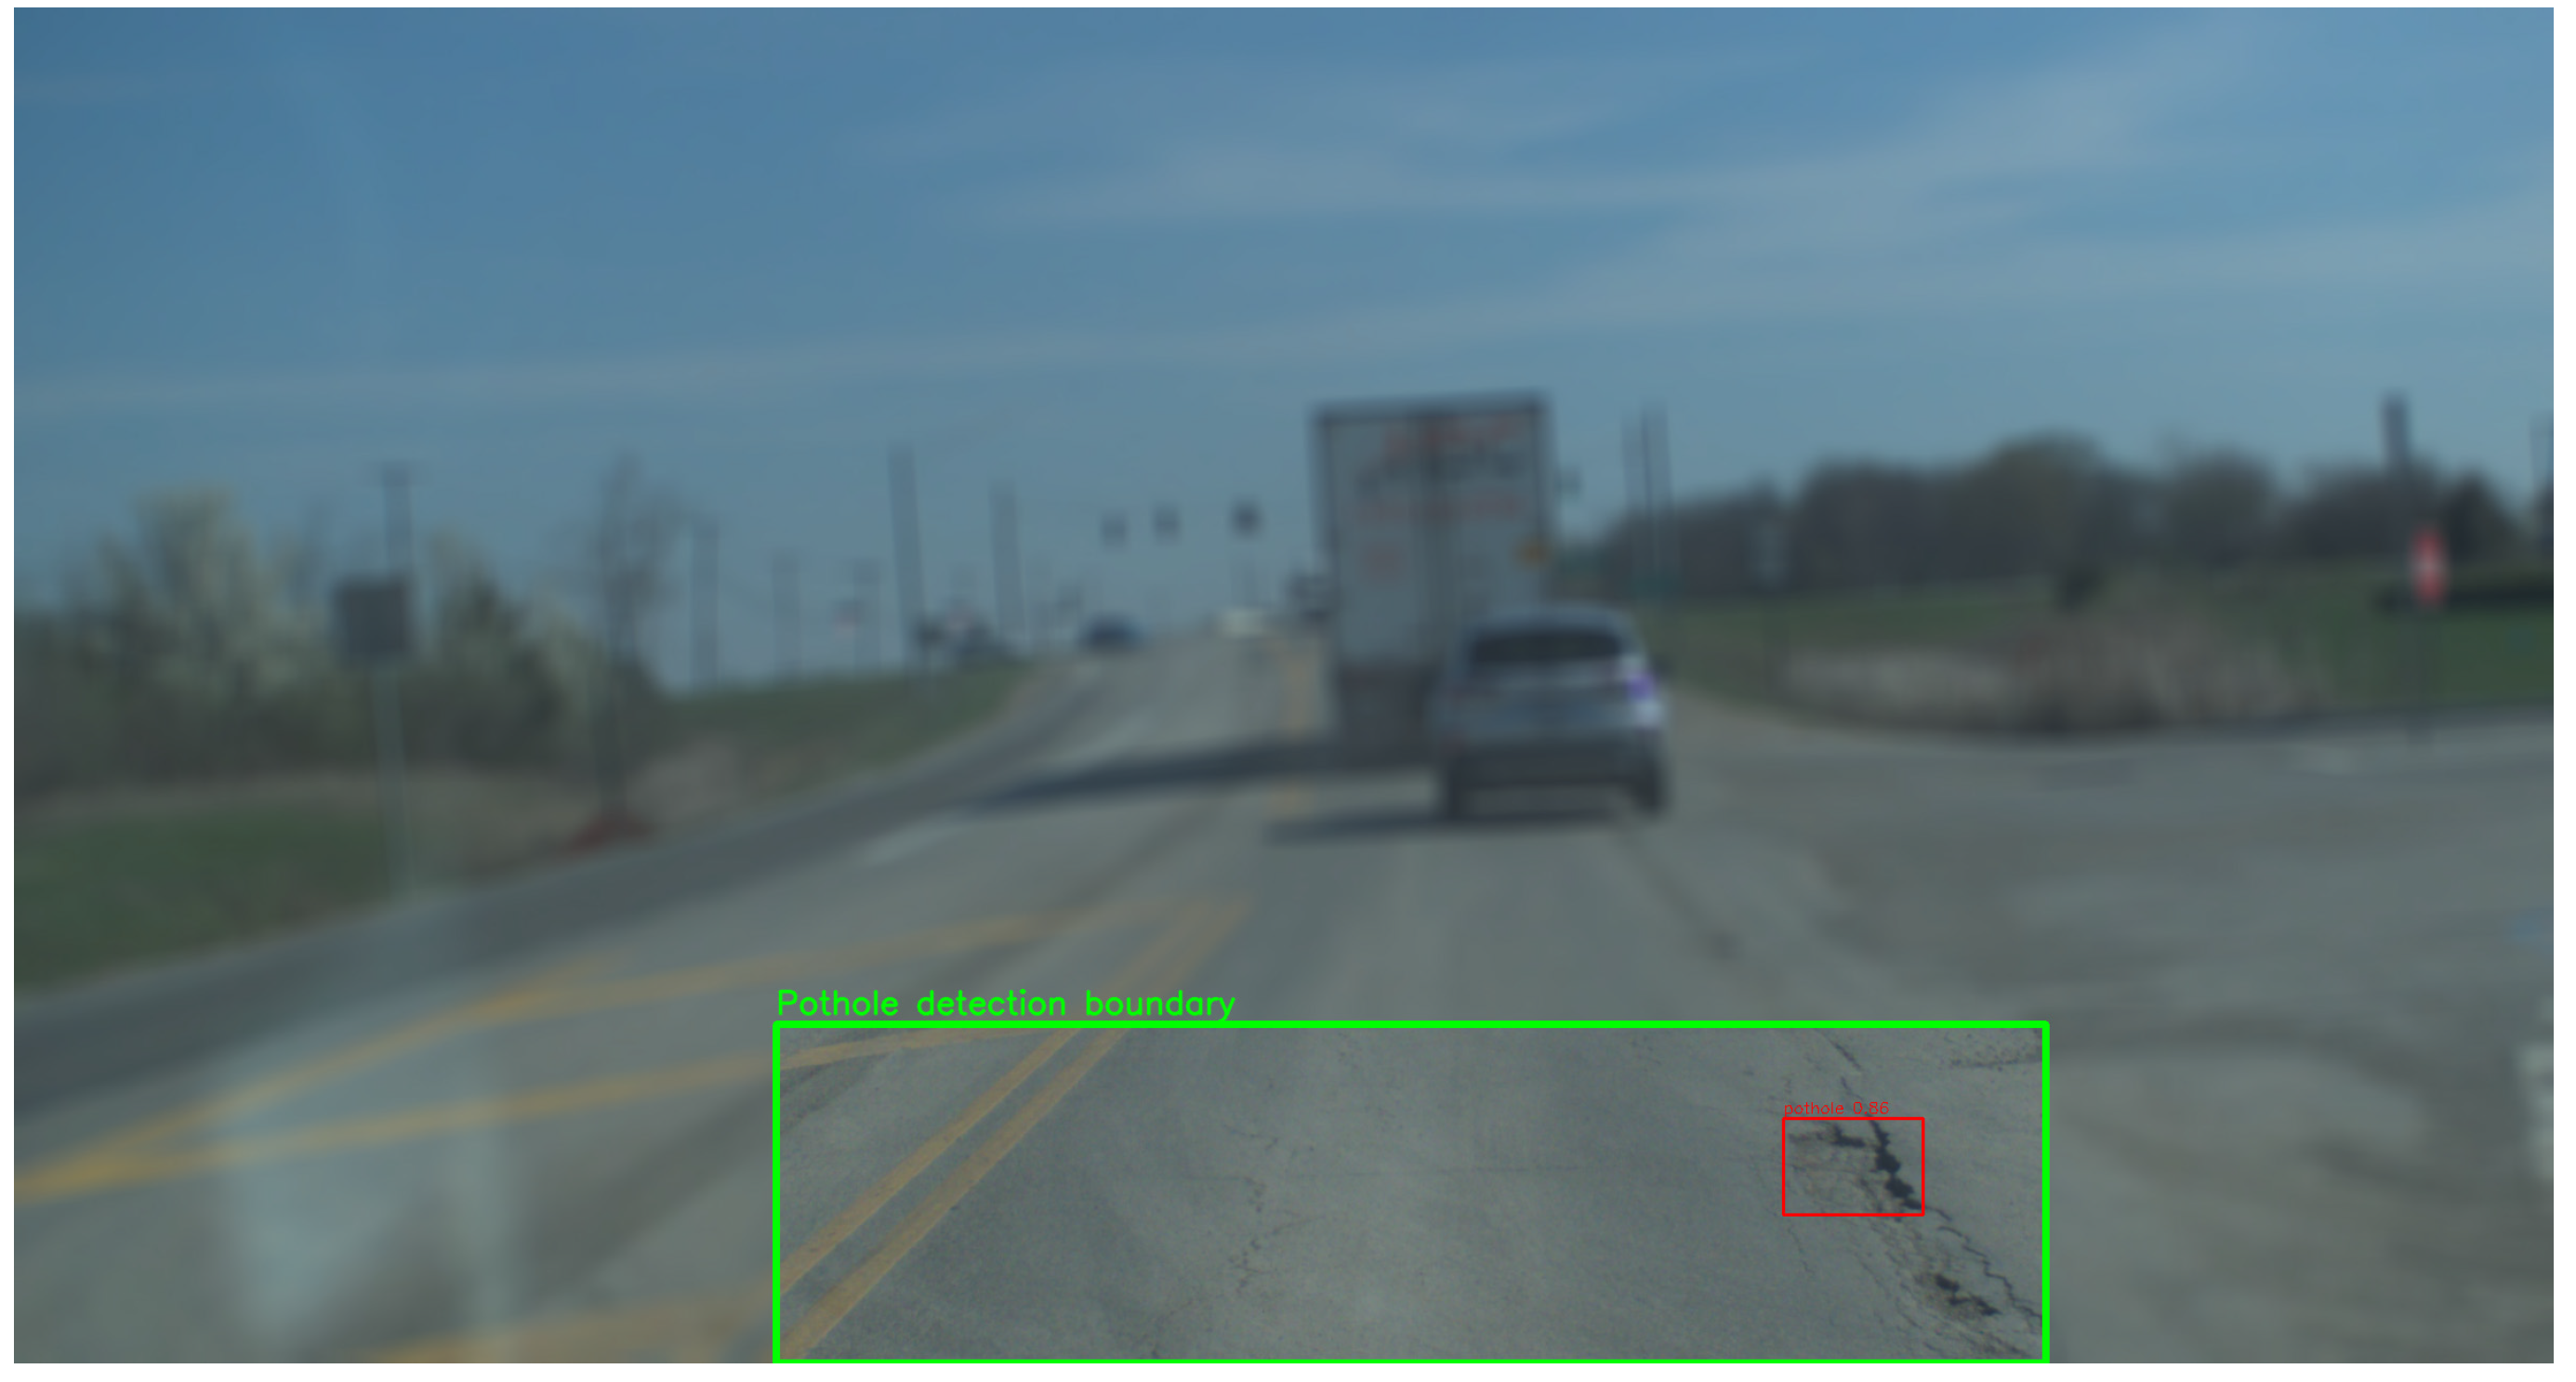
Since the front-facing dashcam captures a narrow field of view directly ahead of the vehicle, it was observed that the model’s performance tended to degrade with increasing distance from the camera. Specifically, objects located farther away appeared smaller and less detailed, which made accurate detection more difficult. This limitation often resulted in a higher number of false positives, particularly for distant features that resemble potholes in shape or texture.
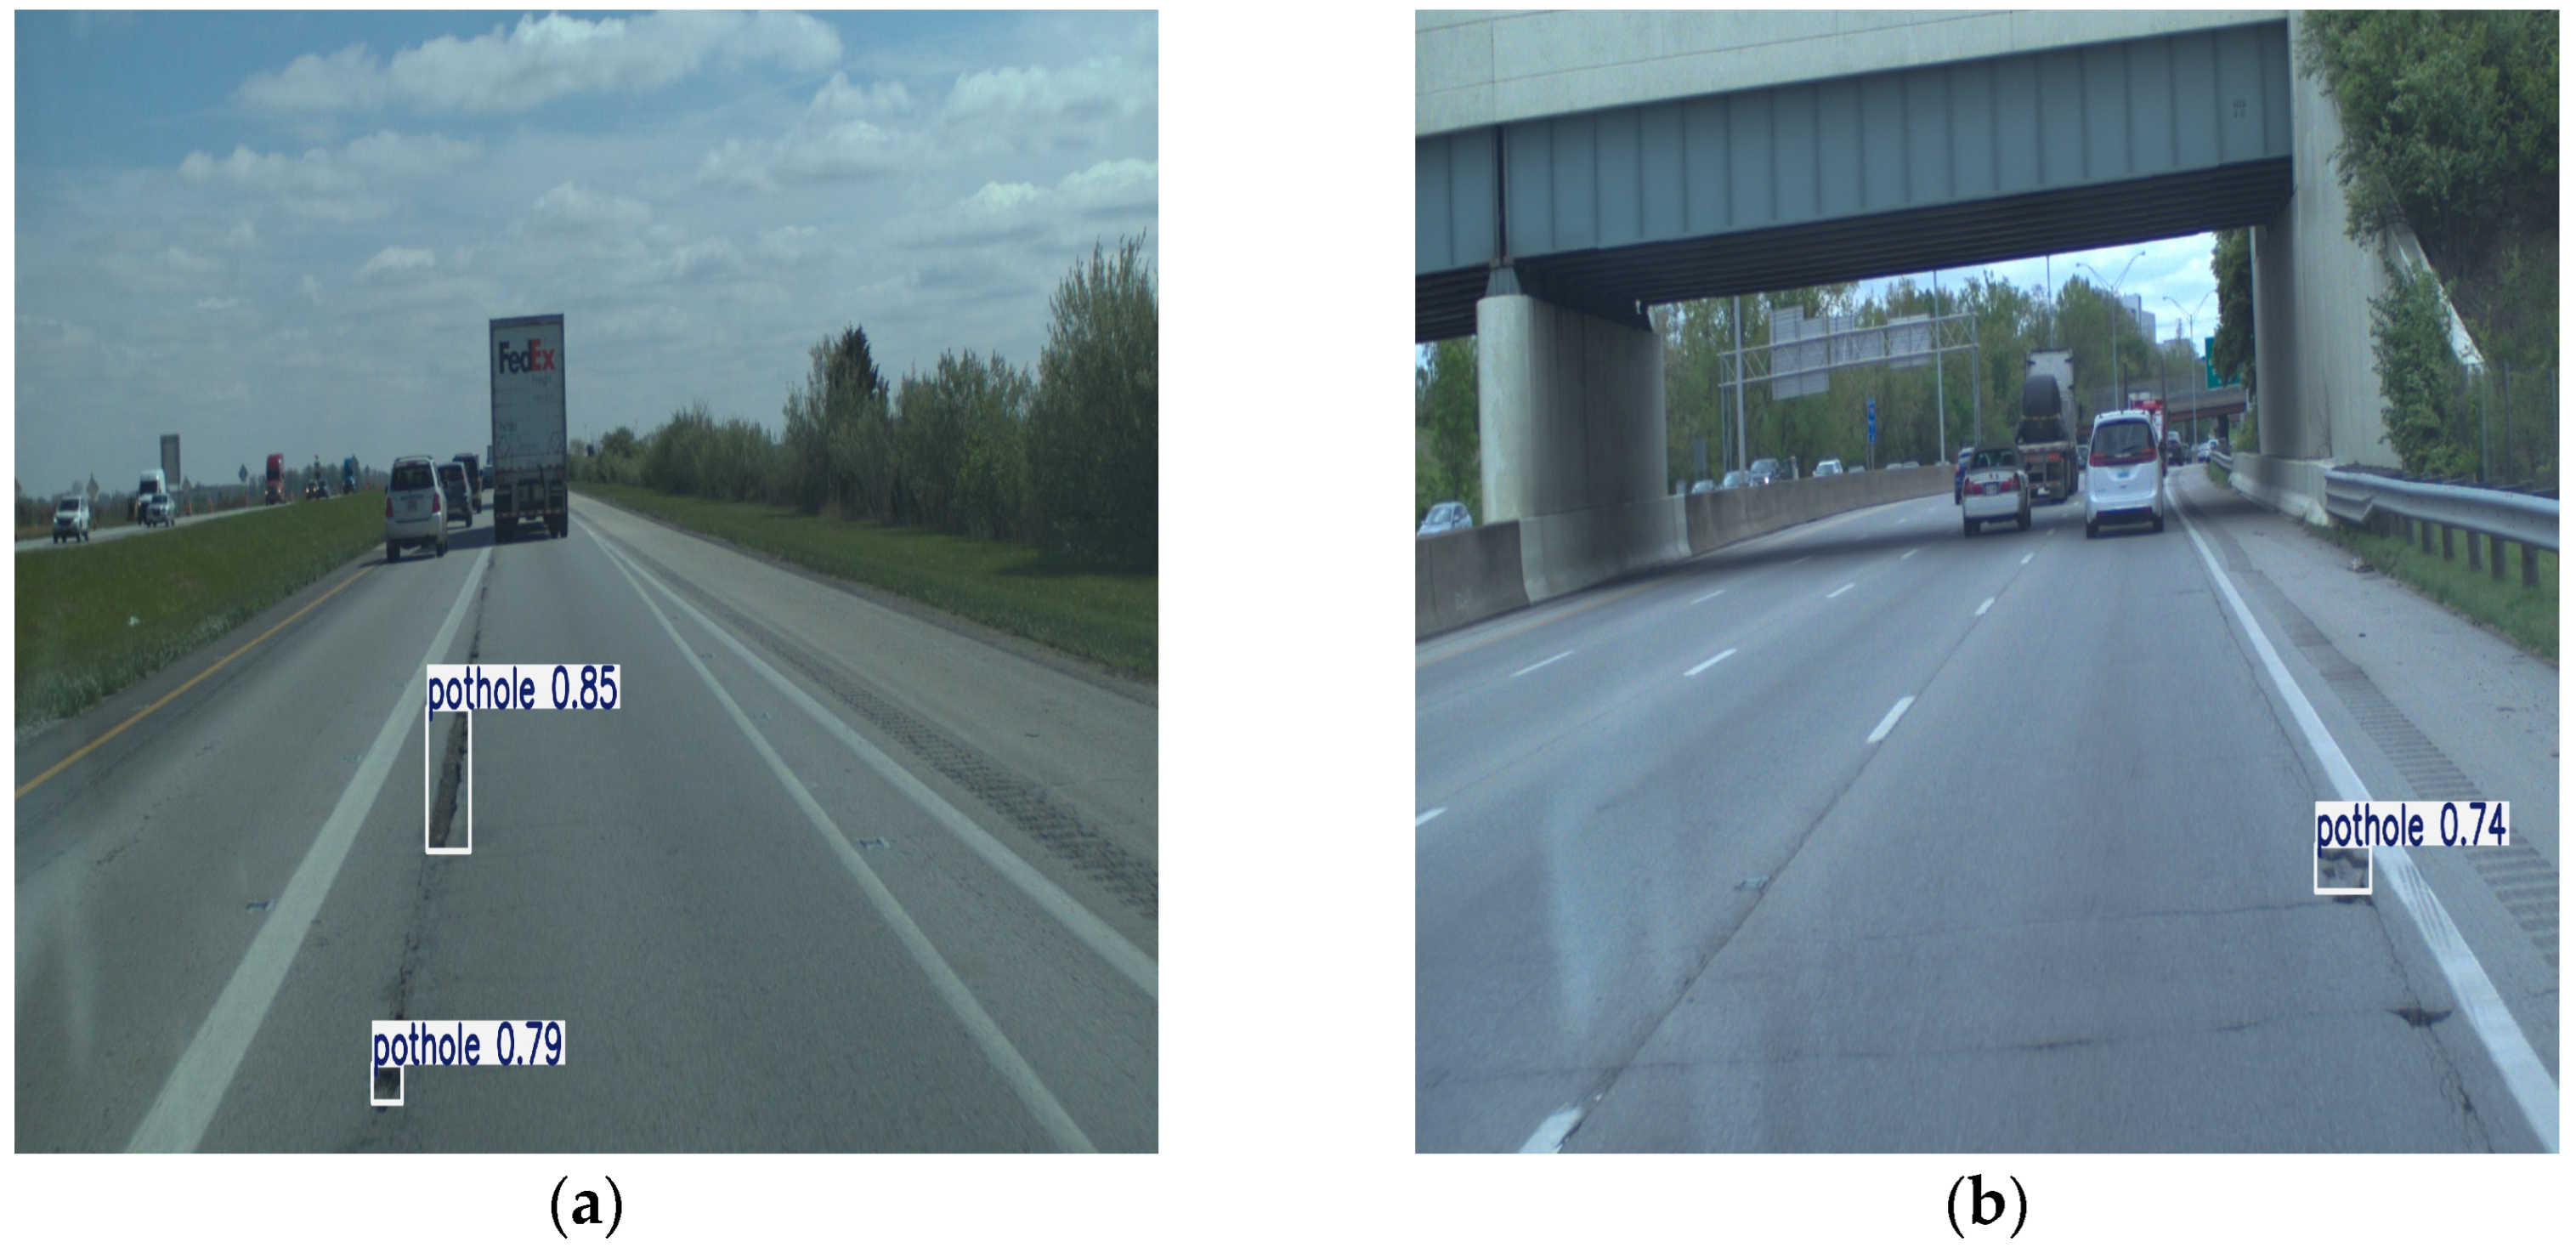
To mitigate this issue, a distance-based filtration step was introduced into the detection pipeline. This filter automatically discards any pothole detections located approximately 3 m from the front of the vehicle. The threshold was selected based on empirical observations and performance analysis during testing. By focusing on the near-field region, where the camera provides more detail and the detections are more reliable, the algorithm was able to significantly reduce false positives without compromising detection of critical road defects. This filtering approach is visually illustrated in
Figure 3, which shows how detections outside the defined range are excluded from the final output.
3.4. Output Postprocessing
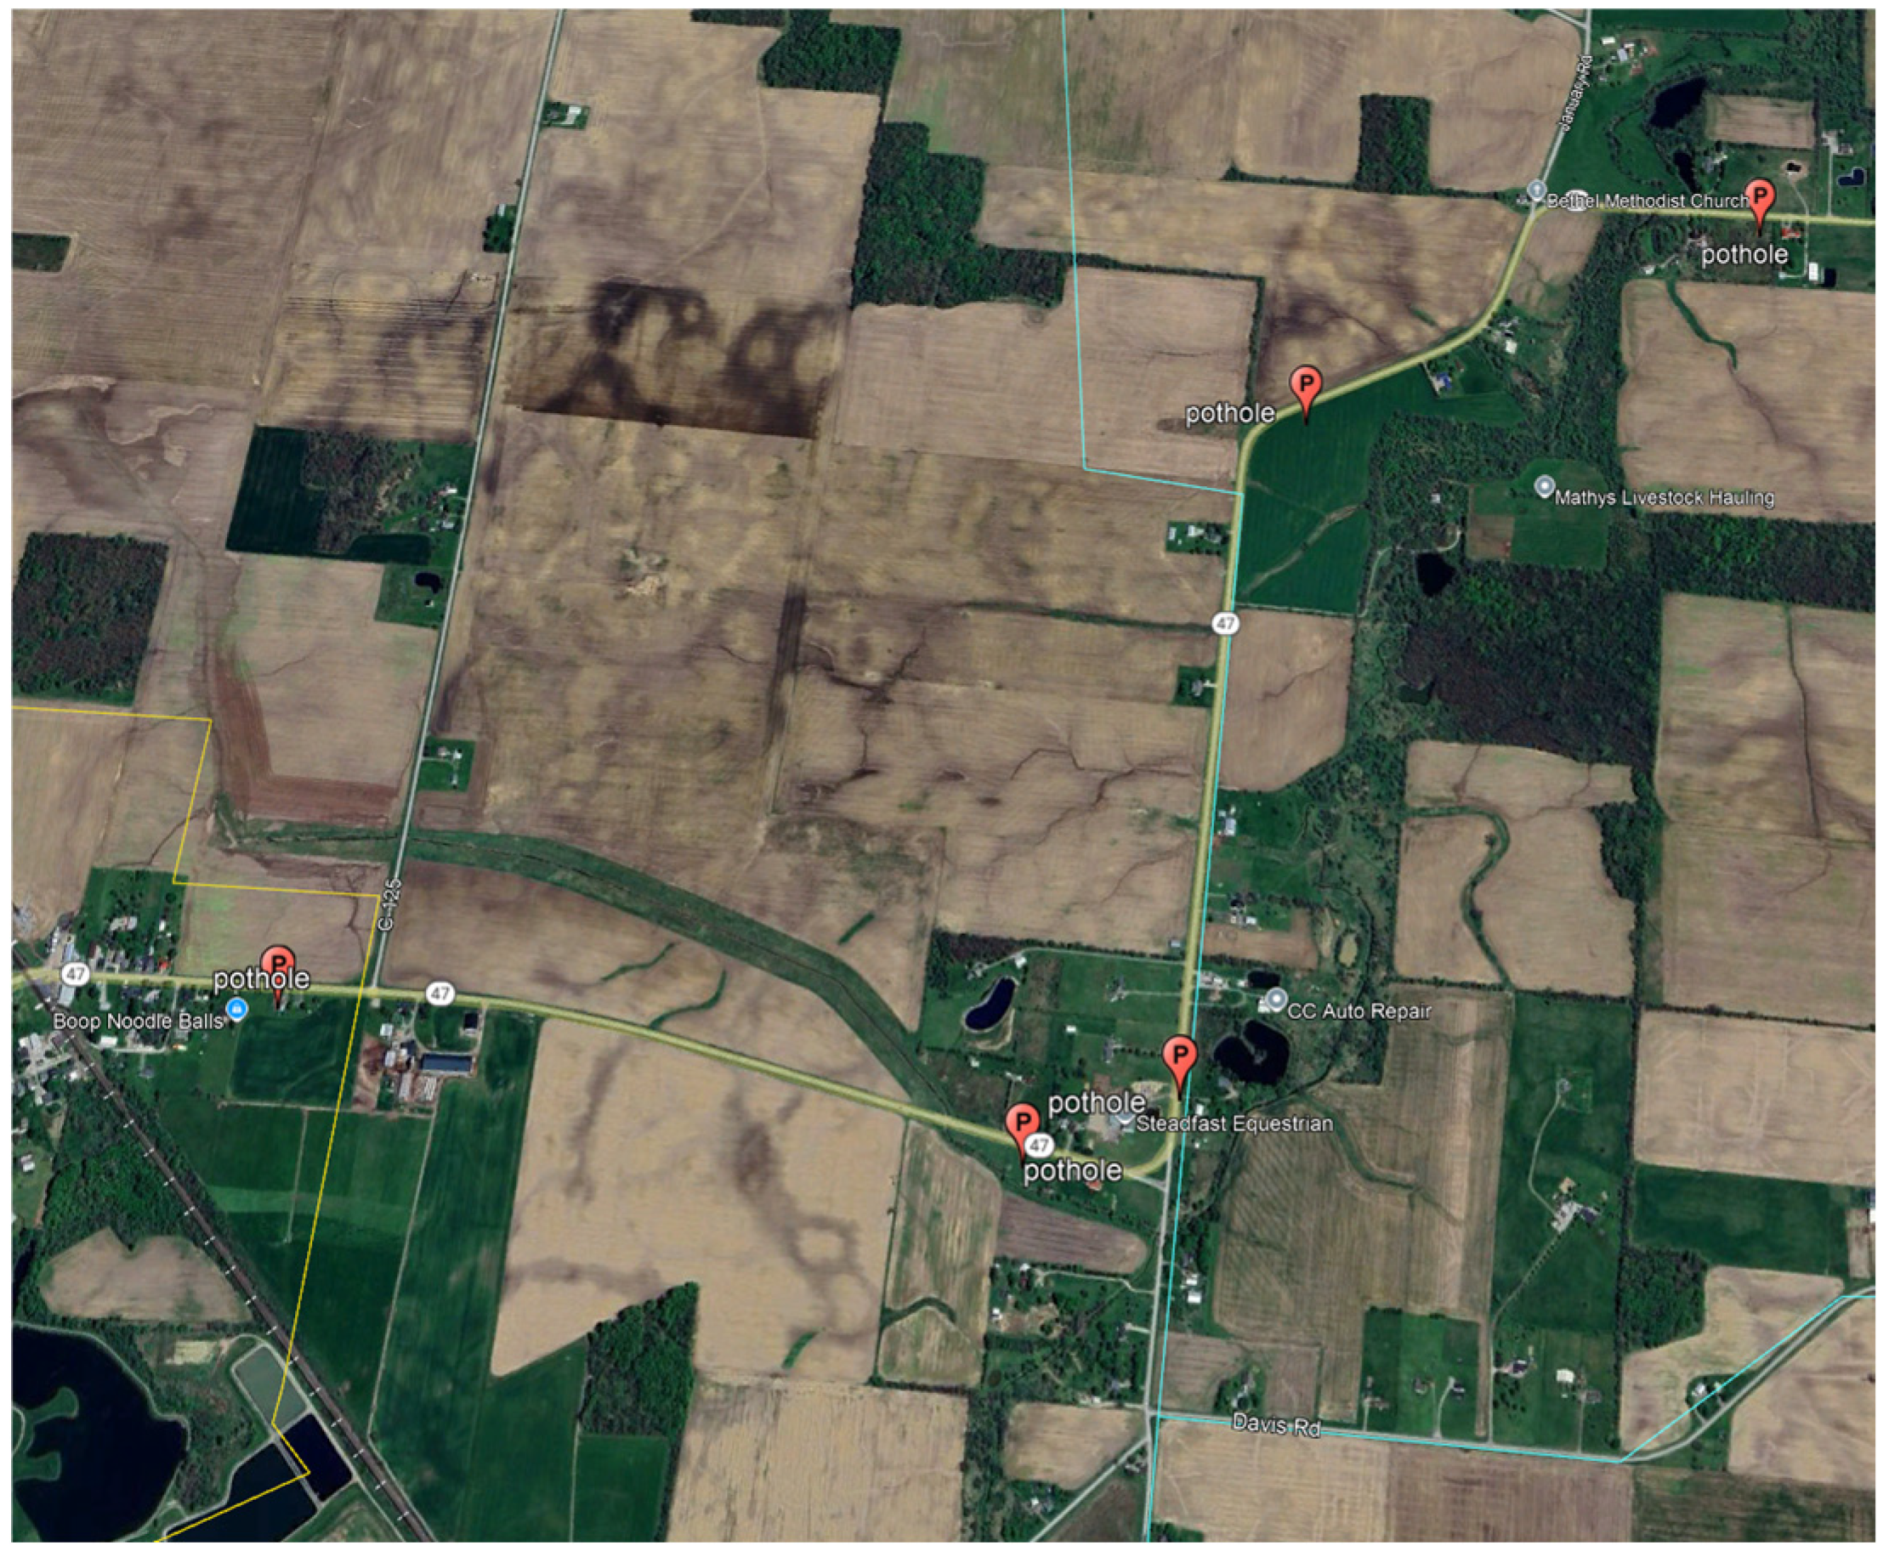
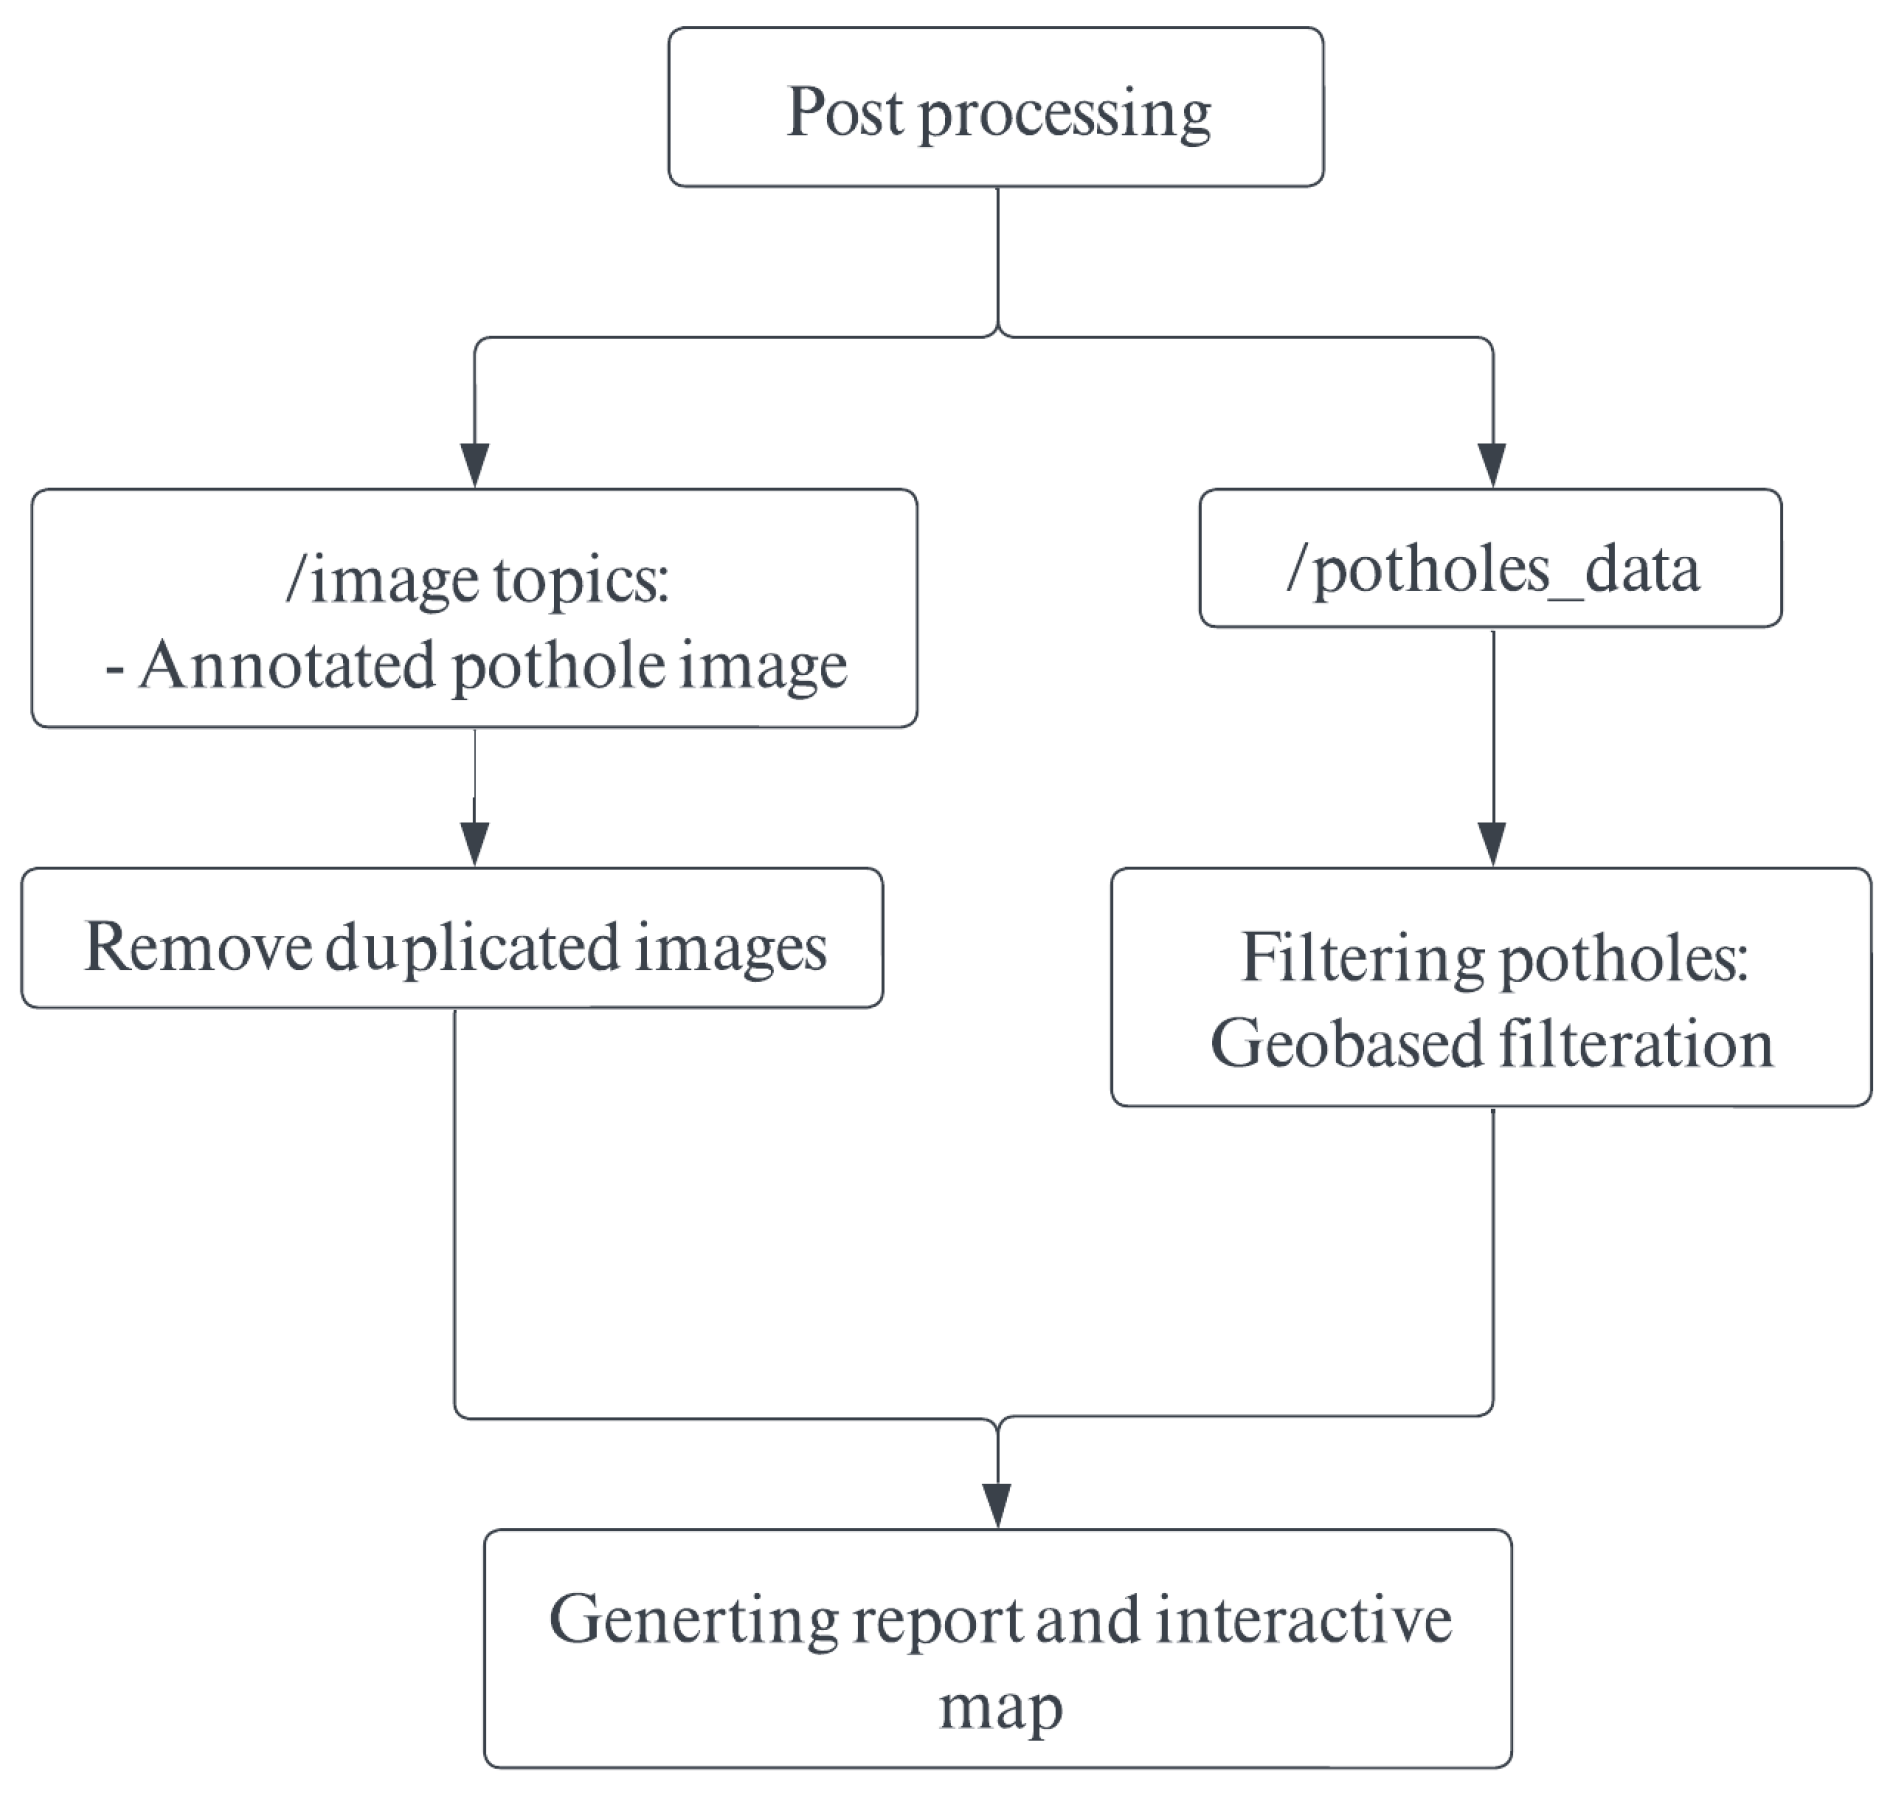
As described in the algorithm overview, once a pothole is detected in an image, both the annotated image and corresponding pothole metadata are published and stored in a ROS bag. Before generating final reports, two critical post-processing steps were required: (1) removing duplicate pothole detections using geolocation-based filtering, and (2) generating a CSV report and interactive map for agency use.
To eliminate duplicates, we utilized GPS coordinates associated with each detection to filter out redundant detections within a two-meter radius. In cases where consecutive images contained overlapping detections, the image with the greater number of unique potholes was retained for reporting. For the second task, pandas and simpleKML libraries were utilized in Python to generate both a CSV report and an interactive map, as illustrated in
Figure 4 and
Table 1. These outputs provide a structured summary and visual representation of the detected potholes for agency review.
The post-processing workflow is outlined below in
Figure 5.
5. Conclusions
This study introduces a practical AI-based algorithm that validates the integration of an ADAS-like camera with a GNSS receiver and state-of-the-art AI models to enable real-time pothole detection and avoidance in autonomous vehicles. The algorithm also supports a crowdsourced data collection approach, allowing transportation agencies to gather accurate pothole location data from vehicles and improve maintenance planning.
Multiple state-of-the-art YOLO models were tested, specifically the nano variant of versions 8.11, and the most recent YOLOv12 model. YOLOv12 showed the best results compared to older versions, with a mean average precision of 89%. But since in this paper we are trying to validate the integration and application of AI in ADAS, we validated the model on multiple miles under variant conditions, which in turn showed a high stable performance in rainy, cloudy, and sunny days. Compared to the cited references, this approach provides a more realistic and validated performance for pothole detection since it does not rely on limited road sections or static validation images. In addition, results show that with the development of machine vision models, a high and stable performance is achievable with balanced data, allowing researchers to start focusing on the potential use cases from the output rather than spending more time collecting more data, trying to stabilize the model’s performance.
Despite the good performance of the algorithm, it still encounters false positives that are triggered by random objects that might appear on roads; for example, the most common false positive triggers are pavement sealing, water pots, tire shreds, and dead animals. Thus, in order to improve the model’s resilience, we recommend that fine-tuning the model by adding those rare cases will help it be more stable and reduce the false positives.
Looking ahead, we are planning to expand our studies to incorporate more data into the model output, such as area and volume, which in turn will help DOTs in the quantification of materials. In addition, since the algorithm was able to detect and produce data in real-time, we are planning to investigate the possibility of using this data to (1) inform other vehicles using vehicle-to-vehicle communication about pothole locations to take corresponding action before hitting a pothole, (2) allow vehicles to avoid potholes on the lane through their ADAS camera.
Finally, this AI-driven approach holds significant potential for enhancing infrastructure resilience and supporting transportation agencies in delivering timely and cost-effective maintenance. Moreover, it supports the overarching goal of ensuring autonomous vehicles are safely and reliably deployed in real-world environments. In addition, the algorithm can be deployed in passenger vehicles, enabling an efficient crowdsourcing mechanism for pothole data collection across diverse road networks.
